Article

Spatiotemporal Dynamics of Green Spaces in the Beijing–Tianjin–Hebei Region in the Past 20 Years

1
Land Consolidation and Rehabilitation Center, Ministry of Land and Resources, Beijing 100035, China
2
Key Laboratory of Agricultural Land Qulity, Ministry of Land and Resources, Beijing 100035, China
3
College of Horticulture & Forestry Sciences, Huazhong Agricultural University, Wuhan 430070, China
*
Author to whom correspondence should be addressed.
Sustainability 2018, 10(8), 2949; https://doi.org/10.3390/su10082949
Submission received: 19 July 2018 / Revised: 8 August 2018 / Accepted: 17 August 2018 / Published: 20 August 2018
(This article belongs to the Special Issue Land-Use Competition)

Abstract

:
Rapid urbanization has caused the reduction of green spaces in most cities, disrupting the structure and process of urban and rural ecosystems. The accurate identification of spatiotemporal changes in green spaces is important to delineate future management and planning. We investigated green space types of the Beijing–Tianjin–Hebei region in 1995, 2000, 2005, 2010, and 2015 based on the elevation data and land use/cover for those years. Spatiotemporal changes in these identified green spaces between 1995 and 2015 were evaluated as well as the spatial hotspots of disappeared and unstable green patches. The results indicate that the cultivated land in plains and forests and cultivated land in medium-high mountainous areas were the main green space types in the Beijing–Tianjin–Hebei region during the period from 1995 to 2015. A large number of green spaces, in particular cultivated lands, in the peripheral areas of big cities were replaced by construction sites over the past 20 years. Hotspots of unstable green spaces were mainly distributed in the western and northern mountainous areas of the Beijing–Tianjin–Hebei region, where green spaces changed from one type to another. These findings provide an important reference for the management and planning of land and green spaces towards an integrative and collaborative development of the Beijing-Tianjin-Hebei region.

1. Introduction

The ongoing rapid urbanization has caused ecological and environmental problems in most cities in recent decades, such as increasing the risks of floods, air pollution, and biodiversity decline [1,2]. Most of these problems are associated with the decreased amount of green spaces [3,4]. Green spaces such as cropland and woodlands can be defined as a land surface layer mainly covered with vegetation, including various combinations of natural and semi-natural areas. Studies have shown that green spaces play an important role in purifying air, regulating climate, reducing noise, biodiversity conservation, etc. [5,6,7] Particular types of green spaces can offer diverse opportunities for human life [8]. However, the trend of quickly disappearing green spaces has been indicated in most studies due to urbanization [9,10]. The loss of green space has not only changed the coverage pattern of the land surface layer, but also directly deprived the habitats for creatures and degraded ecosystem services [11,12,13,14]. Knowledge of green spaces is essential for maintaining the stable and healthy development of ecosystems.
Land-use/cover change is one of the main factors leading to green space changes [3]; therefore, identifying land-use/cover change over time is important for green space planning and management. Satellite remote sensing techniques and geographical information system (GIS) have been widely applied in recognizing the land-cover changes over time for better management of green space [15,16]. A large number of studies examined the rate of green space change using multitemporal remotely sensed data [17] and showed spatial variation in green space patterns in different cities [18]. Furthermore, land-use transitions among different types were also quantified in the previous studies [19]. These studies quantified the land-use/land-cover changes and their patterns, while few examined the spatial variation in green spaces dominated by topographic features. As the most basic geographical unit element, topography is the three-dimensional representation of a terrain surface, and it restricts the redistribution of materials and energy on the land surface and the land use/cover [20]. The quantification of green space patterns associated with topographic features provides a deep insight to understand green space changes, especially on a regional and national scale.
Similar to most urbanized cities, the Beijing–Tianjin–Hebei (BTH) region in China exhibited tremendous land-use changes during the past few decades, and the regional development has been extremely uneven during the rapid urbanization [21]. Li et al. [22] investigated the spatial–temporal variations in land-use/cover types from 1990 to 2015 and found that the cropland, grassland, and wetland in BTH continuously decreased during the study period. Currently, the BTH region is in an important region of coordinated and integrated development and smart management. The government has implemented several greening policies to improve the ecosystem services in the BTH region, such as the Grain for Green Project. Therefore, the area, quality, and spatial distribution of green space in the BTH region have changed in the recent decades. Accurately examining the spatial–temporal process of green space changes is important for land use planning and management of the BTH region. Particularly, it is urgent and necessary for the sustained development and management of the BTH region to explore the hotspot areas of disappeared green spaces and the unstable area during the last 20 years.
Against this background, the main purposes of this study were to: (1) Identify and categorize the green spaces in the BTH region and their topographic properties, (2) explore how the green space changed during the last 20 years, and (3) examine the location of the disappeared and unstable intensity of the green space in the study area.

2. Research Area Overview and Methods

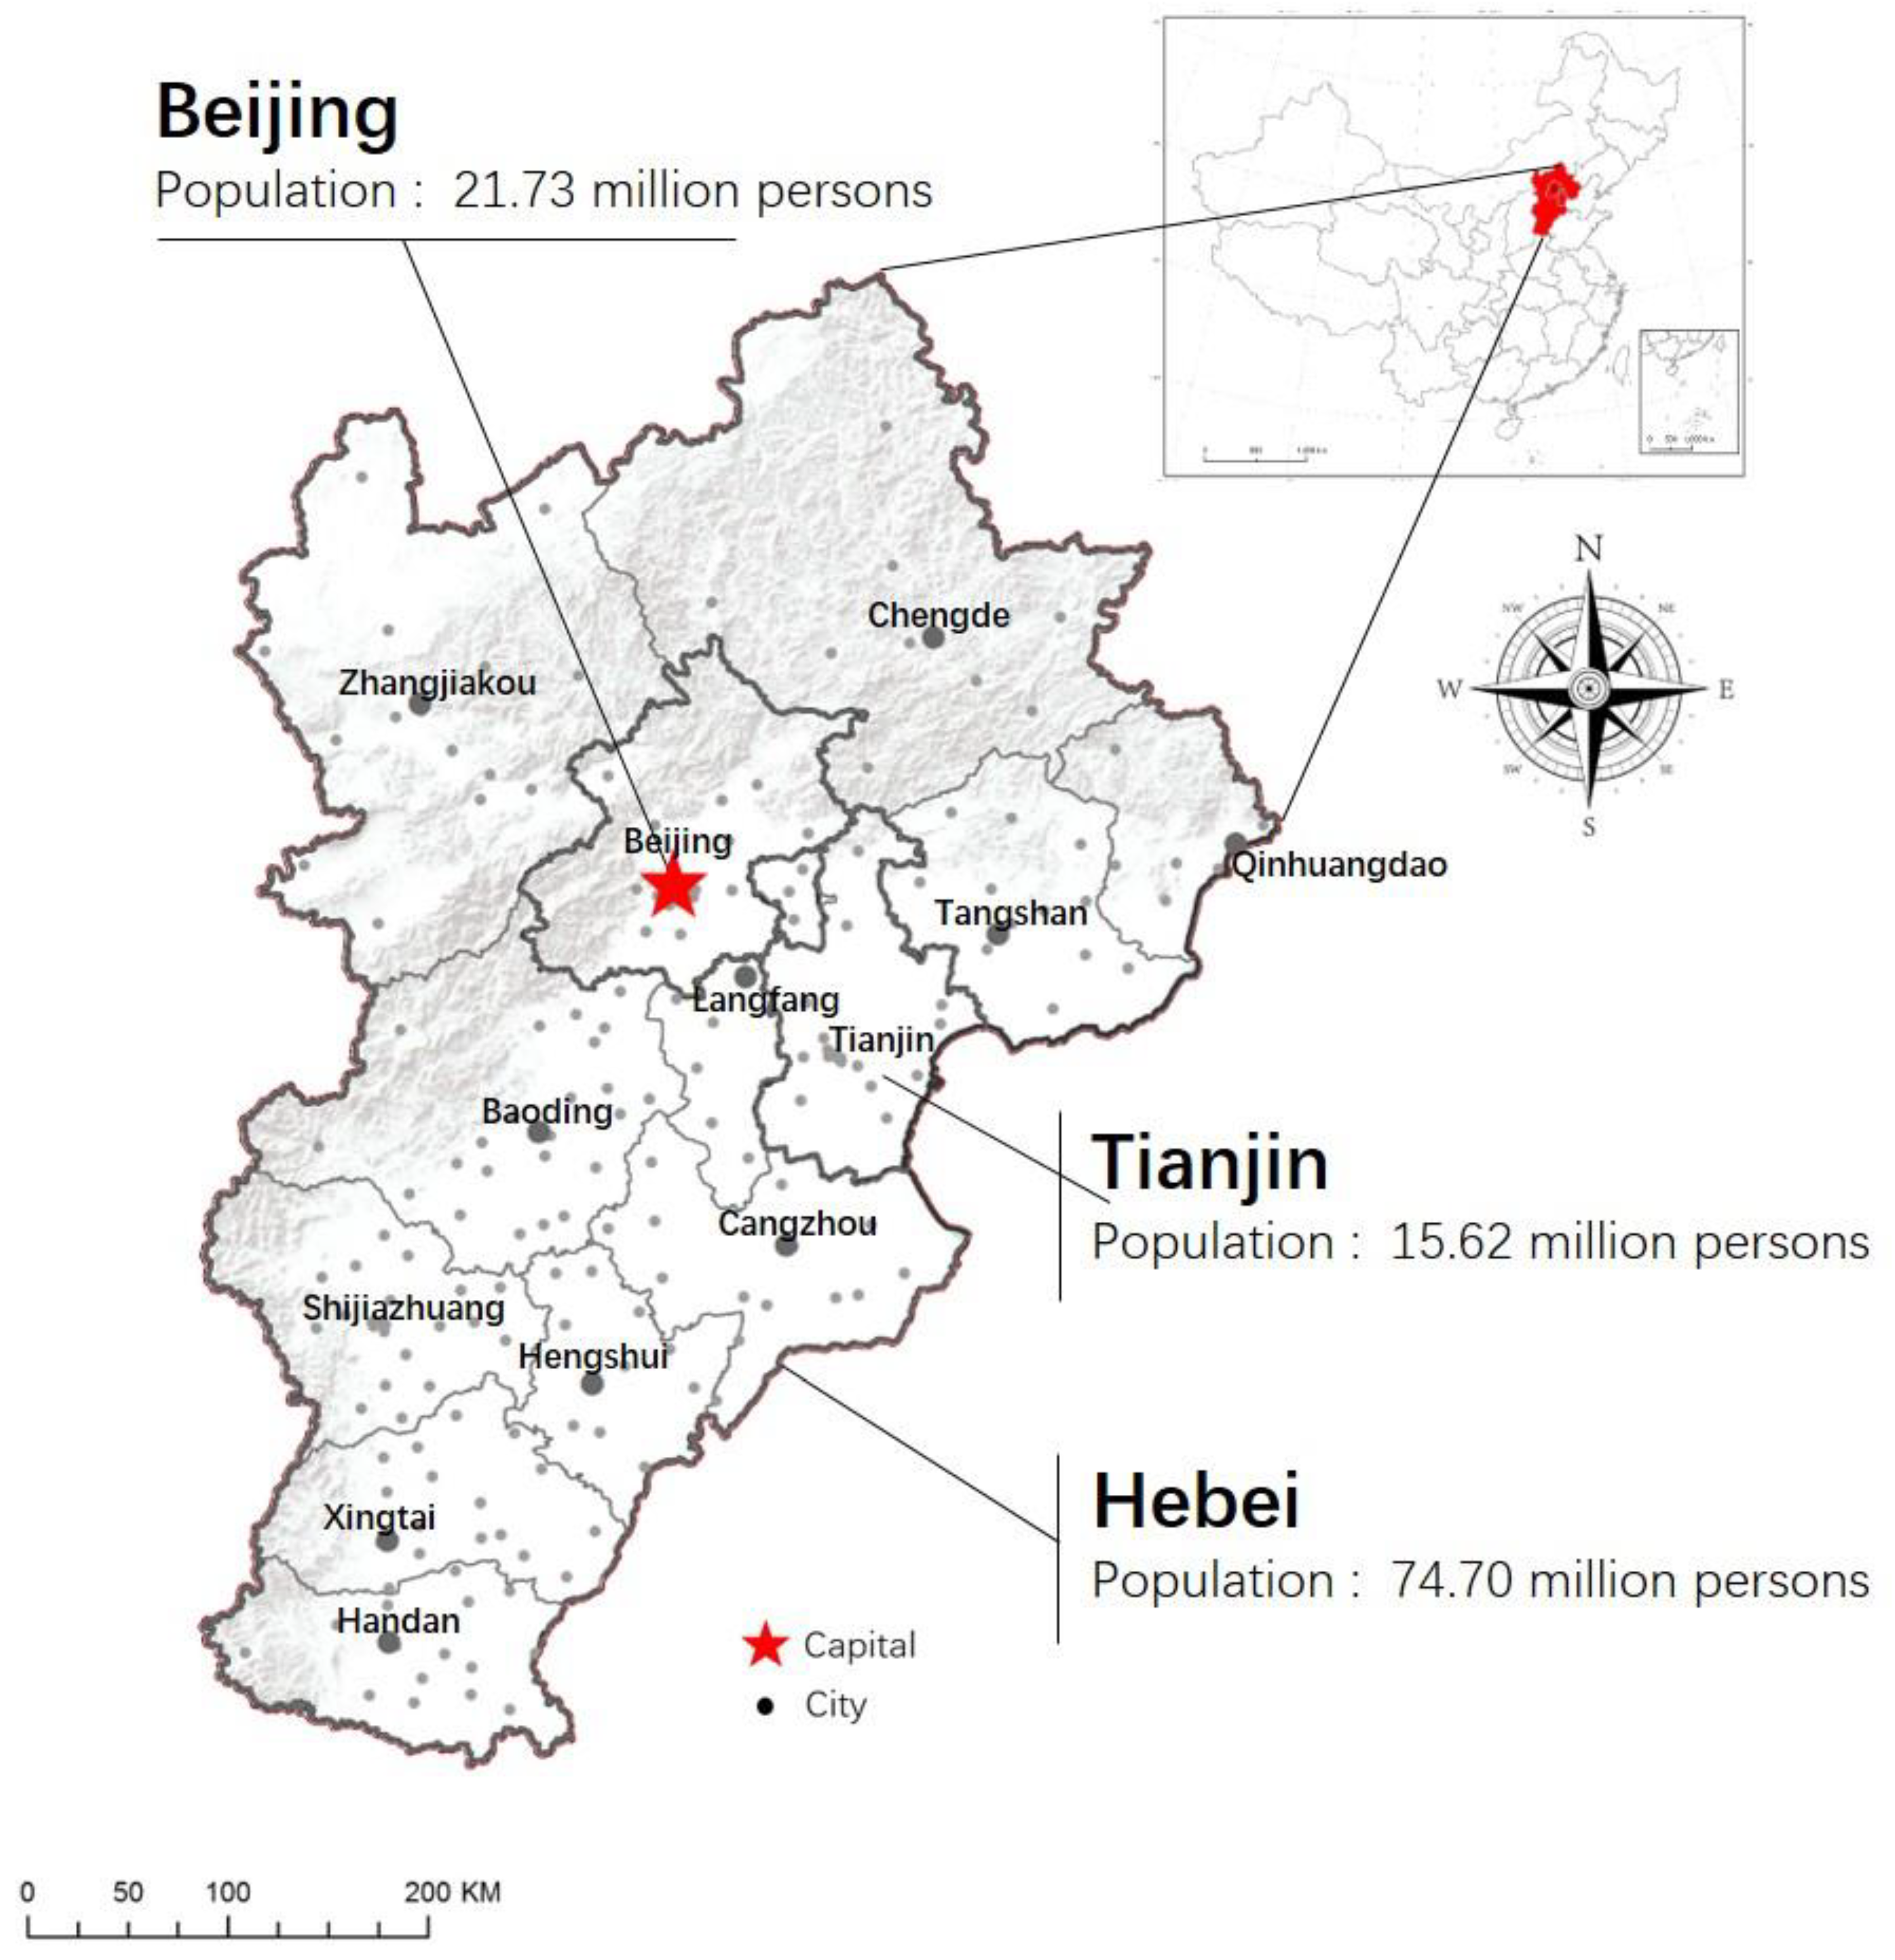
2.1. Research Area Overview

The BTH region is located in the northern part of China’s North China Plain, including the Beijing and Tianjin municipalities and 11 prefecture-level cities of Hebei Province, as shown in Figure 1. The total area of the BTH region is approximately 21.49 × 10⁴ km2 (China City Statistical Yearbook 2017), amounting to approximately 2.2% of China’s total land area. In this region, the climate condition is consistent across the areas, but the elevation differs significantly. The climate in the BTH region is a typical temperate semi-humid/semi-arid monsoon climate with four distinct seasons. There are diverse elevations across the region. The terrain slopes from northwest to southeast with the highest point reaching 2840 m, and the plain areas are mostly below 50 m.
There are various types of landscapes in the BTH region. The northwestern part includes plateaus, mountains, hills, basins, and valleys, while the central and southeastern parts include plain areas with cities, cultivated land, coastal tidal mudflats, and coastal wetlands. The types of green spaces formed due to the variation in elevation are also very diverse. The cultivated land in the plain occupies the largest area in the BTH region, amounting to one-third of the total area. The forestland and cultivated land in medium-high mountains occupy the second and third largest areas among the green space types, respectively. Grasslands in low and medium-high mountains distributed in the northern parts of the BTH region are also the major green space types.

2.2. Data Sources

The land use data covering the BTH region for the years 1995, 2000, 2005, 2010, and 2015 used in this study were extracted based on the Landsat images (resolution 30 m). The supervised maximum likelihood algorithm in the ENVI software was used to extract six different land-use/land-cover types with 24 subcategories: Cultivated land (including paddy and irrigated field, and dry field), forestland (including woodland, shrubbery, sparse forestland, and other forestland), grassland (including high-coverage grassland, medium-coverage grassland, and low-coverage grassland), waters (including river channels, lakes, reservoirs, mudflats, and beaches), built-up land (including urban construction land, rural residences, roads, isolated mining, and other construction land), and unused land (including sand land, saline-alkali soil, barren land, bare exposed rock or gravel, and others). A stratified random sampling approach was used to determine the accuracy of the land-use classification data. Five hundred pixels extracted from each classified image were compared to the visual interpretation results and summarized into land use data accuracy reports. Finally, the overall accuracy of the data is approximately 87%. In addition, the Digital Elevation Model (DEM) data of 30 m resolution were also used in this study.

2.3. Methods

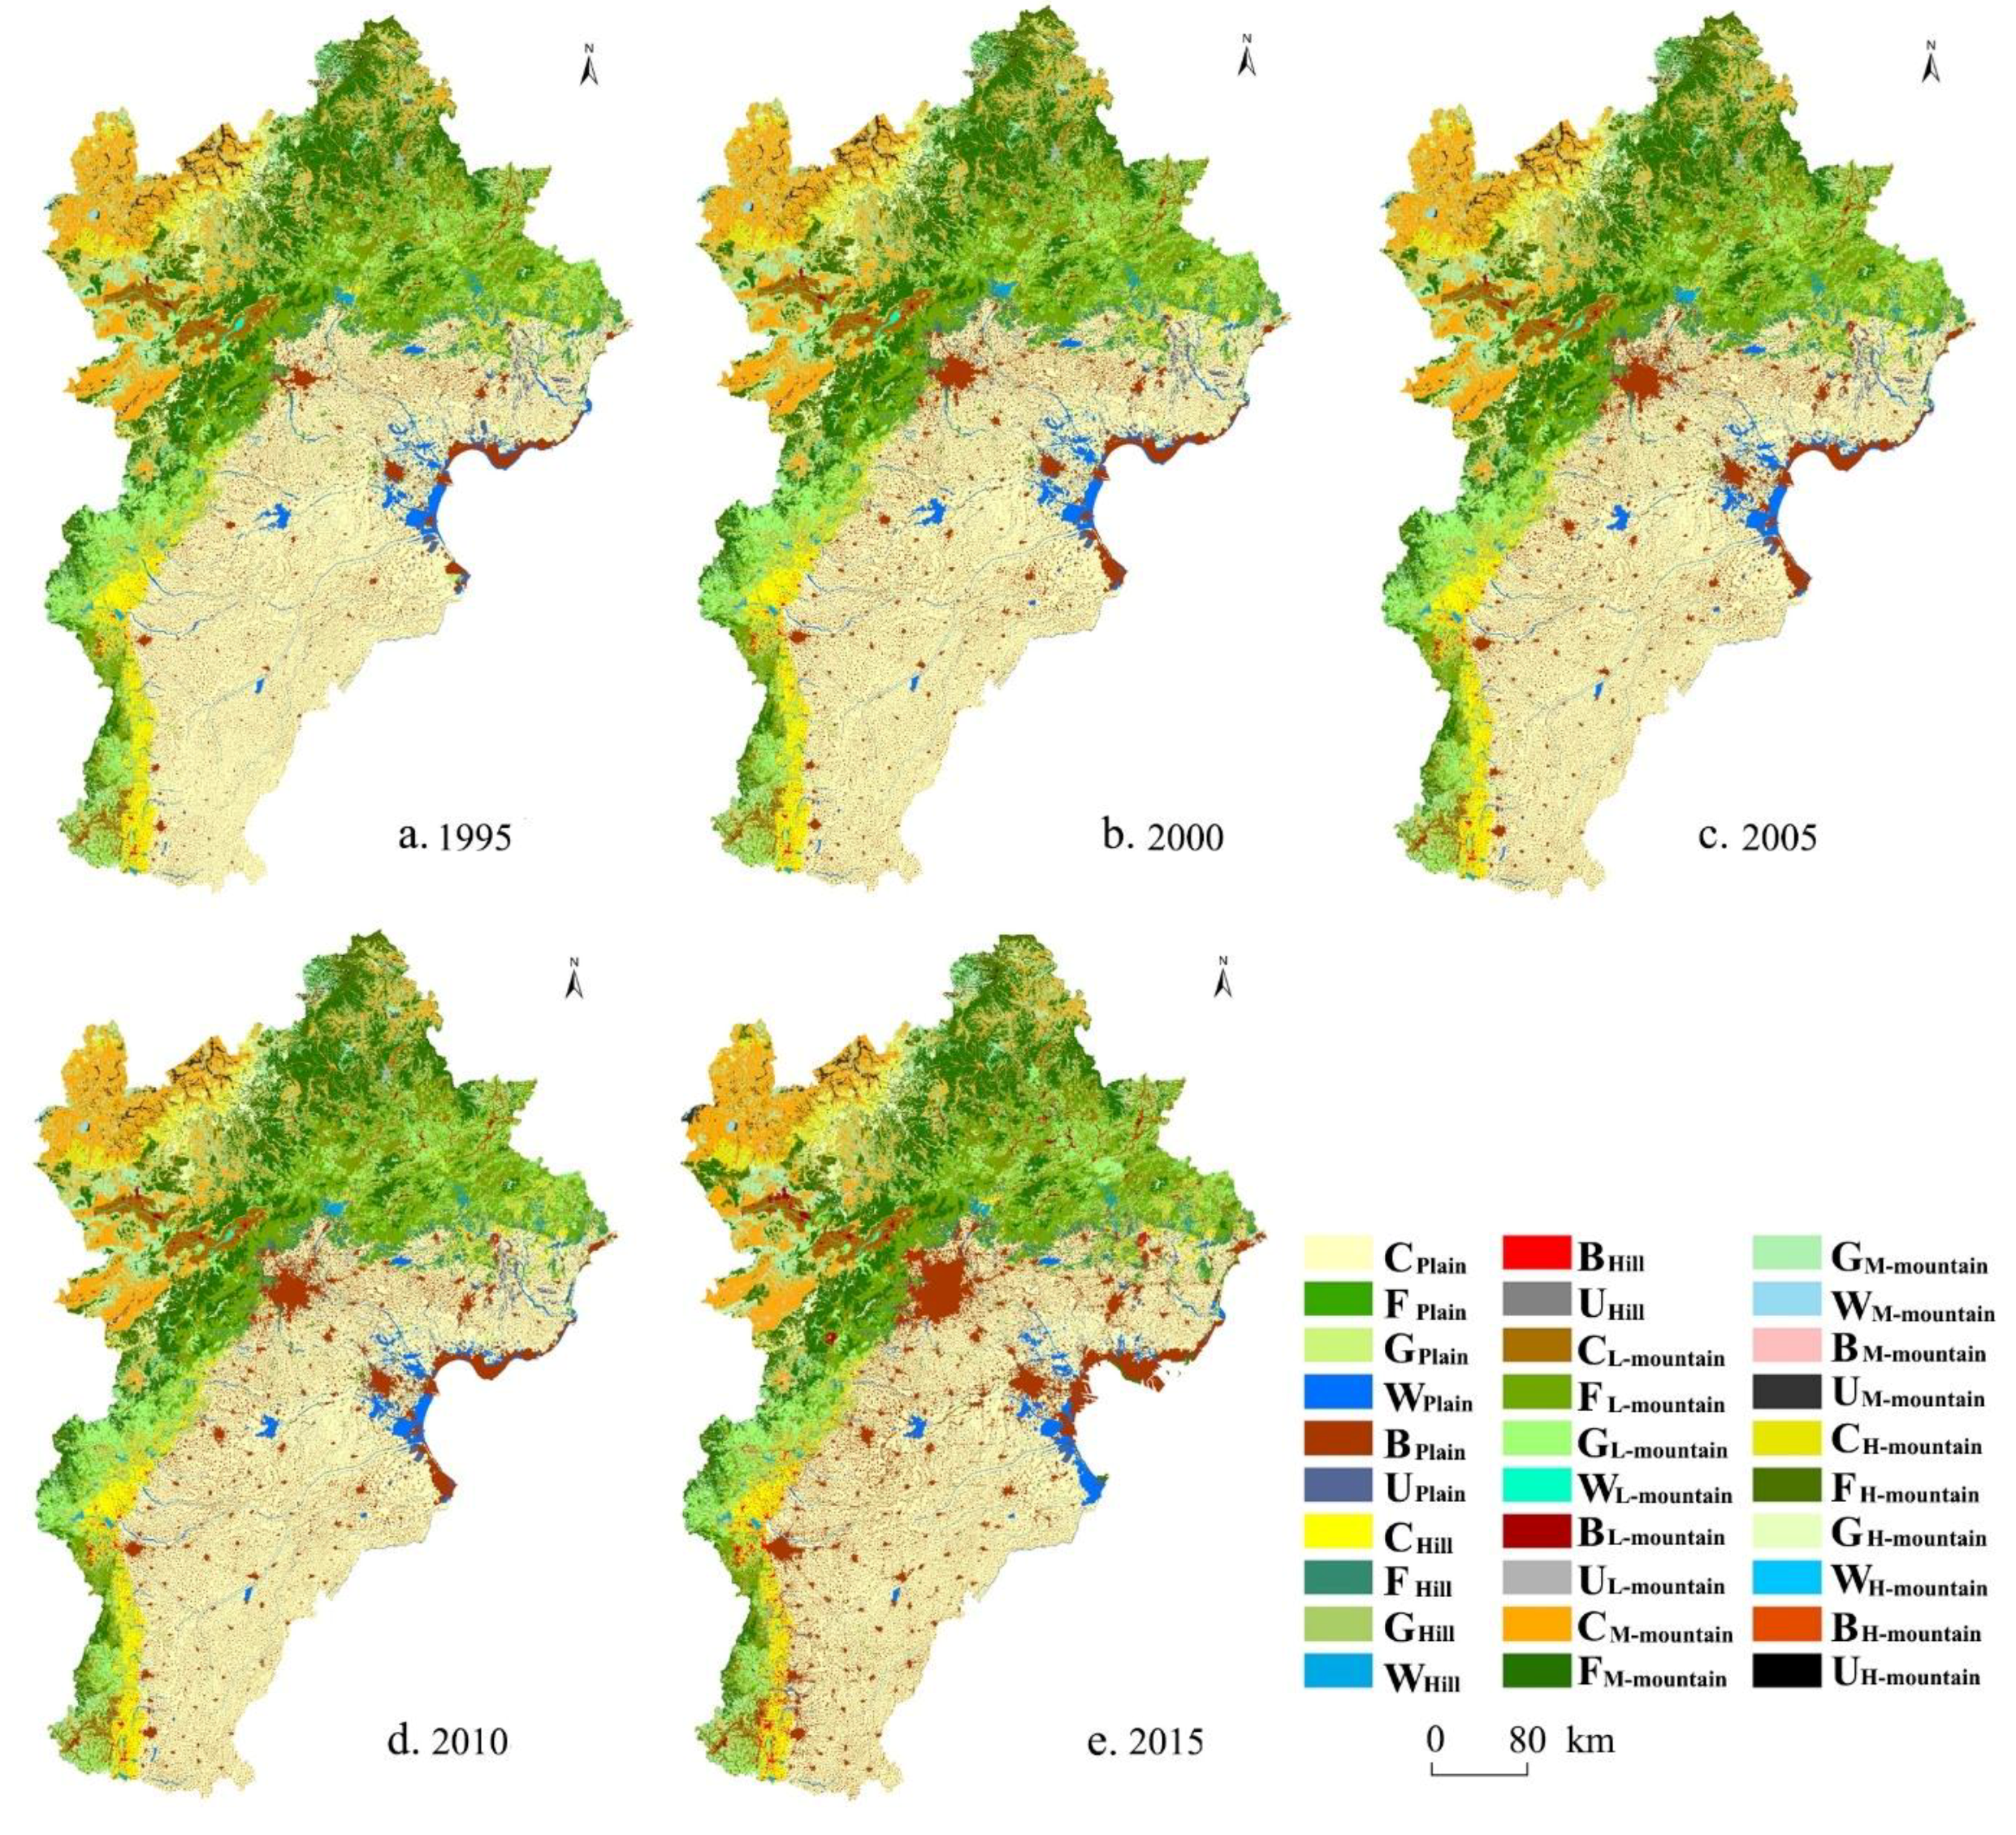
2.3.1. Identification of Green Space Types

Topography and land use/cover are the main factors influencing the characteristics of green space types. In this study, a spatial overlay analysis was performed on the image layers of topography and land use/cover to identify green space types. The topographic image layers were classified using DEM elevations based on the principles of completeness and universality. The classification standard is as follows: Plains (0–100 m), hills (100–400 m), low mountains (400–1000 m), medium-high mountains (1000–3500 m), and high mountains (>3500 m). Land-use/cover layers were obtained by using the land-use first-class classification data. After the overlay calculation using the ArcGIS software, 30 types of land-use/cover were identified, and each type was named according to the “land-use/cover type and topographic type”. The name codes are shown in Table 1. The first letter in each code represents the type classified using the land-use/cover data, and the second subscript word represents the type classified using elevation data. Considering the definition of green space, cultivated land, forest, and grassland incorporated with different topographic characteristics were taken as the green space types.

2.3.2. Analysis of the Changes in Green Space Types

To determine the rate of green space change, the percentage changes of green space per ten years were summarized from the classification results during three time periods: 1995–2005, 2005–2015, and 1995–2015.
Transfer matrices adequately reflect the structural changes in green spaces and the complex conversion processes between different green space types. In this study, transfer matrixes were used to analyze the transformations among different green space types in 1995–2000, 2000–2005, 2005–2010, and 2010–2015 using the ArcGIS software. Only the land use data of the first-level classification mentioned in Section 2.2 were used in the matrix analysis because the subcategories are too large for the analysis. The matrix reflects that one type of green space type transforms into other types at the beginning and end of a certain period.

2.3.3. Identification of Green Space Dissipation and Unstable Change Hotspots

The green space patches that disappeared during 1995–2015 were extracted using the spatial analysis tool of the ArcGIS software to further identify the dissipation characteristics of green spaces in the BTH region. The kernel density of the disappeared green space patches was analyzed to detect the hotspots where the disappeared patches were aggregately distributed. Moreover, the spatial agglomeration of unstable green space patches was analyzed. Similarly, the converted patches of different types of green spaces during 1995–2015 were extracted using the spatial analysis tool of the ArcGIS software to further determine the spatial distribution of the conversion between different types of green spaces. Afterward, the kernel density of patches was analyzed to detect the hotspots of unstable changes in green spaces in the BTH region.

3. Results

3.1. Green Space Changes

The types and distribution of green spaces in the BTH region during different periods are shown in Figure 2. Between 1995 and 2015, the area of built-up land in the BTH region significantly increased from 15,164 km2 in 1995 (accounting for 7.04% of the total area) to 28,435 km2 in 2015 (accounting for 13.21% of the total area). It is particularly evident near the big cities such as Beijing, where construction land expanded extremely rapidly. A large number of green spaces were occupied due to the rapid expansion of built-up land. Between 1995 and 2015, the cultivated land (CPlain), forest (FPlain), and grassland (GPlain) in plain and cultivated land in hill (CHill) showed a strong decreasing trend, see Table 2. The reduction in cultivated land (CPlain) was the highest among the green space types, from 74,459 km2 in 1995 (accounting for 34.58% of the total area) to 66,376 km2 in 2015 (accounting for 30.69% of the total area). The highest reduction rate occurred in the grassland in plain (GPlain), which decreased by 54.98% from 1995 to 2015. The areas of forest in hill (FHill) and grassland in low mountain (GL-mountain) and forest in high mountain (FH-mountain) decreased only slightly. The areas of cultivated land in medium-high mountain (CM-mountain) and high-mountain (CH-mountain), forest in low-mountain (FL-mountain), and the total area showed no obvious change. In contrast to most of the green space types, the areas of forest in medium-high mountain (FM-mountain) and grass in high-mountain (GH-mountain) showed an increasing trend, from 20,687 km2 and 3524 km2 in 1995 to 21,301 km2 and 3557 km2 in 2015, respectively.

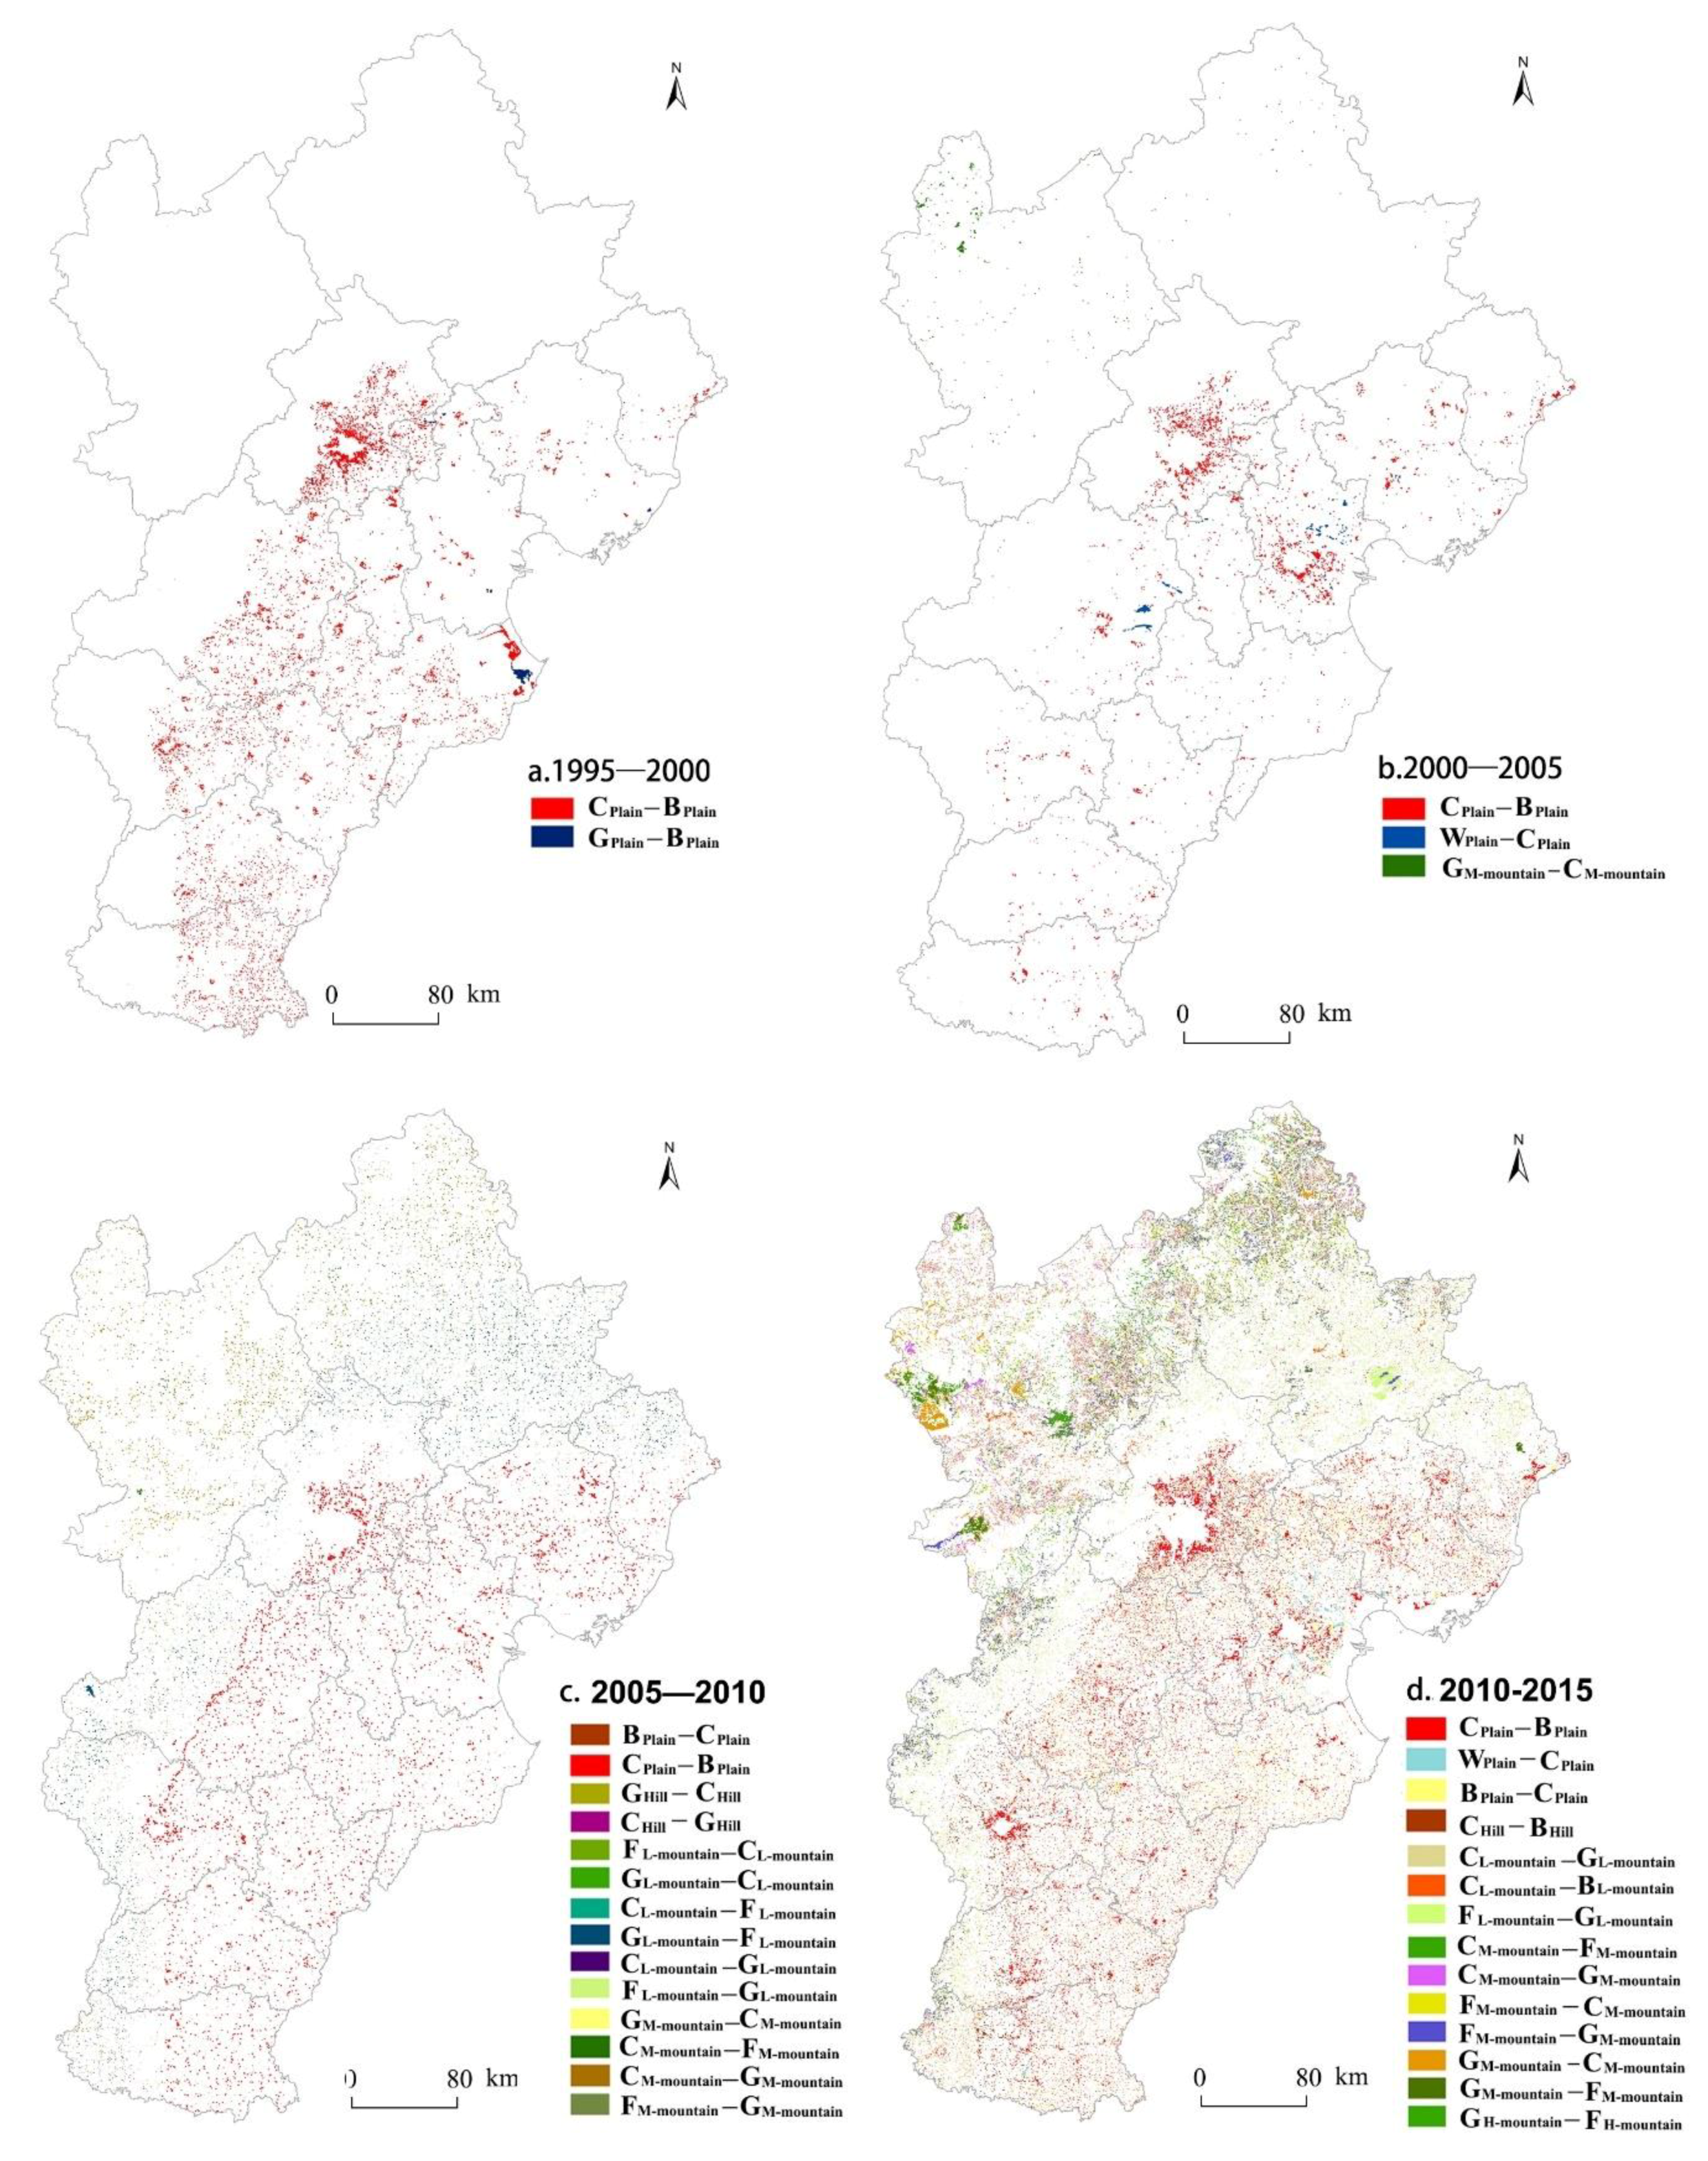
3.2. Spatiotemporal Transitions of Green Spaces

Results of transformations among different land use/cover types in different time periods are shown in Table 3, Table 4, Table 5 and Table 6. In order to clearly show the transformations, the size of the transition area is marked by a color background in these four tables, where red indicates a sharp change, gray indicates a small change and white indicates no change, while blanks indicate that this type of land use/cover does not exist. The land-use/land-cover transfer matrix for the periods 1995 to 2000 is shown in Table 3. The rows indicate that the area of the first type in 1995 transformed to all other types in 2000. Under the urbanization pressure, a large amount of cultivated land in plain was transformed to built-up land with an area of 2709 km2. As shown in the spatial distribution of green space type changes, detailed in Figure 3, the transfer-out of cultivated land in plain mainly occurred in the suburbs of large cities. The occupation of green spaces by built-up land was particularly evident, especially in the surroundings of the built-up areas of Beijing and Shijiazhuang. The grassland and forest in plain were also turned into built-up land. However, the magnitude was relatively small, and the positions were relatively scattered. In addition, 100 km2 of cultivated land in plain was turned into forest, while 92 km2 of forest in plain was turned into cultivated land, thus achieving a balance. From 2000 to 2005, the green space types that changed gradually grew in number, see Table 4. The persistently most obvious change was that the green spaces in plain were turned into built-up land, evident by the decreasing amount of cultivated land. In the meantime, large areas of grassland in the medium-high mountain were turned into cultivated land. These changes show that the urban development in this period was conducted in two ways simultaneously; by occupying the cultivated land for construction purposes and reclaiming the mountain grassland as cultivation land. As shown in the spatial distribution of green space type changes, the construction land in the suburbs of Beijing and Tianjin significantly expanded in this period. From 2005 to 2010, the changes in green spaces in the BTH region extended to the western mountainous region. Accompanying the transformation of large areas from cultivated land into built-up land in plain, the cultivated lands in hills and mountains were also transformed into grassland, as shown in Table 5. Additionally, the forestlands in low and medium-high mountains were also turned into grasslands, while the cultivated land and grassland in low and medium-high mountains were turned into forestland. Therefore, in this period, the spatial distribution of grassland and forest in low and medium-high mountains changed. One noticeable dynamic in green space change from 2010 to 2015 apart from the cultivated land in plain being occupied by built-up land in the BTH region is that the built-up land began to be changed to cultivated land, as shown in Table 6. At the same time, the cultivated land and forest in low and medium-high mountains were changed to grassland, while the grassland in low and medium-high mountains was also changed to cultivated land and forest. This indicates that the development of green space types in the BTH region was dominated by internal restructuring during this period. Particularly, the changes from cultivated land to forest and from grassland to forest in medium-high mountain areas in the northwest of the BTH region were most obvious.

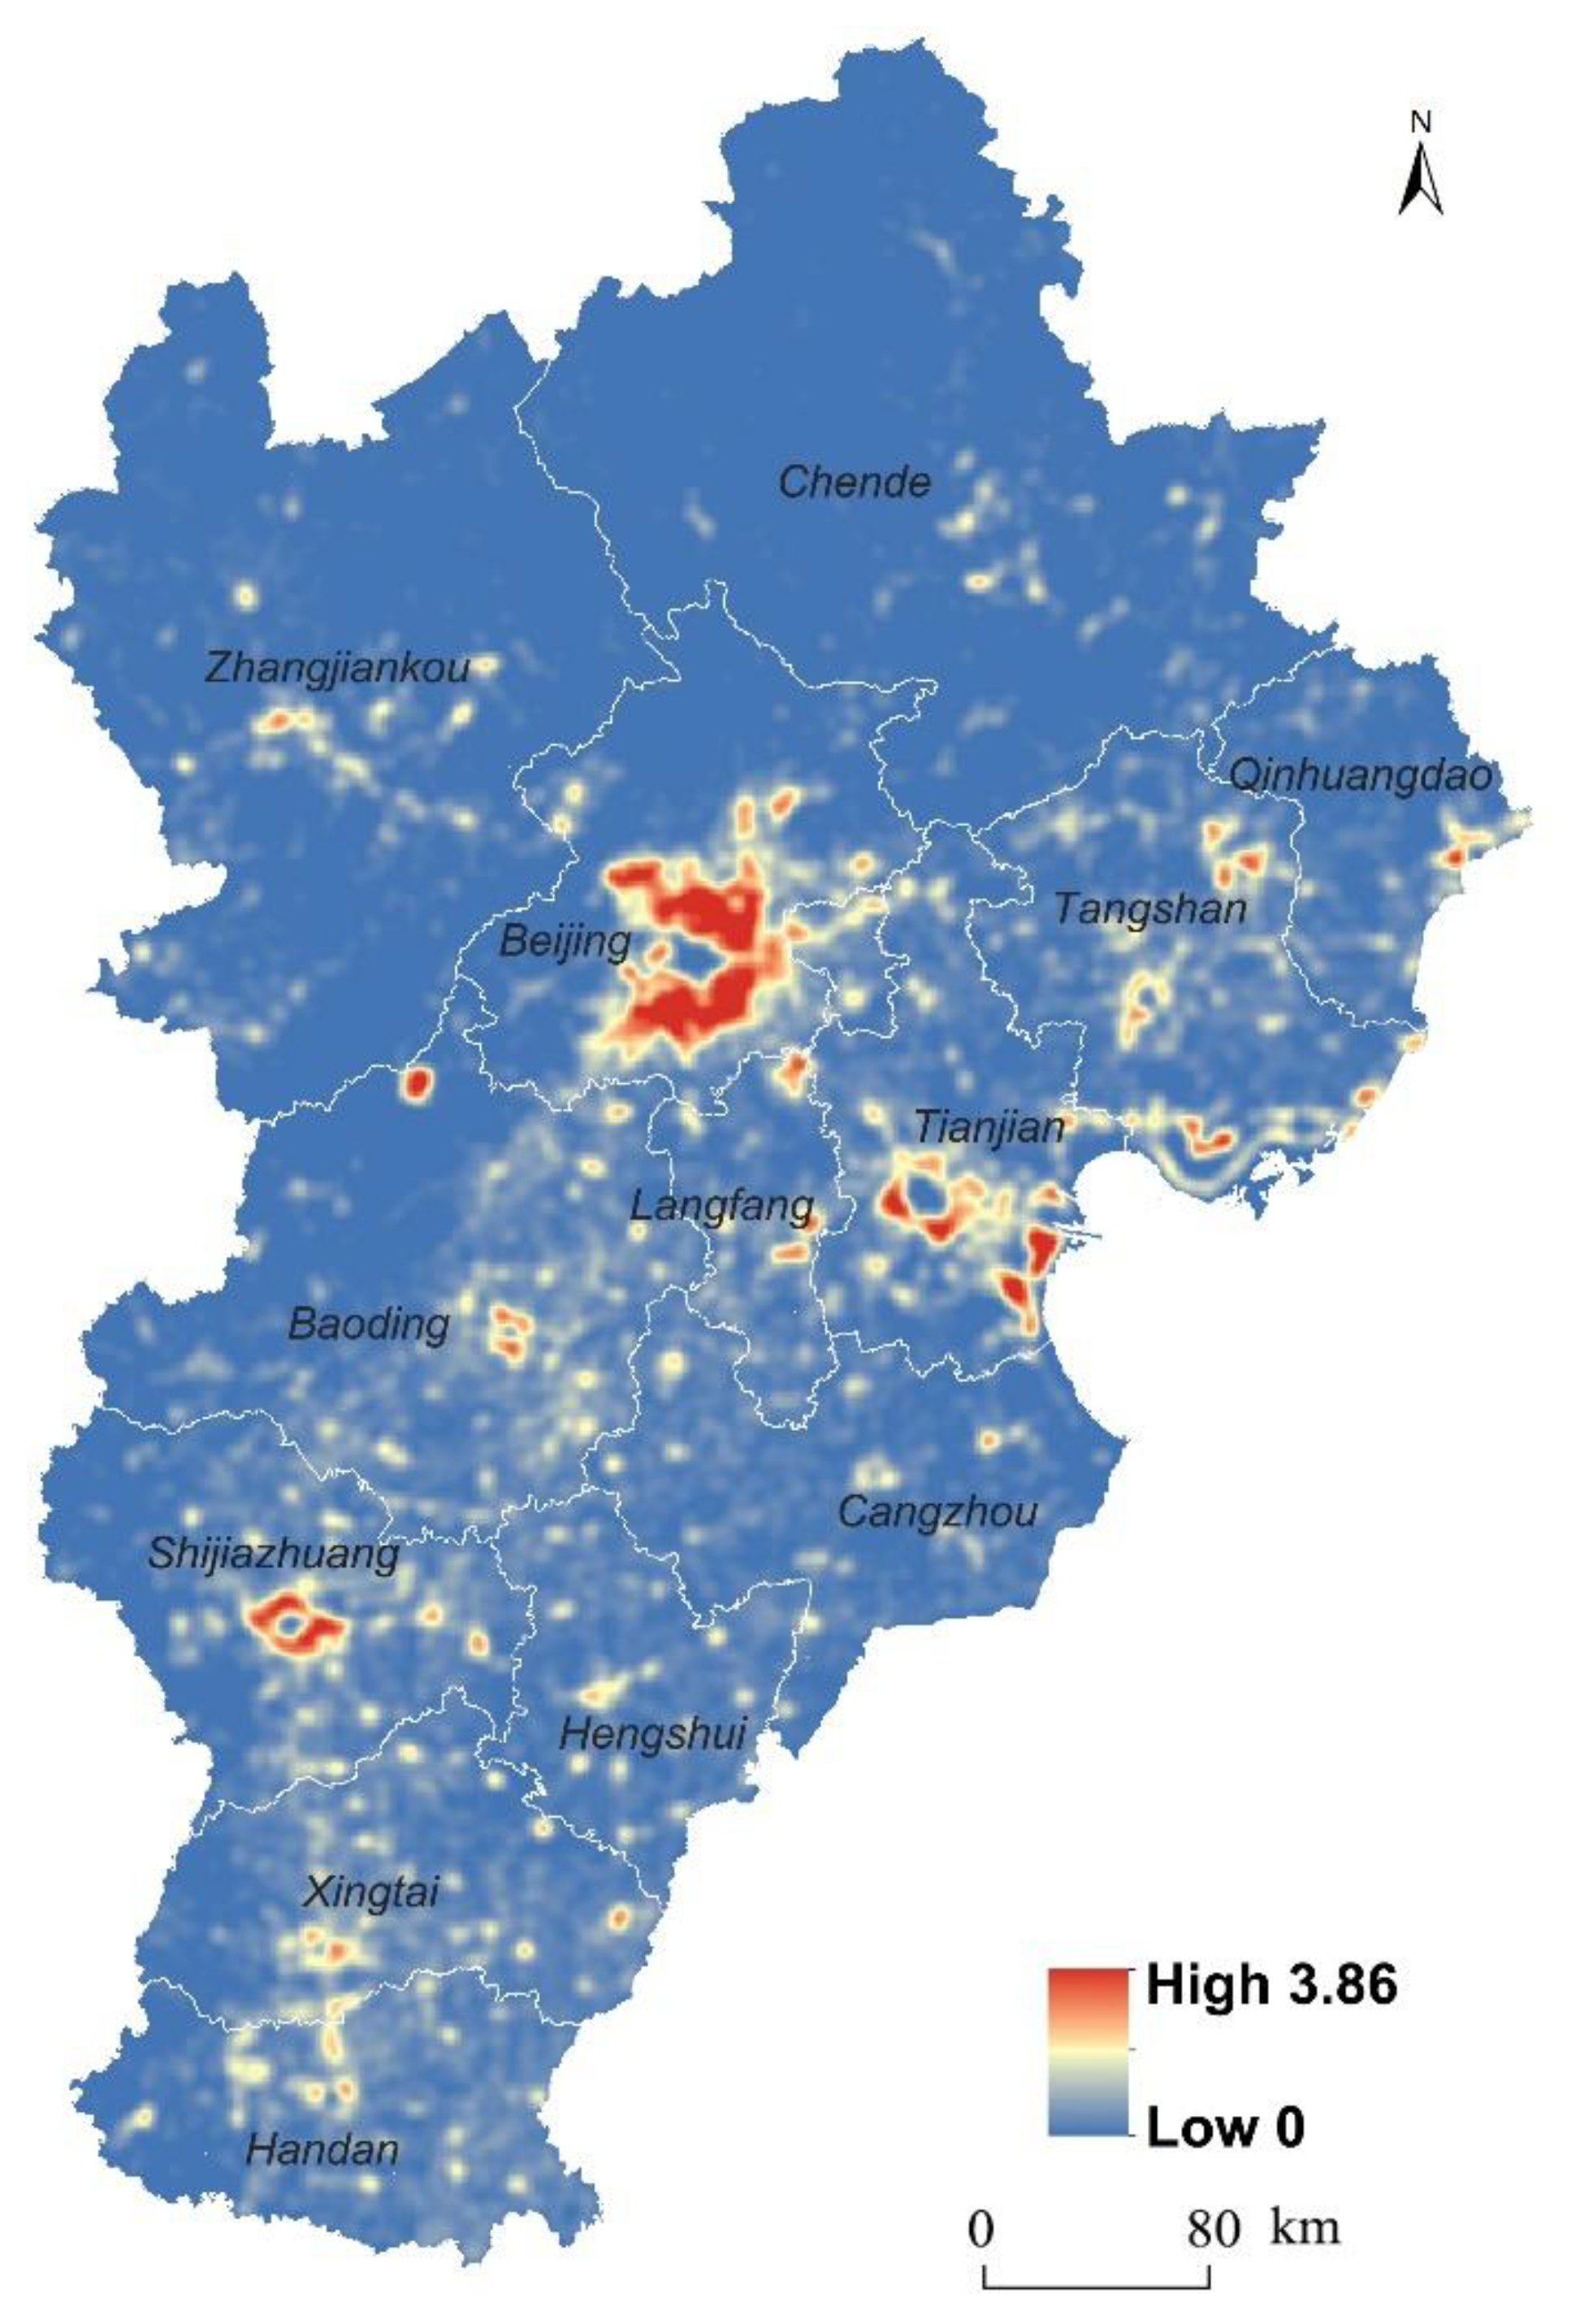
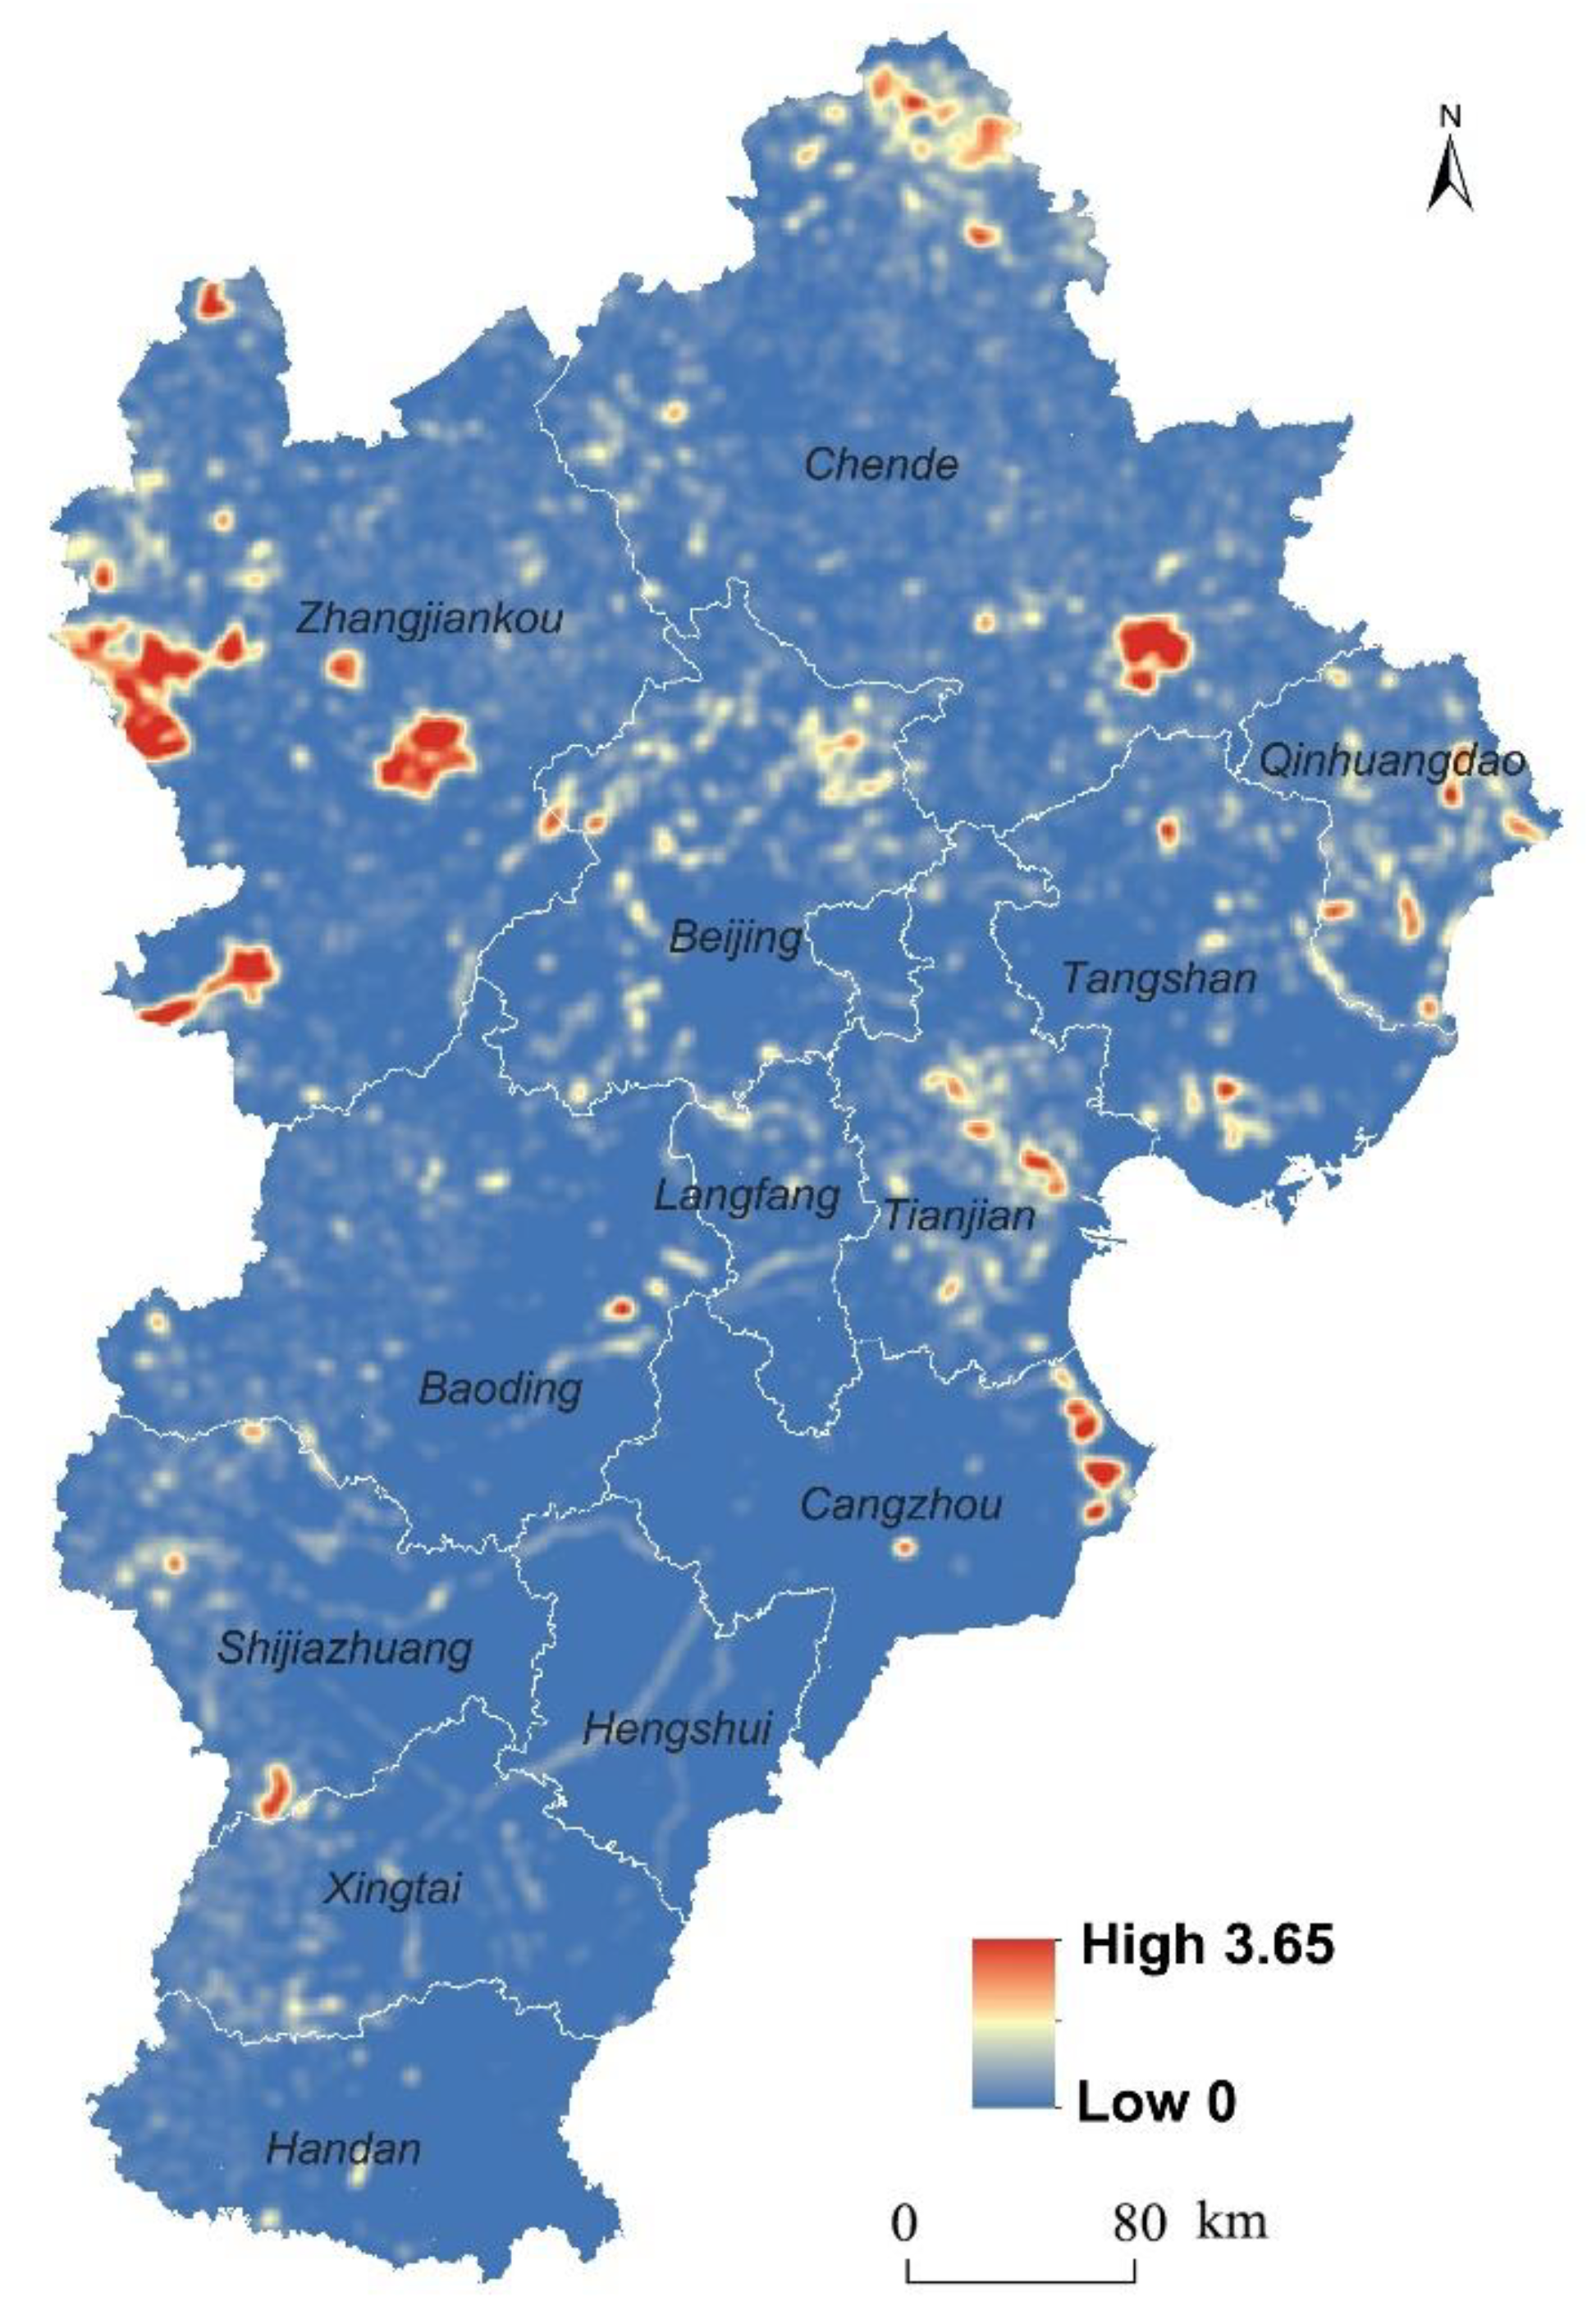
3.3. Hotspots of Spatiotemporal Evolution of Green Space

Between 1995 and 2015, the disappeared green space patches in the BTH region were concentrated in the central and southern plain regions, as shown in Figure 4. The northern, eastern, and southern regions surrounding Beijing’s central urban area were the largest hotspots of green space disappearance in the BTH region. Other major hotspots included the coastal area of Tianjin and the regions surrounding the central urban area of the prefecture-level cities of Shijiazhuang and Tangshan in Hebei Province. Additionally, the margins of built-up areas of prefecture-level cities in Hebei Province were the hotspots of green space patch disappearance. Many such hotspots with low intensity were widely distributed in the southern plain area of the BTH region. Compared with the distribution of hotspots of green space disappearance in the southern plain region, the green space disappearance hotspots in the northern mountainous region were more concentrated in the areas along the Beijing–Zhangjiakou highway and in scattered spots in the southeastern area of Chengde.
The hotspots of unstable green space changes, as shown in Figure 5, indicate that the northwestern and northeastern mountainous areas in the BTH region were the main hotspots of green space internal transfer between 1995 and 2015. The hotspots in these regions are characterized by a high intensity, large area, and concentrated distribution, indicating that the internal restructuring between green space types in this period was not random. In addition, the hotspots of unstable green space changes were also sparsely distributed in the northern mountainous areas of Beijing and the coastal areas of Tianjin. These hotspots are characterized by low intensity, small area, and scattered distribution. No obvious hotspots of unstable green space changes were present in the southern plain area of the BTH region.

4. Discussion

Among the green space types in the BTH region, the cultivated land in plain has the largest area and the most extensive distribution. Cultivated land is an important green space and spatial basis for preserving the ecosystem services and social economic development in the southern plain region. This not only has the function of producing food but also serves as the habitats for many species and the leisure space for urban and rural residents [23,24,25]. However, after nearly 20 years of rapid urbanization, the cultivated land in the suburbs of big cities in the BTH region has been massively occupied by built-up land. Currently, the BTH region is in an important period of integrated and coordinated development in ecology, society, and economy [26]. It is a crucial premise for the coordinated development of the BTH region to understand the position and function of cultivated land in plain. The multifunctionality of cultivated land should be fully developed, and the spatial distribution of different types of cultivated land in the suburbs, outer suburbs, and mountainous areas in the outer suburbs of big cities should be rationally optimized.
The mountainous areas in the northwestern part of the BTH region were the hotspots of internal conversion between green space types. A large amount of cultivated land was turned into grassland and forestland, while the grassland was changed to forestland in the medium-high and high mountains. This finding indicates that in the past 20 years, the important ecosystem service functions of forests and grass in the northwestern mountainous areas have received attention. To improve the ecosystem services in the BTH region, several land use policies have been implemented to increase the area of forest and grassland, such as Returning Farmland to Grassland and the Grain for Green Project. These policies have effectively increased the area of green spaces in the past 20 years [26]. However, the improvement in the ecosystem service is not only correlated with the area of green space but also depends on the types of green space [21,27]. Li et al. [22] indicated that the forest and grassland in the BTH region has a lower water-retention capacity because up to 60% of forest was shrubs and sparse forest and more than 80% of the grassland was in a low-to-medium coverage. Thus, the quality and distribution of green space should be considered when green policies are planned and implemented.
Despite the increased forestland in mountainous areas, a slight amount of forestland was transferred into the southern plain area in the BTH region. In recent years, with the rapid urbanization and wide expansion of construction land, a series of ecological and environmental issues have emerged, such as water shortages, air pollution, and reduced biodiversity in the BTH region [21,28]. How to safeguard and enhance the ecological security and strengthen the construction of plain forestland are unavoidable issues for the current development of the BTH region. To improve the green space conditions, some strategies have been implemented by the government in several cities in the BTH region. For example, an afforestation project was implemented by the Beijing government at the beginning of 2012 to increase almost 67 thousand hectares of forestland in plain within five years. Since the enforcement of this project, some built-up land and grassland in plain were turned into forest during the period of 2010–2015. However, this project was only implemented in Beijing. More green space planning strategies and conservation plans are still needed in other cities. Furthermore, a comprehensive view of the spatial distribution of green spaces in the BTH region suggests that ecological forests should be constructed in the outer built-up areas of large cities in the southern plain area, and the areas between city groups should be strengthened. For example, ecological corridors such as green belts along the major river channels, important traffic routes, and coasts should be maintained and strengthened, and the preservation of forests in various wetlands, water conservation areas, and water source areas should be enhanced, so that a network of ecological security patterns in the plain area can be further established.
In this study, the spatiotemporal dynamics of green spaces in the BTH region were evaluated with the support of Geographic Information System (GIS) technology. Previous studies revealed the spatial evolution of green spaces by using the land-use/cover data and did not consider the differentiation effect of vertical elevation on green spaces. Compared with the previous studies, the green spaces in this study were redefined by using the elevation and land-use/cover properties. This further illustrates the evolution and differentiation of green spaces under the influence of elevation gradients and provides more sensitive references for land management in the integrated and coordinated development of the BTH region. However, due to the limitation of research scales and data accuracy, the evolution of green spaces inside the urban built-up areas cannot be fully explored in this study. In fact, green space changes are affected by many complex factors such as population, economic, political structures, and values [29,30]. The social and economic driving mechanisms of green space evolution in the BTH region should be further discussed in future studies.

5. Conclusions

The green spaces in the BTH region have changed significantly during the time period of 1995–2015. Cultivated land is the main green space in the plains of the BTH region, and a large area was turned into built-up land, mainly in the suburbs of large cities. In particular, the cultivated land in plain surrounding the central urban areas of Beijing and Tianjin was mainly transformed into built-up land, accounting for the majority of the reduction in the green spaces in these regions. The highest reduction rate of green space occurred in the grassland in plain, which decreased by 60% from 1995 to 2015. The disappeared grassland was mainly turned into built-up land during the period 1995–2010 and cultivated land and built-up land during the period 2010–2015. In contrast to the declining trend for most green space types, the areas of forest in medium-high and high mountains showed an increasing trend from 1995 to 2015, and the increased forestland was mainly transformed to cultivated land and grassland. The changes between green space types mainly occurred in the western and northern mountainous areas of the BTH region.
Overall, the margins of the central urban areas of large cities such as Beijing, Tianjin, and Shijiazhuang were the hotspots of green space disappearance in the BTH region between 1995 and 2015. The northern and northeastern mountainous areas were the hotspots of internal transfer between green space types, i.e., the hotspots of unstable green space changes.

Author Contributions

Conceptualization: H.T., W.L. and W.Y.; data collection: H.T. and W.L.; formal analysis: W.L.; funding acquisition: H.T.; investigation: H.T.; methodology: W.L.; project administration: H.T.; resources: W.Y.; visualization: W.L.; writing—original draft: H.T. and W.L.; writing—review & editing: W.L.

Funding

This research was funded by National Youth Foundation of China, grant number 41701201 and 51508218.

Conflicts of Interest

The authors declare that they have no conflict of interest.

References

  1. Grimm, N.B.; Faeth, S.H.; Golubiewski, N.E.; Redman, C.L.; Wu, J.; Bai, X.; Briggs, J.M. Global change and the ecology of cities. Science 2008, 319, 756–760. [Google Scholar] [CrossRef] [PubMed]
  2. Pickett, S.T.; Cadenasso, M.L.; Grove, J.M.; Boone, C.G.; Groffman, P.M.; Irwin, E.; Kaushal, S.S.; Marshall, V.; McGrath, B.P.; Nilon, C.H.; et al. Urban ecological systems: Scientific foundations and a decade of progress. J. Environ. Manag. 2011, 92, 331–362. [Google Scholar] [CrossRef] [PubMed]
  3. Munteanu, C.; Kuemmerle, T.; Boltiziar, M.; Butsic, V.; Gimmi, U.; Halada, L.; Kaim, D.; Király, G.; Konkoly-Gyuró, É.; Kozak, J. Forest and agricultural land change in the Carpathian region—A meta-analysis of long-term patterns and drivers of change. Land Use Policy 2014, 38, 685–697. [Google Scholar] [CrossRef]
  4. Armson, D.; Stringer, P.; Ennos, A.R. The effect of street trees and amenity grass on urban surface water runoff in Manchester, UK. Urban Green. 2013, 12, 282–286. [Google Scholar] [CrossRef]
  5. Mytton, O.T.; Townsend, N.; Rutter, H.; Foster, C. Green space and physical activity: An observational study using Health Survey for England data. Health Place 2012, 18, 1034–1041. [Google Scholar] [CrossRef] [PubMed]
  6. Kong, F.; Yin, H.; James, P.; Hutyra, L.R.; He, H.S. Effects of spatial pattern of greenspace on urban cooling in a large metropolitan area of eastern China. Landsc. Urban Plan. 2014, 128, 35–47. [Google Scholar] [CrossRef]
  7. Catharine, W.T.; Peter, A.; Jenny, R.; Lynette, R.; David, M. Mitigating Stress and Supporting Health in Deprived Urban Communities: The Importance of Green Space and the Social Environment. Int. J. Environ. Res. Public Health 2016, 13, 440. [Google Scholar] [CrossRef]
  8. Baycanlevent, T.; Vreeker, R.; Nijkamp, P. A multi-criteria evaluation of green spaces in European cities. Eur. Urban Reg. Stud. 2009, 16, 193–213. [Google Scholar] [CrossRef]
  9. Liu, W.; Holst, J.; Yu, Z. Thresholds of landscape change: a new tool to manage green infrastructure and social–economic development. Landsc. Ecol. 2014, 29, 729–743. [Google Scholar] [CrossRef]
  10. Xu, M.; He, C.; Liu, Z.; Dou, Y. How Did Urban Land Expand in China between 1992 and 2015? A Multi-Scale Landscape Analysis. PLoS ONE 2016, 11, e154839. [Google Scholar] [CrossRef] [PubMed]
  11. Zhou, X.; Wang, Y.C. Spatial-temporal dynamics of urban green space in response to rapid urbanization and greening policies. Landsc. Urban Plan. 2011, 100, 269–277. [Google Scholar] [CrossRef]
  12. Jim, C.Y.; Chen, S.S. Comprehensive greenspace planning based on landscape ecology principles in compact Nanjing city, China. Landsc. Urban Plan. 2003, 65, 95–116. [Google Scholar] [CrossRef]
  13. Li, Y.; Tao, J.; Zhang, L.; Jia, X.; Wu, Y. High Contributions of Secondary Inorganic Aerosols to PM2.5under Polluted Levels at a Regional Station in Northern China. Int. J. Environ. Res. Public Health 2016, 13, 1202. [Google Scholar] [CrossRef] [PubMed]
  14. Chen, Z.; Cai, J.; Gao, B.; Xu, B.; Dai, S. Detecting the causality influence of individual meteorological factors on local PM2.5 concentration in the Jing-Jin-Ji region. Sci. Rep. 2017, 7, 40735. [Google Scholar] [CrossRef] [PubMed] [Green Version]
  15. Uy, P.D.; Nakagoshi, N. Analyzing urban green space pattern and eco-network in Hanoi, Vietnam. Landsc. Ecol. Eng. 2007, 3, 143–157. [Google Scholar] [CrossRef]
  16. Acheampong, M.; Yu, Q.; Enomah, L.D.; Anchang, J.; Eduful, M. Land use/cover change in Ghana’s oil city: Assessing the impact of neoliberal economic policies and implications for sustainable fevelopment goal number one—A remote sensing and GIS approach. Land Use Policy 2018, 73, 373–384. [Google Scholar] [CrossRef]
  17. Jamu, D.M.; Chimphamba, J.B.; Brummett, R.E. Land use and cover changes in the Likangala catchment of the Lake Chilwa basin, Malawi: implications for managing a tropical wetland. Afr. J. Aquat. Sci. 2003, 28, 123–135. [Google Scholar] [CrossRef]
  18. Sikuzani, Y.U.; Kouagou, R.S.; Maréchal, J.; Ilunga, E.I.W.; Malaisse, F.O.; Bogaert, J.; Kankumbi, F.O.M. Changes in the Spatial Pattern and Ecological Functionalities of Green Spaces in Lubumbashi (the Democratic Republic of Congo) in Relation With the Degree of Urbanization. Trop. Conserv. Sci. 2018, 11, 324149516. [Google Scholar] [CrossRef]
  19. Fathizad, H.; Rostami, N.; Faramarzi, M. Detection and prediction of land cover changes using Markov chain model in semi-arid rangeland in western Iran. Environ. Monit. Assess. 2015, 187, 1–12. [Google Scholar] [CrossRef] [PubMed]
  20. Zhang, B.; Xie, G.D.; Li, N.; Wang, S. Effect of urban green space changes on the role of rainwater runoff reduction in Beijing, China. Landsc. Urban Plan. 2015, 140, 8–16. [Google Scholar] [CrossRef] [Green Version]
  21. Kang, P.; Chen, W.; Hou, Y.; Li, Y. Linking ecosystem services and ecosystem health to ecological risk assessment: A case study of the Beijing-Tianjin-Hebei urban agglomeration. Sci. Total Environ. 2018, 636, 1442–1454. [Google Scholar] [CrossRef] [PubMed]
  22. Li, S.; Yang, H.; Lacayo, M.; Liu, J.; Lei, G. Impacts of Land-Use and Land-Cover Changes on Water Yield: A Case Study in Jing-Jin-Ji, China. Sustainability 2018, 10, 960. [Google Scholar] [CrossRef]
  23. Batáry, P.; Fischer, J.; Báldi, A.; Crist, T.O.; Tscharntke, T. Does habitat heterogeneity increase farmland biodiversity? Front. Ecol. Environ. 2011, 9, 152–153. [Google Scholar] [CrossRef]
  24. Ng, K.; Barton, P.S.; Macfadyen, S.; Lindenmayer, D.B.; Driscoll, D.A. Beetle’s responses to edges in fragmented landscapes are driven by adjacent farmland use, season and cross-habitat movement. Landsc. Ecol. 2018, 33, 109–125. [Google Scholar] [CrossRef]
  25. Peng, J.; Liu, Z.; Liu, Y.; Chen, X.; Zhao, H. Assessment of farmland landscape multifunctionality at county level in BeijingTianjin-Hebei area. Acta Ecol. Sin. 2016, 36, 2274–2285. [Google Scholar] [CrossRef]
  26. Yu, W.; Zhou, W. Spatial pattern of urban change in two Chinese megaregions: Contrasting responses to national policy and economic mode. Sci. Total Environ. 2018, 634, 1362–1371. [Google Scholar] [CrossRef] [PubMed]
  27. Reid, C.E.; Clougherty, J.E.; Shmool, J.; Kubzansky, L.D. Is All Urban Green Space the Same? A Comparison of the Health Benefits of Trees and Grass in New York City. Int. J. Environ. Res. Public Health 2017, 14, 1411. [Google Scholar] [CrossRef] [PubMed]
  28. Xing, J.; Ding, D.; Wang, S.; Zhao, B.; Jang, C. Quantification of the enhanced effectiveness of NOx control from simultaneous reductions of VOC and NH3 for reducing air pollution in the Beijing–Tianjin–Hebei region, China. Atmos. Chem. Phys. 2018, 18, 7799–7814. [Google Scholar] [CrossRef]
  29. Heckert, M.; Mennis, J. The economic impact of greening urban vacant land: a spatial difference-in-differences analysis. Environ. Plan. 2012, 44, 3010–3027. [Google Scholar] [CrossRef]
  30. Contesse, M.; Vliet, B.J.M.V.; Lenhart, J. Is urban agriculture urban green space? A comparison of policy arrangements for urban green space and urban agriculture in Santiago de Chile. Land Use Policy 2018, 71, 566–577. [Google Scholar] [CrossRef]
Figure 1. Location of Beijing–Tianjin–Hebei (BTH) region, showing the “capital circles” of China, including the 11 cities with more than 110 million people. Data source: China Statistical Yearbook 2017.
Sustainability 10 02949 g001
Figure 2. Distributions of green spaces in the BTH region between 1995 and 2015.
Sustainability 10 02949 g002
Figure 3. Changes in the main green spaces in the BTH between 1995 and 2015.
Sustainability 10 02949 g003
Figure 4. Hotspots of disappeared green spaces in the BTH region between 1995 and 2015.
Sustainability 10 02949 g004
Figure 5. Hotspots of unstable patches of green spaces in the BTH region between 1995 and 2015.
Sustainability 10 02949 g005
Table 1. Codes for land-use/cover types.
TopographyPlainHillLow MountainMedium-High MountainHigh Mountain
Land Use
Cultivated landCPlainCHillCL-mountainCM-mountainCH-mountain
ForestFPlainFHillFL-mountainFM-mountainFH-mountain
GrasslandGPlainGHillGL-mountainGM-mountainGH-mountain
WaterWPlainWHillWL-mountainWM-mountainWH-mountain
Built-up landBPlainBHillBL-mountainBM-mountainBH-mountain
Unused landUPlainUHillUL-mountainUM-mountainUH-mountain
Table 2. Main green spaces in the BTH region between 1995 and 2015.
Green SpaceArea (km2)Percentage of Change (%)
199520002005201020151995–20052005–20151995–2015
CPlain74,45971,61570,66569,81366,376−5.10−6.07−10.86
CHill74767406731872276588−2.11−9.98−11.88
CL-mountain92659164910790708308−1.71−8.77−10.33
CM-mountain17,63217,71717,76817,59817,6730.77−0.530.23
CH-mountain231723232322232622940.22−1.21−0.99
FPlain1025102910181042809−0.68−20.53−21.07
FHill326832773269331632350.03−1.04−1.01
FL-mountain15,63415,68015,68615,68315,6170.33−0.44−0.11
FM-mountain20,68720,73120,72420,75121,3010.182.782.97
FH-mountain390939143917390738590.20−1.48−1.28
GPlain1095911857861493−21.74−42.47−54.98
GHill45434458445444304203−1.96−5.64−7.48
GL-mountain13,53813,51813,48713,46513,353−0.38−0.99−1.37
GM-mountain13,20713,09713,02913,13312,294−1.35−5.64−6.91
GH-mountain35243514350935083557−0.431.370.94
Table 3. Transition matrix of land-use/cover types in the BTH region from 1995 to 2000 (km2).
Topography2000Cultivated LandForestGrasslandWaterBuilt-Up LandUnused Land
1995
PlainCultivated land71,2851001307270957
Forest92916116
Grassland764891201013
Water649113993813
Built-up land12712,998
Unused land8682565699
HillCultivated land72686483898
Forest3931952410
Grassland611544242518
Water36227712
Built-up land21800
Unused land9
Low MountainCultivated land91275518560
Forest415,5685912
Grassland305713,44038
Water36051
Built-up land1627
Unused land93
Medium-high mountainCultivated land17,585219161
Forest420,67553
Grassland883413,082111
Water116751
Built-up land661
Unused land3911218
High mountainCultivated land231061
Forest2389215
Grassland10163498
Water15
Built-up land55
Unused land45
Table 4. Transition matrix of land-use/cover types in the BTH region from 2000 to 2005 (km2).
Topography2005Cultivated LandForestGrasslandWaterBuilt-Up LandUnused Land
2000
PlainCultivated land70,3372858211585
Forest209701335
Grassland7108392431
Water1738440171501
Built-up land86131915,8601
Unused land35152220679
HillCultivated land728214382349
Forest5323417318
Grassland231043941813
Water6968121
Built-up land22924
Unused land27
Low MountainCultivated land901826451758
Forest1815,59063171
Grassland486913,375521
Water203457818
Built-up land311693
Unused land192
Medium-high mountainCultivated land17,59230655178
Forest2820,6505021
Grassland1304612,910461
Water426691
Built-up land21678
Unused land132211203
High mountainCultivated land2305513
Forest239057
Grassland15113488
Water14
Built-up land55
Unused land45
Table 5. Transition matrix of land-use/cover types in the BTH region from 2005 to 2010 (km2).
Topography2010Cultivated LandForestGrasslandWaterBuilt-Up LandUnused Land
2005
PlainCultivated land68,9485132191141627
Forest249656617
Grassland222806621
Water1401043958623
Built-up land65914113516,5322
Unused land182112653
HillCultivated land69613917446971
Forest353158421519
Grassland1319041921823
Water4021157802
Built-up land60871929
Unused land7
Low MountainCultivated land846915437240693
Forest18715,0564082015
Grassland31145812,65612482
Water48101552431
Built-up land55491711
Unused land153191
Medium-high mountainCultivated land16,759273577457044
Forest27220,045391493
Grassland42741112,124172723
Water41121160924
Built-up land42676453
Unused land57423611123
High mountainCultivated land22011995241
Forest283796912
Grassland89923321241
Water4
Built-up land5149
Unused land342
Table 6. Transition matrix of land-use/cover types in the BTH region from 2010 to 2015 (km2).
Topography2015Cultivated LandForestGrasslandWaterBuilt-Up LandUnused Land
2010
PlainCultivated land61,79417460446731722
Forest30952411251685
Grassland196263784616451
Water831536249876144
Built-up land2803263364814,5502
Unused land443653877116
HillCultivated land5870124313778358
Forest1572907111251151
Grassland28214837282920835
Water11033256064244
Built-up land167232448493
Unused land2222
Low MountainCultivated land7402432401767572
Forest20514,512731302005
Grassland48362312,074242592
Water82274142624
Built-up land13020308659
Unused land6376237
Medium-high mountainCultivated land157,296385935355134
Forest35319,63166117872
Grassland111293710,74719171147
Water1114335470913
Built-up land1951140149611
Unused land17341218925734
High mountainCultivated land209152141393
Forest333518344102
Grassland1442843059201
Water4121
Built-up land202334
Unused land2210228

