Article

Ex-Ante Analysis of Economic, Social and Environmental Impacts of Large-Scale Renewable and Nuclear Energy Targets for Global Electricity Generation by 2030

1
Ralph E. Martin Department of Chemical Engineering, University of Arkansas, Fayetteville, AR 72701, USA
2
College of Engineering, Taibah University, Madinah 344, Saudi Arabia
3
Department of Agricultural Economics and Agribusiness, University of Arkansas, Fayetteville, AR 72701, USA
*
Author to whom correspondence should be addressed.
Sustainability 2018, 10(8), 2884; https://doi.org/10.3390/su10082884
Submission received: 20 July 2018 / Revised: 8 August 2018 / Accepted: 10 August 2018 / Published: 14 August 2018

Abstract

:
This study assesses the economic, social and environmental impacts of renewable and nuclear energy targets for global electricity generation by 2030. It examines different regions, as they might experience different impacts depending on the structures of their economies and their local natural resources, to understand the impact of these targets on their economics and well-being of their people. These regions are: Saudi Arabia, the United States (US), China, India, Europe and Rest of World (ROW). A well-known Computable General Equilibrium (CGE) model, the Global Trade Analysis Project (GTAP), is modified and used to predict global economic shifts that would be triggered by two scenarios. The business as usual (BAU) scenario assumes that the current electricity mix remains unchanged until 2030. The Renewable and Nuclear Energy (RNE) scenario is based on the International Energy Outlook (IEO) 2016 prediction. The analysis shows that the GDP value of all regions, except India, is affected negatively. The study shows a loss of 4.45 million jobs worldwide in the RNE compared to the BAU. Finally, the implementation of planned renewable and nuclear energy slightly benefits the environment but not enough to mitigate rise in global temperature.

1. Introduction

Achieving a sustainable development target involves many factors. A sustainable supply of energy resources is one of the crucial factors. As electricity’s growth is the fastest among the end-use energy forms worldwide [1], a transition to renewable power is crucial for achieving sustainability. Many countries are committed to using renewable and nuclear energy to reduce their dependence on foreign petroleum and mitigate their greenhouse gas emissions [2]. The subsequent economic stimulus, environmental preservation, and improvement to social system are pillars of sustainability. Several studies have assessed the renewable energy targets for specific regions separately, e.g., the USA [3], China [4], India [5], Malaysia [6,7], Taiwan [8], Germany [9], Turkey [10,11], The Netherlands [12] and Spain [13,14], or multi-countries, e.g., the Gulf Cooperation Council (GCC) countries [15], South Asian Association for Regional Cooperation (SSARC) countries [16], BRICS countries [17], and European Union (EU) [18,19]. Because country targets might have strong spillover effects into other regions, it is vital to study renewable energy targets on global scale. The shift to renewable and nuclear energy will impact countries’ trade (exports and imports) of raw material, intermediate and final products. The world’s most traded commodities such as oil and natural gas will be affected by this transition to renewable and nuclear energy, which results in sectorial shifts in domestic economies and their interactions through international trade [12]. This work complements the existing literature in three ways. First, from the energy policy point of view, the study analyses the effect of global-scale renewable and nuclear targets on the world with focusing on the four biggest energy consumers and greenhouse gas (GHG) emitters [5]. In addition, the analysis includes the effect of utilizing renewable and nuclear in the world’s largest petroleum exporter, Saudi Arabia [20]. Second, from the mythological point of view, the model and database were modified to provide a more accurate representation of the reality. Third, this includes the methodology that was used to calculate global direct and indirect employment effects.
Different regions might experience different effects regarding the sustainability pillars depending on the structures of their economies and their local natural resources [3]. This study examines the impact of renewable electricity generation targets in Saudi Arabia, the United States (US), China, India, Europe, and rest of the world (ROW) on their economic welfare and the environment. The rationale for choosing these regions is explained in the following paragraphs.
Saudi Arabia is the world’s largest exporter of petroleum and possesses 18% of the world’s proven petroleum reserves. Saudi Arabia’s oil and gas sectors account for about 50% of its gross domestic product (GDP), and for 85% of its total export earnings. It exports seven million barrels per day (MBD) of crude oil, which represents 32% of production of the Organization of the production of the Petroleum Exporting Countries (OPEC), which in turn is responsible for 60% of the total international traded petroleum [20]. The country has a plan for the deployment of renewable and nuclear energy called the King Abdullah City for Atomic and Renewable Energy (K.A.CARE). This plan is driven by the anticipated large growth in electricity demand, which is projected to increase from 69 GW in 2015 [21] to 120 GW by 2032 [22]. Projected population and industrial growth drives this continuing increase in demand, and Saudi Arabia meets its current demand through burning fossil fuels [23]. K.A.CARE’s goal is to source more than half of its generated electricity from non-fossil fuel resources by 2032. The suggested mix is: 45.6% from hydrocarbons, 31.16% from solar, 13.37% from nuclear, 6.84% from wind, 2.28% from waste, and 0.76% from geothermal [22]. It is important to mention that the recent announcement of the Saudi 2030 vision does not mean the abandonment of the K.A.CARE plan. The K.A.CARE program is still a current plan; but it has been managed by the Ministry of Energy, Industry and Mineral Resources (MEIM) [24].
The United States (US) is the largest producer of petroleum products in the world [20]; however, it is a net importer of petroleum products as a result of its high petroleum consumption [25]. Electricity generation accounts for 40% of total energy consumption in the US [26]. In 2017, about 30% and 32% of electricity was produced from coal and natural gas, respectively [27]. Low gas prices as a result of the expansion in production brought by the shale gas revolution, led to this high share of gas-fired power generation [28]. The US is the second largest emitter of greenhouse gases (GHG) in the world after China [29]. An increase in renewable energy use is a measure the US policy-makers take in response to the challenges of climate change and energy security. In the “New Energy for America Plan”, the share of renewable sources used to generate electricity should reach 25% in 2025. The role of renewable source in electricity generation in 2017 was about 17%, hydro and wind were responsible for 7.5% and 6.3% respectively [27]. Solar power is a promising alternative energy source in the US, as its expected average annual growth is 11.7% from 2012 to 2035 [30]. Nuclear energy plays a big role in electricity generation, representing 20% of the electricity mix in 2017 [27], and proposal is being introduced to build new nuclear plants [31].
China, with its rapid economy’s growth, and as the largest energy consumer in the world [28], has become the largest emitter of greenhouse gases (GHG) in the world since surpassing the US in 2007 [32]. In the Paris Accord, China pledged to reduce its emissions and increase its use of renewable resources [33]. Although China relies on coal to generate about 75% of its electricity [1], the country has recently invested in nuclear and renewable sources including hydro, wind, and solar [34]. In addition, demand for coal is projected to slow in the future [35,36]. Due to ambitious government efforts, China has become the world’s leader in both hydro and wind energy [37]. China is the largest generator of hydropower worldwide, providing about a quarter of the world’s total generated hydropower [37], which represents about 18% of the Chinese generated electricity [1]. The wind capacity has increased over a hundredfold in the last decade, making China the world’s fastest-growing wind energy market [37]. The country is also the largest manufacturer of photovoltaic cells in the world [37]. Despite the phase-out policy that several countries have adopted after the Fukushima nuclear accident, China remains committed to nuclear power expansion. The country has reached self-sufficiency in nuclear reactor engineering [37].
India is the second fastest growing economy after China [38], the fourth largest oil and petroleum consumer, and the fourth largest oil importer in the world [39]. Thus, in India there is a huge demand for energy, which is currently met by coal and imported oil and gas. India is the sixth largest and second fastest GHG emitter in the world driven by a growth in coal consumption. Among the 10 most polluted cities in the world, three are in India [40]. The country is fortunate to have a variety of renewable energy resources, and has plans to implement the world’s largest renewable energy program [38]. In 2012, renewable energy supplied 18% of India’s needed electricity, mostly coming from hydropower that represented 12% of the generated electricity [1]. The contribution of wind power was about 3% [1], and the country occupies the 5th place in global wind power generation [38]. Most regions in India receive between 4–7 kWh per square meter per day of solar radiation, which creates an incentive for the country to invest in solar energy [41]. Regarding nuclear power, India has a modest level of installed nuclear energy (2.85% of its electricity mix in 2012 [1]) and Indian policy-makers have shown an interest in the role the nuclear energy could play in further boosting India’s economic growth [42].
Among the global total installed capacity of renewable energy in 2012 (1440 GW), about 22% was located in the European Union (EU) [43]. This is a response to EU’s fuel taxes, which are the highest worldwide [44]. In 2012, the shares of renewable and nuclear electricity in the EU were 25% and 21.74%, respectively. Among renewables, the share of hydropower was the largest at 16%, followed by wind (4.15%) [1,43]. The EU set a target in 2014 to increase its share of renewable energy to at least 27% by 2030 [18,45]. Nuclear energy is declining as an electricity source in Europe [45]; its share will decrease as some countries intend to phase this source out, but it will not be totally eliminated [46].
The EU’s leadership in renewable energy has raised concerns in Europe about whether it would lead to green growth or erode the European competiveness in the global economy [47,48]. Thus, to measure the economic effects of implementing renewable energy, a global computable general equilibrium (CGE) model GTAP-E was used in this study. As the power sector is crucial for mitigating climate change, we model the planned electricity mix, including its renewable energy targets for 2030, and compare them to a business-as-usual model, where the current electricity composition is used to meet the growing demand until 2030. The aim of this work is to understand the long-term economic, social and environmental impacts of the projected global implementation of renewable energy. The remainder of this paper is organized as follows: Section 2 provides a description of the model and database, and the simulation scenarios; Section 3 presents the economic, social and environmental results; and the final section presents a discussion of the main results and conclusions.

2. Methodology and Scenario Design
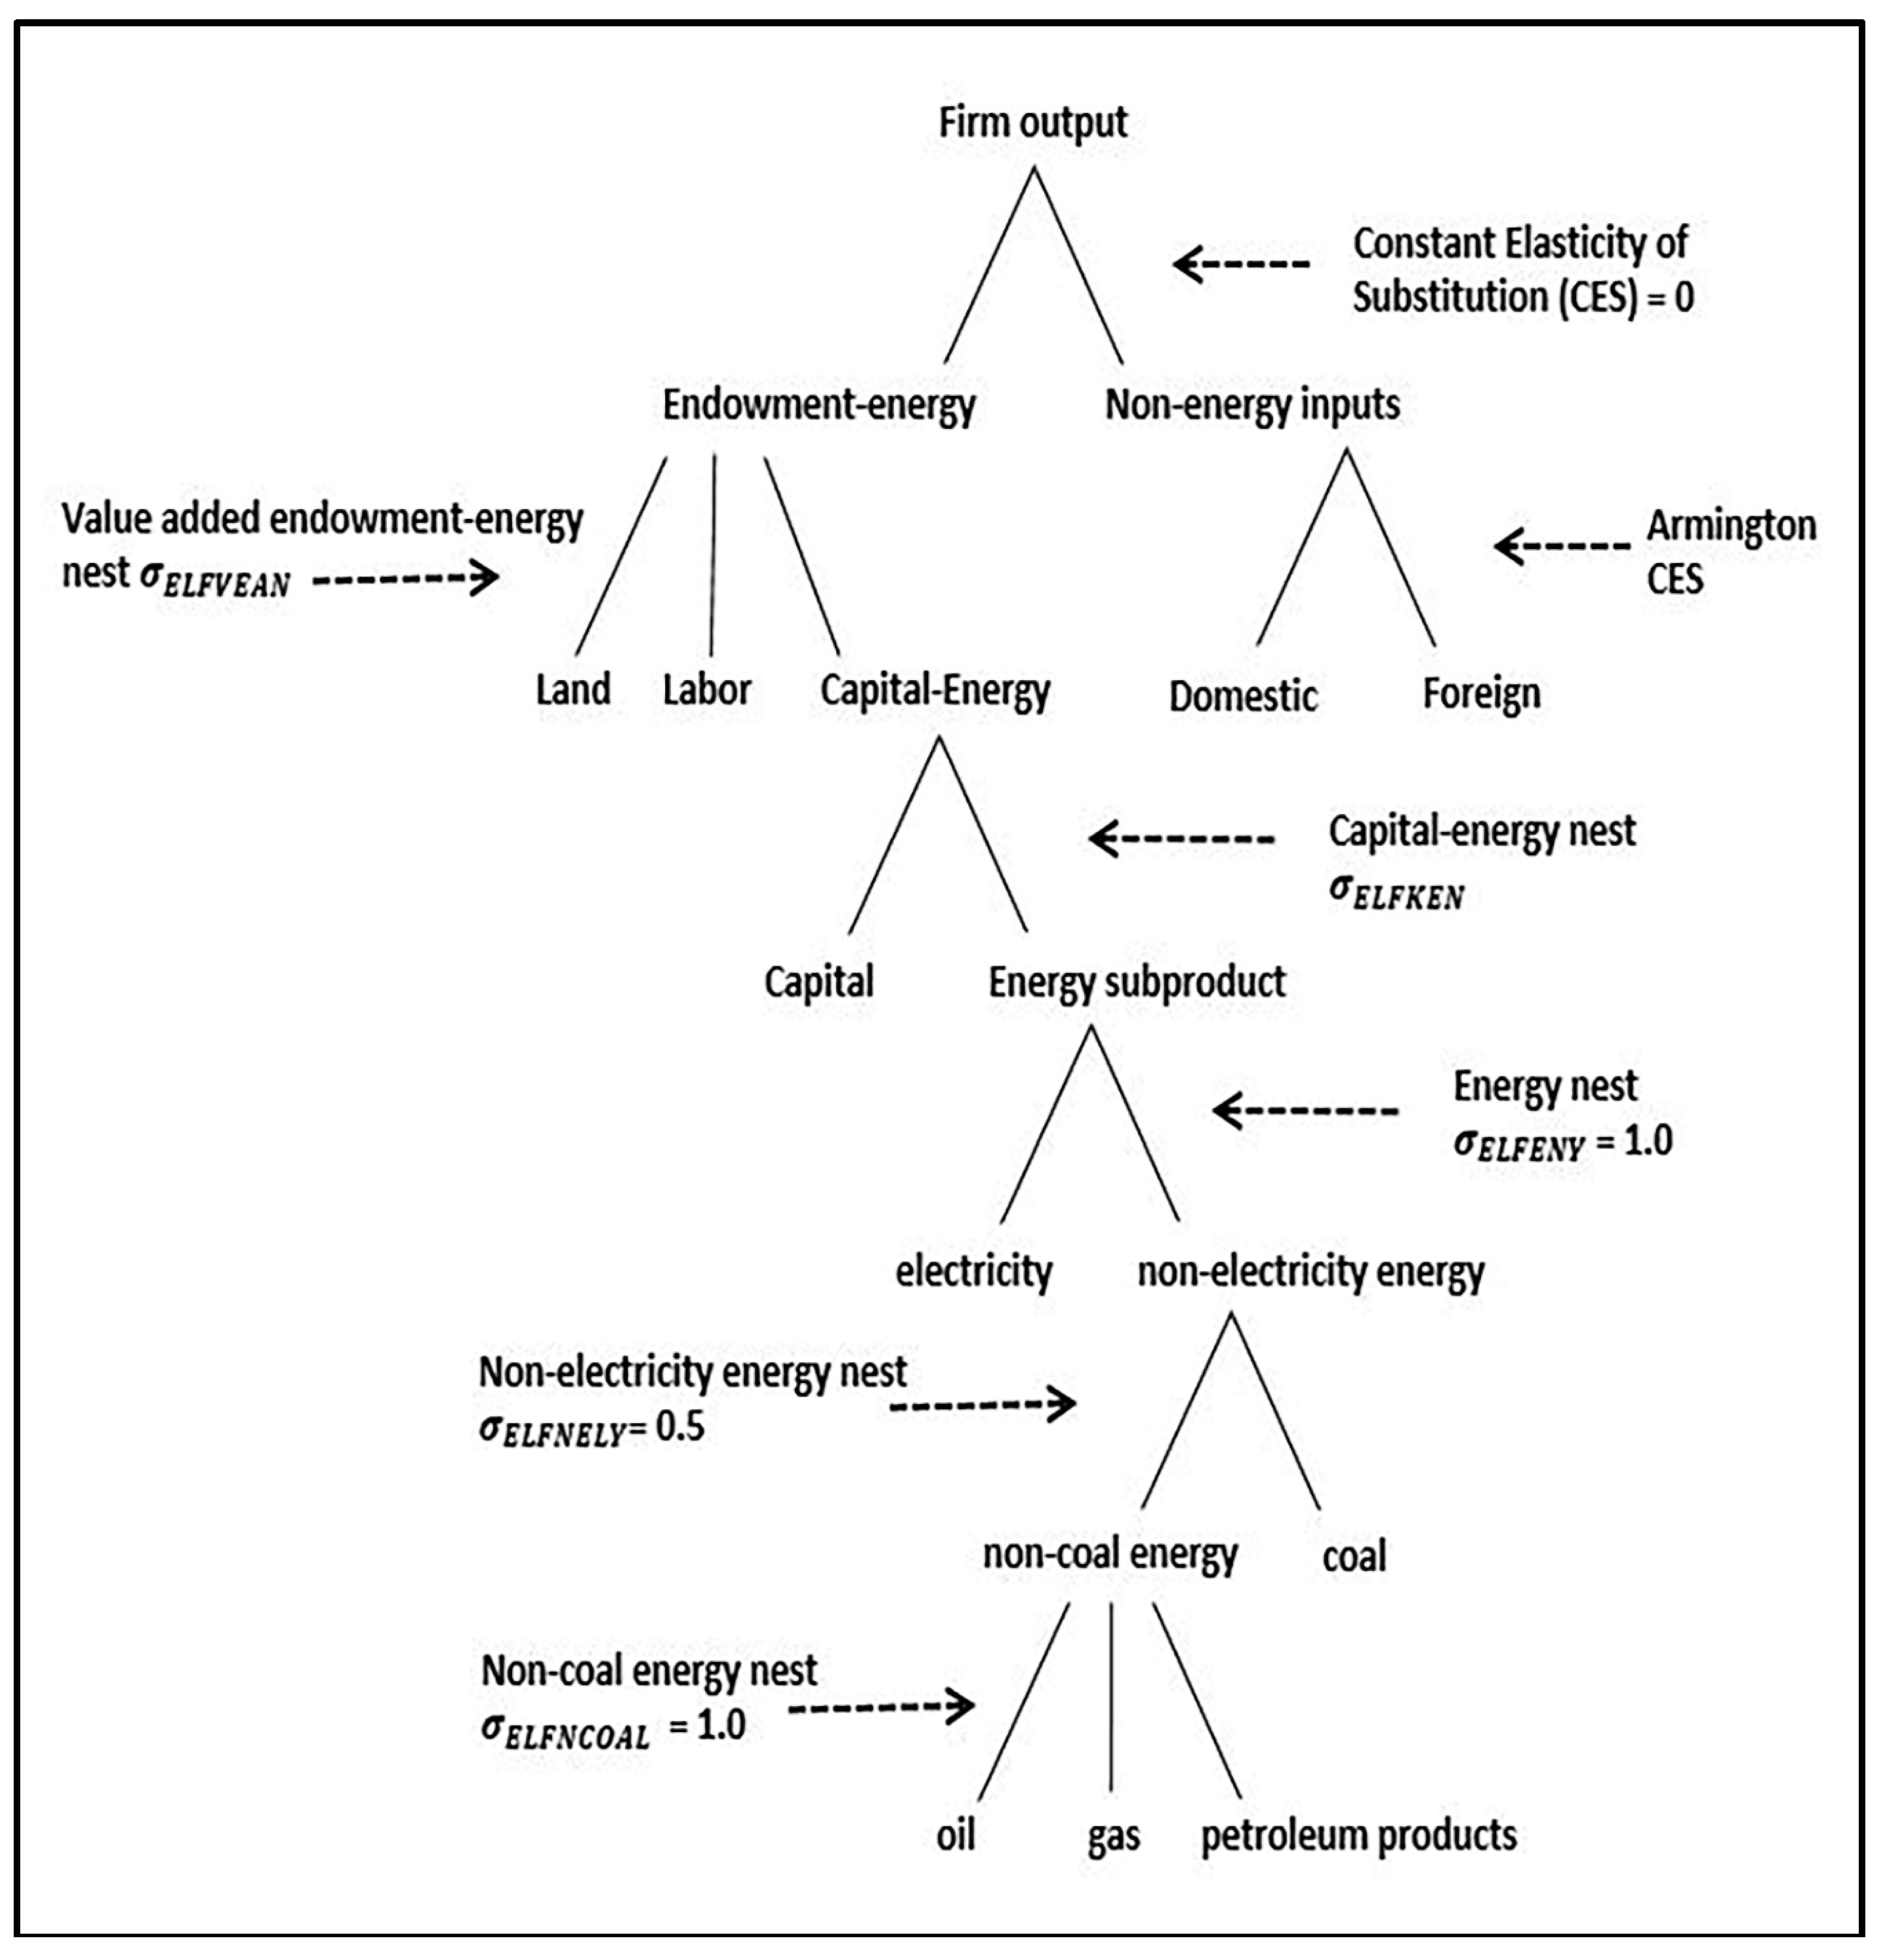
2.1. GTAP-E Model

We use the GTAP-E model [49], an energy-environmental version of the CGE GTAP Model [50], to assess the impact of the implementation of the projected renewable and nuclear energy plans in selected countries/regions. The model specifies the behavior of government and private household in each region as rational agents maximizing utilities. All the regional income is collected by a regional household and exhausted in government, private household and saving expenditures according to a Cobb-Douglas utility function. The sources of income for the regional household includes taxes and returns to factors of production (labor, capital, land, and natural resources). A combination of the factors of production and intermediate inputs is used by firms to produce a final good. The profit maximization objective, subject to a constraining production function, governs the behavior of firms. A Cobb-Douglas function determines the demands of the government, while a constant difference of elasticity function governs the demands of private households. The constant difference of elasticity is nonhomotheteic, which means the consumers change their spending share on luxury goods vs. necessities as their income changes. This is based on the income elasticity for each good [51]. The private household’s demand for commodity i in region r is defined as:
qp(i,r) = pop(r) + sum(k,COMM, EP(i,k,r) × pp(k,r)) + EY(i,r) × [yp(r) − pop(r)]
where pop(r) represents population growth, EP(i,k,r) is uncompensated cross-price elasticity of private household demand for tradable commodity i with respect to commodity k in region r, EY(i,r) is income elasticity of private household demand for commodity i in region r, pp(k,r) is the private household’s demand price for commodity k in region r, and yp(r) is regional private consumption expenditure in region r. Bilateral trade is specified following Armington [52]; it differentiates the goods by their origin, which allows for their export and import ratios to change. The allocation of private household’s demands (qp) between domestic products and imports is defined according to the following equations:
qpd(i,s) = qp(i,s) + ESUBD(i) × [ppt(i,s) − ppd(i,s)]
qpm(i,s) = qp(i,s) + ESUBD(i) × [ppt(i,s) − ppm(i,s)]
  • qpd is private consumption demand for domestic goods;
  • qpm is private consumption demand for aggregate imports;
  • ppt is private consumption price for composite commodities.
See Hertel [50] for more details on the GTAP model.
GTAP-E is an extension of the GTAP model that incorporates a more detailed specification of the energy sector and, therefore, is well suited to assess changes in energy markets [49,53]. This study uses the GTAP 9 database, in which the global economy in year 2011 is represented for 140 countries and 57 GTAP commodity sectors [54]. The database has all renewable and nuclear energy technologies aggregated in one sector (electricity). Disaggregated electricity technologies were imported from the GTAP-POWER database [55]. Then, as shown in Appendix A (Table A1 and Table A2), the database was aggregated into 6 countries/regions and 19 commodities. In addition, since the share of renewable and nuclear energy for Saudi Arabia was zero in the database, small shares were artificially introduced as recommended by The General Equilibrium Model for Economy-Energy-Environment (GEM-E3) [56]. That allows us to exogenously increase their contribution until the Saudi Arabia’s goal in 2030 is met. For the model, the factors of production and intermediate inputs are used by firms to produce final goods according to nested constant elasticity of substitution functions (Figure 1). The non-coal energy sources (crude oil, gas and petroleum products) were bundled in one nest to allow substitution between them according to a substitution elasticity of σ E L F N C O A L (elasticity of substitution in non-coal energy subproduction), as shown at the bottom of Figure 1. The non-electricity energy nest is made from the non-coal energy nest bundled with coal according to the substitution elasticity of σ E L F N E L Y (elasticity of substitution in non-electricity energy subproduction). With a substitution elasticity of σ E L F E N Y (elasticity of substitution in energy subproduction), the energy nest consists of a bundle of the non-electricity nest and the aggregated electricity sector. The capital-energy nest is made by a combination of energy nest and capital with substitution elasticity of σ E L F K E N (elasticity of substitution in capital-energy subproduction). In addition, the capital-energy nest is bundled with the other endowments with substitution elasticity of σ E L F V E A N (elasticity of substitution in value-added-energy subproduction) to make the endowment-energy nest. According to a Leontief technology (zero substitution), the endowment-energy nest and the non-energy inputs are combined to form the firm output. Taking the non-coal energy nest as an example, the firm’s demand equation for commodity i in sector j, in region r is the following:
qf(i,j,r) = −af(i,j,r) + qf(“ncoal”,j,r) − ELFNCOAL(j,r) × [pf(i,j,r) − af(i,j,r) − pf(“ncoal”,j,r)]
where,
  • qf is demand for inputs into non-coal energy sub-production;
  • af is sector/region specific rate of factor i augmenting technology change;
  • ELFNCOAL is elasticity of substitution in non-coal energy sub-production;
  • pf is price of non-coal energy.
An important modification for the GTAP-E model, the addition of two new nests, was made to enable the use of renewable and nuclear technologies as shown in Figure 2. The first nest consists of the electricity technologies (Technologies) and the distribution and transmission sector (TandD) with a substitution elasticity of zero, as suggested in the literature [56,57,58]. The Technologies nest, with a substitution elasticity of 5 as suggested by the OECD ENV-Linkages Model Version 3 [59], includes eight new electricity producing technologies (elyoil, elygas, elycoal, wind, nuclear, solar, hydro, and elyother). For the details of the model’s modifications, see Appendix B.

2.2. Technological Improvement

In addition to the fuels’ availability and costs [60], the energy technologies’ development plays a vital role in the future energy systems [61]. Technological improvement was taken into account as an input for the GTAP-E model for each type of electricity technology. To simulate this, the model accounts for the reduction of the input requirements to produce a given commodity (electricity in our case); the cost of production for each electricity technology thereby decreases. One of the most common methods to inform energy planning and policy analysis regarding the potential effects the technical changes have in the large scale energy-economic models is the learning rate method [62]. It predicts how the cost of technology declines with cumulative production [62,63,64]. For mature and prevalent technologies like fossil fuels and nuclear power plants, the rate of technological improvement is not high [62,64]. Literature shows that the solar and wind energy sectors have the highest costs reduction as they are the fastest growing energy subsectors worldwide [62,64]. For hydropower plants and as a result of nature conservation compensating measures, the learning rate is negative, indicating increasing in cost [64]. For this study, the projected learning rates of the electricity technologies for 2030 were obtained from literature and shown in Appendix A (Table A3) [61,63,64,65].

2.3. Scenario Description

Two scenarios were developed: the business as usual scenario (BAU) assumes that the current electricity mix remains unchanged until 2030, and the renewable and nuclear energy scenario (RNE), which incorporates many of the IEO2016 predictions and updated renewable energy and CO2 mitigation targets [1]. To estimate the state of the global economy in 2030, projected changes in selected exogenous variable were obtained from different sources. The estimation of global population growth comes from the U.S. Census Bureau [66]. Estimates from the literature [66,67] were used to obtain the projected growth of the gross domestic product (GDP) and capital. Estimates of labor growth projections come from the International Labor Organization (ILO) [68]. Three factors were considered by the US Energy Information Administration (IEA) in their IEO2016 prediction. The first is data on the countries and their previous successes in meeting what they had planned; the second is indicators about each country’s financial capabilities in meeting their targets; and the third is market pricing assessment to support renewable energy. The developed BAU and RNE electricity mix scenarios for each region are shown in Figure 3a,b (the absolute values of electricity production mix are shown in Appendix A (Table A4). Figure 4 shows the shares of world electricity generation in both of the BAU and RNE scenarios. Electricity generated from oil is 61% lower; its share of total generation is 4.64% in the BAU scenario, and 1.78% in the RNE scenario. For natural gas electricity generation, it is higher by 17.77% in the RNE scenario compared to the BAU; its share of total electricity generation is 19.93% in the BAU, and 23.48% in the RNE. That calls attention to the relationship between renewable energy (mainly wind and solar) and the gas generation technologies, which are considered as fast-reacting fossil technologies. This relationship helps to overcome the supply variability problem of renewable energy resulting from its intermittency and non-dispatchability, especially with the current lack of cheap storage options. A recent study published by the National Bureau of Economic Research looked at the growing of renewable energy plants in 26 countries for more than two decades; it reports that for a long run a 1% increase in the share of fast-reacting fossil technologies with each 0.88% increase in the share of renewable energy [69]. The share of world coal electricity generation is 43.11% in the BAU, and 33.07% in the RNE; it is lower by about 23.29%. Nuclear power is higher by 33.59%; while the hydropower is lower by 9.64% in the RNE compared to the BAU. Wind, solar and others power generation are higher by 165.74%, 413.48% and 90.7%, respectively. According to the learning rate method, the technological improvements are higher in the RNE than the BAU scenario. Table 1 summarizes the two scenarios.
The social impact is considered through accounting the employment effects of the two scenarios. The study considers both direct and indirect employment. Direct jobs are those created in the electricity technologies sectors. To calculate the direct jobs for each technology, the employment factors (the number of jobs per unit of electricity capacity for each type of electricity production technology) estimated by Institute for Sustainable Futures are used. These are taken from a report about a methodology for calculating global energy sector jobs [70]. Indirect jobs are the ones induced by the changes in the electricity sectors and created in other sectors. They are calculated by dividing the labor endowment payment of each sector in the database by the average salary of each region for the available sectors to estimate the number of laborers. Then, the number of laborers is multiplied by the simulation’s predicted fractional change in the labor quantity to predict the number of laborers in future. Different sources were used to provide estimates for each region’s average salaries [71,72,73,74,75,76,77].

3. Results

The simulated economic, social and CO2 emission impacts of implementing the renewable and nuclear energy (RNE) scenario for each region are presented in this section. Unless specified otherwise, the results are expressed as the difference between the RNE and BAU scenarios.
Table 2 presents the percentage change in GDP’s components and total GDP in the RNE compared to BAU scenario. It is no surprise that economies that are heavily reliant on oil, like Saudi Arabia’s economy, are affected the most as a result of the utilization of more renewable and nuclear energy, which leads to lower oil prices. Compared to the BAU, Saudi spending on investment in the RNE is reduced by about 27%, which reflects the recent situation in Saudi Arabia, where some projects have been postponed or cancelled as a result of the recent global decline in oil prices. European investment and government spending are the second most affected. This is because the EU’s tax on oil is the highest, and lower oil prices mean less revenue for the government, which affects investment. For the USA, India and the ROW, exports, in the RNE compared to the BAU, fall because of reduced demand for their top exports, e.g., petroleum products (oil_pcts), and energy intensive industries (En_Int_ind). China’s imports decrease as a result of a decline of the price of its oil imports, which represents about 10% of its imports. Regarding consumption, the regions with higher shares of electricity technologies (especially renewable) in their consumption structure are affected the most. India shows positive consumption as electricity occupies a small share of the country’s consumption structure.
Figure 5, Figure 6, Figure 7, Figure 8, Figure 9 and Figure 10 show the difference between the two scenarios (RNE compared to the BAU) for each region in regard to sectoral output, commodity prices, direct and indirect jobs. In the USA, for the sectorial output, coal mining and oil extraction are unsurprisingly the most affected sectors; their outputs are 5.89% and 5.43% lower, respectively. The second most affected sectors are the energy intensive industries, and refined petroleum products (oil_pcts), which are lower by 3.32% and 1.57%, respectively. Conversely, the water and construction (water_Cons) sector, which includes the construction industry, shows a positive impact, as there is a large increase in wind, solar and other electricity technologies; and their requirement for the construction sector is the highest among the other required intermediate inputs. Capital goods (CGDS) are mainly affected by construction and investment; the increase in construction overcomes the small decrease in investment (Table 2). The other industry, which include electronic and machinery equipment, is affected positively as it includes upstream renewable energy industries. For the commodity prices, the decline in the prices of energy commodities pushes down the energy costs of other sectors, which leads to a reduction in their prices. The RNE scenario creates more jobs for the USA than the BAU by about 10,000 direct jobs and 144,000 indirect jobs.
In Saudi Arabia, the GDP decrease is a result of a decrease in investment, consumption, and government spending, which leads to output reduction in most sectors. It is eye-catching that the output of the oil sector is increasing even with the declining use of oil to generate electricity in Saudi Arabia and other regions, and the decline of most sectors’ output in Saudi Arabia. The reason is that the Saudi oil exports increase by 5.5% as a result of large declines in other regions’ oil production. Similarly, the gas sector and its export increase as a result of higher demand for gas worldwide. The coal output shows a relatively large decrease, but the base value is small since Saudi Arabia is not known for coal use making small absolute changes appear as a large percent change. The large decrease in investment (Table 2) leads to a decline in the construction sector output, and subsequently a decline in capital goods (CGDC). This finding is consistent with “The Impact of Decreasing Oil Prices on the GCC RHC Market” report [78], which says that the slumping oil prices have affected the Gulf Cooperation Council (GCC) countries through lowering government revenue, which in turn has affected spending plans and construction. The other industry (other_ind), which includes electronics and machinery, shows some gain as it includes upstream renewable energy industries. For the commodity prices, as in USA and other regions, the cheaper energy commodities push down the production costs of other sectors and their prices. About 27,000 direct jobs are created and 100,000 indirect jobs are lost in the RNE scenario compared to BAU.
Regarding Europe, as in Saudi Arabia, the GDP decrease led to output decreases in most sectors, and the decline in capital goods (CGDC) results from a decline in construction caused by the relatively large decrease in investment (Table 2). The rise of the gas sector output is a result of an increase in the electricity generated from gas. The large decrease of the generated electricity from coal and oil leads to a large reduction of their outputs. As Europe is a net exporter of the outputs from energy intensive industries (En_Int_ind) and other industries (other_ind), cheaper energy prices increase its exports of these commodities; in addition, the increased use of renewable energy increases the output of other_ind. Commodity prices go down as a result of cheaper energy. Finally, employment is affected as the RNE scenario causes a loss of about 55,000 direct jobs and 477,000 indirect jobs compared to the BAU.
In China, the increase of investment (Table 2) leads to an increase in construction and capital goods (CGDS). The small reduction of GDP in the RNE compared to the BAU results from the large reduction of coal mining and electricity generation from coal, especially considering that China is the biggest producer and consumer of coal worldwide. However, in general there are increases in all sectors’ outputs except coal and oil. Gas rises the most, as there are large increases in electricity generated from gas, and energy intensive industries (En_Int_ind), including in the petrochemical industry. This matches a study about the impact of falling oil prices on the major oil producing and consuming countries [79]. As China’s oil imports increase by 13%, the output of the petroleum products sector (oil_pcts) increases by 6.63%. For the commodity prices, cheaper energy reduces the prices in all sectors, except for services (othservices) and communication (transcomm) as they are capital and labor intensive, and the prices of these two endowments increase in China and India. Finally, China loses about 6200 direct jobs and 1,165,000 indirect jobs, as a result of the RNE scenario compared to BAU. Most of the employment loss is in the energy intensive industries (En_Int_ind), coal, and other industries (other_ind) sectors. It is clear that the decreasing use of coal to generate electricity is behind the loss in employment in the coal sector. For energy intensive industries (En_Int_ind) and other industries (other_ind) sectors, the substitution of capital for labor explains the reduction of employment even with higher outputs. In general, China, India and, to a lesser extent, ROW, have higher endowment substitution parameters than other regions. The prices of labor and capital rise and fall, respectively, as a result of low population growth and high capital growth. This leads to the substitution of capital for labor, which is shown clearly in those sectors as they have the highest endowment substitution parameters.
For India, there is a small increase of GDP as a result of increased consumption and government spending, as well as the increase use of renewable and nuclear sources to generate electricity. In addition, the reduced use of fossil fuels to generate electricity leads to a decrease in the output of their extraction sectors. All of this leads to a small increase in construction and capital goods (CGDS). The outputs of energy intensive industries (En_Int_ind) and other industries (other_ind) sectors decrease for two reasons. The first is the large reduction in the fossil fuel sectors and associated electricity generated. The second is the increase of their imports, especially in the energy intensive industries (En_Int_ind), other industries (other_ind), which have the highest Armington parameters in comparison to the other sectors in India. For the commodity prices, as in China, the prices of all sectors are reduced by cheaper energy, except for services (othservices) and communication (transcomm), as they are capital and labor intensive. Finally, employment is affected, as India will lose about 30,900 direct jobs and 942,000 indirect jobs in the RNE compared to the BAU.
Regarding ROW, the increase of construction and capital goods (CGDS) is a result of the small investment increase (Table 2). The reduction of the electricity generated from coal and oil impacts their extraction’s sectors. Despite the increase in electricity generated from gas, its output decreases because ROW increases their imports of gas by 21% in the RNE scenario compared to the BAU as the Armington parameter for the gas sector is the largest. For the commodity prices, all sectors’ prices are reduced as a result of cheaper energy, except for gas, whose price increases as demand rises. Finally, ROW loses about 106,000 direct jobs and 1,748,000 indirect jobs in the RNE compared to the BAU.
Economic welfare, measured in GTAP by equivalent variation, summarizes the overall effects of changes in trade on the well-being of the regions. As welfare is related to trade, the changes in export and import have a big effect on welfare. The best measure of these changes is “terms of trade”, which is defined as the purchasing power of the country’s exports for imports [51]. In other words, an improvement in terms of trade means that the country can buy more imports for each unit it sells of exports. Table 3 summarizes the results of welfare and terms of trade for all the regions. Economic welfare worsens in Saudi Arabia as its export earnings are reduced by the fall in the price of oil, which represents about 85% of its total export earnings; this in turn lowers its terms of trade. The USA’s welfare and terms of trade improve because the price reduction of its main exports (energy intensive industries [En_Int_ind], other industries [other_ind], and services [othservices]) is less than the price reduction of its main imports (other industries [other_ind], energy intensive industries [En_Int_ind], and Oil), when we compare the RNE to BAU scenario. European welfare and terms of trade are worsened by the larger price reduction of its main exports compared to its imports, when we compare the two scenarios. The main European exports are energy intensive industries (En_Int_ind), other industries (other_ind), and services (othservices); and their price changes are −4.86%, −3.2% and −2.42%, respectively. These commodities are also the main imports, and their price changes are −4.62%, −2.7% and −1.79%, respectively. For China, its welfare and terms of trade improve because the price reduction of its main export, other industries (other_ind), is less than the import prices. Other industries (other_ind) represent about 76% of China’s exports and about 42.4% of its imports. Its welfare and terms of trade improve because the price reduction of other industries (other_ind) (−1.38%) is less than in its imports (−2.22%); this is in addition to the reduction of the price of oil, which is one of the main imports for China. The situation in India is similar to China; where the exports prices are affected by less than in its imports.
Regarding the CO2 emissions, all regions show a reduction as they reduce their use of coal and oil to generate electricity (Table 4). Saudi Arabia shows a relatively large decrease (considering the size of its economy to other regions) in its emissions, this is caused by the reduced use of oil to generate electricity, in addition to the smaller increase in most sectors’ outputs in the RNE scenario. For USA and Europe, a smaller decrease is seen as their reduction of fossil fuels to generate electricity is less than others. The larger reduction of coal to generate electricity drives the large reduction in CO2 emission in China and India.
The BAU scenario is responsible for the addition of approximately 15.98 GtC (CO2 emissions). This follows the A1FI scenario based on the earlier projections that were developed by the Intergovernmental Panel on Climate Change (IPCC) in its 4th assessment report in 2007 [80], and higher than the business as usual RCP 8.5 scenario (14.53 GtC) of the 5th and most recent IPCC’s assessment report in 2013 [81]. The RCP 8.5 is comparable to the A2 scenario of IPCC 2007 [82]. The A1FI describes the fossil fuel intensive future world, where the economic growth is a very rapid, population peaks in the mid-century and more efficient technologies are introduced rapidly [80]. According to the RCP 8.5 scenario, the CO2 concentration reaches 448.8 ppm and global average temperature increases by 0.94 °C relative to the 1986–2005 reference period, to reach approximately 1.55 °C global mean surface temperature change in 2030. On the other hand, the RNE scenario is responsible for the addition of approximately 14.73 GtC, which follows a level between the A1FI and A1B of the 2007 IPCC’s predicted scenario, and still higher than the business as usual RCP 8.5 scenario. The A1B describes a similar future world for A1FI but without the intensive fossil fuel sources, instead a balance between all energy sources. According to that (the A1B scenario), the CO2 concentration reaches 448 ppm and global average temperature increases by the same amount 0.82 °C relative to 1986–2005 reference period to reach approximately 1.43 °C global mean surface temperature change in 2030 [81]. More emission reductions will be needed to fulfill the Paris agreement goals of limiting the global average temperature rise to well below 2 °C target [83]. To achieve this, the emission should be reduced to be 10.9 GtC by 2030 [84]. That will be a situation falls between RCP 2.6 and RCP 4.5 scenarios; and a global average temperature increases by 0.78 °C relative to 1986–2005 reference period to reach approximately 1.39 °C global mean surface temperature change in 2030.

4. Conclusions

This study assessed the economic, social and CO2 emission impacts of implementing the planned renewable and nuclear power in 2030 based on IEO prediction. Depending on the structures of their economies and their local natural resources, regions react differently. Thus, different regions with different economic structures were examined. These regions are: Saudi Arabia, the United States (US), China, India, Europe and ROW. The analysis shows that the GDP value of all regions, except India, is negatively affected; especially for Saudi Arabia because oil prices decrease as a result of the expansion of renewable energies. Regarding sectorial outputs, the upstream industries for the coal and oil electricity technologies, like coal mining and oil extraction, are the most negatively affected sectors. Conversely, the upstream industries of the renewable and nuclear power are positively affected. There is, in general, a reduction in commodity prices, resulting from declines in the energy prices; except for services (othservices) and communication (transcomm) in China and India, as they are capital and labor intensive.
Regarding employment, the study shows a loss of 4.45 million jobs worldwide in the RNE compared to the BAU. Economic welfare worsens most in Saudi Arabia as its exports earnings are reduced by the lower price of oil. Thus, for countries with economies that are heavily reliant on fossil fuels, it is important to reduce their dependence on fossil fuels by diversifying their economies. In Europe and ROW, a deterioration in economic welfare is shown. An improvement of economic welfare is shown in the other regions. As the regions with higher shares of electricity technologies in their consumption structure are affected the most, targeting the reasons causing the massive energy demand will be helpful. That can be done by improving the efficiencies of electric appliances, and enhancing the building codes. The implementation of planned renewable and nuclear energy slightly benefits the environment but not enough to mitigate rise in global temperature and to fulfill Paris Agreement. Thus, issuing policies to force the utilizing of more renewable energy are required, without forgetting not to harm the wellbeing of the private household by incentivize the switch to the renewable sources. Examining the magnitude of gain and loss of the targeted renewable electricity of multiple regions with their different economic structure and their local natural resources on the three sustainability pillars (economy, environment and social system) is the main scope of our work; and we believe that the results of this work could be used by policy makers as a rationale to introduce new fiscal policy.
It is important to mention that using a path dependent dynamic model, e.g., dynamic GTAP, would provide, with respect to wealth accumulation, capture the effect of the partial adjustment treatment of the capital stock, and the adaptive expectations treatment of the expected rate of return and the normal growth rate [85]. However, GTAP-E is not built dynamically and introducing this feature to the modeling was beyond the scope of this study. Thus, our results implicitly assume a proportional accumulation of wealth and behavior of capital stocks across all regions and time. This is a limitation of this study and planned future area of research.

Author Contributions

Conceptualization, K.A., G.T. and A.D.-M.; Data curation, K.A.; Formal analysis, K.A.; Investigation, K.A., G.T. and A.D.-M.; Methodology, K.A., G.T. and A.D.-M.; Resources, G.T.; Software, K.A., G.T. and A.D.-M.; Supervision, G.T.; Validation, K.A., G.T. and A.D.-M.; Visualization, K.A.; Writing—original draft, K.A.; Writing—review & editing, G.T. and A.D.-M.

Funding

This research received no external funding.

Acknowledgments

This study was supported by the ministry of higher education in Saudi Arabia through Taibah University. Any opinions, findings, recommendations and conclusions expressed herein are those of the authors and are not necessarily those of the Ministry of Higher Education.

Conflicts of Interest

The authors declare no conflict of interest.

Appendix A

Table A1. Aggregations of GTAP-E regions.
GTAP-E RegionMember Countries
KSASaudi Arabia
USAUnited States
EUROPEAustria, Belgium, Cyprus, Czech Republic, Denmark, Estonia, Finland, France, Germany, Greece, Hungary, Ireland, Italy, Latvia, Lithuania, Luxembourg, Malta, The Netherlands, Poland, Portugal, Slovakia, Slovenia, Spain, Sweden, United Kingdom, Switzerland, Norway, Rest of EFTA, Albania, Bulgaria, Belarus, Croatia, Romania, Russian Federation, Ukraine, Rest of Eastern Europe, Rest of Europe
CHINAChina
INDIAIndia
ROWAustralia, New Zealand, Rest of Oceania, Hong Kong, Japan, Korea Republic, Mongolia, Taiwan, Rest of East Asia, Brunei Darussalam, Cambodia, Indonesia, Lao People’s Democratic Republic, Malaysia, Philippines, Singapore, Thailand, Viet Nam, Rest of Southeast Asia, Bangladesh, Nepal, Pakistan, Sri Lanka, Rest of South Asia, Canada, Mexico, Rest of North America, Argentina, Bolivia, Brazil, Chile, Colombia, Ecuador, Paraguay, Peru, Uruguay, Venezuela, Rest of South America, Costa Rica, Guatemala, Honduras, Nicaragua, Panama, El Salvador, Rest of Central America, Dominican Republic, Jamaica, Puerto Rico, Trinidad and Tobago, Caribbean, Kazakhstan, Kyrgyzstan, Rest of Former Soviet Union, Armenia, Azerbaijan, Georgia, Bahrain, Iran, Israel, Jordan, Kuwait, Oman, Qatar, Turkey, United Arab Emirates, Rest of Western Asia, Egypt, Morocco, Tunisia, Rest of North Africa, Benin, Burkina Faso, Cameroon, Cote d’Ivoire, Ghana, Guinea, Nigeria, Senegal, Togo, Rest of Western Africa, Central Africa, South Central Africa, Ethiopia, Kenya, Madagascar, Malawi, Mauritius, Mozambique, Rwanda, Tanzania, Uganda, Zambia, Zimbabwe, Rest of Eastern Africa, Botswana, Namibia, South Africa, Rest of South African Customs Union, Rest of the World
Table A2. Aggregations of GTAP-E sectors.
GTAP-E SectorDescriptionComprising
AgriFoodAgriculture, forestry,& fishingPaddy rice, Wheat, Cereal grains nec, Vegetables, fruit, nuts, Oil seeds, Sugar cane, sugar beet, Plant-based fibers, Crops nec, Bovine cattle, sheep and goats, horses, Animal products nec, Raw milk, Wool, silk-worm cocoons, Forestry, Fishing
CoalCoal miningCoal
OilOil extractionOil
gasGas extraction & distributionGas, Gas manufacture, distribution
oil_pctsPetroleum productsPetroleum products
En_Int_indEnergy intensive industriesMinerals nec, Chemical, rubber, plastic products, Mineral products nec, Ferrous metals, Metals nec
other_indother industriesBovine meat products, Meat products nec, Vegetable oils and fats, Dairy products, Processed rice, Sugar, Food products nec, Beverages and tobacco products, Textiles, Wearing apparel, Leather products, Wood products, Paper products, publishing, Metal products, Motor vehicles and parts, Transport equipment nec, Electronic equipment, Machinery and equipment nec, Manufactures nec
water_ConsWater and ConstructionWater, Construction
TranscommTransport and CommunicationTrade, Transport nec, Water transport, Air transport, Communication
OthServicesOther ServicesFinancial services nec, Insurance, Business services nec, Recreational and other services, Public Administration, Defense, Education, Health, Dwellings
TandDtransmission & distributionElectricity transmission & distribution
elygasElectricity from gasGas base and peak load
elyoilElectricity from oilOil base and peak load
elycoalElectricity from coalCoal base load
nuclearElectricity from nuclearNuclear base load
windElectricity from windWind base load
hydroHydroelectricHydro base and peak load
solarElectricity from solarSolar peak load
elyotherElectricity from othersOther base load
Table A3. Projected learning rates of the electricity technologies for 2030.
Electricity TechnologyLearning Rate
Solar0.11
Wind 0.06
Nuclear0.058
Hydro−0.1
Others0.136
Learning rate of 0.1 means a cost fall by 10% when the cumulative production doubles.
Table A4. The absolute values of electricity production mix in 2030.
Billion kWh
SAUDI ARABIACHINAINDIA
BAURNEBAURNEBAURNE
elyoil257.9175.81063920
elyGas164.960.0138647164111
elyCoal0.00.06092435314071087
nuclear0.082.715875456206
hydro 0.00.014541234234287
wind0.012.716359252130
solar 0.072.110218485
others 0.019.476297940
USAEUORPEROW
BAURNEBAURNEBAURNE
elyoil2718138931119375
elyGas142113711585163924122969
elyCoal175217131611129515101043
nuclear89080813631341419746
hydro 318295102195819691740
wind16324526057654299
solar 13718810714181
others 108171201258174318

Appendix B

The GTAP-E model was re-coded and new sets and equations were added; all were in the same style of the standard following McDougall, R. and A. Golub. Thus, the addition, modifications and their locations in the GTAP model code are presented here. The model code is available for download from:
“Hertel, T., McDougall, R., & Walmsley, T. (2007). GTAP Model Version 6.2a. Purdue University, West Lafayette, IN: Global Trade Analysis Project (GTAP). Retrieved from https://www.gtap.agecon.purdue.edu/resources/res_display.asp?RecordID=2458
The following sets’ modifications and new sets were added:
Line 299
Set EGY_COMM # energy commodities # (coal, oil, gas, oil_pcts, TandD, nuclear, elycoal, elygas, elyoil, wind, hydro, elyother, solar);
Line 1314
ENY_GCOMM # inputs into government energy subutility # (coal, oil, gas, oil_pcts, TandD, nuclear, elycoal, elygas, elyoil, wind, hydro, elyother, solar);
Line 1591
Set ENY_PCOMM #inputs into private energy subutility # (coal, oil, gas, oil_pcts, TandD, nuclear, elycoal, elygas, elyoil, wind, hydro, elyother, solar);
Line 1839
Set SUBF_COMM # subproducts in demand by firms #
(vaen, ken, eny, ely, elyGen, nely, ncoal);
Line 2115
Set ELYGEN_FCOMM # inputs into electricity generation energy subproduction # (nuclear, elycoal, elygas, elyoil, wind, hydro, elyother, solar);
Line 2161
Set ELY_FCOMM # inputs into electricity energy subproduction #
(TandD, elyGen);
Line 2208
Set ENY_FCOMM # inputs into energy subproduction # (ely, nely);
For the two added nests, the following coding was used:
Line 2115 the following lines were added:
-Electricity Generation Energy Nest
Set
ELYGEN_FCOMM # inputs into electricity generation energy subproduction #
(nuclear, elycoal, elygas, elyoil, wind, hydro, elyother, solar);
Subset
ELYGEN_FCOMM is subset of FIRM_COMM;
 
Formula (all,j,PROD_COMM)(all,r,REG)
VFAS(“elyGen”,j,r) = sum(i,ELYGEN_FCOMM, VFA(i,j,r));
Formula (all,j,PROD_COMM)(all,r,REG)
VFA(“elyGen”,j,r) = VFAS(“elyGen”,j,r);
 
Coefficient
FSIZE_ELYGEN # size of ELYGEN_FCOMM set #;
Formula
FSIZE_ELYGEN = sum(i,ELYGEN_FCOMM, 1);
 
Coefficient (all,i,ELYGEN_FCOMM)(all,j,PROD_COMM)(all,r,REG)
FSHELYGEN(i,j,r)
# share of i in cost to j of electricity generation energy subproduct #;
 
Formula (all,i,ELYGEN_FCOMM)(all,j,PROD_COMM)(all,r,REG: VFAS(“elyGen”,j,r) = 0)
FSHELYGEN(i,j,r) = 1.0/FSIZE_ELYGEN;
Formula (all,i,ELYGEN_FCOMM)(all,j,PROD_COMM)(all,r,REG: VFAS(“elyGen”,j,r) > 0)
FSHELYGEN(i,j,r) = VFA(i,j,r)/VFAS(“elyGen”,j,r);
 
Equation ELYGENFPRICE # price of electricity generation energy subproduct #
(all,j,PROD_COMM)(all,r,REG)
pf(“elyGen”,j,r) =
sum(k,ELYGEN_FCOMM, FSHELYGEN(k,j,r) * [pf(k,j,r) - af(k,j,r)]);
 
Coefficient (parameter) (all,j,PROD_COMM)(all,r,REG)
ELFELYGEN(j,r)
# elasticity of substitution in electricity generation energy subproduction #;
Read
ELFELYGEN from file GTAPPARM header “EFLG”;
 
Equation ELYGFDEMAND
# demand for inputs into electricity generation energy subproduction #
(all,i,ELYGEN_FCOMM)(all,j,PROD_COMM)(all,r,REG)
qf(i,j,r) = -af(i,j,r) + qf(“elyGen”,j,r)
  - ELFELYGEN(j,r) * [pf(i,j,r) - af(i,j,r) - pf(“elyGen”,j,r)];
 
-Line 2161 the following lines were added:
- Electricity Energy Nest
Set
ELY_FCOMM # inputs into electricity energy subproduction #
(TandD, elyGen);
Subset
ELY_FCOMM is subset of FIRM_COMM;
 
Formula (all,j,PROD_COMM)(all,r,REG)
VFAS(“ely”,j,r) = sum(i,ELY_FCOMM, VFA(i,j,r));
Formula (all,j,PROD_COMM)(all,r,REG)
VFA(“ely”,j,r) = VFAS(“ely”,j,r);
 
Coefficient
FSIZE_ELY # size of ELY_FCOMM set #;
Formula
FSIZE_ELY = sum(i,ELY_FCOMM, 1);
 
Coefficient (all,i,ELY_FCOMM)(all,j,PROD_COMM)(all,r,REG)
FSHELY(i,j,r)
# share of i in cost to j of electricity energy subproduct #;
Formula (all,i,ELY_FCOMM)(all,j,PROD_COMM)(all,r,REG: VFAS(“ely”,j,r) = 0)
FSHELY(i,j,r) = 1.0/FSIZE_ELY;
Formula (all,i,ELY_FCOMM)(all,j,PROD_COMM)(all,r,REG: VFAS(“ely”,j,r) > 0)
FSHELY(i,j,r) = VFA(i,j,r)/VFAS(“ely”,j,r);
 
Equation ELYFPRICE # price of non-electricity energy subproduct #
(all,j,PROD_COMM)(all,r,REG)
pf(“ely”,j,r) =
sum(k,ELY_FCOMM, FSHELY(k,j,r) * [pf(k,j,r) - af(k,j,r)]);
 
Coefficient (parameter) (all,j,PROD_COMM)(all,r,REG)
ELFELY(j,r)
# elasticity of substitution in electricity energy subproduction #;
Read
ELFELY from file GTAPPARM header “EFLT”;
 
Equation ELYFDEMAND
# demand for inputs into electricity energy subproduction #
(all,i,ELY_FCOMM)(all,j,PROD_COMM)(all,r,REG)
qf(i,j,r) = -af(i,j,r) + qf(“ely”,j,r)
  - ELFELY(j,r) * [pf(i,j,r) - af(i,j,r) - pf(“ely”,j,r)];

References

  1. U.S. Energy Information Administration. International Energy Outlook 2016; U.S. Energy Information Administration: Washington, DC, USA, 2016.
  2. Suttles, S.; Tyner, W.; Shively, G.; Sands, R. Economic effects of bioenergy policy in the United States and Europe: A general equilibrium approach focusing on forest biomass. Renew. Energy 2014, 69, 428–436. [Google Scholar] [CrossRef]
  3. Yildirim, E.; Saraç, Ş.; Aslan, A. Energy consumption and economic growth in the USA: Evidence from renewable energy. Renew. Sustain. Energy Rev. 2012, 16, 6770–6774. [Google Scholar] [CrossRef]
  4. Fang, Y. Economic welfare impacts from renewable energy consumption: The China experience. Renew. Sustain. Energy Rev. 2011, 15, 5120–5128. [Google Scholar] [CrossRef]
  5. Alam, M.J.; Begum, I.A.; Buysse, J.; Rahman, S.; Van Huylenbroeck, G. Dynamic modeling of causal relationship between energy consumption, CO2 emissions and economic growth in India. Renew. Sustain. Energy Rev. 2011, 15, 3243–3251. [Google Scholar] [CrossRef]
  6. Ahmad, S.; Tahar, R.M. Selection of renewable energy sources for sustainable development of electricity generation system using analytic hierarchy process: A case of Malaysia. Renew. Energy 2014, 63, 458–466. [Google Scholar] [CrossRef]
  7. Begum, R.A.; Sohag, K.; Abdullah, S.M.S.; Jaafar, M. CO2 emissions, energy consumption, economic and population growth in Malaysia. Renew. Sustain. Energy Rev. 2015, 41, 594–601. [Google Scholar] [CrossRef]
  8. Tsai, W.T.; Chou, Y.H. Overview of environmental impacts, prospects and policies for renewable energy in Taiwan. Renew. Sustain. Energy Rev. 2005, 9, 119–147. [Google Scholar] [CrossRef]
  9. Bohringer, C.; Keller, A.; van der Werf, E. Are green hopes too rosy? Employment and welfare impacts of renewable energy promotion. Energy Econ. 2013, 36, 277–285. [Google Scholar] [CrossRef]
  10. Ozturk, I.; Acaravci, A. CO2 emissions, energy consumption and economic growth in Turkey. Renew. Sustain. Energy Rev. 2010, 14, 3220–3225. [Google Scholar] [CrossRef]
  11. Ocal, O.; Aslan, A. Renewable energy consumption-economic growth nexus in Turkey. Renew. Sustain. Energy Rev. 2013, 28, 494–499. [Google Scholar] [CrossRef]
  12. Hoefnagels, R.; Banse, M.; Dornburg, V.; Faaij, A. Macro-economic impact of large-scale deployment of biomass resources for energy and materials on a national level-A combined approach for The Netherlands. Energy Policy 2013, 59, 727–744. [Google Scholar] [CrossRef]
  13. Moreno, B.; López, A.J. The effect of renewable energy on employment. The case of Asturias (Spain). Renew. Sustain. Energy Rev. 2008, 12, 732–751. [Google Scholar] [CrossRef]
  14. Cansino, J.M.; Cardenete, M.A.; González-Limón, J.M.; Román, R. The economic influence of photovoltaic technology on electricity generation: A CGE (computable general equilibrium) approach for the Andalusian case. Energy 2014, 73, 70–79. [Google Scholar] [CrossRef]
  15. Salahuddin, M.; Gow, J.; Ozturk, I. Is the long-run relationship between economic growth, electricity consumption, carbon dioxide emissions and financial development in Gulf Cooperation Council Countries robust? Renew. Sustain. Energy Rev. 2015, 51, 317–326. [Google Scholar] [CrossRef] [Green Version]
  16. Zeb, R.; Salar, L.; Awan, U.; Zaman, K.; Shahbaz, M. Causal links between renewable energy, environmental degradation and economic growth in selected SAARC countries: Progress towards green economy. Renew. Energy 2014, 71, 123–132. [Google Scholar] [CrossRef]
  17. Sebri, M.; Ben Salha, O. On the causal dynamics between economic growth, renewable energy consumption, CO2 emissions and trade openness: Fresh evidence from BRICS countries. Public Choice 2007. [Google Scholar] [CrossRef]
  18. Cucchiella, F. Future Trajectories of Renewable Energy Consumption in the European Union. Resources 2018, 7, 10. [Google Scholar] [CrossRef]
  19. Pirlogea, C.; Cicea, C. Econometric perspective of the energy consumption and economic growth relation in European Union. Renew. Sustain. Energy Rev. 2012, 16, 5718–5726. [Google Scholar] [CrossRef]
  20. Organization of the Petroleum Exporting Countries (OPEC). Annual Statistical Bulletin; Organization of the Petroleum Exporting Countries: Vienna, Austria, 2016. [Google Scholar]
  21. Saudi Electricity Company. SEC Annual Report; Saudi Electricity Company: Riyadh, Saudi Arabia, 2015. [Google Scholar]
  22. King Abdullah City for Atomic and Renewable Energy (K.A.CARE). 2010. Available online: https://www.kacare.gov.sa/en/FutureEnergy/Pages/vision.aspx (accessed on 9 November 2016).
  23. Almutairi, K.; Thoma, G.; Burek, J.; Algarni, S.; Nutter, D. Life cycle assessment and economic analysis of residential air conditioning in Saudi Arabia. Energy Build. 2015, 102, 370–379. [Google Scholar] [CrossRef]
  24. Al-Abdalla, M.; Saudi Arabian General Investment Authority, Riyadh, Saudi Arabia. Personal Communication, 2017.
  25. Baumeister, C.; Kilian, L. Lower oil prices and the US economy: Is this time different? Brook. Pap. Econ. Act. 2016, 287–357. [Google Scholar] [CrossRef]
  26. Osmani, A.; Zhang, J.; Gonela, V.; Awudu, I. Electricity generation from renewables in the United States: Resource potential, current usage, technical status, challenges, strategies, policies, and future directions. Renew. Sustain. Energy Rev. 2013, 24, 454–472. [Google Scholar] [CrossRef]
  27. Electricity in the United States—Energy Explained, Your Guide to Understanding Energy, Energy Information Administration. 2018. Available online: https://www.eia.gov/energyexplained/index.php?page=electricity_in_the_united_states (accessed on 3 August 2018).
  28. Wang, Q.; Chen, X.; Jha, A.N.; Rogers, H. Natural gas from shale formation—The evolution, evidences and challenges of shale gas revolution in United States. Renew. Sustain. Energy Rev. 2014, 30, 1–28. [Google Scholar] [CrossRef]
  29. Nejat, P.; Jomehzadeh, F.; Taheri, M.M.; Gohari, M.; Muhd, M.Z. A global review of energy consumption, CO2 emissions and policy in the residential sector (with an overview of the top ten CO2 emitting countries). Renew. Sustain. Energy Rev. 2015, 43, 843–862. [Google Scholar] [CrossRef]
  30. Aslani, A.; Wong, K.-F.V. Analysis of renewable energy development to power generation in the United States. Renew. Energy 2014, 63, 153–161. [Google Scholar] [CrossRef]
  31. Menyah, K.; Wolde-Rufael, Y. CO2 emissions, nuclear energy, renewable energy and economic growth in the US. Energy Policy 2010, 38, 2911–2915. [Google Scholar] [CrossRef]
  32. Liu, L.; Chen, C.; Zhao, Y.; Zhao, E. China’s carbon-emissions trading: Overview, challenges and future. Renew. Sustain. Energy Rev. 2015, 49, 254–266. [Google Scholar] [CrossRef]
  33. Hilton, I.; Kerr, O. The Paris Agreement: China’s ‘New Normal’ role in international climate negotiations. Clim. Policy 2017, 17, 48–58. [Google Scholar] [CrossRef]
  34. Li, J.; Wang, X. Energy and climate policy in China’s twelfth five-year plan: A paradigm shift. Energy Policy 2012, 41, 519–528. [Google Scholar] [CrossRef]
  35. Bhattacharya, M.; Rafiq, S.; Bhattacharya, S. The role of technology on the dynamics of coal consumption-economic growth: New evidence from China. Appl. Energy 2015, 154, 686–695. [Google Scholar] [CrossRef]
  36. Yuan, J.; Na, C.; Lei, Q.; Xiong, M.; Guo, J.; Hu, Z. Coal use for power generation in China. Resour. Conserv. Recycl. 2018, 129, 443–453. [Google Scholar] [CrossRef]
  37. Hu, Y.; Cheng, H. Development and bottlenecks of renewable electricity generation in China: A critical review. Environ. Sci. Technol. 2013, 47, 3044–3056. [Google Scholar] [CrossRef] [PubMed]
  38. Kumar, A.; Kumar, K.; Kaushik, N.; Sharma, S.; Mishra, S. Renewable energy in India: Current status and future potentials. Renew. Sustain. Energy Rev. 2010, 14, 2434–2442. [Google Scholar] [CrossRef]
  39. Tiwari, A.K.; Albulescu, C.T. Oil price and exchange rate in India: Fresh evidence from continuous wavelet approach and asymmetric, multi-horizon Granger-causality tests. Appl. Energy 2016, 179, 272–283. [Google Scholar] [CrossRef]
  40. Sati, V.P. Climate Change and Socio-Ecological Transformation; Today and Tomrrow’s Printers and Publishers: New Delhi, India, 2015. [Google Scholar]
  41. Shiva Kumar, B.; Sudhakar, K. Performance evaluation of 10 MW grid connected solar photovoltaic power plant in India. Energy Rep. 2015, 1, 184–192. [Google Scholar] [CrossRef]
  42. Heo, J.-Y.; Yoo, S.-H.; Kwak, S.-J. The Causal Relationship Between Nuclear Energy Consumption and Economic Growth in India. Energy Sources Part B Econ. Plan. Policy 2011, 6, 111–117. [Google Scholar] [CrossRef]
  43. Scarlat, N.; Dallemand, J.; Monforti-Ferrario, F. Renewable Energy Policy Framework and Bioenergy Contribution in the European Union—An Overview from National Renewable Energy Action Plans and, Renew. Sustain. Energy Rev. 2015, 51, 969–985. [Google Scholar] [CrossRef]
  44. Excise Duties: Energy Tax Rates—European Commission, (n.d.). Available online: https://ec.europa.eu/taxation_customs/business/excise-duties-alcohol-tobacco-energy/excise-duties-energy/excise-duties-energy-tax-rates_en (accessed on 25 June 2017).
  45. Knopf, B.; Nahmmacher, P.; Schmid, E. The European renewable energy target for 2030—An impact assessment of the electricity sector. Energy Policy 2015, 85, 50–60. [Google Scholar] [CrossRef]
  46. DeLlano-Paz, F.; Martínez Fernandez, P.; Soares, I. Addressing 2030 EU policy framework for energy and climate: Cost, risk and energy security issues. Energy 2016, 115, 1347–1360. [Google Scholar] [CrossRef]
  47. Helm, D. The European framework for energy and climate policies. Energy Policy 2014, 64, 29–35. [Google Scholar] [CrossRef]
  48. Brutschin, E.; Pollak, J. The European Commission 2030 Framework for Climate and Energy Policies: A Step Back? 2014. Available online: http://irihs.ihs.ac.at/id/eprint/3210 (accessed on 25 June 2017).
  49. Burniaux, J.; Truong, T. GTAP-E: An Energy-Environmental Version of the GTAP Model. GTAP Technical Papers. 2002. Available online: http://docs.lib.purdue.edu/cgi/viewcontent.cgi?article=1017&context=gtaptp (accessed on 26 June 2017).
  50. Hertel, T. Global Trade Analysis: Modeling and Applications; Cambridge University Press: Cambridge, MA, USA, 1997. [Google Scholar]
  51. Burfisher, M. Introduction to Computable General Equilibrium Models; Cambridge University Press: Cambridge, UK, 2017. [Google Scholar]
  52. Armington, P.S. A Theory of Demand for Products Distinguished by Place of Production. Int. Monet. Fund Staff Pap. 1969, 16, 159–178. [Google Scholar] [CrossRef]
  53. Truong, T. GTAP-E: An Energy-Environmental Version of the GTAP Model with Emission Trading USER’S GUIDE. 2007. Available online: http://www.gtap.agecon.purdue.edu/resources/download/3552.pdf (accessed on 26 June 2017).
  54. Aguiar, A.; Narayanan, B.; McDougall, R. An Overview of the GTAP 9 Data Base. J. Glob. Econ. Anal. 2016, 1, 181–208. [Google Scholar] [CrossRef] [Green Version]
  55. Peters, J.C. The GTAP-Power Data Base: Disaggregating the Electricity Sector in the GTAP Data Base. J. Glob. Econ. Anal. 2016, 1, 209–250. [Google Scholar] [CrossRef] [Green Version]
  56. Capros, P.; van Regemorter, D.; Paroussos, L.; Karkatsoulis, P.; Fragkiadakis, C.; Tsani, S.; Charalampidis, I.; Revesz, T. GEM-E3 Model Doc.; European Commisions: Brussels, Belgium, 2013. [Google Scholar] [CrossRef]
  57. Peters, J.C. GTAP-E-Power: An Electricity-detailed Extension of the GTAP-E model. In Proceedings of the 19th Annual Conference on Global Economic Analysis, Washington, DC, USA, 15–17 June 2016; pp. 1–30. [Google Scholar]
  58. Cai, Y.; Arora, V. Disaggregating electricity generation technologies in CGE models: A revised technology bundle approach with an application to the US Clean Power Plan. Appl. Energy 2015, 154, 543–555. [Google Scholar] [CrossRef]
  59. Chateau, J.; Dellink, R.; Lanzi, E. An Overview of the OECD ENV-Linkages Model: Version 3; OECD Environment Working Papers 65; OECD Publishing: Paris, France, 2014. [Google Scholar]
  60. Dai, H.; Herran, D.; Fujimori, S.; Masui, T. Key factors affecting long-term penetration of global onshore wind energy integrating top-down and bottom-up approaches. Renew. Energy 2016, 85, 19–30. [Google Scholar] [CrossRef]
  61. European Commission. World Energy, Technology and Climate Policy Outlook; European Commission: Brussels, Belgium, 2003. [Google Scholar]
  62. Rubin, E.S.; Azevedo, I.M.L.; Jaramillo, P.; Yeh, S. A review of learning rates for electricity supply technologies. Energy Policy 2015, 86, 198–218. [Google Scholar] [CrossRef]
  63. Viebahn, P.; Nitsch, J.; Fischedick, M.; Esken, A.; Schüwer, D.; Supersberger, N.; Zuberbühler, U.; Edenhofer, O. Comparison of carbon capture and storage with renewable energy technologies regarding structural, economic, and ecological aspects in Germany. Int. J. Greenh. Gas Control 2007, 1, 121–133. [Google Scholar] [CrossRef]
  64. Ballesteros, A.R.; Coequyt, J.; Furtado, M.; Inventor, J.; Krewitt, W.; Mittler, D.; Schäfer, O.; Simon, S.; Teske, S.; Zervos, A. Future Investment: A Sustainable Investment Plan for the Power Sector to Save the Climate; European Council for Renewable Energy and Greenpeace: Stuttgart, Germany, 2007. [Google Scholar]
  65. Morris, J.; Webster, M.; Reilly, J. Electricity Investments under Technology Cost Uncertainty and Stochastic Technological Learning; MIT Joint Program on the Science and Policy of Global Change: Cambridge, MA, USA, 2016. [Google Scholar]
  66. U.S. Census Bureau. USCB International Data Base; U.S. Census Bureau: Suitland, MD, USA, 2016.
  67. Anderson, K.; Strutt, A. The changing geography of world trade: Projections to 2030. J. Asian Econ. 2012, 23, 303–323. [Google Scholar] [CrossRef]
  68. International Labour Organization, Estimates and Projections of Labour Market Indicators. Available online: http://www.ilo.org/global/about-the-ilo/lang--en/index.htm (accessed on 23 June 2017).
  69. Verdolini, E.; Vona, F.; Popp, D. Bridging the Gap: Do Fast Reacting Fossil Technologies Facilitate Renewable Energy Diffusion? The National Bureau of Economic Research: Cambridge, MA, USA, 2016. [Google Scholar]
  70. Rutovitz, J.; Dominish, E.; Downes, J. Calculating Global Energy Sector Jobs 2015 Methodology Update; Institutes for Sustainable Futures: Sydney, Austria, 2015. [Google Scholar]
  71. China: Average Income of Employees in Urban Areas by Sector 2015|Statistic, (n.d.). Available online: https://www.statista.com/statistics/278351/average-wage-of-employed-persons-in-urban-units-in-china/ (accessed on 26 June 2017).
  72. Bosbait, M.; Wilson, R. Education, School to Work Transitions and Unemployment in Saudi Arabia. Middle East. Stud. 2005, 41, 533–546. [Google Scholar] [CrossRef]
  73. United States Department of Energy. U.S. Energy and Employment Report; United States Department of Energy: Washington, DC, USA, 2017.
  74. Saudi Arabian Monetary Agency. Saudi Arabian Monetary Agency; Thirty-nine Annual Report; Saudi Arabian Monetary Agency: Riyadh, Saudi Arabia, 2003.
  75. Murphy, A.P. Konings, Do Multional Enterprises Relocate Employment to Low Wage Regions? Rev. World Econ. 2003, 142, 267–286. [Google Scholar]
  76. Fabo, B.; Arkkey, R.; Korde, R. Wage Index Report India: Wages and Working Conditons on the Formal Labour Market in India 2014. Available online: http://wageindicator.org/documents/publications-2015/Monster-Salarry-Index-Jan2015.pdf (accessed on 26 June 2017).
  77. Oostendorp, R.H. The Occupational Wages Around the World (OWW) Database; Update for 1983–2008. Available online: http://www.nber.org/oww/The Updated Occupational Wages around the World (OWW) Database May 2012.pdf (accessed on 24 June 2017).
  78. Ernst & Young Global Limited. The Impact of Decreasing Oil Prices on the GCC RHC Market; Ernst & Young Global Limited: London, UK, 2016. [Google Scholar]
  79. Dev, R.; Chaubey, P.D.S. World’ s Oil Scenario—Falling Oil Prices Winners and Losers a Study on top Oil Producing and Consuming Countries. Imp. J. Interdiscip. Res. 2016, 2, 378–383. [Google Scholar]
  80. Houghton, J. Global Warming: The Complete Briefing, 4th ed.; Cambridge University Press: Cambridge, UK, 2009. [Google Scholar]
  81. Myhre, G.; Shindell, D.; Bréon, F.M.; Collins, W.; Fuglestvedt, J.; Huang, J.; Koch, D.; Lamarque, J.F.; Lee, D.; Mendoza, B.; et al. Climate Change 2013: The Physical Science Basis. Contribution of Working Group I to the Fifth Assessment Report of the Intergovernmental Panel on Climate Change; Cambridge University Press: Cambridge, UK; New York, NY, USA, 2013. [Google Scholar]
  82. Riahi, K.; Rao, S.; Krey, V.; Cho, C.; Chirkov, V.; Fischer, G.; Kindermann, G.; Nakicenovic, N.; Rafaj, P. RCP 8.5-A scenario of comparatively high greenhouse gas emissions. Clim. Chang. 2011, 109, 33–57. [Google Scholar] [CrossRef]
  83. Ma, J.; Oppong, A.; Acheampong, K.N.; Abruquah, L.A. Forecasting renewable energy consumption under zero assumptions. Sustainability 2018, 10, 576. [Google Scholar] [CrossRef]
  84. United Nations. Adoption of the Paris Agreement. In Proceedings of the Conference of the Parties, Paries, France, 30 November–11 Decemeber 2015. [Google Scholar]
  85. Ianchovichina, E.; Mcdougall, R. Theoretical Structure of Dynamic GTAP; Global Trade Analysis Project Technical Paper; Global Trade Analysis Project: West Lafayette, IN, USA, 2000. [Google Scholar]
Figure 1. Original GTAP-E production structure [49].
Sustainability 10 02884 g001
Figure 2. Modified GTAP-E production structure.
Sustainability 10 02884 g002
Figure 3. (a) The electricity mix in 2030 for the business as usual (BAU) and renewable and nuclear energy (RNE) scenarios; (b) The electricity mix in 2030 for the business as usual (BAU) and renewable and nuclear energy (RNE) scenarios.
Sustainability 10 02884 g003
Figure 4. The shares of electricity mix worldwide in 2030 for the business as usual (BAU) and renewable and nuclear energy (RNE) scenarios.
Sustainability 10 02884 g004
Figure 5. Impacts on sectoral output, commodities price, direct and indirect jobs in USA (RNE compared to BAU).
Sustainability 10 02884 g005
Figure 6. Impacts on sectoral output, commodities price, direct and indirect jobs in Saudi Arabia (RNE compared to BAU).
Sustainability 10 02884 g006
Figure 7. Impacts on sectoral output, commodities price, direct and indirect jobs in Europe (RNE compared to BAU).
Sustainability 10 02884 g007
Figure 8. Impacts on sectoral output, commodities price, direct and indirect jobs in China (RNE compared to BAU).
Sustainability 10 02884 g008
Figure 9. Impacts on sectoral output, commodities price, direct and indirect jobs in India (RNE compared to BAU).
Sustainability 10 02884 g009
Figure 10. Impacts on sectoral output, commodities price, direct and indirect jobs in ROW (RNE compared to BAU).
Sustainability 10 02884 g010
Table 1. Scenarios analyzed.
ScenarioDescription
1. Business As Usual (BAU)- Account for the evolution of the global economy until 2030.
- Current electricity mix remains unchanged until 2030.
- Consider the technological improvements.
2. Renewable and Nuclear Energy (RNE)- Account for the evolution of the global economy until 2030.
- Electricity mix that incorporates the 2030 renewable and nuclear energy targets based on IEO2016 predictions.
- Consider the technological improvements.
Table 2. Percentage change in GDP’s components and total GDP in the RNE compared to BAU scenario.
ConsumptionInvestmentGovernmentExportImportTotal
KSA−5.00−27.28−5.06−0.55−13.40−3.52
USA−1.58−0.54−1.57−4.97−2.37−1.58
EUROPE−2.89−7.73−2.88−1.42−4.76−2.81
CHINA−0.411.88−0.23−2.390.77−0.31
INDIA0.02−0.210.13−4.24−3.610.03
ROW−1.020.12−0.99−4.98−2.95−1.00
Table 3. Equivalent variation ($ US millions), and terms of trade (% difference) (RNE compared to BAU scenario).
RegionEquivalent Variation Terms of Trade
KSA−32,965−5.64
USA18,8690.57
EUROPE–31,885−0.36
CHINA21,7881.57
INDIA14,4372.61
ROW−8560−0.01
Table 4. CO2 emission (percentage difference), and CO2 differences (RNE compared to BAU scenario).
RegionDifference in CO2Million Tonne-CO2
KSA−7.90−61.51
USA−1.21−96.48
EUROPE−3.42−297.85
CHINA−12.35−2152.68
INDIA−13.16−881.71
ROW−6.57−1123.7

