1. Introduction
Regions are increasingly recognized as key loci of national and supra-national innovation performance [
1,
2,
3,
4]. The emphasis on the regional dimension of innovation depends on different reasons. Firstly, in a regional context, the presence of shared rules and trustworthy relationships fosters interaction, mutual understanding, and collective learning processes [
5,
6]. In addition, proximity, personally and recurrent contacts are key prerequisites for exchanging non-codified and tacit knowledge, which, in turn, plays an essential role in supporting innovation processes [
7]. Secondly, innovation systems could be more simply analysed at the regional level [
8]. Thirdly, several studies have proven the existence of a strong and positive relationship between innovation and competitiveness (e.g., [
9,
10,
11,
12]), therefore, the analysis of innovation processes and performance needs of an important consideration at the regional level. Finally, from a policy perspective it is much easier to manage and define economic policies at regional rather than national or international level [
13].
According to this, in the last two decades, regional innovation systems (RIS) have become the focus of several scientific researches and policy reports [
14,
15,
16,
17]. In particular, such studies and reports have highlighted that, despite numerous and diverse policies and incentives, there are still significant discrepancies among Regions in terms of innovation performance [
5,
14,
15,
16,
17,
18,
19]. Furthermore, analysing data provided by ProInno Europe Regional Innovation Scoreboards [
14,
15,
16,
17], that assess the innovation performance of European Regions at level NUTS 2, it emerges that the innovation performance of 88 European regions have declined from 2011 to 2017. This happens mainly in geographically peripheral European regions. For example, performance decreased in European southern and eastern regions (e.g., Italy and Romania), but also in Central Europe (e.g., Germany). Performance decreased for all Romanian Regions, and for more than 50% of Czech, Danish, Finnish, German, Hungarian, Portuguese, and Spanish regions. Moreover, based on the data shown by RIS 2017), it is possible to observe significant differences in terms of innovation outcomes of regional systems within the same countries.
Such results prove that, although a significant stream of literature is focusing on RIS and on how to support their development and competitiveness (e.g., [
2,
19,
20]), there is still a significant distance among theoretical approaches, adopted innovation measures, and related regional performance.
Numerous studies have shown that RIS with similar industrial structures and characteristics can strongly differ from each other even in terms of innovation and competitive performance. Notwithstanding the adoption of specific policies and incentives, this gap is more evident in the case of the so-called lagging regions (characterized by moderate and modest level of innovativeness) [
14,
15,
16,
17]. Evidently, there is something deeper than the failure of an innovation policy devoted to support the innovation and economic growth.
The emergent viewpoint is that regional performances are influenced by powerful inertial mechanisms, which are often underestimated by policy-makers and academics [
21]. As a consequence, each regional innovation measure should aim at bearing the virtuous processes of most innovative regions, and the vicious ones of lagging regions.
According to this, such paper aims at addressing these two research questions: (i) What are the resources, competencies and mechanisms able to support the so-called lagging Regions to trigger virtuous innovation and economic growth processes? (ii) What are the main barriers which hinder the development of effective innovation processes notwithstanding the public incentives?
In order to cope with these issues, we propose a computational laboratory, called CARIS, to support researchers in understanding the complex and dynamic behaviours of RIS, and policy-makers in determining appropriate and effective regional innovation policies both for European leading and lagging regions.
The CARIS laboratory appears to be consistent with a new emerging perspective in the study of territorial innovation systems, in which the central point is the framing of these systems as generated from complex interactions among internal and external agents [
22]. Such complexity could clarify the existence of dissimilarities among the regions around the world in terms of economic development and innovation outcomes. The CARIS lab is built upon the claim that complexity and social simulation can be used to help policy-makers in designing suitable and more effective innovation measures. Once fully developed and validated, the CARIS laboratory could be adopted as policy support tool to define and evaluate effective innovation policies.
The paper is structure in six sections. After this introduction, the background on RIS is thoroughly analysed. The third section describes the adopted methodology, while the results are presented in the fourth section. Finally, implications, limitations, and future developments are discussed in the fifth and sixth sections.
2. Background
In the last twenty years the RIS concept has been gaining increasing attention from scholars and policy-makers. In the literature, RIS are defined as territorially-embedded institutional infrastructures fostering innovation processes within the production structure of a region [
2]. According to [
23], innovation at regional level is mainly developed through collective learning and synergies among different actors, operating inside and outside the organizations. In other words, regional innovation processes are difficult to replicate as they are based on collective learning, social interactions, and are severely path-dependent [
24].
Coherently with this literature and compelled by the environmental turbulence and dynamic evolution, policy-makers have started to focus on the regional dimension in the definition of innovation and entrepreneurial policies [
25]. They started to discuss with academic researchers about proper and effective policies able to support virtuous innovation processes at the regional level [
19,
26]. The following three perspectives appear to be relevant as frameworks informing the development of current innovation policies.
The Learning Region approach claims that actors in the same local context learn to collaborate in tackling economic and social innovation [
27,
28,
29,
30,
31]. These actors are firms, producers, customers, experts, and public and private research institutions producing knowledge. In other words, all the agents of the socio-economic regional system learn by interacting with each other. Communication and cooperation among these different agents are critical in determining the collective learning process and outcomes [
32]. In this kind of context, institutional actors, playing the role of normative agents, are fundamental in catalyzing effective interaction and cooperation.
According to the OECD [
31], “Regional policy interventions have a greater chance of successful outcomes where the objective is to foster the development of appropriate forms of social capital within the networks where organisational learning takes place. It is much more realistic (although by no means straightforward) to promote norms of high-trust exchange and interaction within networks of firms and other organisations than to bring about much wider social change. Moreover, once effective interaction is established, this is likely to have the effect of reinforcing these norms, thereby strengthening organisational learning cumulatively” ([
31], p. 120–121).
The main issue related to this perspective stays in the vagueness and “definitional confusion” of some concepts characterizing the RIS approach, that make difficult to translate the conceptual framework in a model useful to generate effective policy interventions.
The smart specialization approach [
33] advocates that innovation policies must be embedded in the local context, basing on local specificities in terms of R and D and production activities that are relevant for the development of the different regions in the long time. It is possible to achieve economic growth and wealth by sustaining regions in focusing on their specific points of strengths and local knowledge resources [
33].
Camagni and Capello [
5] agree on many of the assumptions of smart specialization. Particularly, they underline the key concept of “embeddedness” and “connectedness” launched in the scientific debate by the adopters of the Smart Specialization perspective. However, they criticized the dichotomy between advanced research areas (the leader or “core” regions) and the co-innovation areas (the follower of “periphery” regions). In addition to the leader and follower regions, there are also regions capable to imitate and adapt to innovations that already exist. The capability of an economic system to get advantages from knowledge depends on its creativity, culture, and the level of absorption of external stimuli. Different regions develop specific cognitive and social styles which explain different patterns of innovation [
7].
Cooke [
34] develops a fierce critique of the Smart Specialization approach. In particular, Cooke [
34] claims that Smart specialization should be dismissed in favor of a more modern perspective that supports the value of diversity and social interaction, in agreement with the results of Complexity Theory.
The Ecology of Innovation approach emphasizes the importance of diversity and social interactions for the innovation. David and Metcalfe [
35] suggest that the term “innovation systems” is confusing as it highlights not dynamic and enduring institutional aspects. The durable structures that characterize the innovative regional systems are continuously re-created, day by day, by a myriad of social interactions. These interactions in turn are continually reinforced or destroyed by the structures that interactions have created. In other words, a system cannot be described as a list of components, but it depends on the synergies deriving from the connections and complementarity among its components [
35,
36].
This last perspective shows numerous common elements with the emergent body of literature [
37,
38,
39,
40,
41,
42,
43,
44] that defines productive-economic innovative systems (e.g., industrial districts, regional clusters) as complex adaptive systems (CAS). A CAS is comprised of a set of connected or interdependent diverse agents who act and interact following simple local rules [
45]. These systems are not decomposable and they exhibit collective properties emerging from the not-linear interactions among the autonomous and heterogeneous agents populating it. From a methodological point of view, this fact implies that to understand the behaviour of a CAS, it is necessary to focus on interactions among its parts and to avoid traditional additive approaches.
Table 1 summarizes the main achievements in the literature on RIS.
Generally, conceptual and policy approaches relating to territorial innovation systems often refer to the high complexity featuring them. Notwithstanding main theoretical claims of complexity science have been used from a conceptual viewpoint, they have been poorly used from a practical point of view.
The aim of the paper is to bridge the theoretical approach of RIS rooted in the Ecology of Innovation approach with the practice of policy interventions definition, particularly in European regions.
3. Methodology
Agent-based modeling (ABM) is the methodology on which the present research is based. The CARIS lab is built to explore and understand self-sustaining innovation cycles in European regions and to help policy-makers in designing adequate interventions toward innovation and growth in European regions, particularly with regard to the lagging regions. In fact, more recently, agent-based modelling (ABM) has been increasingly recognized as a helpful tool to support policy making in different fields and at different levels [
31,
36]. Put differently, it is claimed that complexity science suggests that methodologies, such as ABM, are crucial to develop a deep understanding of multi-dimensional innovation issues, which significantly aid policy-makers in bringing about societal changes in a complex world [
36]. Cooke [
36] adds, “No complex issue, challenge or problem can be addressed by focusing on effectively a single issue or dimension, as they do not exist in isolation: the different interrelated dimensions interact with each other. Once the complex problem-space has been identified, that understanding can be used to co-create with the relevant stakeholders an enabling environment, which addresses all the relevant interrelated issues at the same time” ([
36], p. 268).
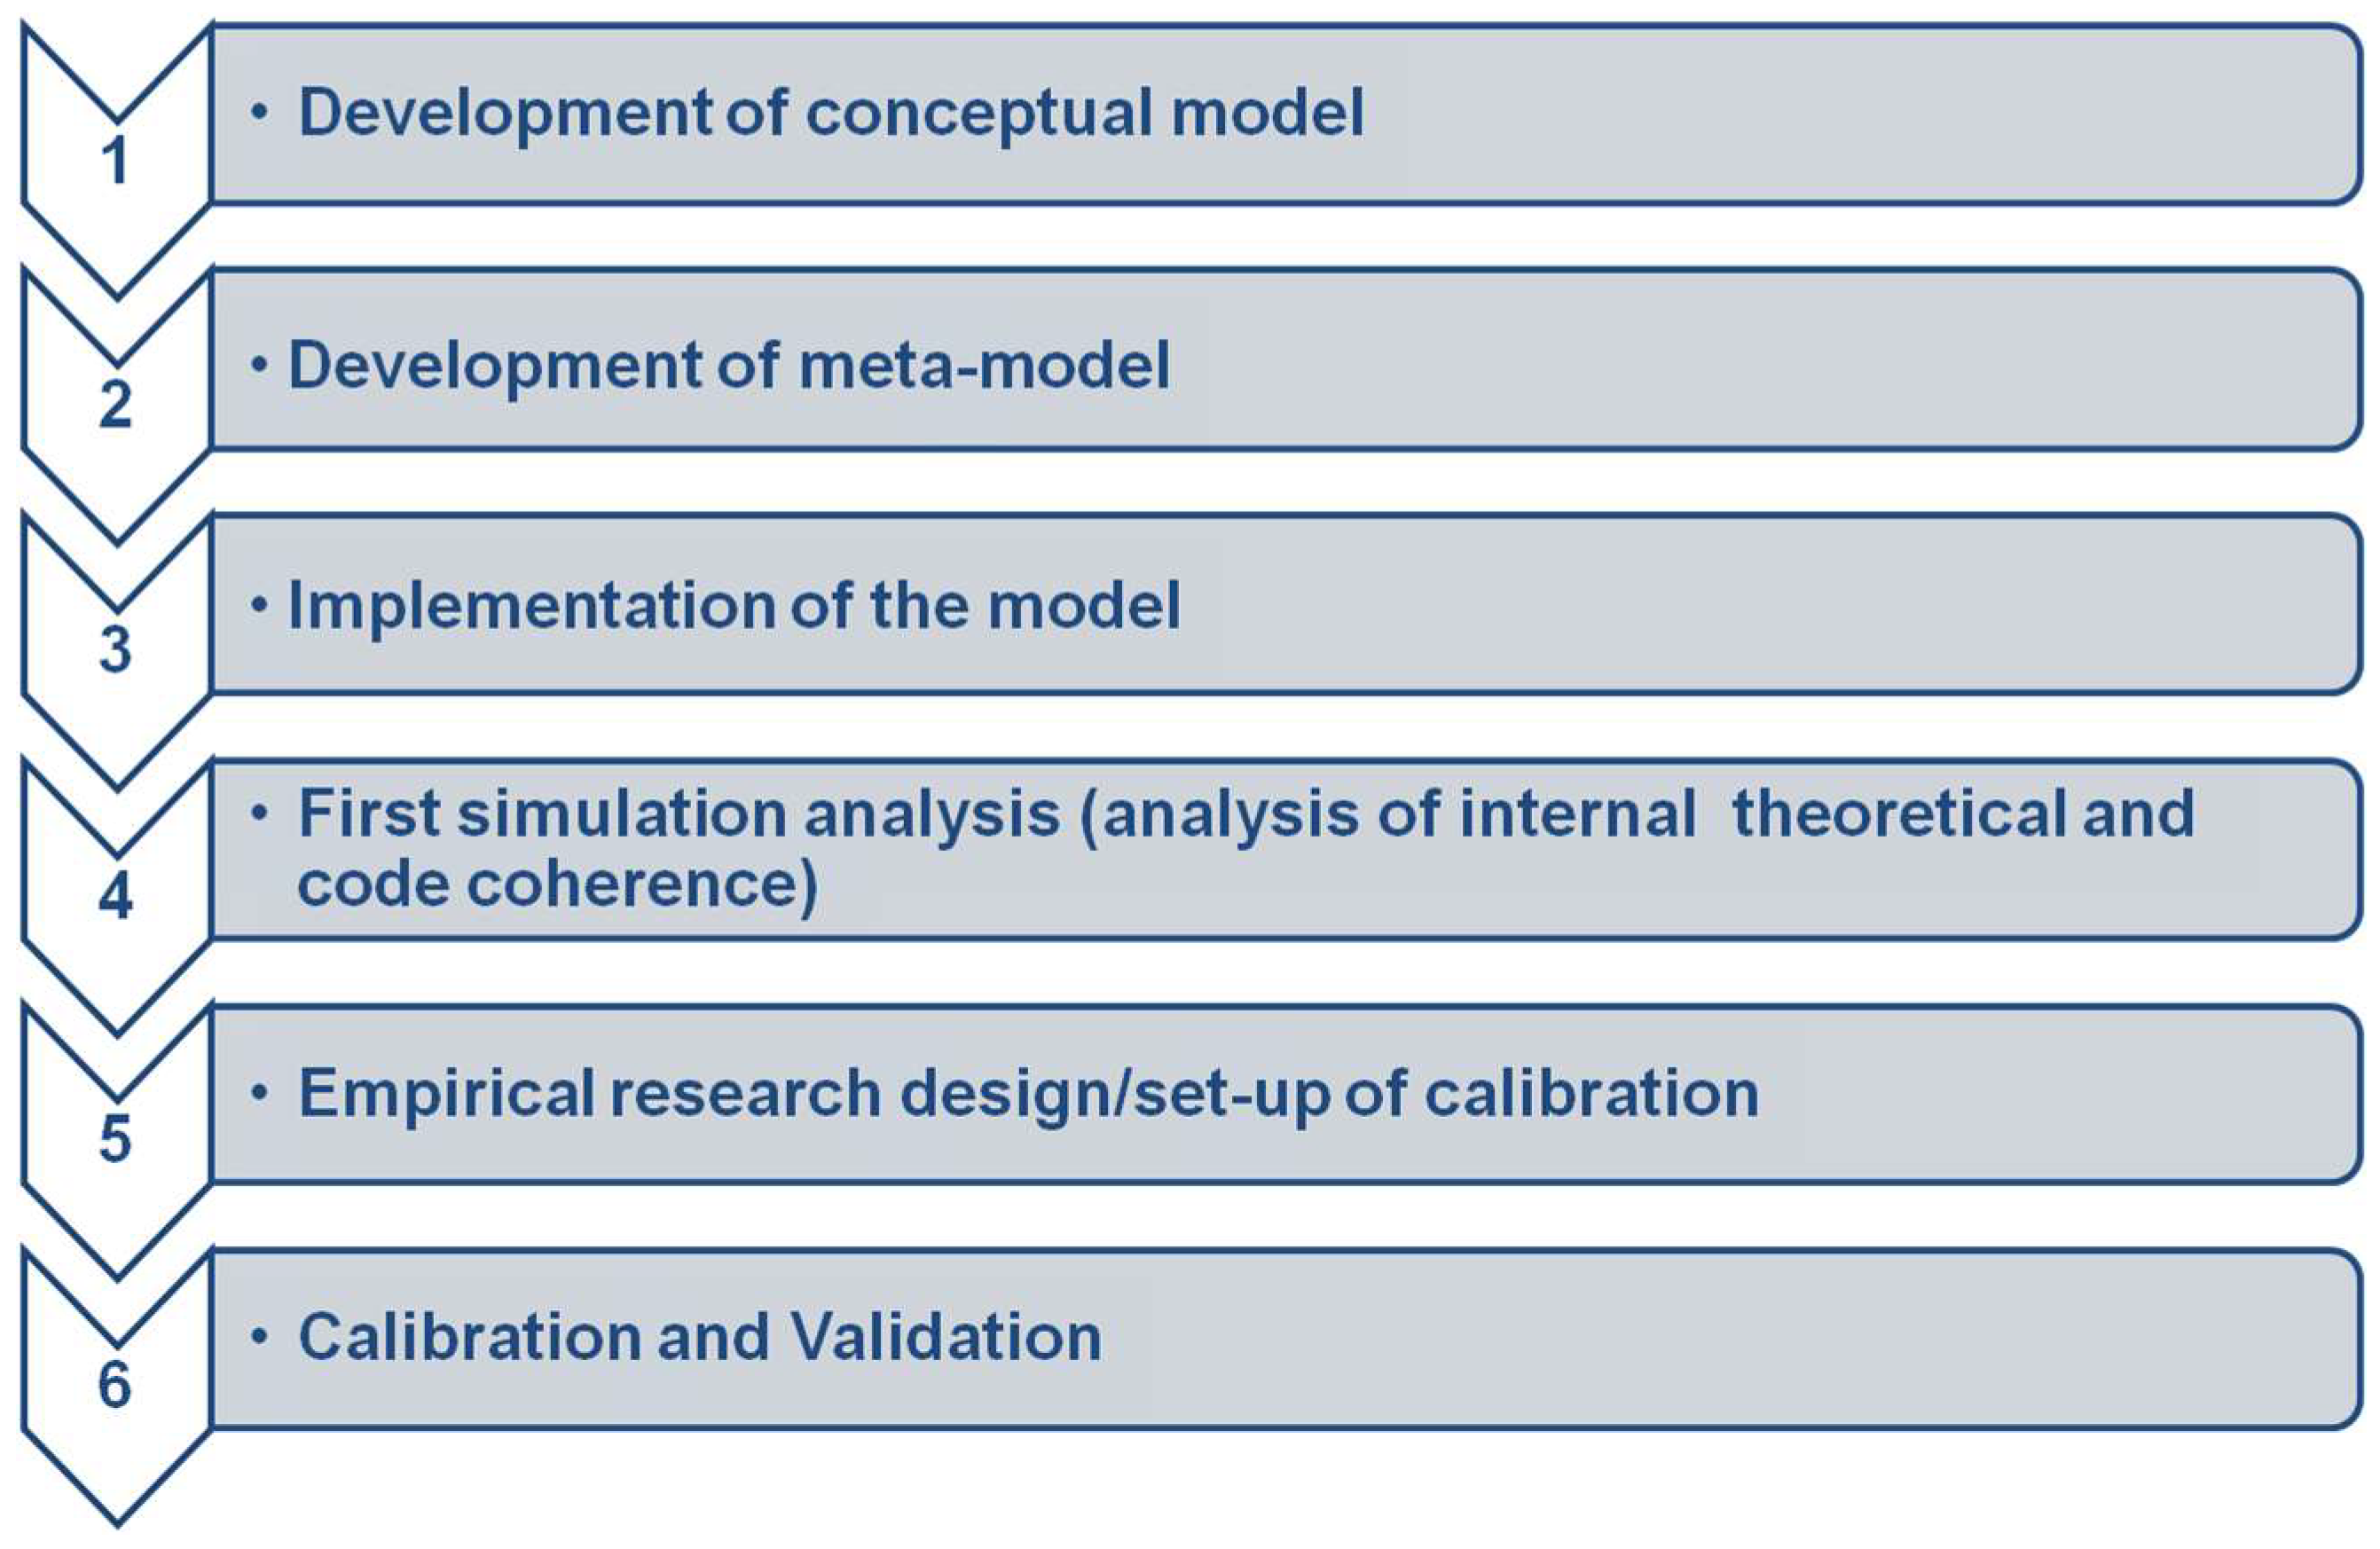
Figure 1 shows the methodological steps to set up a computational laboratory.
In the first step, the conceptual model is developed on the basis of the theoretical background.
In the specific case of the present research, the theoretical premise of the CARIS construction is represented by the framing of RIS as CASs, in which different typologies of autonomous and heterogeneous agents (firms, research institutions, incubators and other intermediaries, local, and central governments) follow their individual objectives and, at the same time, interact to exchange different contents (goods, services, information, knowledge). These interactions are massive and not centrally driven.
In the second step, a pseudo-code is set up and micro-specifications about agents’ behaviours are defined (see
Section 3.1 for the description of the ABM adopted as a pseudo-code in this research).
Such meta-model has been implemented and simulated using NetLogo 5.0.4 (North Western University, Chicago, Illinois – USA) (step 3). The implemented model, thus, has been internally checked and validated. Such a fourth step has allowed to verify the internal coherence and the absence of bugs (for more details see [
46,
47]).
External validation lets to verify whether the simulated results match the empirical data.
To externally validate the model, we adopted the calibration of parameters using empirical data available in ProInno Regional Innovation Scoreboards [
14,
15,
16] (steps 5 and 6).
Through these calibration activities, we achieved different levels of validation, namely parameter and pattern validity [
48]. Specifically, parameters validity requires that the model parameters match reality, while pattern validity occurs when the pattern of simulation outputs matches real patterns in empirical data.
Carley [
48] claims that validation is a complex issue, indeed it requires a team of researchers and can last some years. Moreover, the validation is a process made up of different steps which correspond diverse levels of validation (e.g., conceptual, theoretical, internal, external, security, etc.). As mentioned, this paper adopts the calibration to validate the CARIS model. It is a multi-step, iterative process which often requires to both set and reset parameters and to strongly modify procedures or rules in the computational model [
48]. Different levels of calibration exist and in this paper an intermediate level is reached (pattern and parameter validity). The authors are working to achieve the point validity.
Next sub-sections introduce and briefly describe the agent-based model on which the CARIS lab is based and the methodology used to calibrate parameters and validate such preliminary results.
3.1. The Agent-Based Model of CARIS
Two diverse typologies of agents are defined in the CARIS model: (1) the competitive environment (CE) and (2) the individual competent actor (ICA) (
Figure 2).
The CE is modelled as a binary string (−1 or 1) ER of length l, representing the environmental regularity. The environmental regularity is a specific request that ICAs have to match in order to survive.
The volatility (v) of CE represents the turbulence of the competitive environment and measures the distance in time between two different environmental regularities (ERs) produced by the CE. ICAs cannot access directly to the ER, because of an environmental noise (d), that alters the content of the ER transforming it in a set of new strings, named “innovation opportunities (IOs)”.
ICAs are the agents populating the virtual RIS. They can represent small and large firms, research centres or universities, local institutions and governments, and actors operating as innovation intermediaries (e.g., incubators, accelerators, gatekeepers). At this stage of the research, local institutions and intermediaries have not been introduced with their specific functions in the model. Each ICA is provided with a set of frames, representing its endowment of knowledge and capabilities. The frames collected in the individual memory of ICAs are modelled as ternary strings {−1, 1, 0} of length l. The presence of the value 0 in a dimension of a string means that the ICA lacks specific knowledge on the considered dimension. Furthermore, to each frame is associated a budget, that ICAs will need in order to perform learning activities. In fact, ICAs are involved in several activities aimed at effectively interpreting and answering to requirements from the CE (the collective objective of the system is to match the ERs produced by the CE, in order to survive and growth through innovation). To reach this aim, ICAs act individually and collectively by means of exploration and exploitation activities. During the exploration activity, each ICA accesses to one of innovation opportunity and, according to the frames in its memory, generates an individual interpretation of the IO. From a computational point of view, this means that ICAs produce a new Frame as output of the exploration; more in depth, the new frame is the product of a transformation that the ICA makes of one of the frames it has selected from its memory. The transformation is devoted to effectively match an IO and is regulated by a parameter named p, representing the propensity to exploration and corresponding to the probability to change a value of a dimension of the selected frame according to the corresponding value in the IO. At the beginning of simulation, each ICA has to generate its first Frame. Two parameters come into play in this generation process. The scope (s), that is the probability an ICA has complete knowledge about all the dimensions of the ER. The scope, thus, measures the specialization rate of ICAs in the system. The parameter competence (c), instead, measures the level of agreement between the dimension’s values of ICAs and the corresponding values of the IO.
The exploitation activity occurs when an ICA tries to find partners in order to combine the respective Individual Interpretations and to obtain a complete (without 0) collective interpretation (CI) to be sent as an answer to the CE. The exploitation activity, thus, is computationally interpreted as a cooperation among different ICAs and is regulated by the
cooperation propensity (
t) and by the
competence (
c) of the agents involved. The probability that a partnership between two ICAs takes place is calculated according to the Formula (1):
where
Lij is the probability the ICA
i decides to cooperate with the ICA
j,
H(
II)
ij is the normalized Hamming distance between the two individual interpretations of the two involved ICAs, and
Ti is the complement to 1 of the cooperation propensity (
t) of the ICA
i.
Once a CI is generated, it is submitted to CE for the evaluation and eventual reward. The evaluation of the CE implies the comparison between the Frames (CIs), produced by the cooperation networks built through the exploitation activities of ICAs, and the ER. If the percentage of matching between the two is higher than an acceptance threshold settled externally, thus, the evaluated CI will be rewarded with an additional budget, which will be then distributed among the ICAs cooperating to build up the winning CI. The additional budget will serve to sustain ICAs in performing exploration and exploitation activities that are costly. When ICAs are able to increase continuatively their budget, the system will collectively increase its economic performance, assumed as a proxy of the innovation performance. When, instead, ICAs continuatively fail in answering to the requirements of their CE, they will gradually lose their economic resources and finally will not survive in the system.
3.2. The Calibration of Parameters
The calibration has been selected as a method to externally validate the agent-based model. The external validation lets to assess the degree to which a computational model is an accurate representation of the reality. Through such methodological approach, it is possible to achieve different levels of external validity. At this stage of the research, we aimed at reaching parameter and pattern validity. Particularly, parameters validity requires that the model parameters match reality, while pattern validity occurs when the pattern of results generated by the simulations match real patterns found in empirical data [
48].
In general, calibration could occur at two levels: (i) the model’s predictions are matched with real data (analysis of the dependent variables); and (ii) processes and parameters within the model are compared with real data about the processes and parameters that produced the behavior of concern (analysis of the independent variables) [
48]. Accordingly, in this paper, a complete calibration of the independent variables is reached by using rigorous statistical methods, while the one of the dependent variables is held to the parameter and pattern validity. The authors are working to reach the point validity.
The methodological steps adopted to calibrate the model are: (i) definition of the measurement model for the CARIS’s parameters and data collection; (ii) statistical validation of the measurement model through partial least square structural equation modelling (PLS-SEM); (iii) computation of composite indicators to measure the CARIS parameters; and (iv) model calibration through simulative experiments.
The definition of the measurement model is the identification of suitable constructs and their associated measurements to operationalize and measure the CARIS parameters. As our focus is on European regions, we used as metrics mainly indicators of the ProInno Regional Innovation Scoreboards [
14,
15,
16]. Then, we clustered the CARIS parameters in four classes corresponding to the classification proposed by the ProInno Regional Innovation Scoreboard [
14,
15,
16]. Such classification was also adopted to group the results of the simulations performed with calibrated parameters.
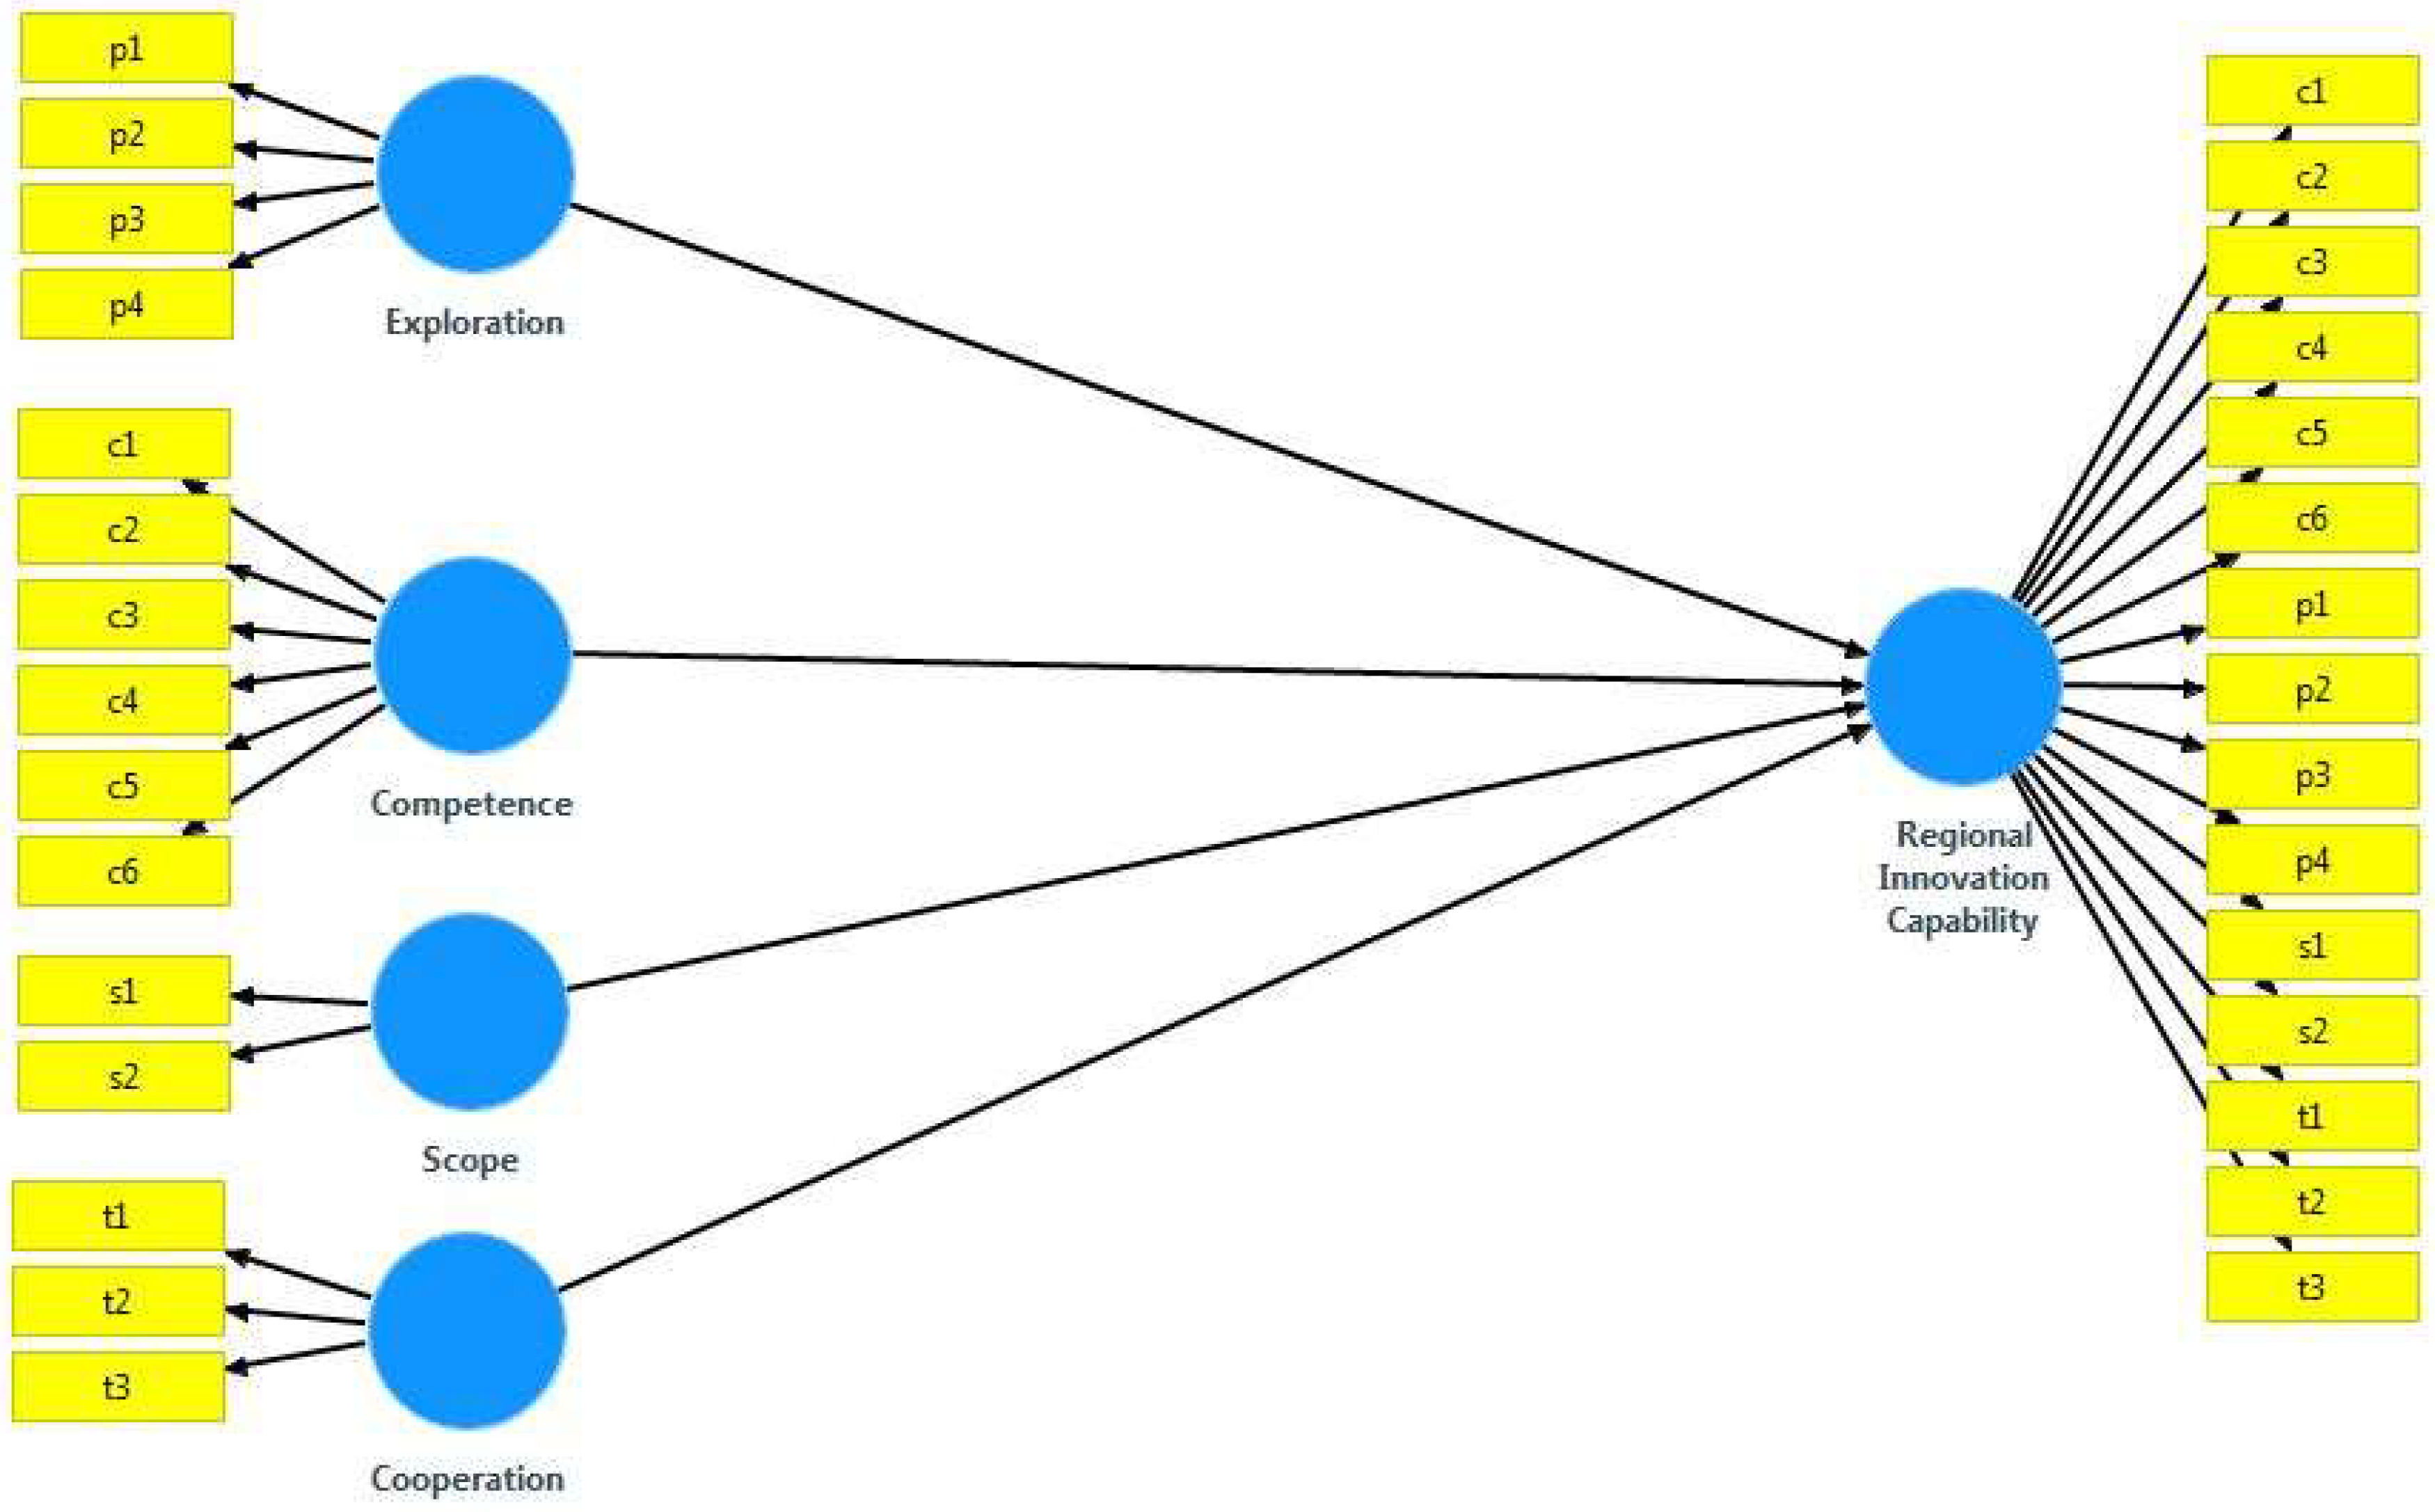
The statistical validation of the measurement model was performed through partial least square structural equation modelling (PLS-SEM). This soft-modelling technique allows measuring the impact of a set of indicators on the overall latent construct. An important advantage is that PLS-SEM allows researchers to assess both the measurement model and structural model at the same time. The measurement model specifies the indicators for each construct and lets to evaluate the construct validity. The structural model focuses on the causal relations among the latent variables. Observed variables, based on the indicators of ProInno RIS, have been assigned to a latent variable of the model as reported in
Figure 3.
The following
Table 2 shows the CARIS lab’s parameters, their meaning and how they were measured by ProInno Regional Innovation Scoreboards [
14,
15,
16].
In
Figure 3 four latent variables (CARIS’s parameters: exploration (
p), competence (
c), scope (
s), and propensity to cooperation (
t)) depend on 15 manifest variables (the indicators used in ProInno Europe RIS) and a fifth latent variable (regional innovation capability—the composite indicator representing global innovation performances) depends on the overall construct. Specifically, the parameters were calculated by using the data provided by RIS 2012 and Eurostat. All the performed tests through PLS-SEM allowed us to establish the convergent validity, the discriminant validity and the internal consistency of the measurement model.
Each parameter of the model was calculated as a weighted combination of its connected indicators. The parameters values range from 0 to 1 and are expressed as percentages (%). Following the classification scheme adopted by the RIS [
14,
15,
16], we clustered the calculated parameters in four groups, corresponding to the four classes of regions as reported in ProInno Europe Regional Innovation Scoreboards. The following
Table 3,
Table 4,
Table 5 and
Table 6 report the maximum and minimum values, the average and the standard deviation for each parameter of the model and for each class of regions (leaders, followers, moderate and modest innovators).
These parameters are used to perform additional simulations with CARIS laboratory to finally evaluate the capability of the model to represent reality in a reliable way and to identify possible patterns determining the emergence of virtuous and vicious cycles of innovation as happens in EU regions. Next section illustrates experimental sets adopted to calibrate the model against reality.
3.3. Experimental Sets
To complete the calibration of the model, eight experimental sets have been settled by modifying the values of the model’s parameters (see
Table 7 and
Table 8):
The experimental sets I, II, III, and IV in each kind of competitive environment (static and dynamic) adopt as the values of input variables the average values of calibrated parameters reported in
Table 3,
Table 4,
Table 5 and
Table 6. Thus, the experimental sets I refer to innovation leaders, the experimental sets II refer to innovation followers, the experimental sets III refer to moderate innovators, sets IV relate to modest innovators.
Table 9 shows the fixed parameters and the related values.
Table 10 reports the simulations’ output variables.
The objective of simulation experiments is to verify if these output variables, measured for each experimental set, reflect the innovation performances (higher performances for innovation leaders and lower for modest innovators) of different classes of regions as reported by the ProInno Europe Regional Innovation Scoreboard (data for calibration are obtained from the Regional Innovation Scoreboard—RIS 2009, 2012, 2014—and are related to regions in each of the four classes that are present in each edition of RIS).
4. Results
The simulation experiments were conducted to explore whether and under which conditions the micro rules we modeled in the CARIS (the objectives, the characteristics, and the local rules of different typologies of agents) determine the emergence of some known collective properties featuring RIS framed as complex learning systems.
Specifically, we aimed at verifying if the model’s predictions reproduce the different behaviours of the different typologies of European regions, namely innovation leaders, innovation followers, moderate innovators, and modest innovators. Through these experiments, we analysed the behaviour of the system in a static and in a dynamic environment for different values attributed to the exploration capacity (p), to the scope (s), to the competence (c), and to the cooperation propensity (t).
Once completed the simulations, numerous one-way ANOVA tests were performed in order to verify whether significant differences exist among the four groups considered (leaders, followers, moderate, and modest) in terms of the number of surviving agents and mean delta budget in the system. In our case, the rule of thumb for assessing the statistical significance of the one-way ANOVA tests is to check whether computed p-values are greater than or less than 0.05 (fixed p-value).
As shown in the
Table 11 and
Table 12, it is possible to claim that there are significant differences among the different groups in terms of average number of surviving agents and mean delta budget both in a static environment and in the dynamic one.
To verify which groups differed each other, the Tukey post-hoc tests were performed both in the static environment and in the dynamic one.
Table 13 shows the results of the Tukey post-hoc tests with respect to the two analysed variables (“average number of surviving agents” and “mean delta budget in the system”) in a static environment with
v = 0.8.
As can be noted in
Table 13, the only not significant difference is that between the moderate and modest groups in terms of average number of surviving agents. On the contrary, in the case of the mean delta budget, all the pairwise comparisons show statistically significant differences. Particularly marked are the differences between leaders and the other categories.
Table 12 reports the results of Tukey post-hoc tests with respect to the two output variables in a dynamic environment with
v = 0.2.
As it is possible to note in
Table 14, with respect to the average number of surviving agents, all the pairwise comparisons show statistically significant differences; on the contrary, focusing on the mean delta budget, it is necessary to highlight that there is not a significant difference between moderate and modest innovators.
Finally, summing-up the results of the calibration of the model with respect to input parameters (see details in
Section 3.2) and results of simulations of the eight experimental sets, it is possible to conclude that the computational model at the core of the CARIS laboratory, already internally verified, achieved an acceptable level of parameters and pattern validity.
5. Discussions and Implications
Although the external validation is still in progress, some preliminary findings and a certain level of validity have been obtained.
The computational laboratory CARIS, presented in this paper, has two key purposes: (i) introducing the CAS approach in the analysis of RIS; and (ii) enabling the development of effective innovation policies able to foster the growth and innovativeness of all European regions, especially the lagging ones. Therefore, if properly adopted, the CARIS lab could also contribute to the improvement of the policies transparency [
49]; put differently, the CARIS lab could allow policy-makers, stakeholders, and citizens to compare and assess the effects of different prospective innovation measures, by improving the disclosure of public information and the quality of decision-making processes.
Therefore, while the final objective of this research project is to develop a policy support tool to aid policy-makers in designing appropriate innovation policies, in this paper we present the structure of the CARIS laboratory and the steps of its construction, focusing on external validation through calibration.
Based on preliminary results, it is possible to claim that the model has both parameter and pattern validity [
48]. Specifically, parameter validity was verified by calculating the parameters’ values using the ProInno Europe Regional Innovation Scoreboard data [
14,
15,
16]; in other words, the results derived from the PLS-SEM analysis have been used to fine-tune the parameters of the computational model. Such computed parameters have been used as inputs to perform further virtual experimentations, in order to obtain simulated results to verify the pattern validity. The match between simulated patterns and real ones is shown by the results of several one-way ANOVA tests.
Moreover, it is possible to claim that our model calibration occurs at two levels. On the one hand, by comparing the patterns of the model predictions against real data, the analysis of the dependent variables is performed. On the other hand, by deriving the parameters within the model from real data about the factors that produced the behaviour of concern, the analysis of the independent variables is also carried out. This is an important contribution of the research. In fact, as outlined in
Section 2, although the debate among scholars and practitioners has often highlighted the complexity characteristics of RIS (see for example the review in [
4]), these aspects have been rarely translated in methodological choices.
In the authors’ opinion, this fact has created a distance between the theoretical RIS models and the development of appropriate policies.
There are computational models of territorial innovation systems, such as those proposed for example in [
43,
50,
51] these models, however, mainly focus on territorial systems of small and medium-sized enterprises and are often developed with the aim of theory building.
The agent-based model on which CARIS is based, on the other hand, is one of the few RIS computational models and takes into account the different actors that populate the system, trying to model their different skills (individual exploration, exploitation, cooperation), actions and interactions.
Moreover, given the attention paid to external validation, CARIS can be considered not only a conceptual model, but also a practical tool useful for policy making.
Another important result of the calibration concerns the obtained parameters values. As it is possible to qualitatively note in
Table 3,
Table 4,
Table 5 and
Table 6, the average values of parameters decrease passing from the class of Innovation leaders to the class of modest innovators. In particular, based on the differences between the average values of parameters of innovation leaders and the ones of the lagging regions (moderate and modest innovators), the exploration capacity (
p), the cooperation propensity (
t) and the competence (
c) provide us with useful insights to better understand the existence of disparity among European regions; put differently, exploration capacity (
p), the cooperation propensity (
t), and the competence (
c) could be considered as key aspects in affecting the regional innovation capability. Focusing on the exploration capacity, it is possible to note that there are differences (around 58%) among the average values of the four innovative categories (leaders, followers, moderate, and modest). This indicates the need for a major effort in terms of exploration capacity, especially for the lagging regions to improve their innovative performance. In other words, this means that policy-makers should (i) incentivize investments in research and development activities both at the public and private levels [
52]; (ii) support public-private partnership [
35,
53,
54,
55]; (iii) enhance national and regional university systems [
56]; and (iv) increase the number of researchers employed both in the public and private sectors.
With respect to cooperation propensity (t), marked differences exist among the innovative categories; therefore, it seems reasonable to state that this parameter assumes a meaning and an important role in the development of the innovative capacity of the European regions. Based on this result, cooperation should be considered essential to pursue competitive success, especially when the necessary skills are lacking.
Policy-makers should define proper policies and public measures able to trigger cooperation among different actors. According to the complexity approach, however, cooperation cannot be imposed from the top, but rather emerges from the interactions between the actors in the system (see, in this regard, the approach to cooperation suggested by [
57].
The use of an agent-based laboratory can be a proper instrument for policy-makers who intend to support the cooperation’s emergence with appropriate policy interventions. In fact, through CARIS it is possible to fine-tune the parameters that regulate the local behaviors of the actors and the creation of partnerships among them, in order to evaluate ex-ante the impact of policies on the emergence of extended forms of cooperation.
Finally, the competence parameter is also particularly interesting because it shows how the acquisition of skills by the regions could be a driver of a greater innovative capacity. According to this, the regions, to be more and more innovative, should invest in the acquisition of skills in order to be increasingly effective in responding to the needs of the market. This point could be connected with that related to the exploration capacity.
Summing up the results above depicted, we can conclude that they are in line with the main achievements of literature on RIS. Particularly, regions within medium-low innovation environments are characterized by: lack of interactions and networks “fragmentation (low cooperation propensity), low endowment of resources (competences, skills and knowledge), and “organizational thinness” [
58,
59]. In other words, the problem of fragmentation, the lack of networks and interactive learning seems to represent an important innovation barrier in such regions. On the contrary, the scope (
s) seems to have a less important impact. Indeed, the most indicative result is represented by the average value of scope parameter of the “modest” category, which is the same of that of the “moderate” and very close to that of the followers. We can assume that this parameter does not play a key role in determining a difference among the innovative classes. Put differently, this means that specialization is not a critical parameter in supporting innovation performance. This result is coherent with the main critiques against the “smart specialization” perspective. Particularly, specialization reduces the diversity and the complementarity of resources, and as consequence it reduces the resilience of a region to survive a breakthrough innovation [
34,
36]. Notwithstanding, further analyses are necessary to better understand the role of the scope parameter.
This analysis is, of course, of a qualitative nature, but represents a good starting point to formulate hypotheses about the potential impact of policy interventions.
Further research steps will regard, in fact, the implementation of policy measures in the lab and the evaluation of their impact in terms of increasing or decreasing innovation performances of regions.
According to [
48], the setting up of computational laboratory requires long time and the involvement of several researchers and experts with different skills and knowledge. To date, although theoretical and modelling activities have been performed, and the model has been verified and conceptually validated, additional research and model fine-tuning activities will be required.
This is also the case of this computational model. The external validation is not completed at the highest level and this aim represents the purpose of future research.


