1. Introduction
This study investigates the banking expansion across the 6 regions and 23 states/UTs of the country. For the investigation of banking expansion, credit index and deposit index have been calculated. The Credit to Deposit Ratio (CDR) was calculated to measure the flow of the credit as against the deposits across the regions. These indices are calculated based on data sourced from the various publications of the Reserve Bank of India (RBI). The study further examines the linkage between the banking expansion and national income. For examining the linkage between the banking expansion and national income, a set of panel data were prepared with the 23 states/UTs as cross-section units, pooled over the period 1990 to 2015. This study was conducted with the aim of testing the hypothesis that the banking expansion has positive effect on the national income (the term financial deepening can be replaced with banking expansion/development, as in the study conducted by Hakeem [
1]. Banking expansion acts as an important component in the process of financial deepening, though the process of financial deepening has a broad objective. Hakeem examined the relationship between banking development, human capital and economic growth). To examine banking expansion and income growth in India, several hypotheses were formulated and tested in framework of the panel data. To test the stated hypotheses, econometric models with fixed effects and random effects were estimated by using a panel data regression analysis approach. The state-wise analysis indicates that the Union Territories of Chandigarh and Delhi, belonging to the Northern region, showed a credit index and deposit index in the high range. The state of Maharashtra, belonging to the western region, showed a credit index in the high range. Among other states, belonging to the entire region, credit index and deposit index in the low range were shown. Furthermore, the regression analysis reveals that deposit mobilization has a significant and positive effect on credit disbursement. Credit disbursement has a positive effect on the national income. Moreover, the national income has a significant and positive effect on the income of individuals.
According to Reserve Bank of India, banking sector development is expected to contribute positively to economic growth, which will be followed by the recent revival of investment, implementation of goods and services tax and an insolvency and bankruptcy code, and the recapitalization of public sector banks. The GDP growth rate stood at 7.1% for the year 2016–2017, inflation was around 4–5%, and GDP growth in 2018–2019 is projected to be higher, at 7.4%. These are some of the important reforms aimed at boosting sustainable financial development in the Indian economy through which sustainable income growth can be achieved (
https://rbidocs.rbi.org.in/rdocs/PressRelease/PDFs/PR2783EE02AC70B75847BD95B98208029A6D54.PDF). Hence, the present study is an attempt to explain financial development and income growth in India.
The rest of the article has been organized as follows:
Section 2 presents the literature review;
Section 3 describes the methodology and data details, results and discussions;
Section 4 presents the summary and conclusions.
2. Review of Literature
The literature evidence presents the linkage between banking expansion and socio-economic indicators, including income and poverty. The study highlights the contribution of financial capital to income growth, the linkage between human capital and financial deepening and economic growth, and the challenges on the path of banking expansion. Moreover, past studies have explored the linkage between credit disbursement and economic growth, and banking sector reform and economic growth.
Some recent studies, including Sarma and Pais [
2], Anwar [
3], Strahan [
4], Swamy [
5], Al-Tamimi et al. [
6] and Chibba [
7], examined the role of financial inclusion in income growth and poverty reduction. In this context, Sarma and Pais [
2] examined the relationship between financial inclusion and development in 49 countries. The study revealed that financial inclusion is strongly related to human development measured in terms of income inequality and adult literacy. Anwar [
3] examined the impact of bank branch expansion on credit disbursement across the states/UTs of India. The study was conducted based on the panel data regression analysis approach for the period 1991 to 2010. This study tested various hypotheses, one of which was put forth to test whether bank branch expansion had a positive effect on credit disbursement. Variables including number of bank branches, deposits, and number of credit accounts were used as the explanatory variables, and credit disbursement was used as the dependent variable. The study concluded that bank branch expansion has a significant and positive effect on credit disbursement.
Strahan [
4] examined the effect of banking deregulation on US economic growth. The study emphasized that the banking deregulation—an historic change—allowed the banks to offer better services to their customers at lower prices. As a result, real economic activities seemed to have benefited. An overall acceleration in economic growth was noticed after the banking deregulation (Strahan [
4] study has been referenced to make it clear that the banking deregulation was undertaken for the free expansion of the banking sector, so that the banking sector could achieve expansion in an easy manner. The ultimate objective of banking expansion through banking deregulation was to enhance banking facility in the economy of the US. The same pattern was pursued for Indian banking expansion through the nationalization and deregulation of the banking sector).
Swamy [
5] explored the issues and challenges of financial inclusion by using factors including publicity of financial literacy, relaxation in identity documents, role of rural posts, effective use of information technology solutions, etc. The study highlights the captioned factors that support financial inclusion for inclusive growth. Furthermore, the study concluded that approximately one third of the population had been engaged under the process of financial inclusion, and ultimately, financial inclusion was effectively reducing poverty.
Chibba [
7] examined the nexus between financial inclusion (FI), poverty reduction (PR) and millennium development goals (MDG) in Canada. He concluded that four key pillars, including private sector development, financial literacy, microfinance and public-sector support, were the prerequisite for empowering the nexus of FI-PR-MDG.
Along this line, earlier studies were conducted to examine the impact of credit disbursement and sectoral output of the Indian economy, e.g., Saygili et al. [
8], Anwar [
3], Levine [
9,
10], Arestis et al. [
11], Sandberg [
12], Jith and Strahan [
13], Westermann [
14] and Chopra [
15], intimately examining the nexus between finance and growth. In particular, these studies present some theoretical, empirical and regulatory and policy aspects of financial development and economic growth. It is observed that better-developed financial systems influence economic growth. In addition, financing regulation and financial deepening remain the main prerequisites for efficient allocation of financial resources.
Saygili et al. [
8] analyzed the role of human capital in productive growth across a panel of around 50 countries, especially for Turkey. They concluded that human capital plays a significant and positive role in productive growth for all the countries other than Turkey.
Anwar [
3] investigated the effect of credit disbursement on the sectoral output of the Indian economy. The study was conducted by using a panel regression analysis approach. For the application of the panel regression analysis approach, the panel datasets were prepared with the 15 states as the cross-section units for a period ranging between 2001 and 2010. The Least Square Dummy Variable (LSDV) estimation approach was employed to capture the state-wise effect of credit on sectoral output. For estimating the effect of credit disbursement on the sectoral output of the Indian economy, the credit disbursement to the different sectors was used as the independent variable, and sectoral output was used as the dependent variable in the regression equation. The study revealed that credit has a statistically significant and positive effect on the output of the agriculture, industry and services sectors of the Indian economy.
Arestis et al. [
11] presented an excellent literature review on financial development and economic growth. A long-term approach explains that banking sector developments accelerate economic activity, and it is more highly important than stock market development (e.g., Arestis et al. [
16]). In order to reveal the nexus between financial development and economic growth, they reviewed around 85 empirical studies and concluded that a positive effect exists between financial development and economic growth. Moreover, Chortareas et al. [
17] studied financial development and output in a panel data setting. They found that the relationship between financial development and output does not hold in the long-run. However, in the long-run, causality runs from financial development to output in progressive economies, while in emerging economies, causality is bidirectional.
Sandberg [
12] investigated the relationship between economic growth and banking. The study was conducted based on the history of Swedish commercial banking from 1656 until the first world war. The study carried out international comparisons based on the quantitative measures developed by Rondo Cameron and Raymond Goldsmith. The study concluded that at all stages of its early industrialization, Sweden had a remarkably large and efficient banking system. The determinant of banking efficiency was highlighted as being the extensive banking experience of the population.
Jith and Strahan [
13] investigated the linkage between the financial market and economic growth for the United States. For measuring the financial market development, the relaxation of Bank branch restrictions was used as the parameter, and per capita growth in income and output growth were used as the economic growth measurement parameters. The study concluded that per capita growth in income and output increased significantly following intrastate branch reform. Furthermore, the study highlighted that the observed changes in growth were the result of changes in the banking system.
Westermann [
14] studied the linkage between credit disbursement and output at the sectoral level by using vector autoregression methods. To analyze such linkages, the data was sourced from the Nepal Rastra Bank (Economic Report 2008–2009) for the period 1973–2010. The study concluded that service sector output exhibits the strongest response to change in domestic credit, while agriculture sector output exhibits weak response to change in domestic credit. Were et al. [
18] explored the effect of bank credit accessibility on the economic performance of Kenya using data for the 15 years from 1995 to 2010. Real output of the industry was used as a proxy for economic performance, while in the regression model credit, labor and interest rate were used as explanatory variables. Using panel data analysis, the study concluded that credit has a statistically significant positive effect on sectoral GDP.
The literature survey evidences that there is still a lack of studies exploring banking expansion at the state level in India. Furthermore, the impact of banking expansion on income growth has not been tested by past studies. This study was carried out in consideration of this gap in the literature.
3. Materials and Methods
In this section, we present an a priori hypothesis to be tested based on the empirical model. The data description and index of banking expansion are also presented. This section also offers a discussion of descriptive analysis.
3.1. Hypothesis of the Model
H1. A survey of the literature provides insights suggesting the hypothesis that the expansion causes an increase in per capita income. For an understanding of the linkage between banking expansion and income growth, the hypothesis was further proposed at a disaggregated level, whereby an increase in deposit mobilization causes an increase in credit disbursement. Furthermore, credit disbursement causes an increase in national income, and an increase in the national income causes an increase in the income of individuals.
Past studies, e.g., Anwar [
19], have explored the linkage of deposits and credit across the bank branches. Past studies have depicted the bidirectional relationship between credit disbursement and deposit mobilization. Studies have revealed that credit disbursement has a positive effect on the economic output. With growth of economic output, savings growth takes place, as suggested by the savings and investment theory. This might not fulfill the economic equilibrium criteria. Now, the measurement of banking expansion in terms of growth in credit disbursement and deposit mobilization would provide an advanced level of understanding of the actual level of banking expansion across the country. The hypothesis can be expressed as follows:
Furthermore, Anwar [
3] and Westermann [
14] provide insights for understanding the linkage between banking expansion and national income. The studies by Helliwell and Putnam [
20], Hakeem [
1], and Solow [
21] make it possible for us to understand the linkage between the number of workers (Now), Social Sector Expenditure (SSE) and economic growth. Based on past studies, the selection of variables was made, including the credit disbursement, number of workers, and SSE as the determinants of the national income. The variable PCNSDP limited in terms of representing the income of individuals, as it only shows the average income of the population. As the Indian economy is still in the developing stage, there are a number of income sources in the unorganized economic segments of the country. The income of all individuals is not fully accounted for by any of the domestic or international agencies. Thus, the limitation of data availability for Indian individuals’ incomes compels scientists to estimate income using the average income measure. The hypothesis can be formulated as follows:
Moreover, this study investigates whether the national income has a positive impact on the income of individuals. This hypothesis can be put forth as follows:
The plus sign (+) indicates that the variables have a positive effect.
3.2. Data Description
There are numerous ways to define and identify the level of banking expansion across geographical units, including village, town, city, district, state, etc., but this study is confined to the state level. The data for credit, deposits and number of bank branches was sourced from the Basic Statistical Return (BSR) published by the Reserve Bank of India for the period 1991 to 2015. Data for social sector expenditure and capital expenditure were sourced from the Handbook of Statistics on State Government Finances—2010 and various issues of State Finances. The data for the per capita net domestic product and net domestic product were obtained from the Handbook of Statistics on the Indian Economy.
To understand the level of banking expansion, the credit index and deposit index were calculated based on the following formula suggested by Chakravarty and Pal [
22] (Chakravarty and Pal [
22] developed the captioned formula for calculating the financial inclusion index, and they calculated three indices, including indices for availability, penetration and usage of financial services).
Normalization was applied to ensure that the index lies between zero and one for each year across the states. It takes a maximum value of one, which indicates the upper bound, and a minimum value of 0, indicating the lower bound. Furthermore, it has been suggested that index values ranging from 0 to 0.3 are considered to be in the lower range of banking expansion, index values ranging from 0.3 to 0.5 are considered to be in the medium range of banking expansion, and index values from 0.5 to 1 are considered to be in the high range of banking expansion. Meanwhile, indicates the maximum value, and indicates the minimum value in a year.
For the testing of the hypothesis, the panel data set was prepared and paneled over the 23 states for the period between 1991 and 2015. For the understanding of the linkage between the set of variables, a correlation matrix was calculated. For the estimation of the regression equation, a panel data regression analysis approach was applied. In the panel regression estimation, both fixed and random effect models were used. The decision regarding the suitability of the fixed effect model or the random effect model was made by calculating the Hausman test statistics.
Table 1 presents a description of the variables employed in the regression specification.
3.3. Descriptive Analysis
For comprehending the level of banking expansion across the regions, 6 graphical figures were worked out.
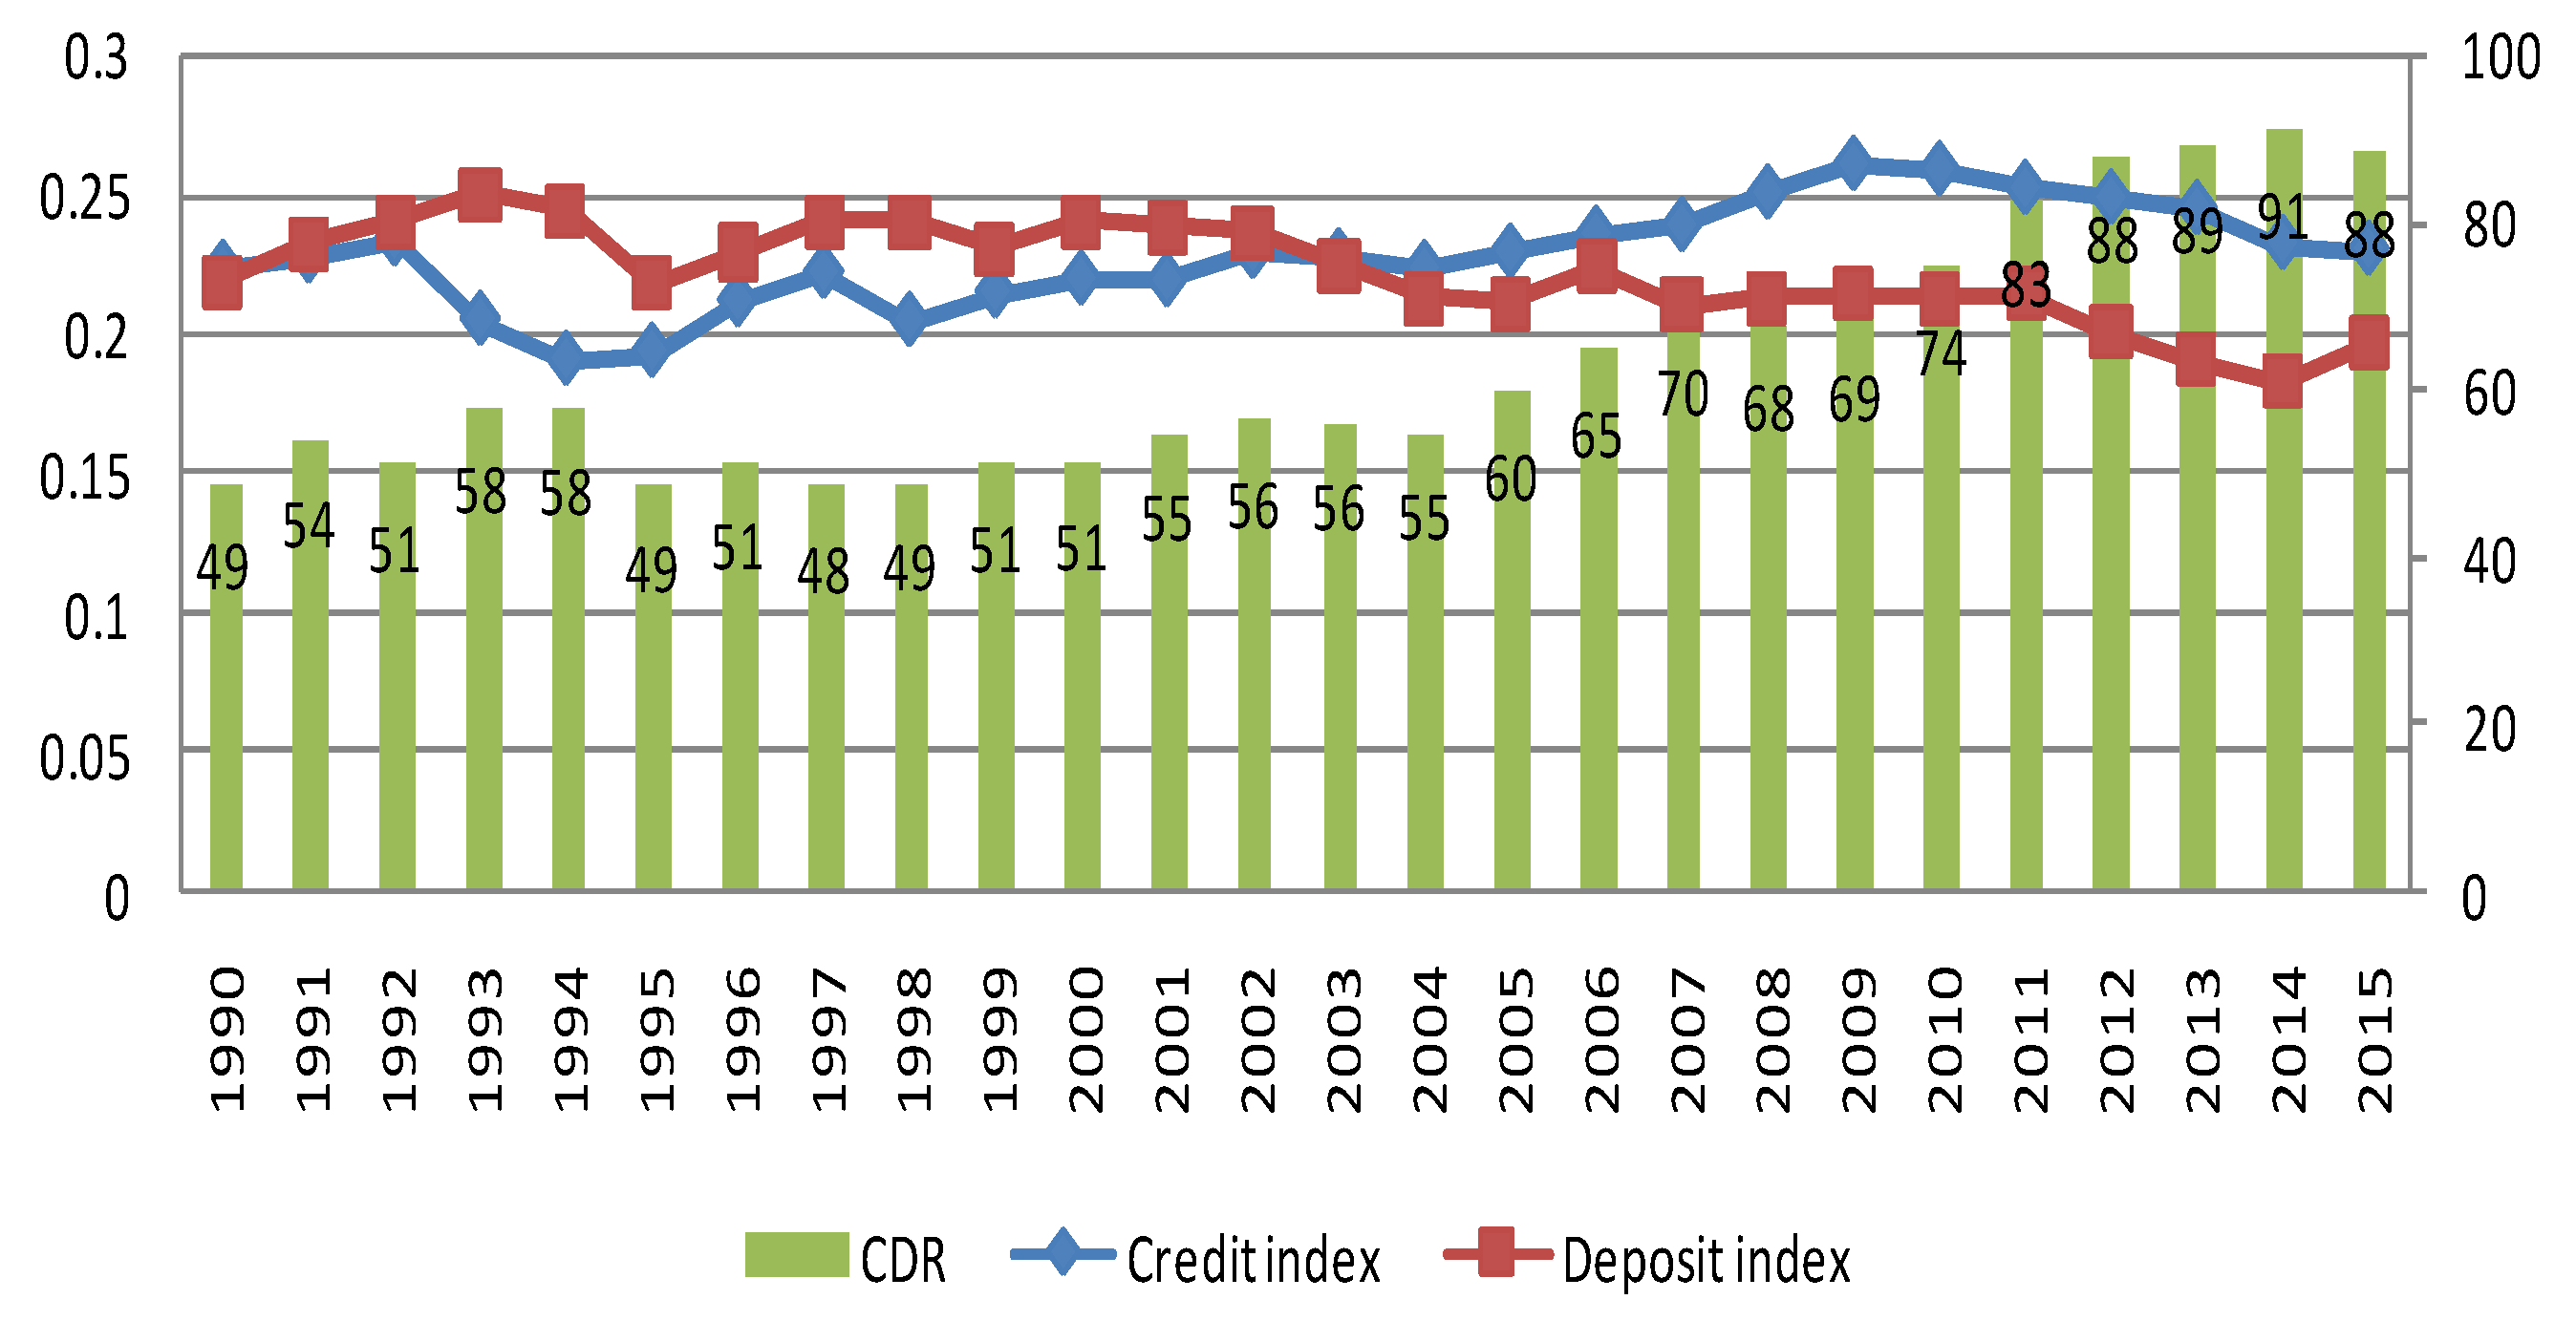
Figure 1 was drawn for the Northern region, which indicates that the indices of credit and deposit lie in the lower range (0 to 0.3) over the period, while the Credit to Deposit Ratio (CDR) was recorded in the range 49% to 60% until the year 2004, and thereafter the CDR was recorded at 60% in the year 2005, increasing to 74% in the year 2010. The highest CDR of 91% was recorded in the year 2014.
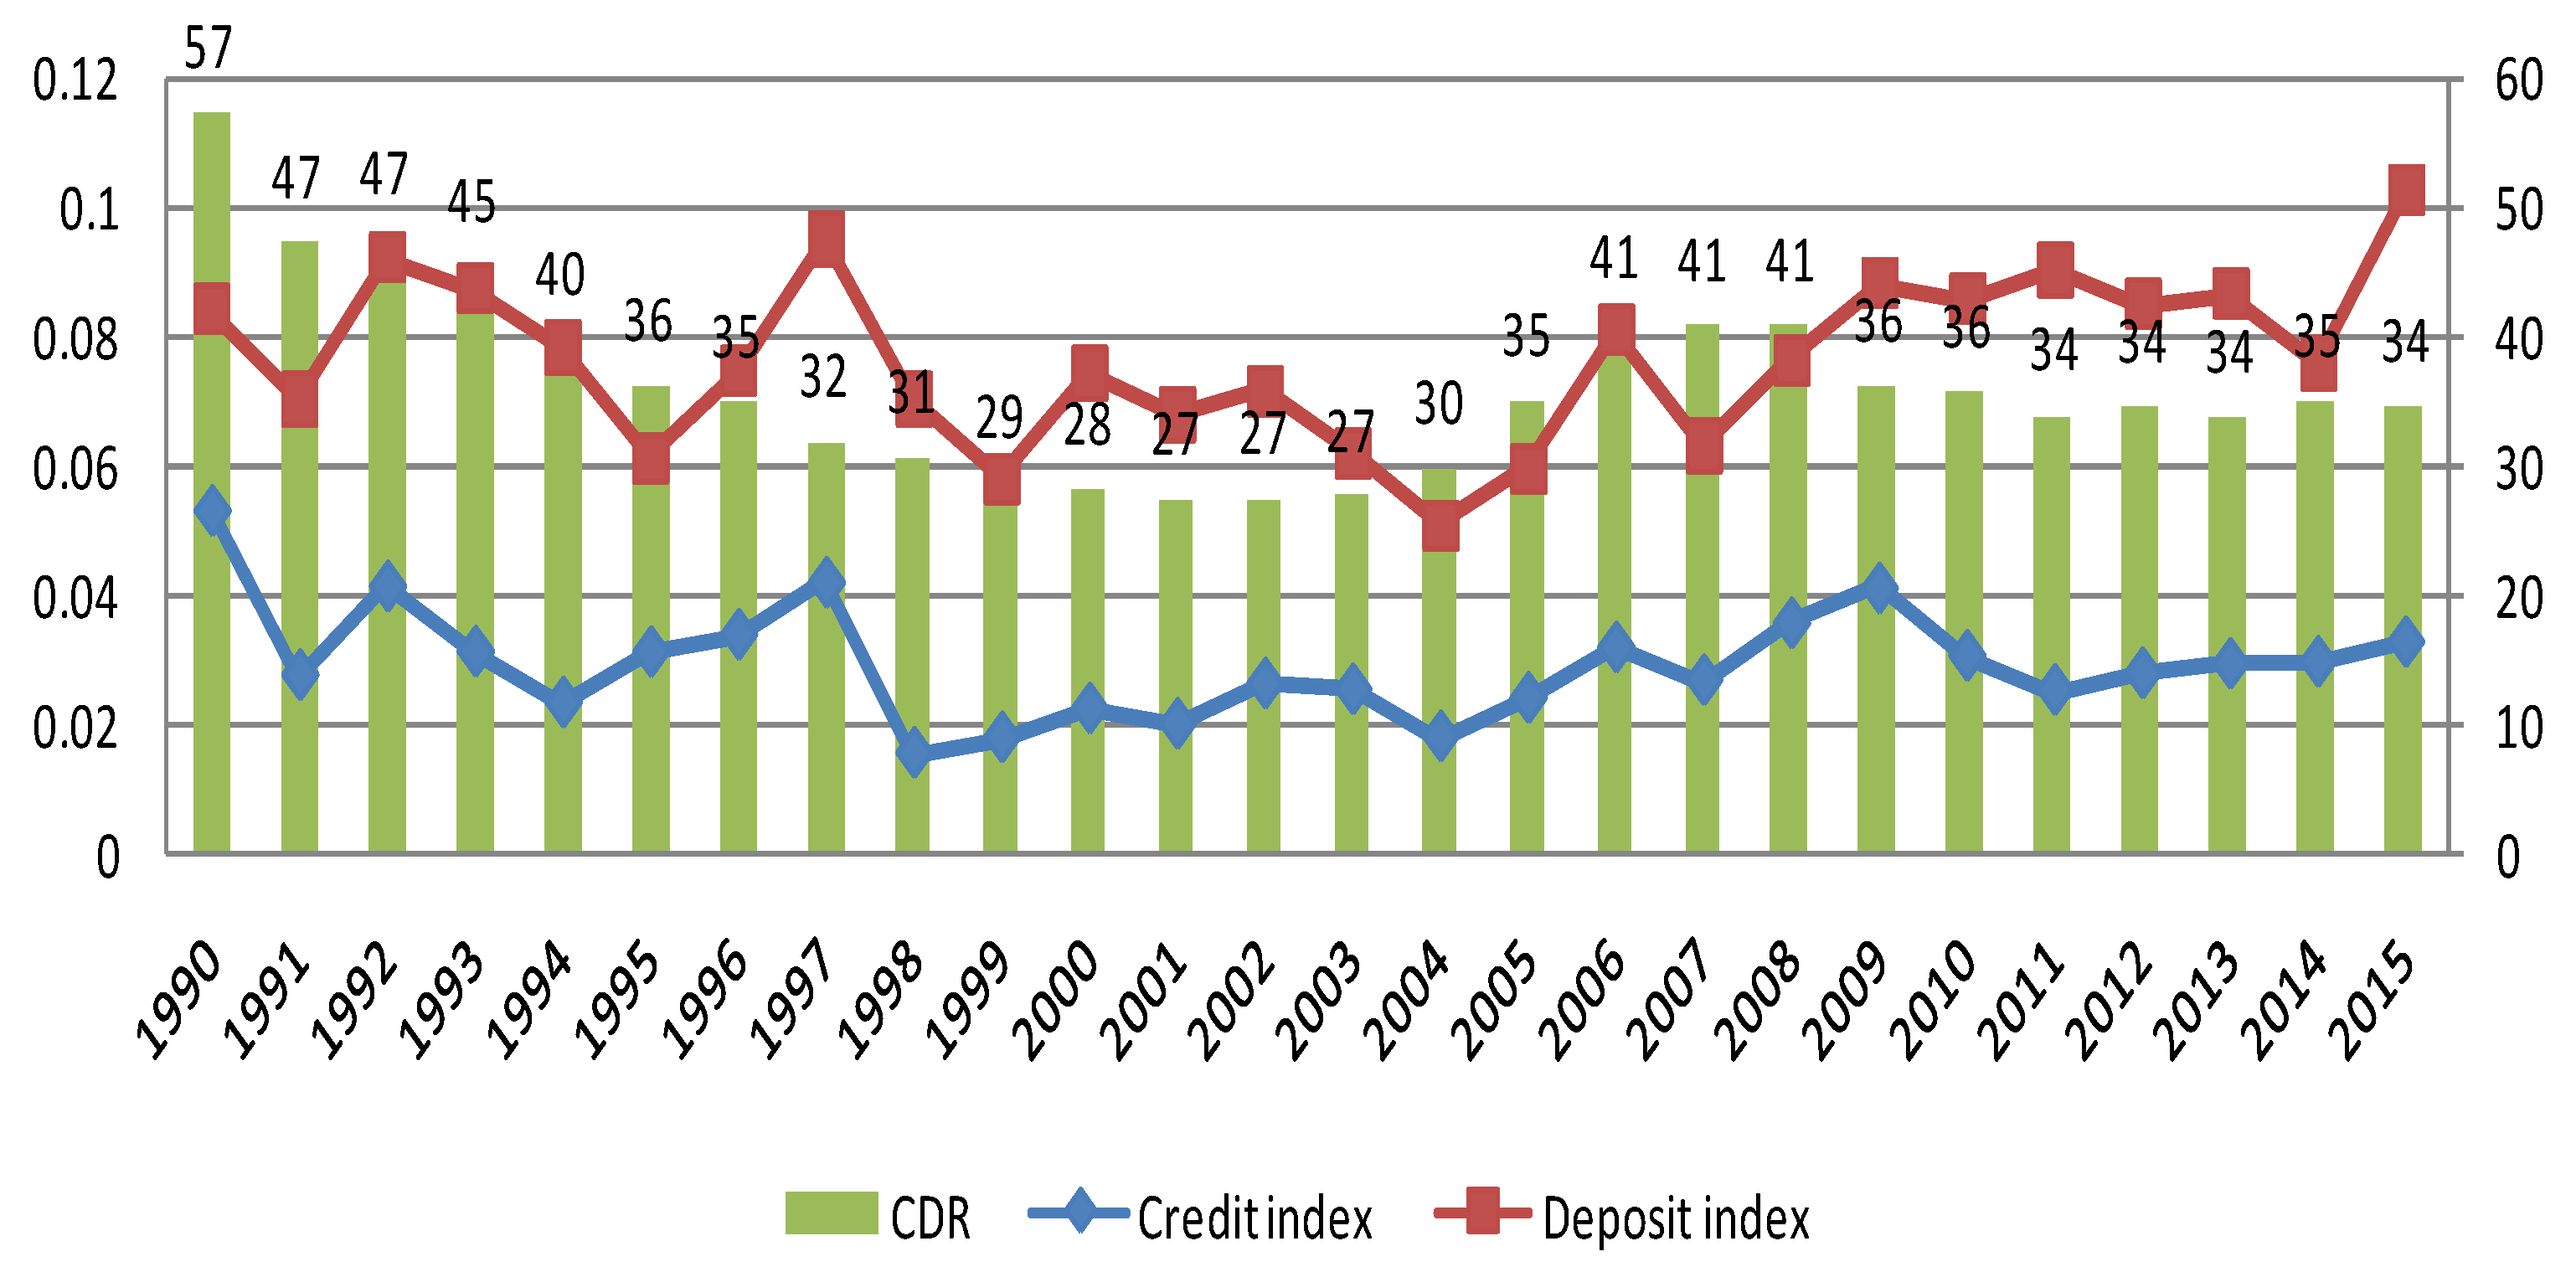
Figure 2 was plotted for the Northern-Eastern region, which indicates that the indices of credit and deposit lie in the lower range (0 to 0.12) over the period, while the CDR followed a decreasing trend from 1990 to 2003 and was recorded in the range from 57% to 27%; thereafter, the CDR showed an upward trend and was recorded at 41% in the year 2007. Furthermore, CDR showed a downward trend over the period from 2007 to 2015, and was recorded at 34% in the year 2015 (although the financial market exists in India, it is not very accessible for all of the citizens residing in the country. Around 70 percent of the population of the country still resides in rural areas. A wide range of financial illiteracy exists across the states. Hence, the CDR ratio is used as the policy variable for examining the banking expansion in terms of credit disbursement).
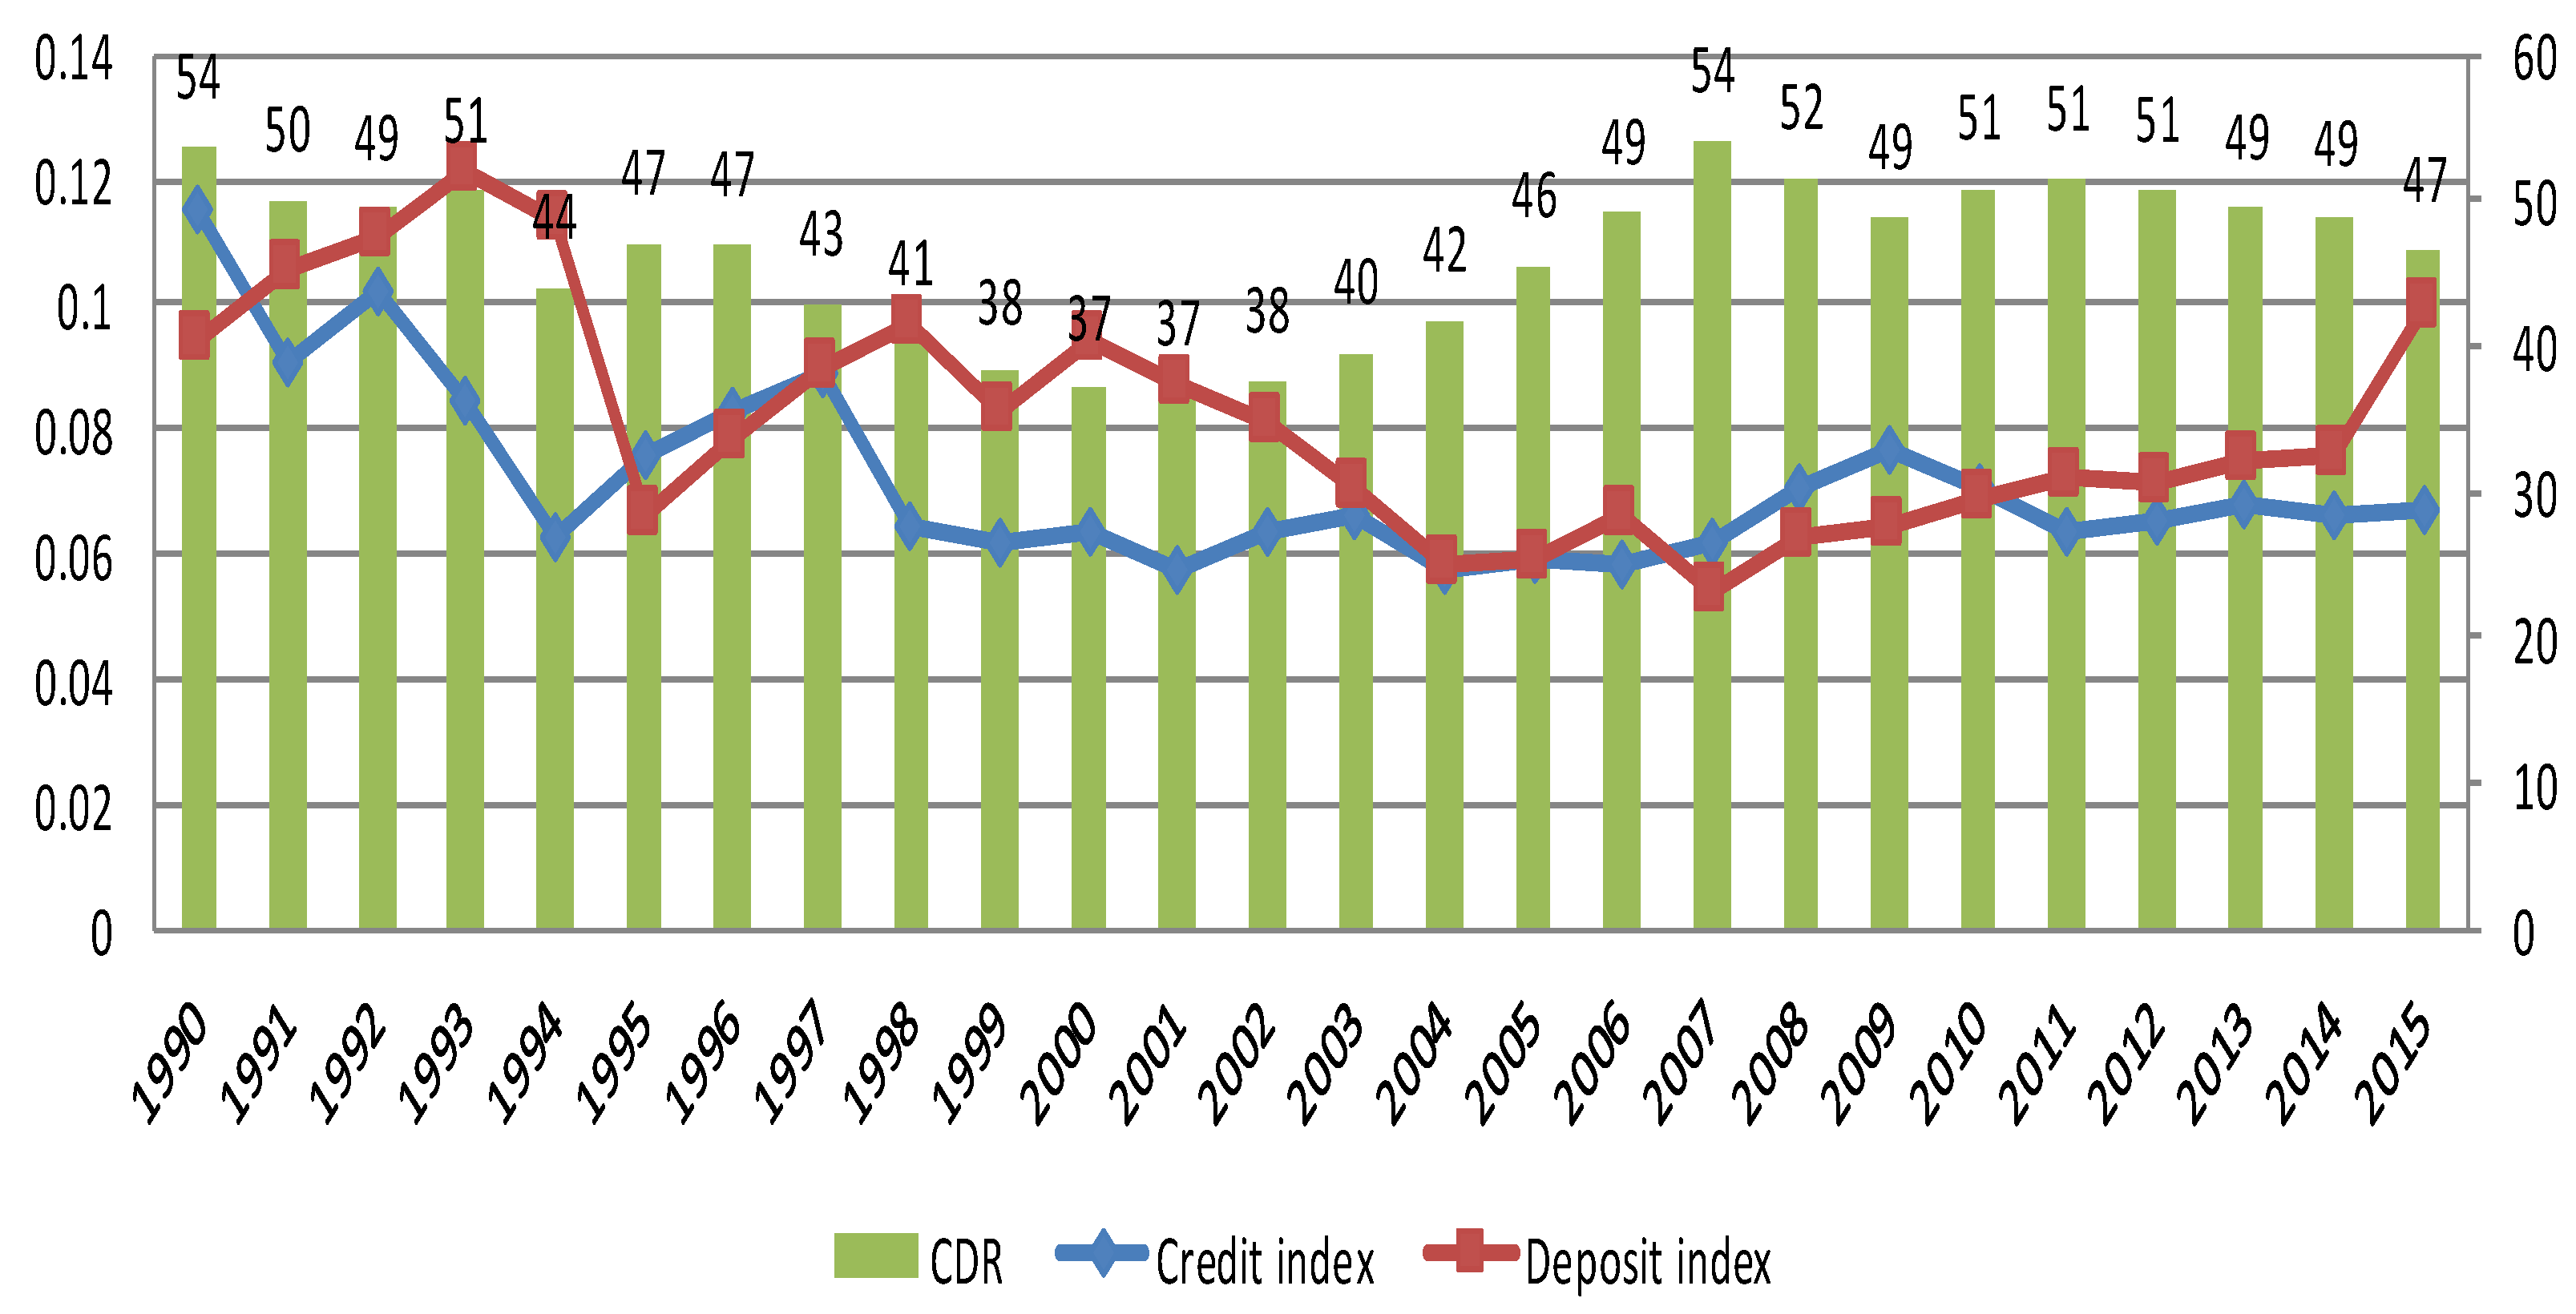
Figure 3 was prepared for the Eastern region, which indicates that the indices of credit and deposit lie in the lower range (0 to 0.14) over the period, while the Credit to Deposit Ratio (CDR) was recorded in the range 54% to 37% until the year 2001; thereafter, the CDR showed an upward trend and was recorded at 54% in the year 2007.
Again, after the year 2007, the CDR showed a downward trend over the period and was recorded at 47% in the year 2015. The highest CDR of 54% was recorded in the years 1990 and 2006.
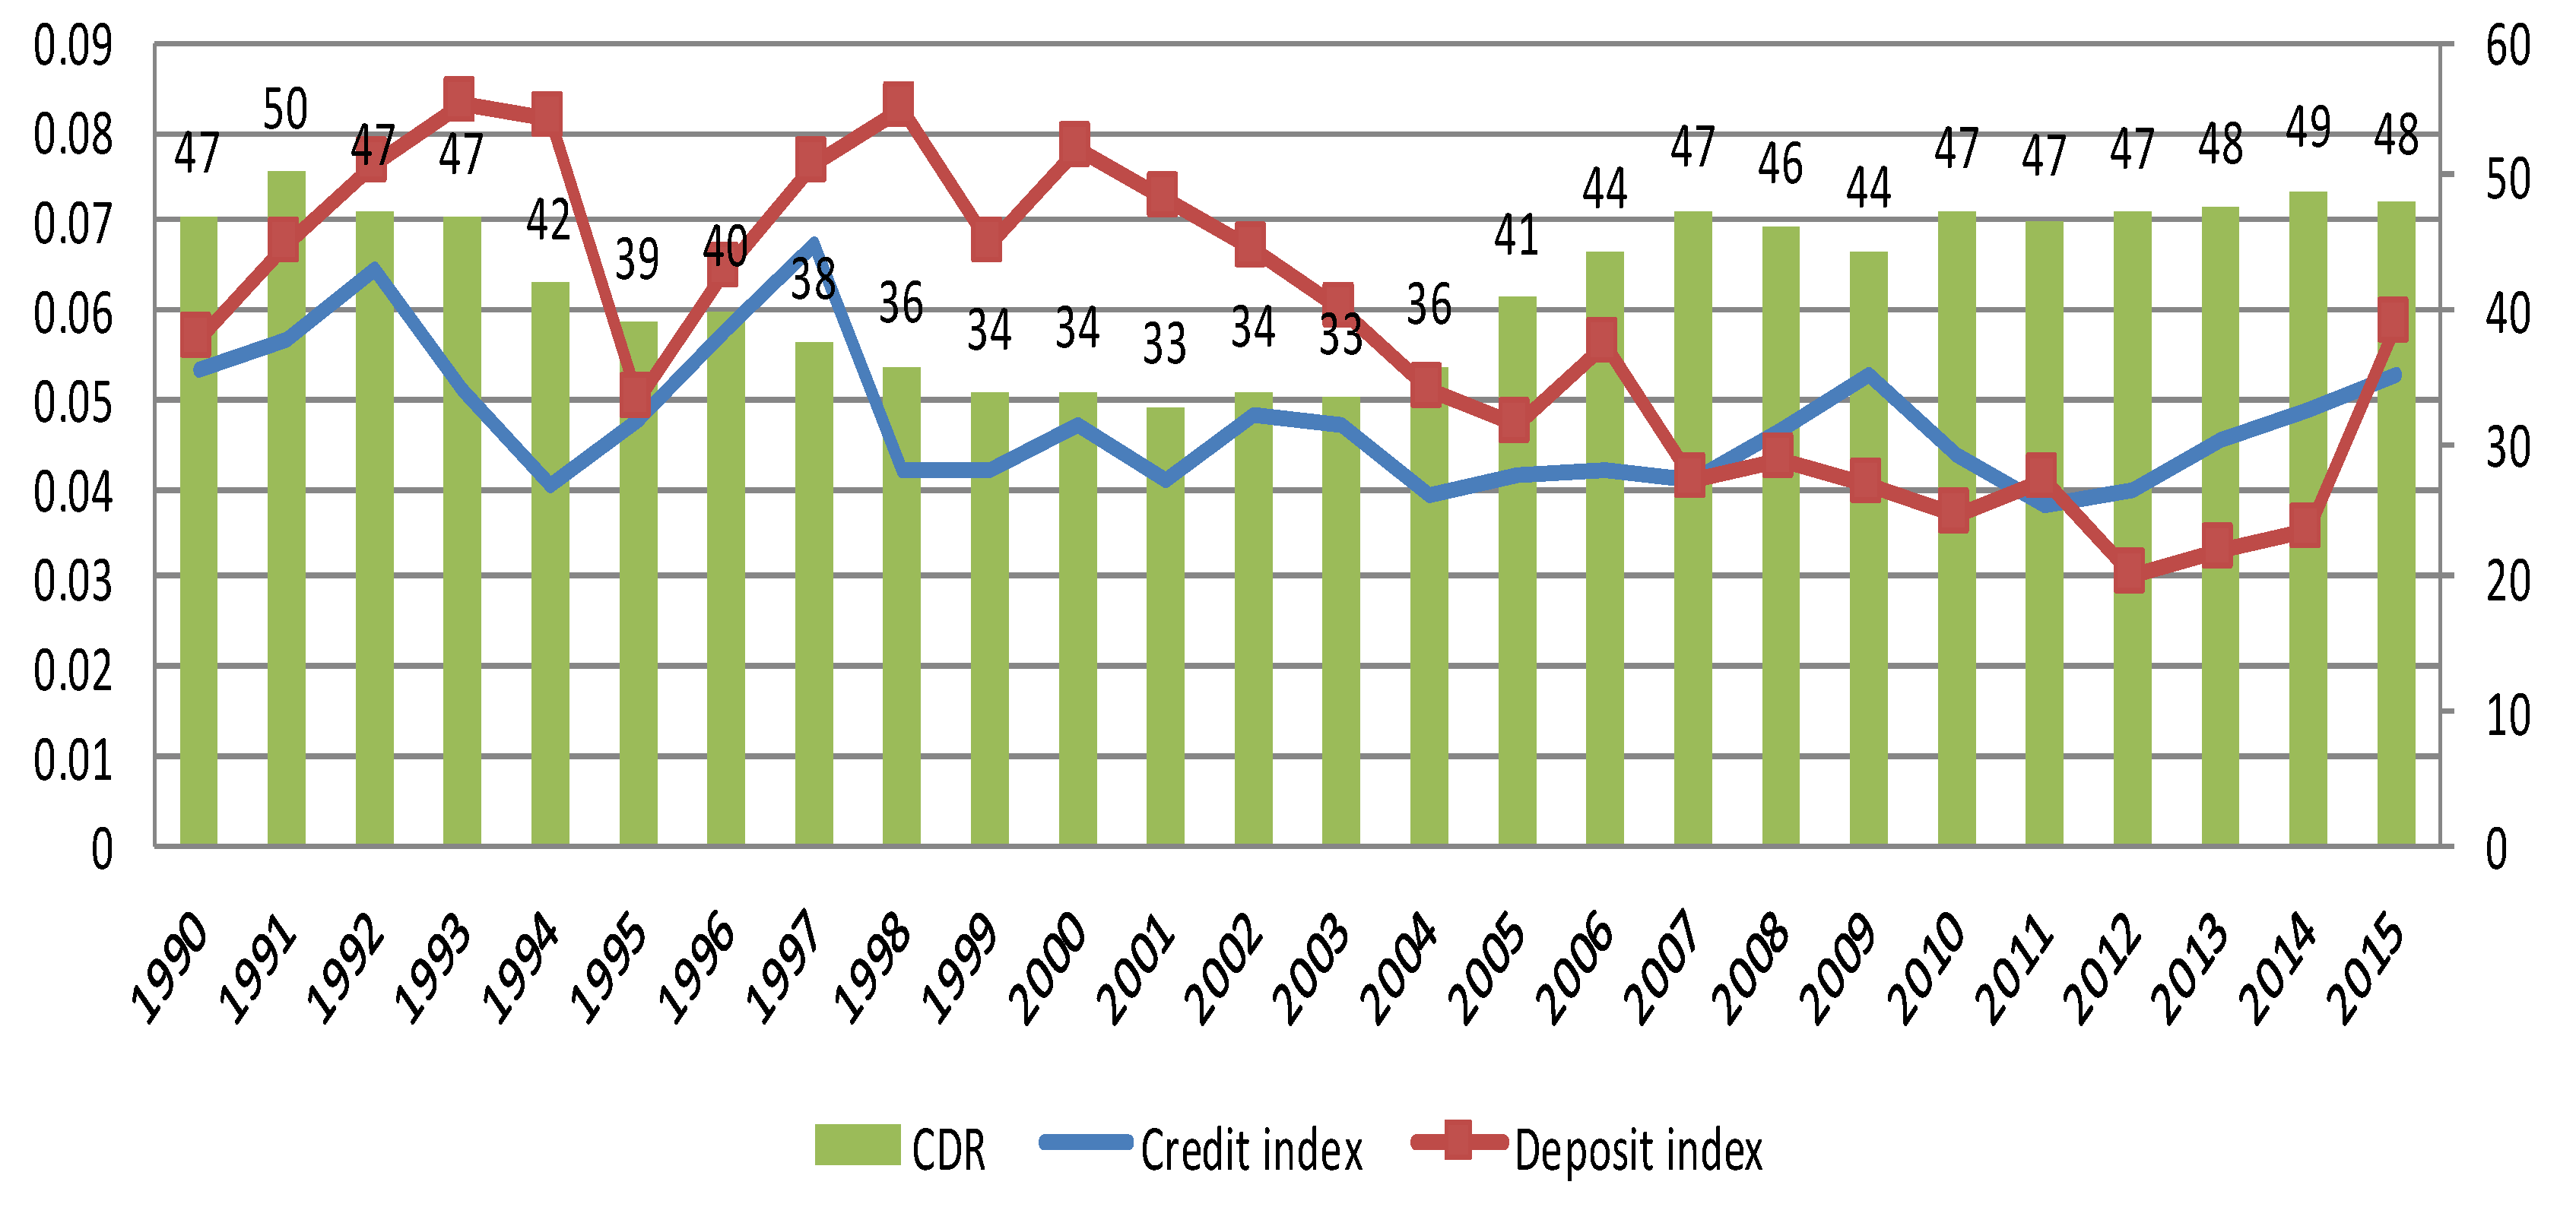
Figure 4 displays the Central region, indicating that the indices of credit and deposit lie in the lower range (0 to 0.09) over the period, while the CDR followed a decreasing trend from 1991 to 2003 and was recorded in the range from 50% to 33%; thereafter, the CDR showed an upward trend and was recorded at 48% in the year 2015.
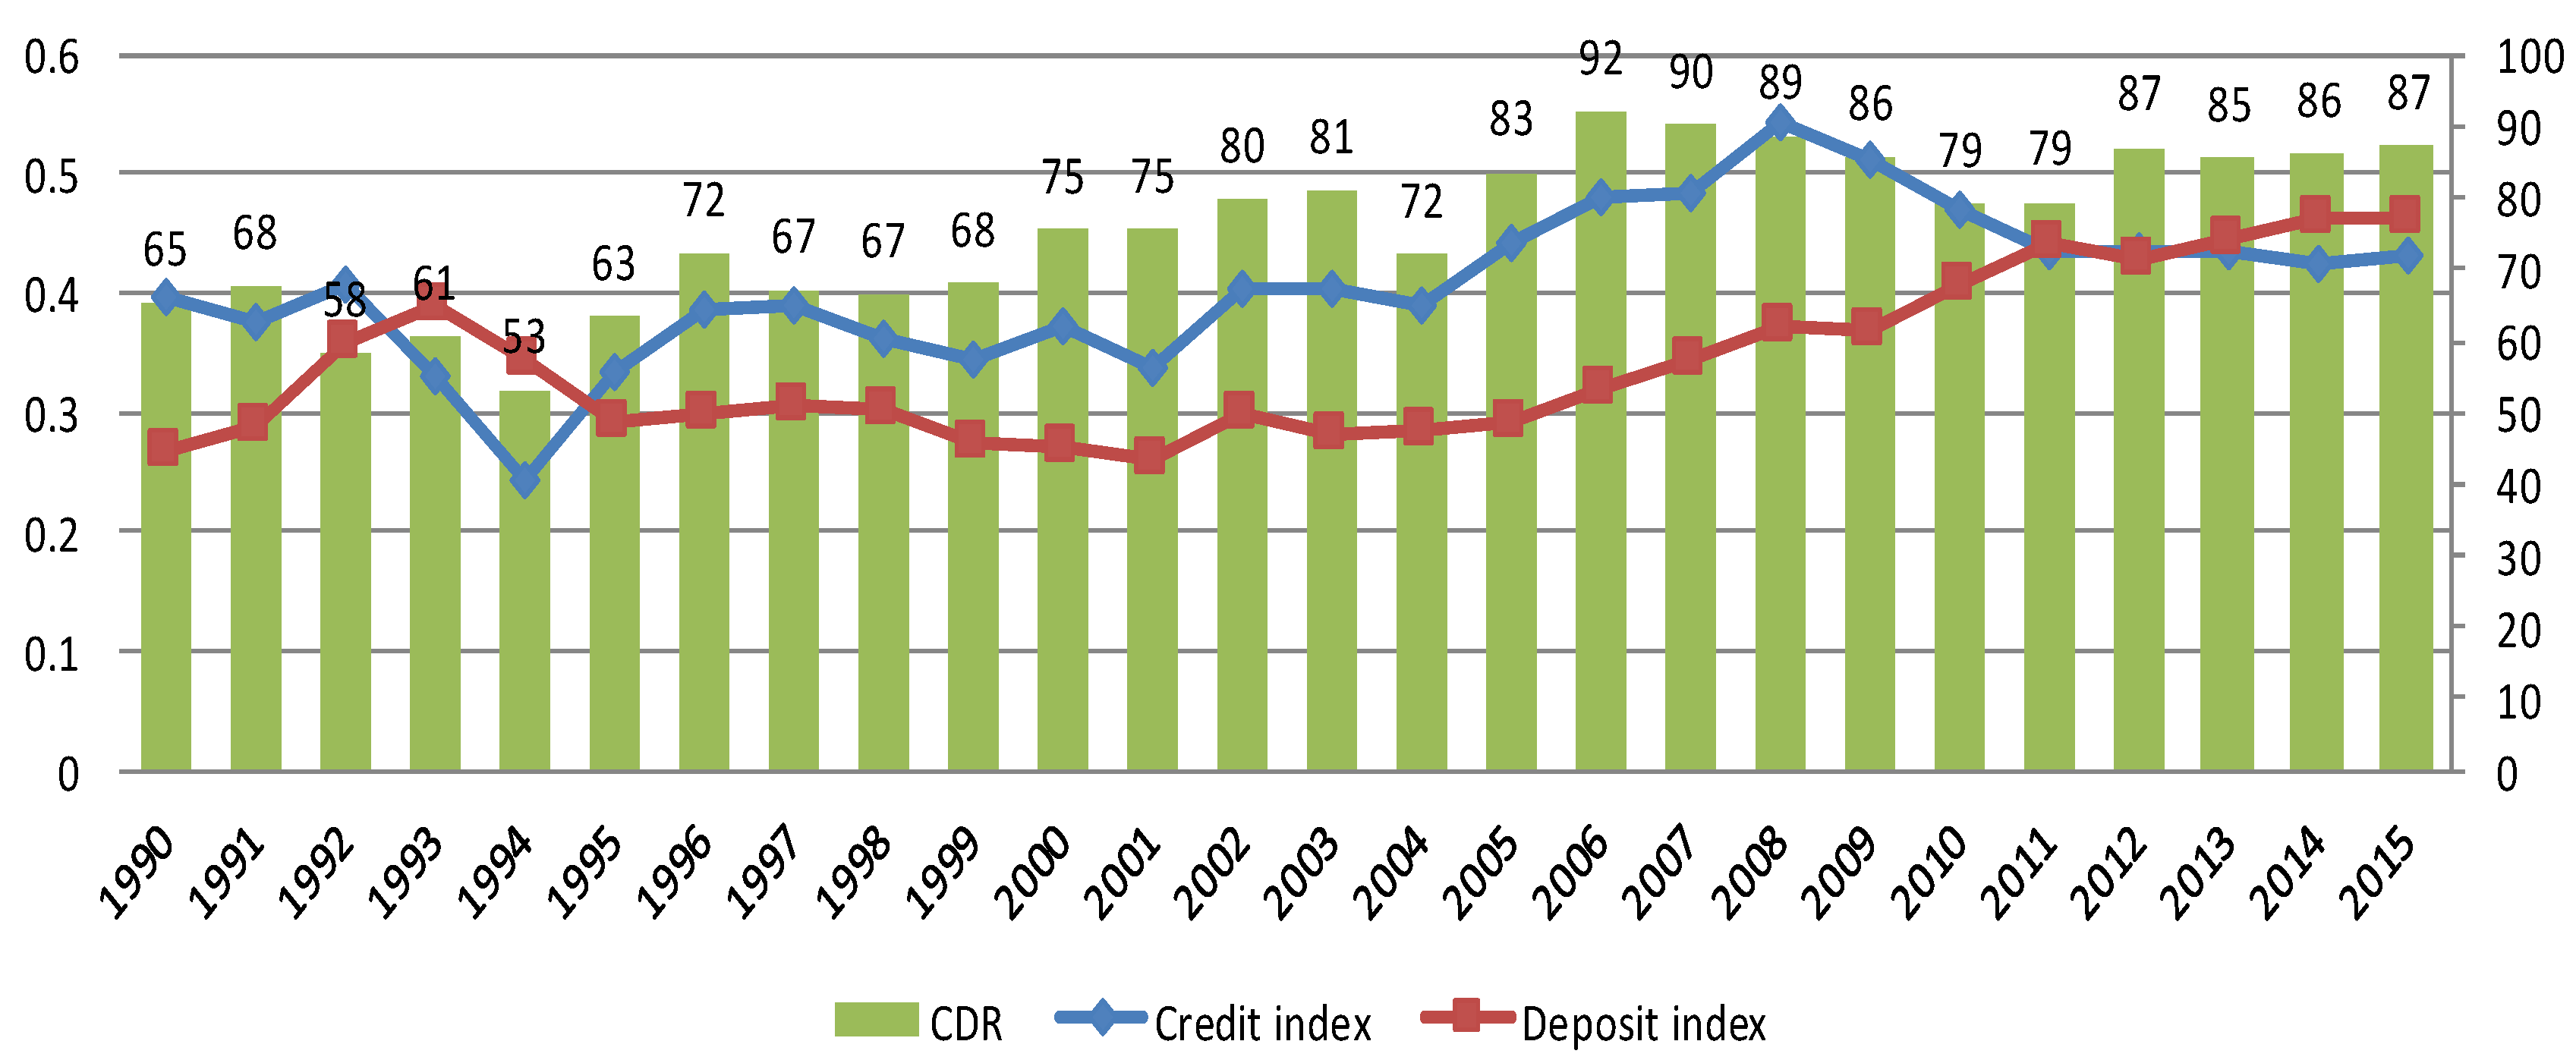
Figure 5 was plotted for the Western region, indicating that the indices of credit and deposit lie in the medium range (0 to 0.5) over the period, excluding the year 2008, in which the credit index crossed into the medium range. The Credit to Deposit Ratio (CDR) was recorded in the range 65% to 72% during the period 1990 to 1996; thereafter, the CDR showed another upward trend ranging from 72% to 92% during the period from 1997 to 2006. From 2007 to 2011, a downward trend was noticed, and it revived again from the year 2012 onwards.
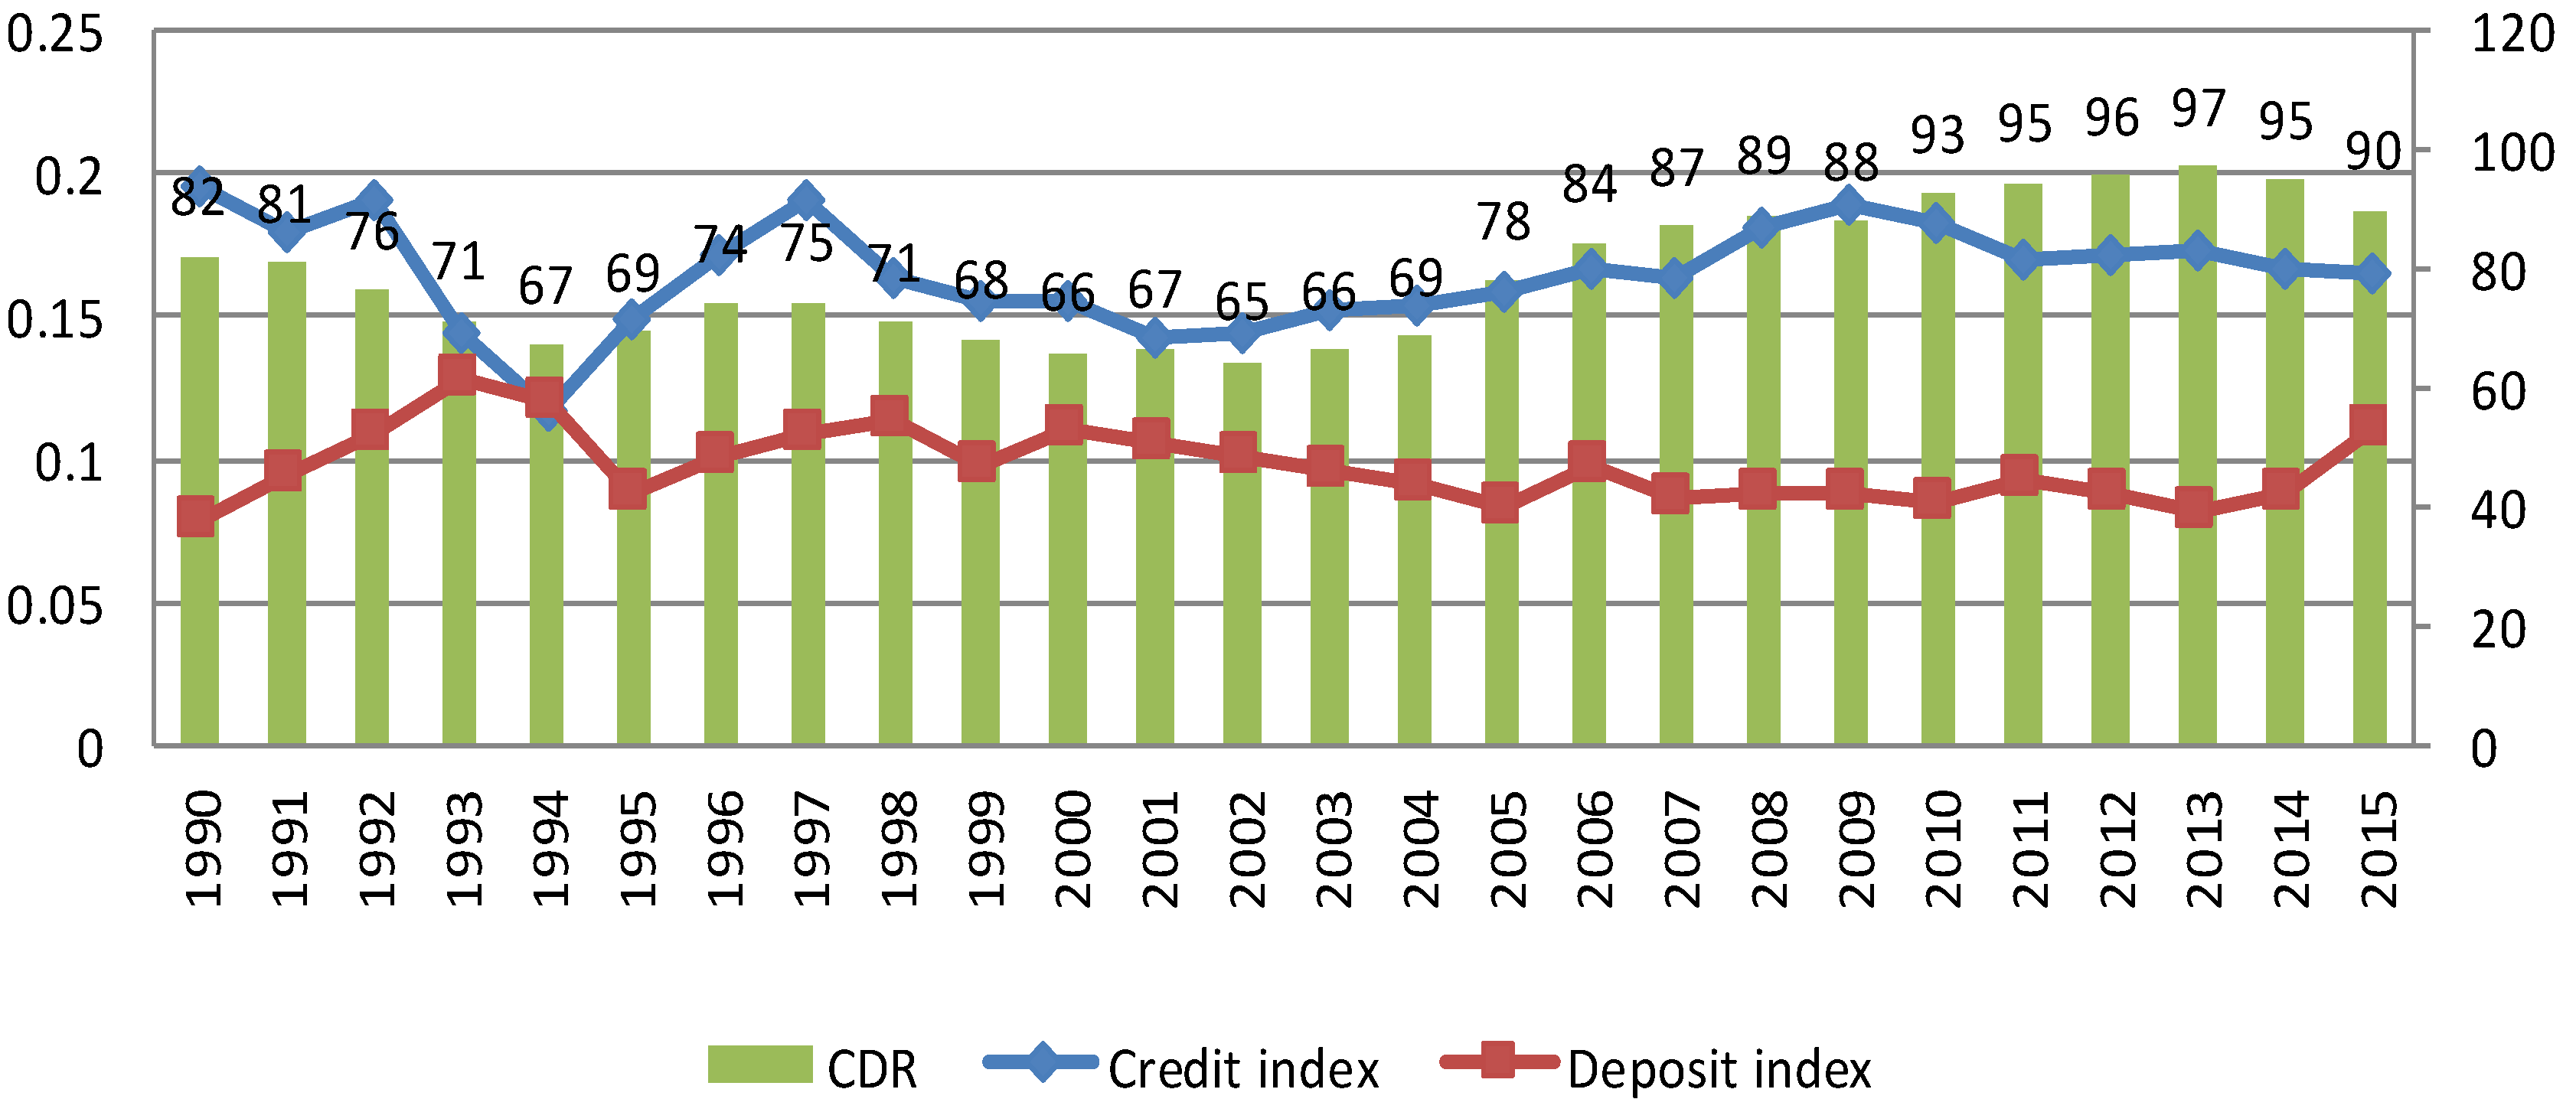
Figure 6 was drawn for the Southern region, indicating that the indices of credit and deposit lie in the lower range (0 to 0.25) over the period, while the CDR showed a decreasing trend from 1990 to 1994 and was recorded in the range 82% to 67%; thereafter, the CDR showed an upward trend and was recorded at 97% in the year 2013.
For the understanding of the state-wise flow of credit disbursement, a state-wise credit index was calculated, and a summary of the same is presented in
Table 2. The data are presented in
Appendix A.
Table 2 indicates that all the states of the Northern region showed a credit index in the low range. The union territories, including Chandigarh and Delhi, showed a credit index in the high range. All the states of the North-eastern, Eastern and Central regions showed a credit index in the low range. The state of Maharashtra, belonging to the Western region, showed a credit index in the high range, whereas all other states of the Western region and Southern region showed a credit index in the low range.
For the understanding of state-wise flow of the deposit mobilization, a state-wise deposit index was calculated, and the summary of the same is presented in
Table 3. The data are presented in
Appendix A.
Table 3 indicates that all the states in the Northern region showed a credit index in the high range over the period from 1991 to 1995. Thereafter, the UT of Chandigarh shifted from the high range to the medium range for the deposit index over the period from 2000 to 2015. All the states of the North-eastern, Eastern and Central regions showed a deposit index in the low range. The state of Maharashtra, belonging to the Western region, showed a shift from the medium range to the high range over the period, whereas all other states of the Western region and the Southern region showed a deposit index in the low range.
3.4. Econometric Models, Results and Discussion
To estimate the effect of banking expansion on the income growth, a set of regression equations—Equations (5)–(14)—were estimated by using the panel data regression analysis approach. In the regression equations, subscript
indicates the states and
indicates the time period. The notation used for the parameters are described in
Table 1. Before proceeding to estimate the regression equation, the correlation metrics were calculated, and they are presented in
Table 4.
Table 4 indicates that the PCNSDP has a positive and significant correlation with Creditnob, Depositsnob, Deposits, Credit, NSDP, SSexp, Now and Capexp. Creditnob showed a positive and significant correlation with Depositsnob, Deposits, Credit, NSDP, SSexp, Now and Capexp. In view of the positive and significant correlation, with respect to credit and deposits, PCNSDP and NSDP, the regression equation was formed taking into account those causal relationships.
3.5. Econometric Model and Results
This section presents the results of the estimation of the effect of banking expansion on income growth. The estimated fixed effect model and random effect model were obtained by using Equations (5) and (6), respectively. The results of the regressions are presented in
Table 5. The Hausman test statistics suggest that the random effect model is an appropriate model. Furthermore, the results of estimation reveal that deposit mobility across bank branches has a significant positive impact on Creditnob. Furthermore,
Table 5 reveals that a one crore increase in deposit mobility causes a 0.81 crore increase in credit disbursement. The results of this study are in the line with the past study by Anwar [
3].
This study incorporates variables including credit/bank branch, deposit/bank branch, pcnsdp and Nsdp as the main variables in the econometric models. The interlinkage in these variables has been clearly identified in past studies, for example, Anwar ([
3,
19]), and hence they have been used accordingly in the econometric models, while maintaining the exogeneity among them. With the stated perspective, the 2SLS estimation was not used again to detect the endogeneity. With reference to the control variables for regional characteristics, the study was conducted based on the panel data with the states as the cross-section units, which fulfill the requirements of regional control. With regard to financial control, the variables of social sector expenditure and capital expenditure were used in the econometric equation.
Moreover, for understanding the effect of credit disbursement on the NSDP, before going ahead with the estimation, the Multicollinearity among the variables was tested by using the VIF test, and the results are presented in
Table 6.
Table 6 indicates that the variables are free from the problem of collinearity, as the VIF value is less than 10.
The estimated fixed effect and random effect models were obtained by using Equations (7) and (8), respectively. The results of the regressions are presented in
Table 7. The Hausman test statistics suggest that the fixed effect model is an appropriate model. Furthermore, the results of the estimation reveal that that Creditnob, Now and SSExp have a significant and positive effect on the NSDP. Furthermore,
Table 7 reveals that a one crore increase in Creditnob causes a 0.00171% increase in NSDP, while a 1% increase in Now causes a 0.01197% increase, which is in agreement with Saygili et al. [
8]. Moreover, a 1% increase in SSExp causes a 0.61558% increase in NSDP. The results of this study are in line with past studies, e.g., Anwar [
2] and Anwar [
19].
The estimated fixed effect and random effect models were obtained by using Equations (9) and (10), respectively. The results of the regressions are presented in
Table 8. The Hausman test statistics suggest that the fixed effect model is an appropriate model. Moreover, the results of the estimation reveal that that Credit, Now and SSExp have a significant and positive effect on the NSDP. In particular,
Table 8 reveals that a 1% increase in Credit causes a 0.45584% increase in NSDP, while a 1% increase in Now causes a 0.01025% increase, and a 1% increase in SSExp causes a 0.10460% increase in NSDP.
The estimated fixed effect and random effect models were obtained by using Equations (11) and (12), respectively. The results of the regressions are presented in
Table 9. The Hausman test statistics suggest that the fixed effect model is an appropriate model. Furthermore, the results of the estimation reveal that that Deposit, Now and SSExp have a significant and positive effect on the NSDP. Furthermore,
Table 9 reveals that a 1% increase in Deposits causes a 0.56559% increase in NSDP, while a 1% increase in Now causes a 0.00786% increase in NSDP.
The estimated fixed effect and random effect models were obtained by using Equations (13) and (14), respectively. The results of the regressions are presented in
Table 10. The Hausman test statistics suggest that the fixed effect model is an appropriate model. Furthermore, the results of the estimation reveal that that NSDP and CapExp have a significant and positive effect on the PCNSDP. Furthermore,
Table 10 reveals that a 1% increase in NSDP causes a 0.53287% increase in PCNSDP, while a 1% increase in CapExp causes a 0.12529% increase in PCNSDP. The pass-through positive effect of banking expansion on income growth is in agreement with the past study of Chibba [
7].
4. Summary and Conclusions
This study examined the level of banking expansion across the six different regions of the country and across the 23 states/Union Territories. The banking expansion was measured in terms of credit disbursement and deposit mobility across bank branches. The credit disbursement index and deposit mobilization index were calculated. Based on these indices, the regions and states/UTs were categorized. The Northern region, North-eastern region, Eastern region, Central region and Southern region were indicated to have credit disbursement and deposit mobility in the low range of these indices. Meanwhile, the Western region exhibited credit disbursement and deposit mobility in the medium range of the indices.
The CDR for the Northern region was recorded as being less than 60% until the year 2004; thereafter, the CDR crossed the 60% threshold, and the maximum CDR for the region was recorded at 91% in the year 2014. An upward trend of CDR for the region was observed. For the North-eastern region, a low level of CDR was recorded, ranging from 57% to 34%. Additionally, a downward trend of CDR for the region was noticed. For the Eastern region, a cyclically declining trend of CDR was detected, from 54% to 47%. Similarly, for the Central region, a cyclically increasing trend of CDR was observed, from 47% to 48%. For the Western region, a cyclically increasing trend of CDR was observed, ranging from 55% to 87%. Moreover, for the Southern region, a cyclically increasing trend of CDR was observed, ranging from 88% to 90%.
The state-wise analysis indicates that the Union Territories of Chandigarh and Delhi, belonging to the Northern region, showed a credit index and deposit index in the high range. The state of Maharashtra, belonging to the Western region, showed a credit index in the high range. All the other states, belonging to the entire region, showed a credit index and deposit index in the low range.
The regression analysis revealed that that deposit mobility across bank branches has a significant positive impact on credit disbursement. Indeed, it revealed that that Creditnob, credit, Deposit, Now and SSExp have significant and positive effects on the NSDP. The results of the estimation revealed that that NSDP and CapExp have significant and positive effects on the PCNSDP.
Policy Implications
This study highlights the fact that banking expansion in terms of credit index and deposit index still lie in the low range across all regions, excluding the Western region. The state-wise analyses of banking expansion indicate that most of the states/UTs lie in the low range of the indices, excluding the states of Maharashtra and the UTs of Delhi and Chandigarh. It could be suggested that despite the number of efforts being taken to enhance banking services across the nation, banking expansion is still feeble and needs to be strengthened on a priority basis. In addition, banking services showed a positive impact on the national income, ultimately impacting positively on the income of individuals. For example, Panagiotidis and Printzis [
23] examined the housing market in Greece, taking into consideration various macroeconomic indicators. The empirical results indicate that an equilibrium relationship occurs, and in the long-run, the retail sector and mortgage loans appear as the most important factors for the housing market in Greece. Thus, from a policy perspective, it is important to target the growth of banking expansion on a priority basis, which would ultimately enhance income growth. In order to minimize branch opening expenditure, private companies support the Indian banking industry through the development of mobile phone banking applications. Most commercial banks, nowadays, are actively translating their banking services from a branch-based infrastructure to mobile-based innovations. In order to further the delivery of banking services across the remote and rural parts of the country, private companies may be allowed to support banking services through the development of innovative technology and banking products.
This study could be carried forward to further examine the impact of banking technology innovation on the financial inclusion and the challenges faced by the implementation of banking based on recent development in banking technology.


