Article

Application of Multi-Species Differential Evolution Algorithm in Sustainable Microgrid Model

1
State Key Laboratory of Reliability and Intelligence of Electrical Equipment, Key Laboratory of Electromagnetic Field and Electrical Apparatus Reliability of Hebei Province, School of Electrical Engineering, Hebei University of Technology, Tianjin 300130, China
2
Institute of Innovation and Circular Economy, Asia University, Taichung 41354, Taiwan
*
Author to whom correspondence should be addressed.
Sustainability 2018, 10(8), 2694; https://doi.org/10.3390/su10082694
Submission received: 4 July 2018 / Revised: 20 July 2018 / Accepted: 26 July 2018 / Published: 1 August 2018

Abstract

:
The safety and stability of microgrid (MG) operations are closely related to the capacity of distributed energy resources. A conventional MG model usually adopts investment cost as an objective function. Recently, the issue of environmental protection has been gradually emphasized. Therefore, the objective function of the proposed sustainable microgrid (SMG) model in this study considers the investment cost and environmental protective cost and the decision variable is the capacity of the distributed power. Moreover, weather and electric power load data from the National Centers for Environmental Information database (2010) were analyzed in Matlab program for the case study of Alabaster city, United States of America (USA). For the sake of a stable and economical SMG operation, this study also attempts to use a multi-objective capacity optimal model for effectively solving SMG under a multi-population differential evolution (MPDE) algorithm with dominant population (DP), which can improve the convergence speed in an SMG model. At the same time, considering that different scheduling strategies will also affect the optimization results, two strategies are proposed for the priority order of distributed generation sources. The optimization results under the two scheduling strategies show that the validation of the MPDE algorithm in SMG capacity optimization problems can economize investment costs and enable an environmentally friendly power supply.

1. Introduction

Energy is among the crucial basic materials for developing a national economy and improving people’s living standards. Due to both population increases and modern economic development, overall energy demand has increased and caused a depletion of traditional fossil fuel reserves, which can lead to energy shortages. In addition, pollution from the utilization of traditional fossil fuels is also becoming more serious, leading to acid rain, the greenhouse effect, increased concentrations of Particulate Matter (PM2.5), and haze. Therefore, the development and utilization of renewable energy is imperative. In 2002, CERTS (Consortium for Electric Reliability Technology Solutions) proposed the microgrid (MG) concept, which has been closely examined by governments and laboratories because of its flexible control and high power supply reliability [1,2,3]. MGs cover a variety of Distributed Generation (DG) systems, both uncontrollable power sources (such as wind turbines (WT) and photovoltaics (PVs)) and controllable power supply sources such as diesel generators. MGs are regarded as platforms for clean energy to access the power grid and can also lead to the flexible and economically improved operation of a power system. MGs can make a large power grid become more economical and stable [4,5]. Therefore, it is of great significance to optimize the capacity of DG for the sake of safe and stable MG operation [6]. The common methods to optimize the capacity of MG systems are as follows: using HOMER software Pro Version 3.9.1 (HOMER Energy, Boulder, CO, USA) [7], using a mixed integer linear programming (MILP) model [8], or using optimization algorithms, such as particle swarm optimization (PSO), a genetic algorithm (GA), a differential evolution (DE) algorithm, etc. Using HOMER software to solve the problem is simple and convenient but the regional adaptive ability is poor, so it cannot be widely promoted. As a classical programming model, the MILP model is theoretically suitable for solving arbitrary integer programming problems, however, its design is cumbersome and computationally expensive, and it will consume too many computing resources. The various optimization algorithms proposed in recent years have shown good performance in solving complex problems but the defects of the algorithms are inevitable. So it is necessary to improve the algorithms according to different application scenarios. For the operation scenarios of an MG system in different seasons, an improved DE algorithm is proposed in this paper and analyzed according to how different scheduling strategies use it, in order to grasp the internal rules of each device running state in various scenarios.
The optimization of microgrid DG capacity allocation is a typical optimization problem [9,10,11]. According to the parameters and structure of the model, most of the investigations in the literature have used optimization algorithms, which can be roughly divided into genetic algorithms (GA) and particle swarm optimization (PSO) algorithms. The authors in [12] proposed an improved PSO algorithm: weights and learning factors change with respect to iteration numbers in order to solve the capacity distribution problem of an MG containing wind turbines, PV, diesel generators, diesel generators, and electric vehicles (EV). The EV in the MG of [12] was used as a portable energy storage device. However, the EV, as an uncontrollable energy storage device, is greatly affected by user behavior and cannot stably supply power like batteries. Reference [13] established a dynamic multi-objective optimization model to reduce MG costs and pollution emissions and used the PSO algorithm combined with quorum sensing (QS). The influence of climatic conditions on the optimization results was not considered and the calculation of real-time dynamic scheduling was too large. Reference [3] discussed a real-time energy management system, optimizing MG real-time performance and applied the binary PSO algorithm for optimization. The authors in [14] used the PSO algorithm to solve the optimal power dispatch problem considering load uncertainties and the probabilistic modeling of generated power. However, the objective function does not take into account environmental costs. Reference [15] raised a dynamic economy and control method for an islanded microgrid in which a diesel generator and energy storage battery acted as the main power source with respect to the system power fluctuation and a GA was used to solve the problem. The original GA encoding and decoding process takes a lot of time and is not suitable for solving dynamic economic dispatch problems. Reference [16] combined the GA and bacterial foraging algorithm (BFA) to solve the problem of dynamic economic allocation. The GA was applied in the behavioral tendency stage of the BFA to modify the parameters. The objective was to minimize the overall production cost and verify the effectiveness of the algorithm in different test systems. But this literature does not consider renewable sources and does not fit the current development of energy. However, these methods are not limited to only the PSO algorithm and GA. For example, in order to address the uncertainty of renewable energy and MG demand, a model predictive control (MPC) strategy was proposed in [17]. However, the existing algorithms are mainly applicable to slow dynamic process and environments, which limits their promotion in a wider range of applications and applications. Hourly planning ahead was formulated according to not only weather forecasting information but also to grid network topology and power flow constraints. As an evolutionary algorithm, the DE algorithm has advantages of less adaptive parameters, easier programming, and a faster convergence rate [18]. The variation and cross-operation of the standard DE algorithm are all stochastic and easily fall to the local optimal point when the dimension of variable decisions is high. Here, there still exists the potential to improve the DE algorithm in aspects of convergence speed and local optimum avoidance. To overcome these shortcomings, some researchers carried out improvement strategies for the DE algorithm. For example, the authors in [19] proposed a new crossover strategy based on eigenvector decomposition. They decomposed the correlation coefficient matrix of individuals to obtain the eigenvectors and eigenvalue matrix. The individuals who go through the crossover operation are multiplied by eigenvectors according to the method of probability selection. In [20], the efficiency of the DE algorithm was improved by monitoring the midpoint of population. In this paper, the improvement of the DE algorithm proceeds mainly from the following aspects: parameter control strategy, new crossover strategy, elite retention strategy [21], and multi-population strategy. Simulation results showed that the improved DE algorithm not only improved the convergence speed but also greatly improved the precision, minimizing the impact of stochastic factors.
In most of the existing literature, despite so much research having dealt with solutions, there is little research on scheduling strategies, so this paper studies the impact of different scheduling strategies on the capacity optimal allocation of grid-connected MG. There are both energy storage and grid in an existing grid-connected MG. So when the energy generation sources are not enough to meet the demand of power load, giving priority to the grid or energy storage is a problem to be studied. In this paper, the scheduling strategies of wind-PV-energy storage-grid-diesel and wind-PV-grid-energy storage-diesel are proposed in view of the priority of the grid and energy storage and the optimization results of the two strategies under four typical days in four seasons are analyzed. At the same time, a SMG model which considers the total investment cost and environment protective cost as the objective function is established and the constraints of each DG operation in SMG are fully considered to guarantee the proper, safe, and economical operation of SMG. The MPDE with dominant population (DP) was adopted to improve the convergence speed of the algorithm.
The main objectives of the work can be outlined as follows:
  • Optimal design and planning of a renewable energy based MG considering various renewable energy technology options and with realistic inputs on their physical, operational, and economic characteristics.
  • An MPDE algorithm based on multi-species and multi-optimization strategies is proposed and applied to the SMG model.
  • Two MG scheduling strategies are proposed and the capacity optimization results of the four typical days in four seasons under two strategies are analyzed.
The rest of the article is arranged as follows: Section 2 models and analyzes DG in the SMG and Section 3 analyzes the economics of the SMG operation. Section 4 introduces the proposed algorithm and compares it with some other algorithms. Section 5 presents an example verification to solve the DG capacity allocation and Section 6 offers a conclusions.

2. Distributed Power Output Model

The SMG model established in this study was a grid-connected SMG made of wind turbines, PV, diesel generators, storage batteries, and loads.

2.1. Wind Turbine Model

The wind turbine output power is affected by the wind speed, its own power rating and other factors. The specific relationship is shown as follows [22]:
P w = { 0 , 0 v ( t ) v i n P W N v ( t ) v i n v N v i n , v i n v ( t ) v N P W N , v N v ( t ) v o u t 0 , v o u t v ( t )  
where t represents the time and vin, vN, and vout represent cut-in wind speed, rated wind speed, and cut-out speed, respectiely. P W N indicates the rated power of the wind turbine.

2.2. PV Model

The output power of the PV is affected by factors such as temperature and light radiation degree [23,24,25], and its equation can be briefly written as [22]:
P p v = P p v N G ( t ) G S T C [ 1 + k ( T ( t ) T S T C ) ]  
where P p v N is the rated output power at standard test conditions (STC) (GSTC = 1000 W/m2, TSTC = 25 °C), G(t) is the actual degree of optical radiation, T(t) is the ambient temperature, and k is the temperature coefficient of the power, taken as −0.0047.

2.3. Diesel Generation Model

Diesel generator consumption is a function of output power and the specific relationship can be written as follows [22]:
F f u e l = a P d i e N + b P d i e  
where Ffule is the diesel consumption when the diesel generator output power is Pdie. a is taken as 0.0815 and b is taken as 0.2461.

2.4. Energy Storage Battery

The battery used in this paper was a lead-acid battery; the relation between the capacity and temperature is as follows:
E c ( t ) = E S T C [ 1 + δ B ( T b a t ( t ) T S T C ) ]  
where Ec(t) represents the actual capacity at moment t, ESTC is the capacity under standard capacity, δ B is the temperature coefficient and Tbat(t) is the surface temperature at moment t, which is approximately equal to the abovementioned ambient temperature T(t).
The battery capacity under the charge and discharge statuses is as follows:
(1) 
State of charge
E b a t ( t ) = ( 1 ε ) E b a t ( t 1 ) + P c ( t ) Δ t η c  
(2) 
Discharge status
E b a t ( t ) = ( 1 ε ) E b a t ( t 1 ) P d ( t ) Δ t η d  
where Ebat(t) is the remaining capacity at moment t, Ebat(t − 1) is the remaining capacity at moment t − 1, ε is the self-discharge rate, and Pc and Pd are the charge and discharge power.

3. Economic Model

The objective function of this study is about the overall investment cost, including not only the value of investment but also environmental punishment costs.

3.1. Equivalent Annual Equipment Investment Costs

The objective function considering the cost of equipment investment, operation and maintenance costs, replacement costs and operating costs can be expressed as follows:
f 1 = C D G + C O M + C R + C F  
where CDG is the investment cost, COM is the operation and maintenance costs, CR is the replacement cost, and CF is the fuel costs.
{ C D G = c ( r , l ) i N D G ( c i x i P i ) 365 l C O M = c ( r , l ) i N D G ( c i O M x i P i ) 365 l C R = c ( r , l ) i N D G ( c i R x i P i ) 365 l C F = t T U f F f u e l ( t )  
where c(r, l) is the MG depreciation coefficient, r is the power discount rate, l is the equipment lifetime, NDG is the DG type, ci is the ith DG investment costs, c i O M is the operation and maintenance costs of the ith DG, c i R is the replacement costs of the ith DG, decision variable xi is the number of ith DG, Pi is the rated power of ith DG, Uf is the diesel price, and Ffuel(t) is the fuel consumption of diesel generator at the moment t.

3.2. Environmental Penalties

Wind generators and PV are clean energies and have neither pollution emissions nor gas wastage. Diesel generators will produce CO2, SO2, and NO during operation and these environmental costs will be included [22].
f 2 = i N D G j K ( u j v j ) x i P i  
where K is the set of exhaust gas species, K = {CO2, NO, SO2}, uj is the fines of the jth exhaust gas and vj is the emissions of the jth exhaust gas.

3.3. Restrictions

{ P w ( t ) + P p v ( t ) + P d ( t ) + P d i e ( t ) + P b u y ( t ) = P l o a d ( t ) + P s e l l ( t ) + P c ( t ) E min E b a t ( t ) E max P d i e ( t ) N d i e P d i e N P c ( t ) P c , max P d ( t ) P d , max P b u y ( t ) P b u y , max P s e l l ( t ) P s e l l , max  
where Pload(t) is the load demand for moment t, Psell(t) is the sale of electricity to the grid, Pw(t), Ppv(t), Pdie(t), Pc(t) and Pd(t) represent the actual output of different DG, and Pbuy(t) is the purchase of electricity [12,26]. The objective function of this study is about the overall investment cost, including not only the value of investment but also environmental punishment costs.

4. Solution Method

4.1. Scheduling Strategy

The output power of WT and PV is random and non-dispatchable. The storage battery has two statuses and plays the role of an energy buffer in the whole system. At the same time, diesel generators act as an energy supplement in the MG when the batteries cannot satisfy the power shortage.
Δ P ( t ) = P w ( t ) + P p v ( t ) P l o a d ( t )  
where Δ P ( t ) is the system power imbalance when the energy storage battery and diesel generator are not put into operation.
(1) Strategy I (Wind-PV-Energy Storage-Grid-Diesel)
Under this scheduling strategy, the MG gives priority to the power generated by renewable energy. If the energy generation sources fail to meet the power load demand i.e., Δ P ( t ) < 0 , the power can be reasonably allocated according to the state of the energy storage system. If the output of renewable energy and the energy storage cannot meet the load demand, the MG interacts with the grid, and the diesel engines acts as the last guarantee to ensure the reliability of the power supply. On the other hand, if renewable energy output is greater than the power load demand i.e., Δ P ( t ) > 0 , part of the power will be consumed according the state of the energy storage systems, while the surplus will be sold to the grid.
(2) Strategy II (Wind-PV-Grid-Energy Storage-Diesel)
Under this scheduling strategy, the MG takes priority over the power generated by renewable energy. If the output of renewable energy cannot meet the demand of power load i.e., Δ P ( t ) < 0 , then purchasing electricity from the grid is under the power limit. If renewable energy output and the grid cannot meet the load demand, the energy storage supplies part of the power according to its own operating state and the diesel generators serves as a backup to ensure the reliability of the power supply. On the other hand, if renewable energy output is greater than the load demand i.e., Δ P ( t ) > 0 , it is preferential to interact with the grid and then consume the residual energy according to the state of the energy storage system.

4.2. Proposed Algorithm

(1) Initialization
Same as population-based intelligent optimization algorithms, the proposed algorithm also needs to initialize the population:
{ X i ( 0 ) | x i , j L x i , j ( 0 ) x i , j U ; i = 1 , 2 , N P ; j = 1 , 2 , D }  
where Xi(0) denotes the ith body of the initial population, and j indicates the dimension.
x i , j ( 0 ) = x i , j L + lhsdesign ( N P , D ) i , j ( x i , j U x i , j L )  
x i , j L and x i , j U are the lower and upper bounds of the jth dimension, respectively, NP is the population size, and lhsdesign (NP, D)i,j represents the jth element of the ith individual in the matrix of Latin hypercube sampling (LHS) [27]. As shown in Figure 1, it can be seen that the random numbers generated by the Rand method (Matlab codes) may not fit in a small interval, which may result in the inability to include optimal individuals in the initial population, leading to difficulty in searching for the subsequent crossover operation. However, each individual of the operator (OP) generated by LHS can be in a uniformly distributed interval to ensure that the OP contains an optimal point and enhances the algorithm convergence.
(2) Selection of dominant species
Because the traditional DE method is a single population algorithm, excellent individuals in each generation may mutate after experiencing mutation and crossover operation and this can make the algorithm fall into search stagnation, greatly reducing the convergence speed of the DE algorithm. In this paper, a multi-population strategy was applied to save these excellent individuals in each generation as a DP. Both DP and OP undergo mutation and crossover operations. The OP through mutation can increase the diversity of the population, while DP can improve the convergence rate and prevent the proposed algorithm from falling into search stagnation. The implementation of the strategy is as follows:
(1)
After completion of the population initialization process, the fitness value of each individual is calculated and sorted in ascending order;
(2)
Mitotic size CS individuals are selected to constitute the parent DP, dominant parent population Af, and the best individuals Gbest of the current iteration time are obtained;
(3)
From the concept of cell mitosis, each individual in Af executes the mitosis behavior in order to assemble DP; the number of mitotic division is CS.
(3) Mutation
The traditional DE algorithm achieves individual variation through differential strategies [26,27], and the common mutation methods are as follows:
V i ( g ) = X r 1 ( g ) + F × ( X r 2 ( g ) X r 3 ( g ) )  
V i ( g ) = X r 1 + F × ( X r 2 X r 3 ) + F × ( X r 4 X r 5 )  
V i ( g ) = G b e s t ( g ) + F × ( X r 1 X r 2 )  
V i ( g ) = G b e s t ( g ) + F × ( X r 1 X r 2 ) + F × ( X r 3 X r 4 )  
V i ( g ) = X i ( g ) + F × ( G b e s t ( g ) X i ( g ) ) + F × ( X r 1 X r 2 )  
where r1, r2, r3, r4, and r5 are random numbers in the interval [1,NP] and are not equal to each other, F represents the mutation operators (varies with the number of iterations), Gbest(g) is the optimal individual of the current iteration number, and g indicates the current iteration number.
λ = e 1 G max G max + 1 g  
F = F 0 × 2 λ  
where F0 is a constant factor, and Gm is the maximum evolution number.
As shown in Formulas (19) and (20), the adaptive mutation operator F has a larger value at the beginning of the algorithm and keeps the individual diversity. With the progress of the algorithm, F gradually decreases and the mutation rate is close to F0 at a later period. The mutation operator does not only preserve good information but also avoids destruction of the optimal individual.
The OP can increase population diversity. The DP can speed up the convergence rate. To maximize the advantages of OP and DP, the two populations adopt different mutation strategies.
To maximize the advantages of the OP and DP, their mutation strategies are given by Formulas (21) and (22).
V i ( g ) = X i ( g ) + F × ( G b e s t ( g ) X i ( g ) ) + F × ( X r 1 ( g ) X r 2 ( g ) )  
V i ( g ) = G b e s t + F × ( A t , r 1 ( g ) A t , r 2 ( g ) )  
(4) Crossover
The purpose of the crossover operation is to select individuals at random. Formula (23) is the mutation modus of the DE algorithm [18].
U i , j ( g ) = { V i , j ( g ) x i , j ( g ) r a n d C R o t h e r w i s e  
where CR stands for crossover probability. The crossover probability of the DE algorithm is a constant, usually set to 0.9. In the initial stage of DE, a larger probability can increase the population diversity but in the later stage, there are many dominant individuals in the population. If the crossover operation has a constant probability, the dominant individuals may be destroyed and the convergence speed will be slowed down. A greedy strategy for each individual is adopted in this paper because it can keep the individuals close to the optimal value and replace the individual far away from the optimal individual. Formula (24) is the expression.
U i , j ( g ) = { x i , j ( g ) V i , j ( g ) i f | x i , j ( g ) | < | V i , j ( g ) | o t h e r w i s e  
(5) Elite retention Strategy
Elite retention strategies [21] were used in this paper in order to save the best individuals in each generation. Its strategy is as follows.
(1)
Pick the worst individuals Xbad1 and Xbad2 in OP and DP after the mutation and crossover process;
(2)
Use the best individuals Gbest for the current iteration to replace Xbad1 and Xbad2.
(6) Picking
Greedy selection strategy is often used in a DE algorithm.
X i ( g + 1 ) = { U i ( g + 1 ) X i ( g ) f ( U i ( g ) ) f ( X i ( g ) ) o t h e r w i s e  
In this paper, both OP and DP were selected by the greedy algorithm during the selection process.
(7) Generation of new populations
The fitness of OP and DP are calculated separately and arranged in ascending order. Then, the first 2 CS individuals of each population are selected to form the next population. Mixing to create a new population does not only preserve the diversity of population but also speeds up convergence.
The procedures of proposed algorithm can be shown as follows:
Step 1
Initialization parameters: population size NP, mitotic size CS, maximum number of iterations Gmax, variation constant factor F0;
Step 2
Initialize OP with LHS, calculate the fitness values of each individual and arrange them in ascending order;
Step 3
Select the best individual Gbest in OP of current iteration times;
Step 4
Select the first CS individuals in ascending order of OP to create dominant parent population Af;
Step 5
Af carries out mitosis to make up DP At;
Step 6
The OP and DP execute mutation and crossover steps respectively to obtain the populations U1 and U2;
Step 7
Replace the worst individuals of the two populations with elite retention strategy;
Step 8
Implement the picking operation to obtain populations Xnext1 and Xnext2 for U1 and U2;
Step 9
Make sure that fitness function values are sorted in ascending order and choose the previous 2 CS individuals to form the next generation of individuals Xnext.

5. Case Study Analysis

Data from National Centers for Environmental Information database (2010) (both the weather and electric power load) were used for the Alabaster city, USA case study [28]. The relevant data of distributed generation are shown in Table 1, and the diesel generator emission coefficient and pollution control costs are shown in Table 2.
In this study, the maximum annual power failure probability of the system was set to 0.01%. The initial population size NP of the proposed algorithm was set as 32. The termination condition of the algorithm is that the total number of iterations reaches 300. The size of parent DP CS equals NP/4. The penalty function was used to change the multi-objective function to a single objective function i.e., f = f1 + f2. Table 3 and Table 4 show the configuration results of the MG system under the two strategies.
As can be seen from Table 3 and Table 4, the average installed capacity of the wind power system, PV system, diesel generators, and energy storage system under strategy I is 2745 kW, 2985 kW, 494.5 kW, and 1225 kW·h; Similarly, the average installed capacity of the wind power system, PV system, diesel generators, and energy storage system under strategy II is 3258 kW, 1775.5 kW, 329 kW, and 1573 kW·h. Under the two strategies, the loss of power supply probability (LPSP) in the four typical days is 0, which indicates that the proposed strategy can satisfy the power supply reliability requirement of the MG.
(1) Selection power limit of the grid
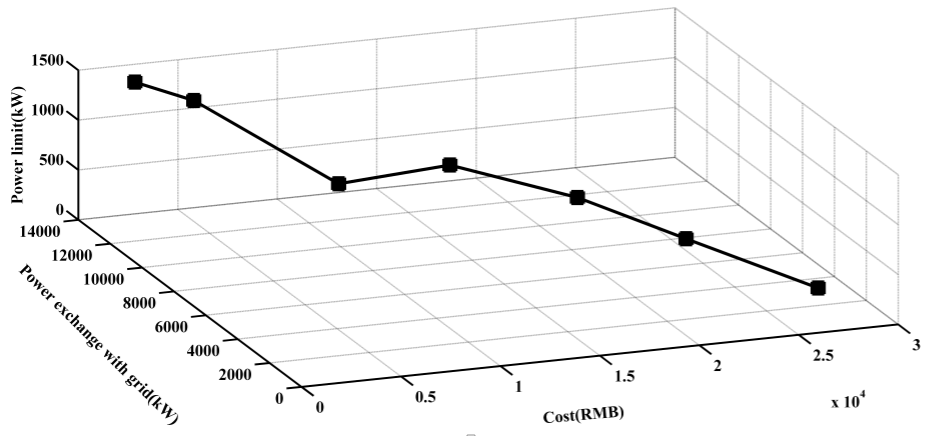
It can be seen from Figure 2 that changing the upper and lower limits of the power of the MG interacting with the grid will change the cost and the interaction power in one day. If the limit power is too low, the interaction power in one day may be too low, but the cost is too high. Conversely, if the limit power is too high, the interaction power is too high in one day, increasing the line loss. As can be seen from the diagram, when the limiting power is 1000 kW, the cost and the interactive power are at a better level, so the limiting power is determined to be 1000 kW.
(2) Spring results analysis
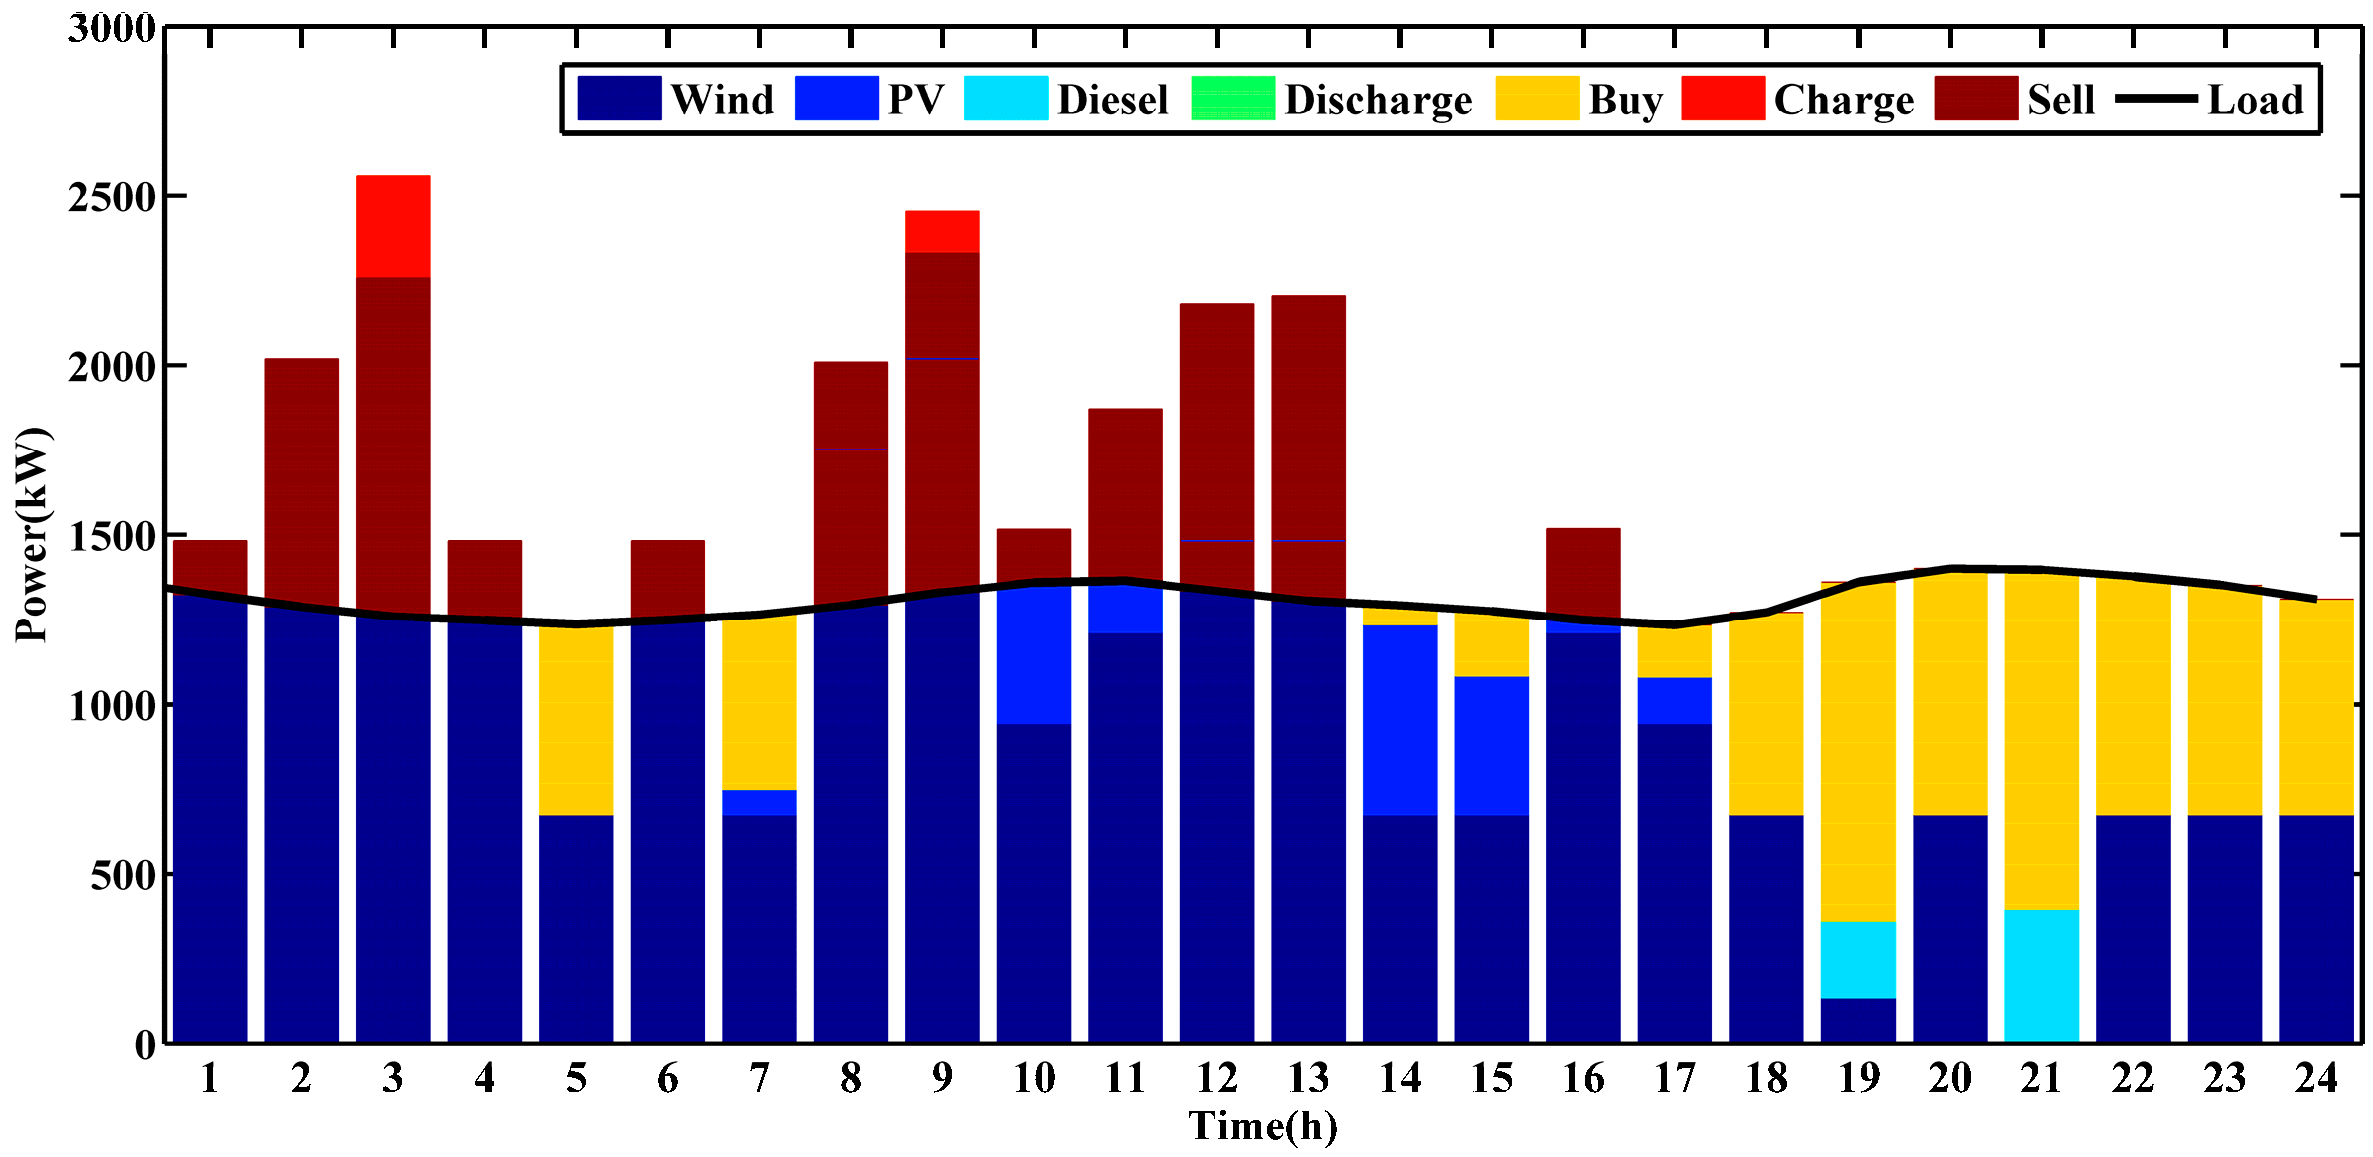
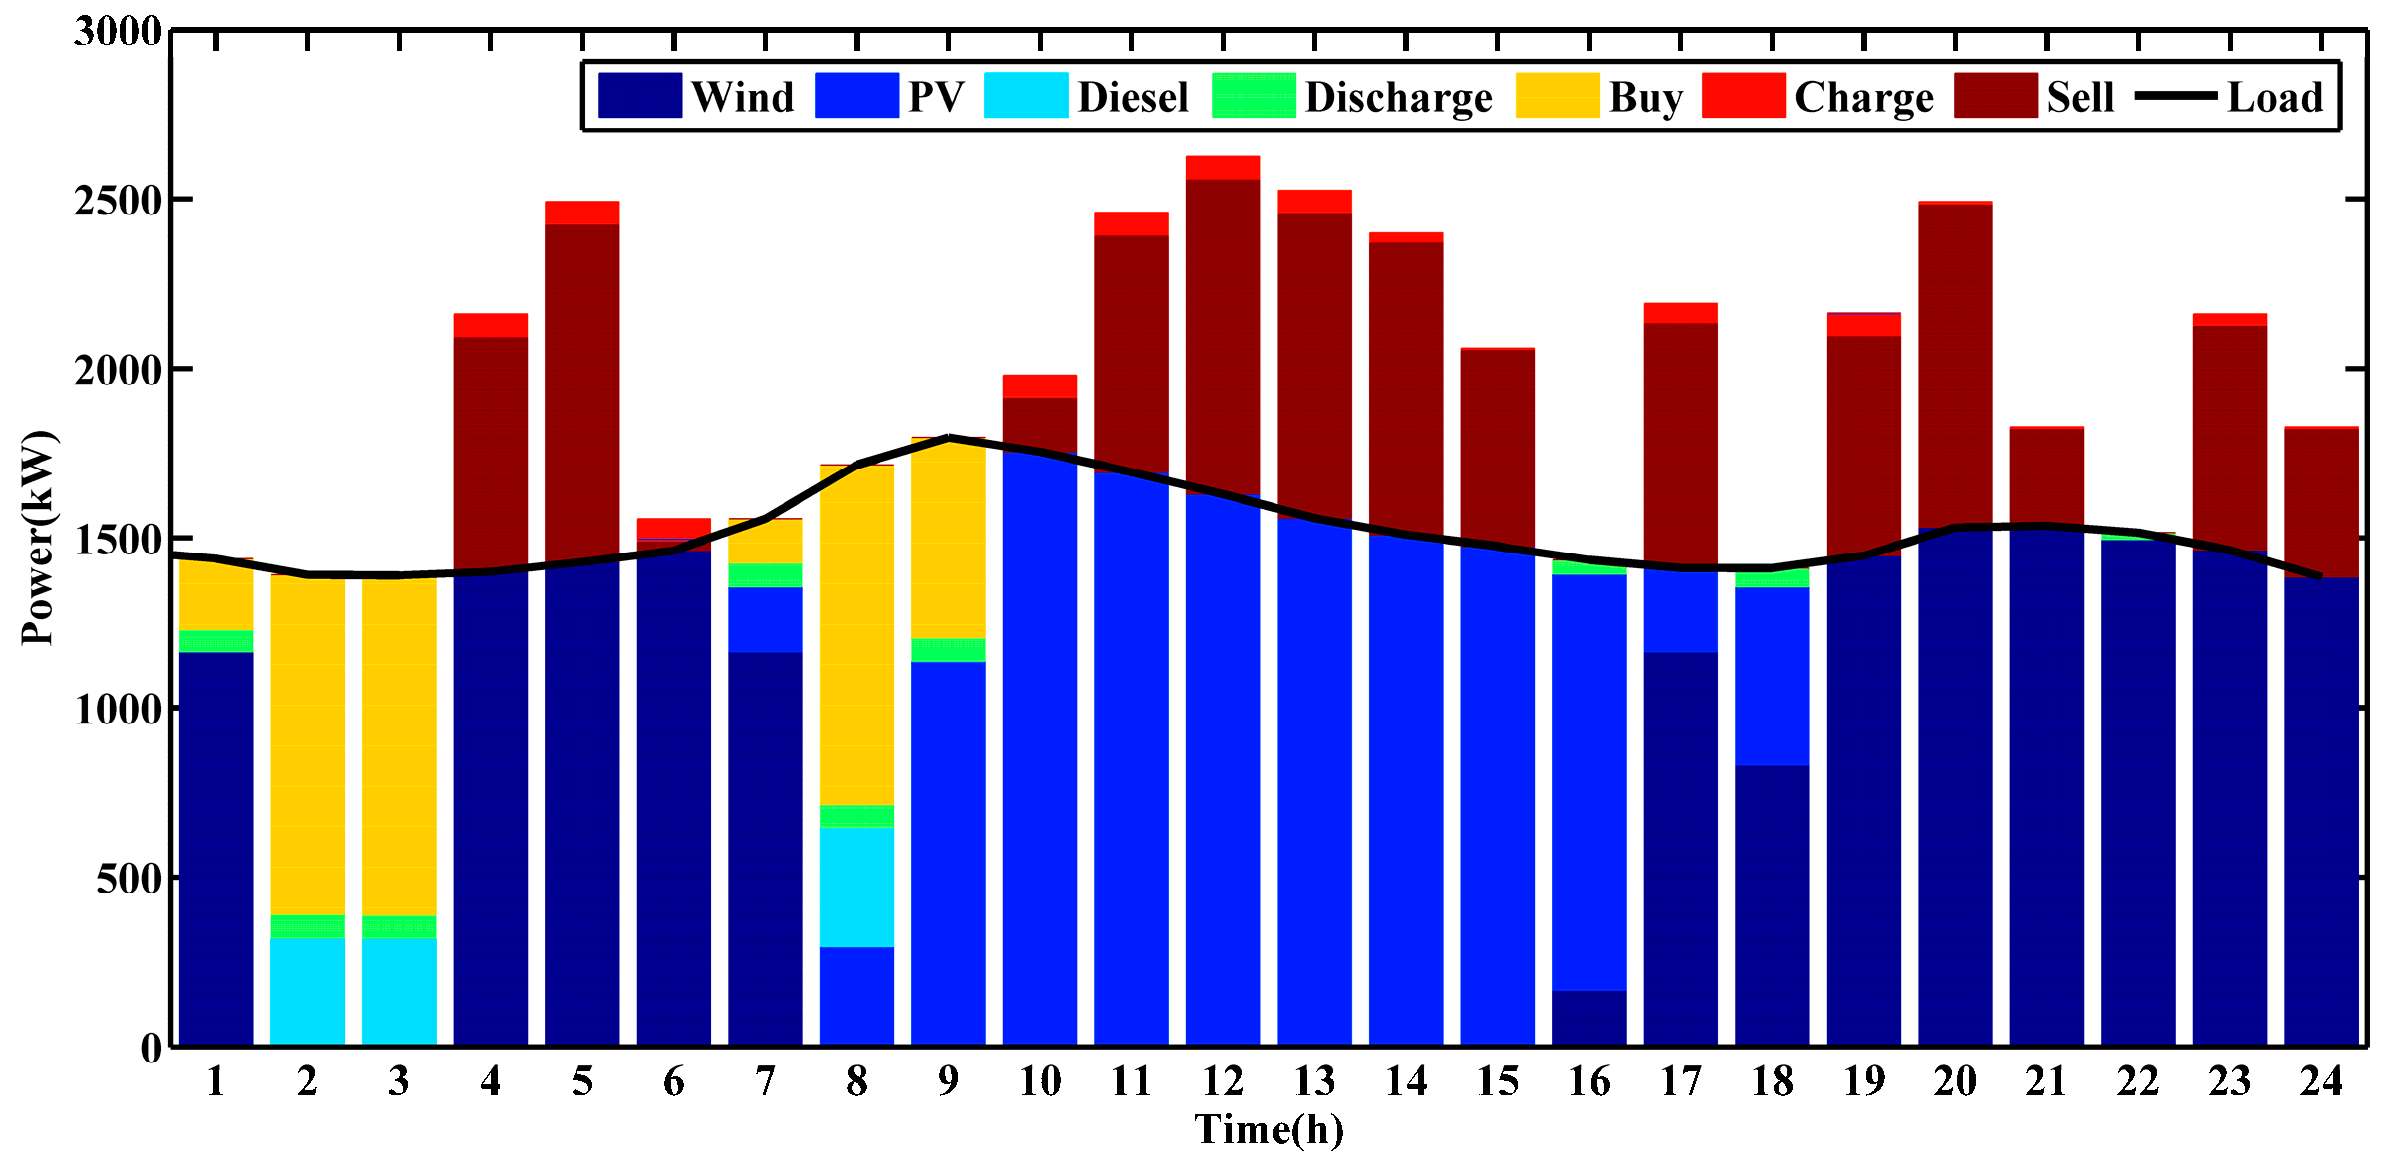
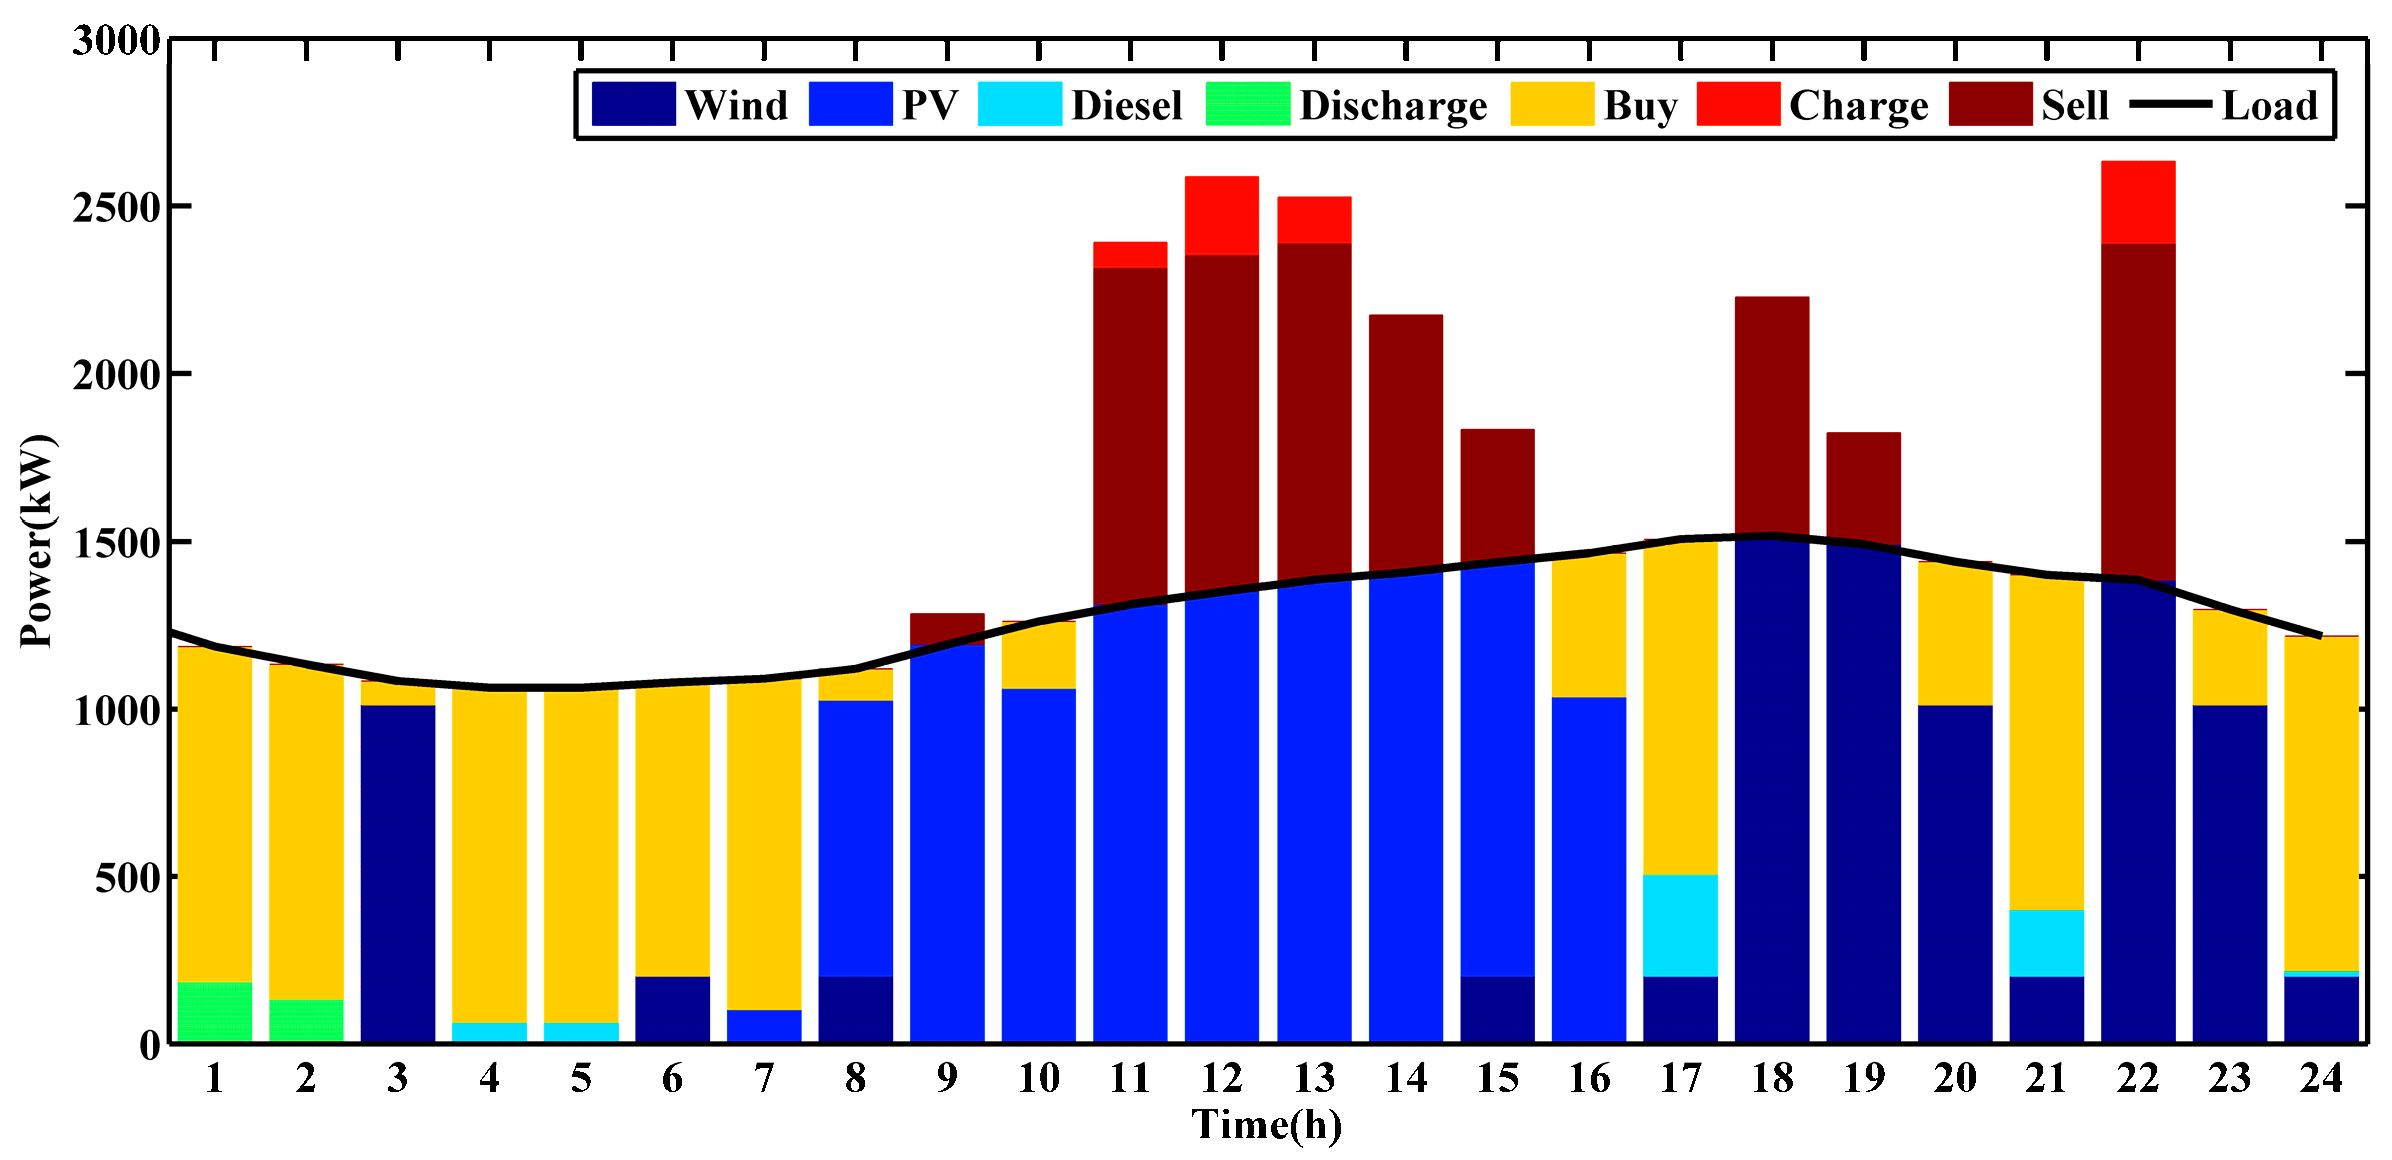
From Figure 3 and Figure 4, it can be seen that the power sales of strategy I and strategy II are basically the same in the spring, however, in the case of the power shortage, the energy storage system can fill in some blanks. Compared with the power purchase of strategy II, the cost of strategy I is slightly less than that of strategy II. During the period from 1:00–6:00, the output power of the wind power system cannot meet the load demand at some moments. At this time, the energy storage system under the operating condition of strategy I discharges, which reduces the power purchasing to the grid. Under the conditions of strategy II, the capacity of the wind power system is large, and part of the power can be sold to the grid. But the energy generated from the energy storage system is very small, so it cannot reduce the power purchasing to the grid.
(3) Summer results analysis
As can be seen from Figure 5 and Figure 6, in the period 1:00–6:00, the output power of the PV system is 0. The wind power generation system takes the main generation task. Under the conditions of strategy I, the residual power is given priority to the energy storage system, the other excess energy is sold to the grid, while the other excess energy in strategy II is sold first to the grid for profit, and the power that exceeds the grid limit is charged to the energy storage system. During the 7:00–18:00 period, the surplus energy of strategy I is supplied to the energy storage system within the acceptable range of the energy storage system, the rest is sold to the grid, while strategy II is almost all sold to the power grid to obtain benefit. Within the 19:00–24:00 period, the wind power system can basically meet the demand, the power stored in strategy I cannot produce benefits, while strategy II can sell to the power grid to generate economic benefits, which is why strategy II is cheaper than the strategy I in summer.
(4) Autumn results analysis
From Figure 7 and Figure 8, the performance of each device under the two strategies is similar during the period from 1:00–8:00. During 9:00–16:00, strategy I, while selling more electricity to the grid, has a smaller capacity due to the small size of the wind power system. At 18:00–24:00, large amounts of electricity are purchased from the grid, which is slightly higher than the price of electricity sold, which resulted in the revenue generated during the day being used to compensate for night consumption. Strategy II sells part of the surplus electricity to the grid at 10:00–17:00. During the period from 18:00–24:00, the economic burden is reduced by the lower purchase of electricity, as the wind power system is able to meet the demand on the whole. The economic costs of the two strategies are similar.
(5) Winter results analysis
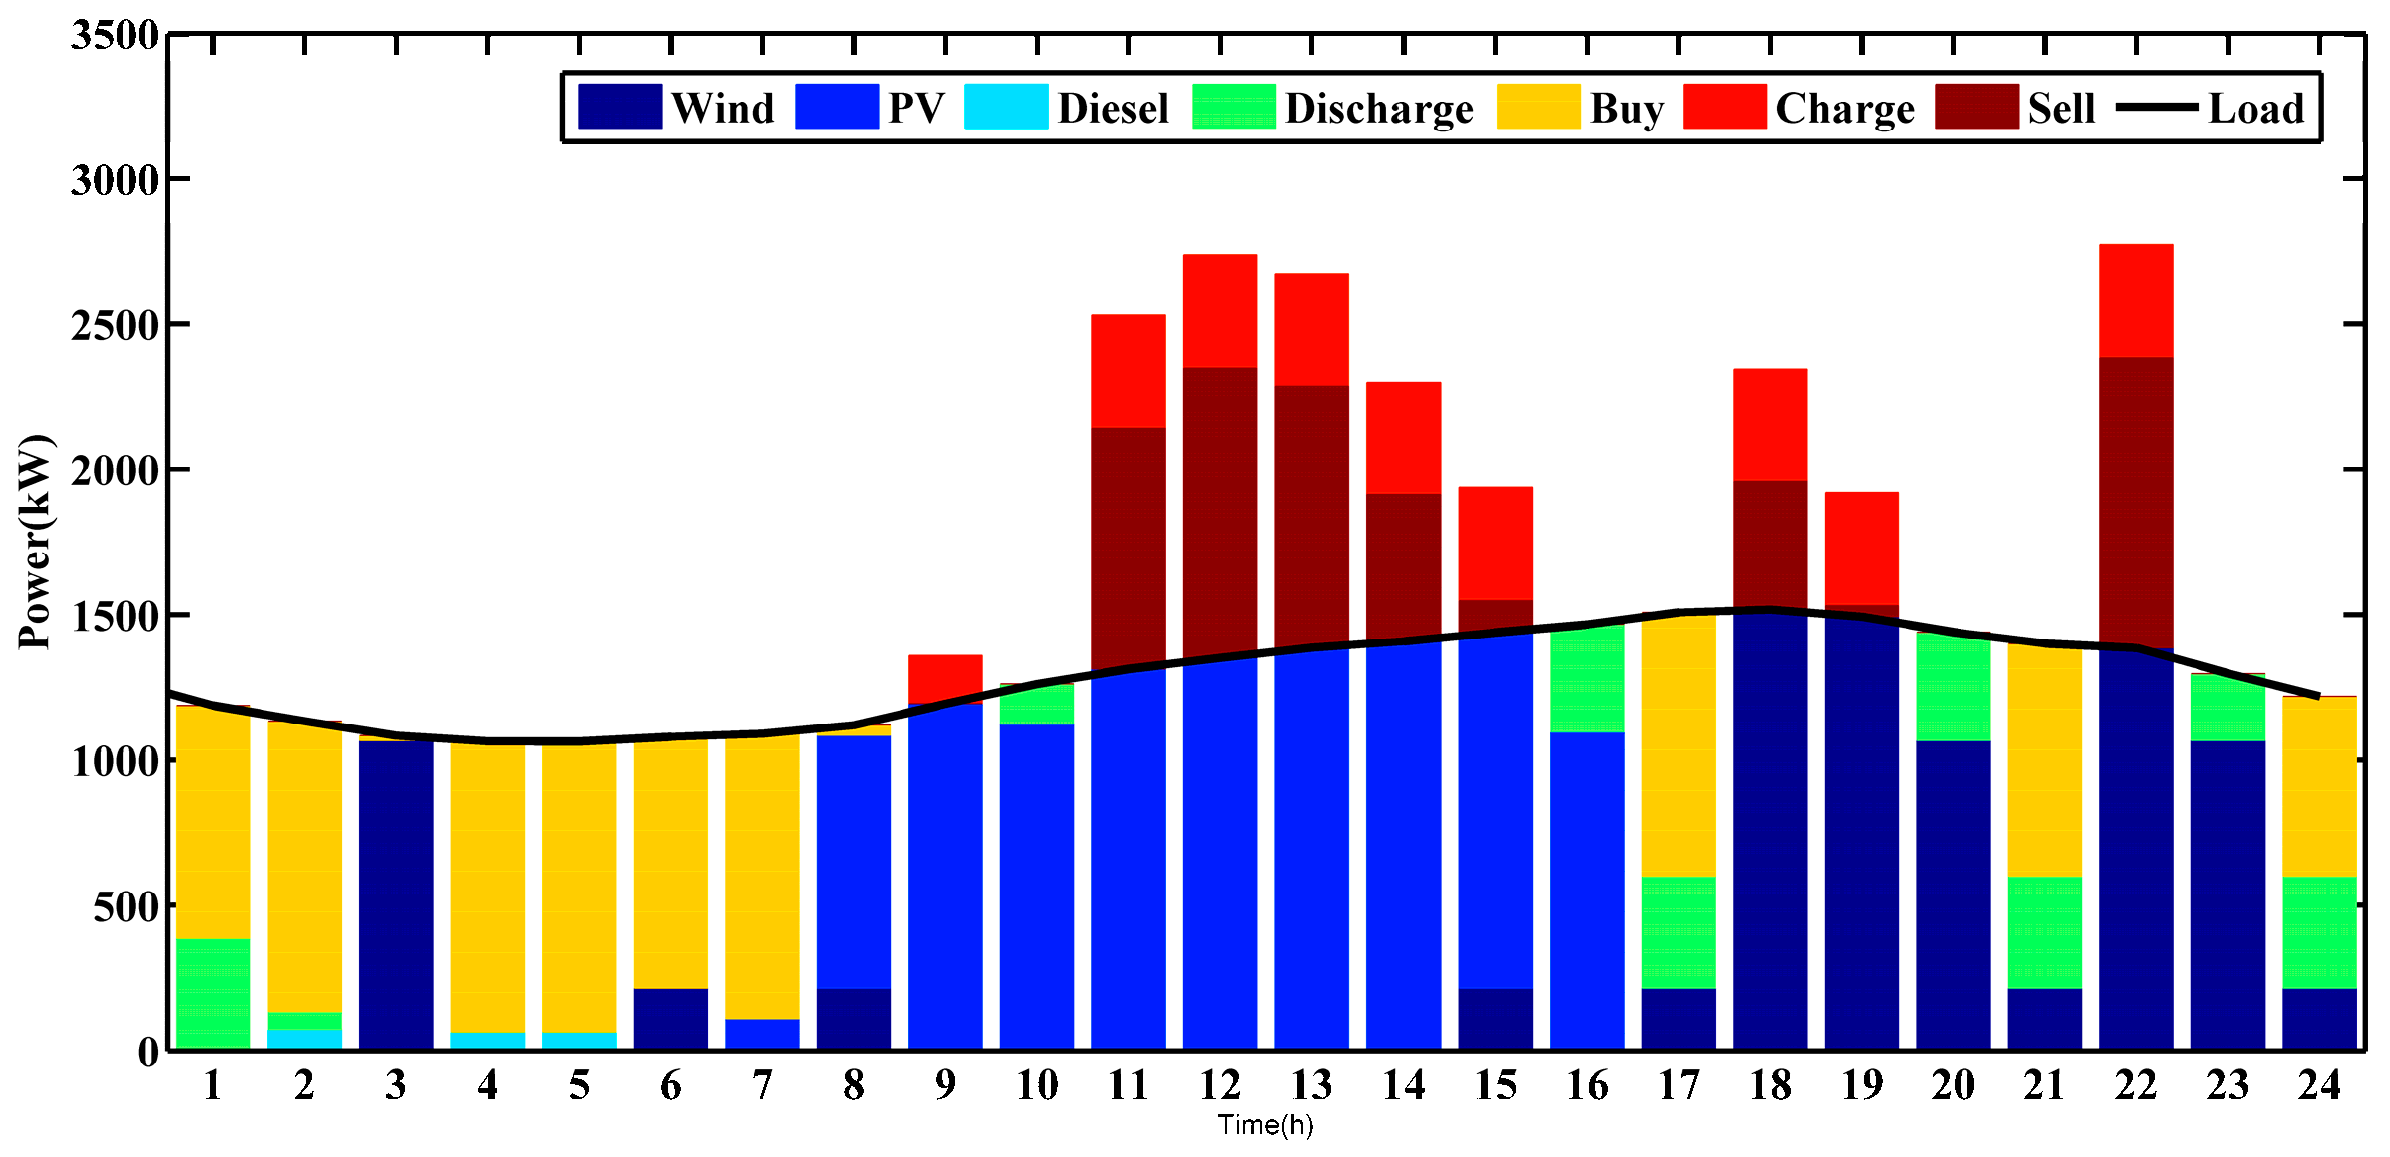
The output of each device in winter under the two strategies is shown in Figure 9 and Figure 10. During the period from 1:00–7:00, the output power of equipment under the two strategies is essentially the same, with little output from the wind and PV systems, mostly based on electricity tariffs charged to the grid. During the 8:00–16:00 period, there is a part of the power allocated to the energy storage system under strategy I. Under strategy II, only a few electricity energies are allocated to the energy storage system. From 17:00–24:00, the power purchase of strategy I to the grid is less than of the strategy II. In strategy I, the energy storage system also undertakes part of the supply task. Compared to the strategy I, the cost of strategy II will be much lower.
(6) Comparison analysis
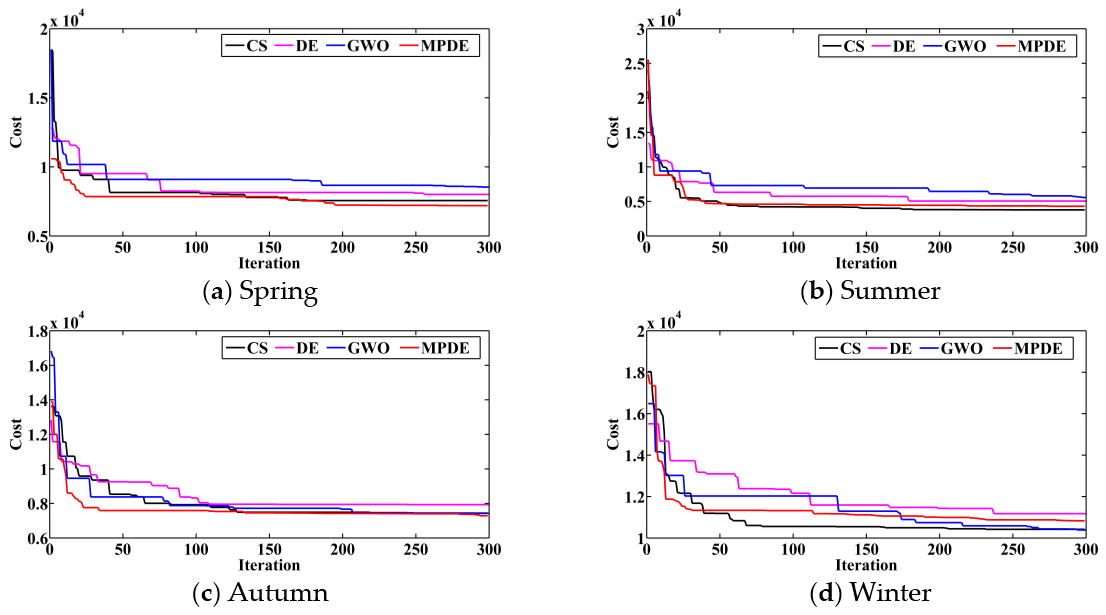
In order to prove the efficiency of the proposed method, MPDE, DE, grey wolf optimizer (GWO) [29] and cuckoo search (CS) [30] algorithms were applied to solve the same model in the four seasons, and the results are show in Table 5 and Table 6.
From Table 5 and Table 6, it can be seen that the MPDE obtained the lowest fitness function value in the four seasons under strategy I; MPDE obtained the lowest fitness function value in spring and autumn under strategy II, CS got the lowest fitness value in summer and winter.
The convergence curves of different algorithms are shown in Figure 11 and Figure 12.
As Figure 11 and Figure 12 show, MPDE performs well in terms of convergence speed. This is because dominant population and elite retention guide the population to approach the optimal value as quickly as possible.

6. Conclusions and Future Research

Optimizing the capacity of MG is necessary to reduce energy waste, environmental pollution, and investment costs. By considering meteorological data and load data of the whole year, an SMG model that considered the total investment cost and environment protective cost as the objective function was established and the constraints of each DG operation in an SMG were fully considered to guarantee proper, safe, and economical operation of an SMG. Based on the traditional DE algorithm, a multi-population evolution strategy was adopted to protect the population diversity and improve the convergence speed of the algorithm. Although only one area was analyzed for weather conditions, the four typical days basically covered all the weather conditions that might be encountered. It is suitable for the allocation of MG capacity under various weather conditions and can be used with different scheduling strategies according to the local climate. Under the two scheduling strategies, the operation status of each device in an MG is different. On the same typical day, when the output power of the wind power system is not satisfied by the requirements at night and needs to purchase from grid, the energy storage system in strategy I can fill part of the load vacancy, so the cost of strategy I will be lower than strategy II. Conversely, when the output power of the wind power system can meet the demand of the load at night or most of the time it can satisfy the load demand, strategy II will have to sell excess electricity to the grid for economic gain. In contrast, strategy II will cost slightly less than strategy I. In different seasons, the equipment capacity allocation will take on certain characteristics due to the weather. If the radiance resources are abundant, the capacity of the PV system will be more than that of wind power system in the same region. Similarly, in areas with abundant wind resources, a wind power system will have more capacity than a PV system. The final simulation results showed that the proposed algorithm can minimize the investment of economic costs and can be friendlier to the environment.

Author Contributions

H.-J.Z. and Y.-B.F. conceived and designed the experiments and wrote the paper; K.-P.L. assisted in conceived and designed, and wrote the paper together.

Funding

This research received no external funding.

Acknowledgments

The author would like to express appreciation to anonymous reviewers for their very helpful comments on ways to improve the paper, and Ling-Ling Li of State Key Laboratory of Reliability and Intelligence of Electrical Equipment, School of Electrical Engineering, Hebei University of Technology, China for design assistance.

Conflicts of Interest

The authors declare no conflict of interest.

References

  1. Nejabatkhah, F.; Li, Y.W. Overview of Power Management Strategies of Hybrid AC/DC Microgrid. IEEE Trans. Power Electron. 2015, 30, 7072–7089. [Google Scholar] [CrossRef]
  2. Patrao, I.; Figueres, E.; Garcera, G.; Gonzalez-Medina, R. Microgrid architectures for low voltage distributed generation. Renew. Sustain. Energy Rev. 2015, 43, 415–424. [Google Scholar] [CrossRef]
  3. Elsied, M.; Oukaour, A.; Gualous, H.; Lo Brutto, O.A. Optimal economic and environment operation of micro-grid power systems. Energy Convers. Manag. 2016, 122, 182–194. [Google Scholar] [CrossRef]
  4. Fathima, A.H.; Palanisamy, K. Optimization in microgrids with hybrid energy systems—A review. Renew. Sustain. Energy Rev. 2015, 45, 431–446. [Google Scholar] [CrossRef]
  5. Nosratabadi, S.M.; Hooshmand, R.A.; Gholipour, E. A comprehensive review on microgrid and virtual power plant concepts employed for distributed energy resources scheduling in power systems. Renew. Sustain. Energy Rev. 2017, 67, 341–363. [Google Scholar] [CrossRef]
  6. Alavi, S.A.; Ahmadian, A.; Aliakbar-Golkar, M. Optimal probabilistic energy management in a typical micro-grid based-on robust optimization and point estimate method. Energy Convers. Manag. 2015, 95, 314–325. [Google Scholar] [CrossRef]
  7. Hafez, O.; Bhattacharya, K. Optimal planning and design of a renewable energy based supply system for microgrids. Renew. Energy 2012, 45, 7–15. [Google Scholar] [CrossRef]
  8. Muis, Z.A.; Hashim, H.; Manan, Z.A.; Taha, F.M.; Douglas, P.L. Optimal planning of renewable energy-integrated electricity generation schemes with CO2 reducing target. Renew. Energy 2010, 35, 2562–2570. [Google Scholar] [CrossRef] [Green Version]
  9. Umeozor, E.C.; Trifkovic, M. Operational scheduling of microgrids via parametric programming. Appl. Energy 2016, 180, 672–681. [Google Scholar] [CrossRef]
  10. Shi, W.B.; Li, N.; Chu, C.C.; Gadh, R. Real-time Energy Management in Microgrids. IEEE Trans. Smart Grid 2017, 8, 228–238. [Google Scholar] [CrossRef]
  11. Shi, W.B.; Xie, X.R.; Chu, C.C.; Gadh, R. Distributed Optimal Energy Management in Microgrids. IEEE Trans. Smart Grid 2015, 6, 1137–1146. [Google Scholar] [CrossRef]
  12. Lu, X.H.; Zhou, K.L.; Yang, S.L. Multi-objective optimal dispatch of microgrid containing electric vehicles. J. Clean. Prod. 2017, 165, 1572–1581. [Google Scholar] [CrossRef]
  13. Cheng, S.; Su, G.C.; Zhao, L.L.; Huang, T.L. Dynamic dispatch optimization of microgrid based on a QS-PSO algorithm. J. Renew. Sustain. Energy 2017, 9, 045505. [Google Scholar] [CrossRef]
  14. Nikmehr, N.; Ravadanegh, S.N. Optimal power dispatch of multi-microgrids at future smart distribution grids. IEEE Trans. Smart Grid 2015, 6, 1648–1657. [Google Scholar] [CrossRef]
  15. Ma, Y.W.; Yang, P.; Guo, H.X.; Wang, Y.W. Dynamic economic dispatch and control of a stand-alone microgrid in Dongao Island. J. Electr. Eng. Technol. 2015, 10, 1432–1440. [Google Scholar] [CrossRef]
  16. Elattar, E.E. A hybrid genetic algorithm and bacterial foraging approach for dynamic economic dispatch problem. Int. J. Electr. Power Energy Syst. 2015, 69, 18–26. [Google Scholar] [CrossRef]
  17. Du, Y.; Pei, W.; Chen, N.S.; Ge, X.J.; Xiao, H. Real-time microgrid economic dispatch based on model predictive control strategy. J. Mod. Power Syst. Clean Energy 2017, 5, 787–796. [Google Scholar] [CrossRef] [Green Version]
  18. Ali, M.Z.; Awad, N.H.; Suganthan, P.N. Multi-population differential evolution with balanced ensemble of mutation strategies for large-scale global optimization. Appl. Soft Comput. 2015, 33, 304–327. [Google Scholar] [CrossRef]
  19. Guo, S.M.; Yang, C.C. Enhancing differential evolution utilizing eigenvector-based crossover operator. IEEE Trans. Evol. Comput. 2015, 19, 31–49. [Google Scholar]
  20. Arabas, J.; Biedrzycki, R. Improving evolutionary algorithms in a continuous domain by monitoring the population midpoint. IEEE Trans. Evol. Comput. 2017, 21, 807–812. [Google Scholar] [CrossRef]
  21. Xu, L.; Ruan, X.B.; Mao, C.X.; Zhang, B.H.; Luo, Y. An improved optimal sizing method for wind-solar-battery hybrid power system. IEEE Trans. Sustain. Energy 2013, 4, 774–785. [Google Scholar]
  22. Lu, Z.L.; Tang, Y.; Li, J.; Wang, H.; Wang, X.Q. Multi-objective optimal sizing for distributed generation of isolated hybrid microgrid using Markov-based electromagnetism-like mechanism. Proc. CSEE 2017, 37, 1927–1936. [Google Scholar]
  23. Li, L.L.; Chen, X.D.; Tseng, M.L.; Wang, C.H.; Wu, K.J.; Lim, M.K. Effective power management modeling of aggregated heating, ventilation, and air conditioning loads with lazy state switching. J. Clean. Prod. 2017, 166, 844–850. [Google Scholar] [CrossRef]
  24. Li, L.L.; Cheng, P.; Lin, H.C.; Dong, H. Short-term output power forecasting of photovoltaic systems based on the deep belief net. Adv. Mech. Eng. 2017, 9. [Google Scholar] [CrossRef] [Green Version]
  25. Li, L.L.; Lin, G.Q.; Tseng, M.L.; Tan, K.; Lim, M.K. A Maximum Power Point Tracking Method for PV System with Improved Gravitational Search Algorithm. Appl. Soft Comput. 2018, 65, 333–348. [Google Scholar] [CrossRef]
  26. Ding, M.; Wang, B.; Zhao, B.; Chen, Z.N. Configuration optimization of capacity of standard PV-wind-diesel-battery hybrid microgrid. Power Syst. Technol. 2013, 37, 575–581. [Google Scholar]
  27. Ma, P.; Zhou, Y.C.; Shang, X.B.; Yang, M. Firing accuracy evaluation of electromagnetic railgun based on multicriteria optimal Latin Hypercube design. IEEE Trans. Plasma Sci. 2017, 45, 1503–1511. [Google Scholar] [CrossRef]
  28. The National Centers for Environmental Information. Available online: https://www.ncdc.noaa.gov/ (accessed on 28 November 2017).
  29. Mirjalili, S.; Mirjalili, S.M.; Lewis, A. Grey wolf optimizer. Adv. Eng. Softw. 2014, 69, 46–61. [Google Scholar] [CrossRef]
  30. Gandomi, A.H.; Yang, X.S.; Alavi, A.H. Cuckoo search algorithm: A metaheuristic approach to solve structural optimization problems. Eng. Comput. 2013, 29, 17–35. [Google Scholar] [CrossRef]
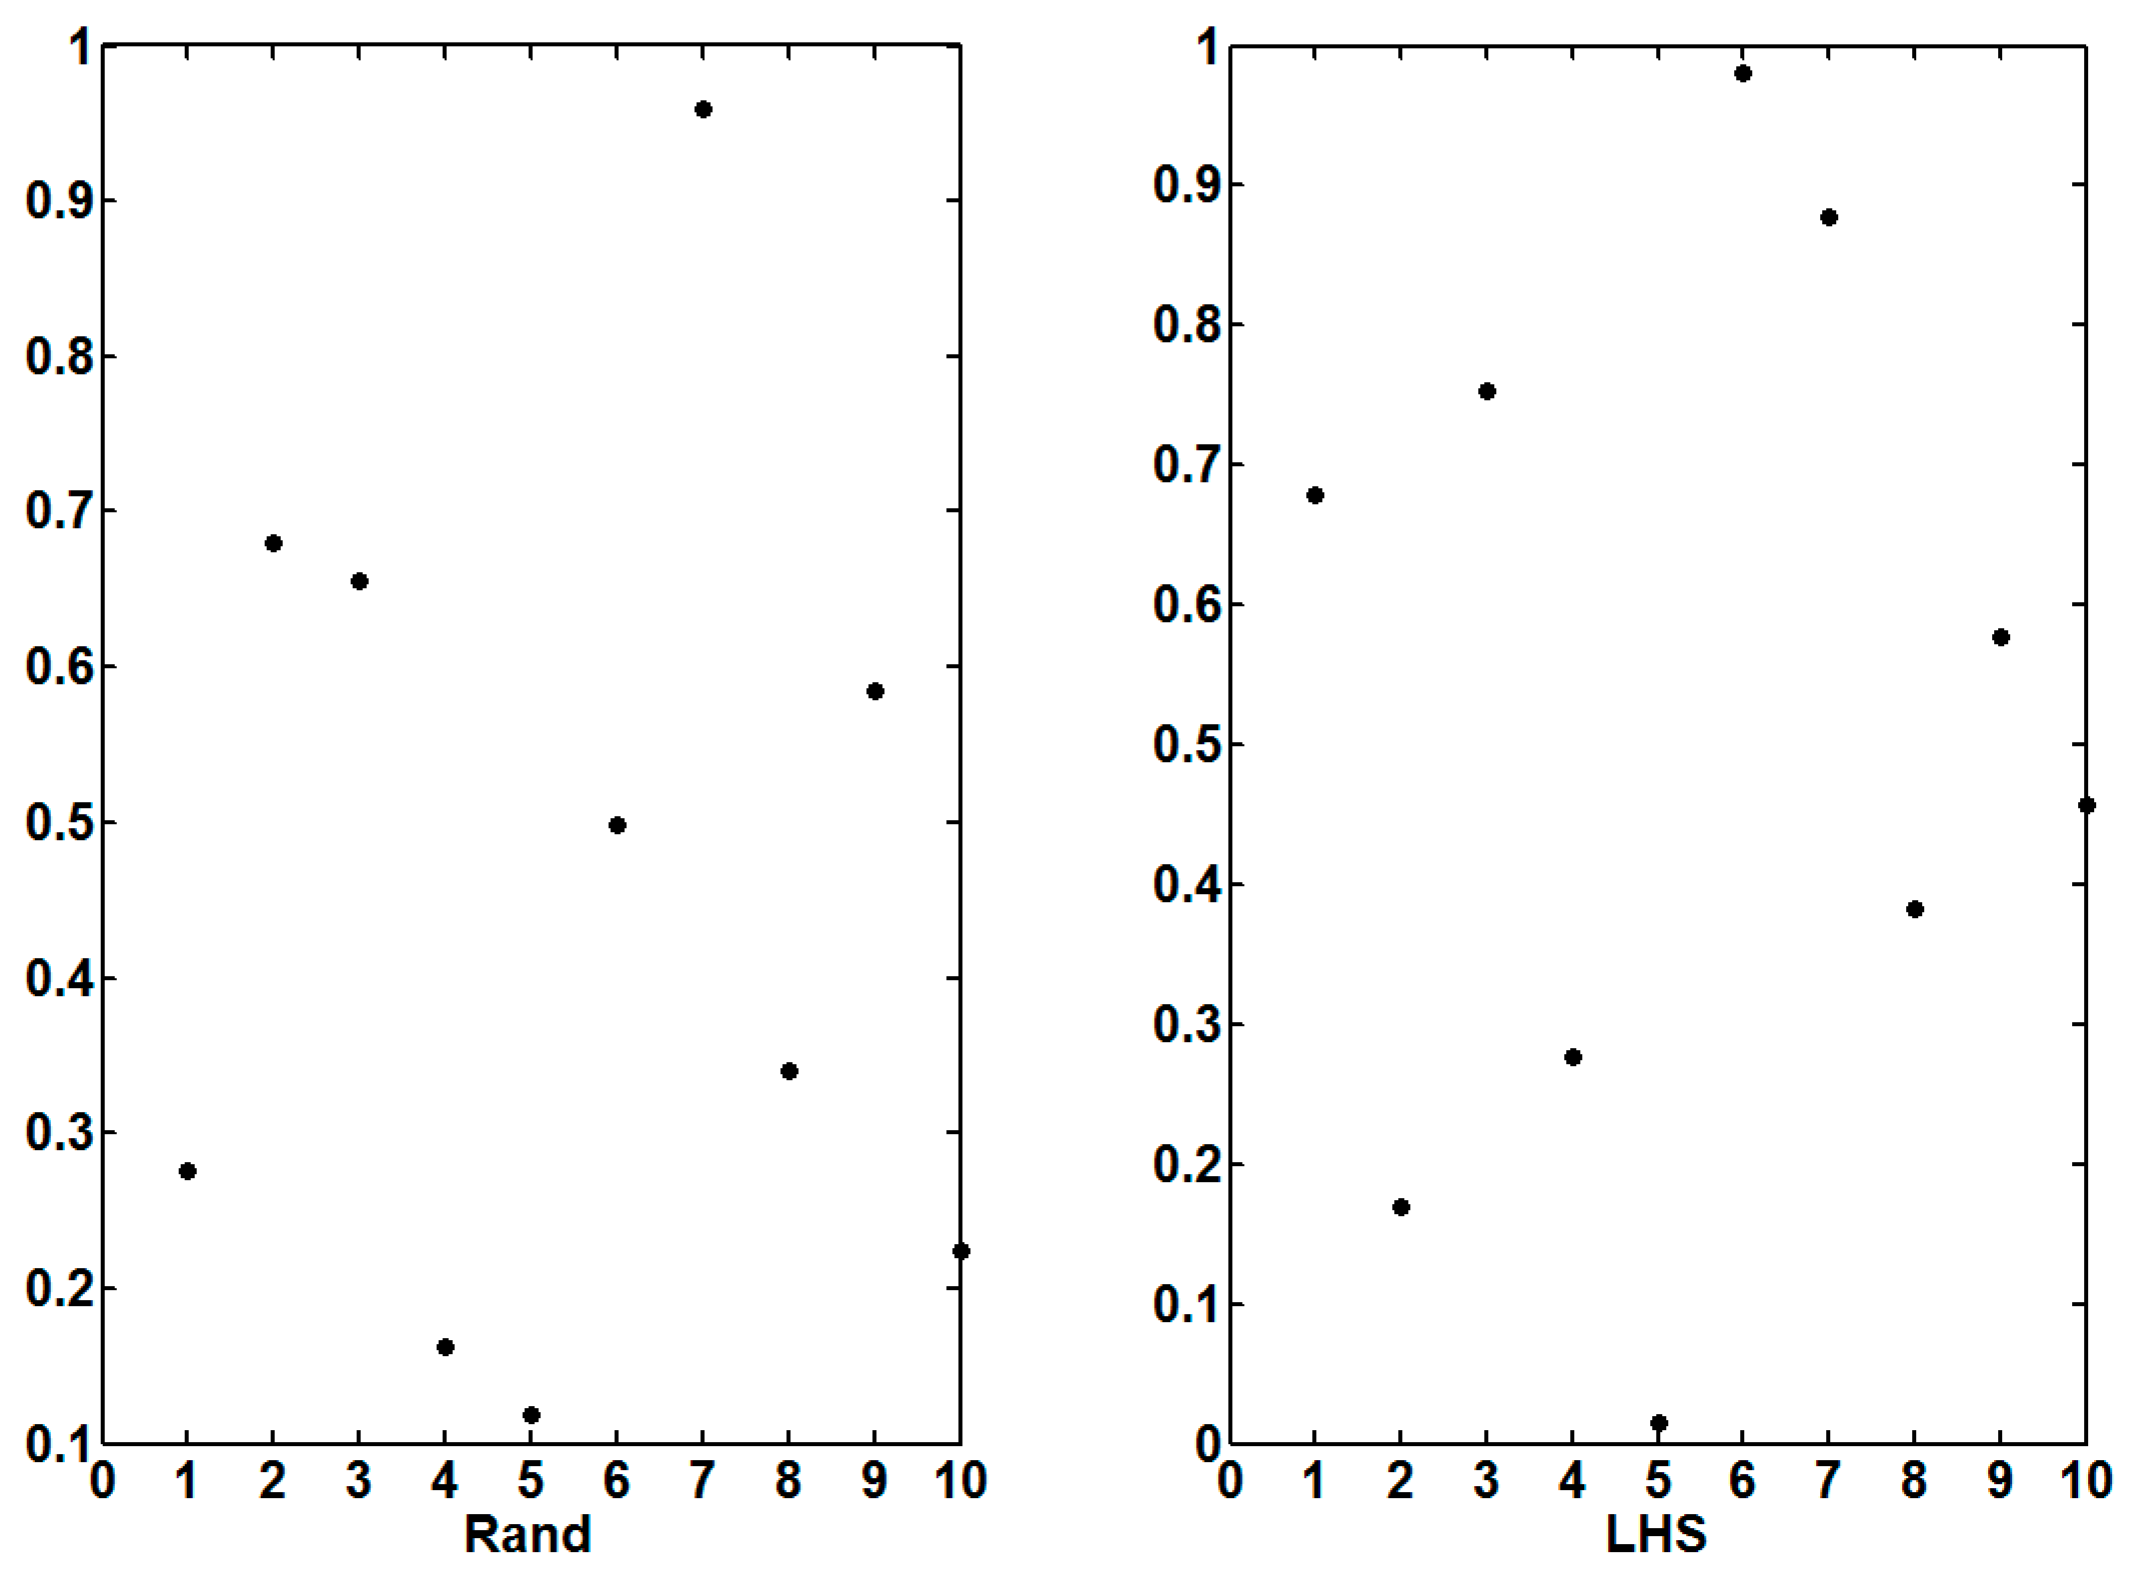
Figure 1. Rand distribution and Latin hypercube sampling (LHS) distribution comparison chart.
Sustainability 10 02694 g001
Figure 2. Comparison result diagram of different power limit of the grid.
Sustainability 10 02694 g002
Figure 3. Operating status of equipment under strategy I.
Sustainability 10 02694 g003
Figure 4. Operating status of equipment under strategy II.
Sustainability 10 02694 g004
Figure 5. Operating status of equipment under strategy I.
Sustainability 10 02694 g005
Figure 6. Operating status of equipment under strategy II.
Sustainability 10 02694 g006
Figure 7. Operating status of equipment under strategy I.
Sustainability 10 02694 g007
Figure 8. Operating status of equipment under strategy II.
Sustainability 10 02694 g008
Figure 9. Operating status of equipment under strategy I.
Sustainability 10 02694 g009
Figure 10. Operating status of equipment under strategy II.
Sustainability 10 02694 g010
Figure 11. Convergence curves under strategy I.
Sustainability 10 02694 g011
Figure 12. Convergence curves under strategy II.
Sustainability 10 02694 g012
Table 1. Distributed generation (DG) costs and related cost factors.
DGWindPVDiesel GenerationBattery
Cost of investment (RMB/kW)453550001283567
Replace cost (RMB/kW)001000453
OM cost (RMB/kW)35.488.725.75.7
Capacity (kW)2515255
Life (year)202592.5
Table 2. Diesel generator emission factor and pollution control costs.
Emission GasesPollution Coefficient (g/kW)Pollution Control Costs (RMB/kg)
CO26490.210
SO20.20614.842
NO9.89062.964
Table 3. Microgrid (MG) system configuration results under strategy I.
SeasonsSpringSummerAutumnWinter
Nwind300212160272
Npv90245300300
Ndiesel10218097
Nbattery20014460194
P N wind 6151215
P N pv 20121014
P N diesel 511201
E N battery 102.51010
P waste 0000
P vacancy 0000
Costs (RMB)1517.12139.58132.15804.8
Table 4. MG system configuration results under strategy II.
SeasonsSpringSummerAutumnWinter
Nwind255120131200
Npv127160300300
Ndiesel181410012
Nbattery168198160200
P N wind 10302220
P N pv 720913
P N diesel 2230225
E N battery 910106
P waste 0000
P vacancy 0000
Costs (RMB)7199.54301.27284.510,830.9
Table 5. Comparison results of different algorithms under strategy I.
SeasonsSpringSummerAutumnWinter
MPDE1517.12139.58132.15804.8
DE3758.13302.68517.66411.7
GWO1883.22377.18395.96268.3
CS1599.32477.88355.96207.4
Table 6. Comparison results of different algorithms under strategy II.
SeasonsSpringSummerAutumnWinter
MPDE7199.54301.27284.510,830.9
DE8010.75062.37933.311,178.3
GWO8540.55568.67417.910,372.5
CS7563.33779.37439.610,420.1