Article

Assessing Soil Metal Levels in an Industrial Environment of Northwestern China and the Phytoremediation Potential of Its Native Plants

1
Key Laboratory of Eco-Environments in Three Gorges Reservoir Region, Chongqing Key Laboratory of Plant Ecology and Resources Research in Three Gorges Reservoir Region, School of Life Sciences, Southwest University, Chongqing 400715, China
2
Key Laboratory of Forest Ecology and Environment, China’s National Forestry and Grassland Administration, Institute of Forest Ecology, Environment and Protection, Chinese Academy of Forestry, Beijing 100091, China
3
State Key Laboratory of the Seedling Bioengineering, Ningxia Forestry Institute, Yinchuan 750004, China
*
Author to whom correspondence should be addressed.
Sustainability 2018, 10(8), 2686; https://doi.org/10.3390/su10082686
Submission received: 21 June 2018 / Revised: 26 July 2018 / Accepted: 27 July 2018 / Published: 31 July 2018
(This article belongs to the Section Environmental Sustainability and Applications)

Abstract

:
Various industrial activities contribute heavy metals to terrestrial ecosystems. In order to evaluate the soil quality of industrial areas and to identify the potential phytoremediator from the native plant species, we collected 45 surface soil samples and 21 plant species in a typical industrial area of northwestern China. The results showed that the average values of the Cd, Cr, As, Pb, Cu, and Zn in the soils were 36.91, 1.67, 7.20, 1.38, 1.27, and 6.66 times, respectively, compared with the corresponding background values. The average single factor pollution index for heavy metals decreased in the order of Cd > As > Zn > Cr > Cu > Pb. The study area was seriously polluted by Cd and As, slightly polluted by Zn, and had relatively little contamination by Cr, Pb, and Cu. In terms of the average Nemerow synthetic pollution index in every sampling site, 97.78% of the samples were seriously polluted and 2.22% of the samples were moderately polluted, which indicated that almost all of the samples in the industrial area were seriously polluted. The results of the biomass, heavy metal concentrations, bioconcentration factors (BCF), and translocation factors (TF) for the native plants showed that Achnatherum splendens for metal Cr presented a phytostabilization potential, Artemisia scoparia and Echinochloa crusgalli for metal Cu and Halogeton arachnoideus for metal Zn presented a phytoextraction potential, and all of the studied plants were limited as phytoremediators for Cd or Pb contaminated soil.

1. Introduction

Heavy metal pollution has become a worldwide environmental concern because of its latency, toxicity, and contamination within soils over time [1]. Heavy metal pollution is generally considered to result from anthropogenic activities, such as mining, mineral fertilizers, vehicle exhaust, and other industrial activities [2,3]. Industrial activities are regarded as the principal contributor for heavy metal pollution [4]. With the rapid industrialization and urbanization of China over the last decades, various industrial activities have contributed a large amount of heavy metals to the soil, directly and indirectly [5]. The urban soil around electronics manufacturing has been subject to multiple heavy metal contaminations in the Hebei province of China [6]. Wastewater from unregulated manufacturers is the primary heavy metal contributor in urban river systems [7]. It has been found that about 50% of the soil samples are contaminated by heavy metals in the gold-mining region of Shanxi province, China [8]. Heavy metal exposure in ecosystems can endanger both animals and plants, and harm human health via the food chain [9,10,11]. Long-term exposure to heavy metals has been associated with problems such as hearing loss, intellectual disabilities, nervous system dysfunction, behavioral problems, and various cancers. Furthermore, exposure to multiple heavy metals may induce more severe diseases such as immune system damage, skin cancer, skeletal damage, vascular disease, and so on [12,13].
Over the past decade, in order to reduce the heavy metal risks to human health, the remediation of heavy metal contaminated soils has been a worldwide environmental goal. Various technologies (surfication, landfilling, soil flushing, electro kinetic, extraction, phytoremediation, bioremediation, etc.) have been applied to remediate heavy metal contaminated soils. However, most of these techniques are costly and may cause secondary pollution [14]. Phytoremediation is a promising method for the removal of heavy metals from contaminated soils, which is considered a low-cost, effective, and environmental friendly approach for remediation, and has been widely adopted over the world [15]. In general, phytoremediation is classified into several subcategories, namely: phytostabilization, phytoextraction, phytovolatilization, phytodegradation, and so on. Phytostabilization minimizes or restricts the movement of pollutants by plants, phytoextraction relies on plants to absorb soil heavy metals, phytovolatilization removes volatile pollutants or metabolites using plants, and phytodegradation degrades organic pollutants by inducing the metabolic activities of plant root microbes [16]. Although in the future, the genetic engineering of plants may help improving phytoremediation [17], presently, there is an urgent demand to select promising species from native plants [18,19,20]. The use of native plants is a valuable option, because these plants are better adapted to the regional multi-stressful environment than the introduced ones [21,22]. Previous studies also reported that heavy metal accumulators were usually found in metal-contaminated environments [23,24]. Therefore, it could be an effective way to assess the phytoremediation potential of native plants in a metal-contaminated environment.
With the implementation of China’s Western Development Policy, more industrial areas have improved their economies in the northwest. However, the soil quality has been severely deteriorated, especially because of the heavy metal soil pollution. Most industrial parks have been built on the edges of rivers to have better access to water resources, thus causing severe heavy metal pollution in rivers, because of surface runoff and the mobility of heavy metal in soils [25]. As one of the fastest-growing cities with an industrial economy, Shizhuishan, located in northwestern Ningxia, China, is considered as a typical city that has exhausted coal as a resource. The leading industries include mining, smelting, electroplating, energy, chemical, fuel production, and power transmission. Despite the economic development generated from these industries, it is well known that these industries can lead to serious heavy metal contamination by discharging waste residue into soils and waste water into the river. Wang et al. [26] found that the soil heavy metal pollution in the industrial area of Ningxia is the most serious in different functional zones. A previous study by Zhou et al. [27] showed that the groundwater heavy metal pollution in Ningxia has been worsened by industry. Heavy metals dissolved in water are easily absorbed by organisms and can be bio-accumulated into the food chain. The long-term exposure to heavy metals for humans may affect growth, metabolism, reproduction, and even lead to various diseases. Therefore, it is urgent to find and evaluate the heavy metal pollution of surface soils in the Shizuishan industrial district. It is also necessary to further effectively remediate the heavy metal pollution by phytoremediation technology. Phytoremediation utilizes plants to clean the heavy metal contamination. Many plants have been reported to tolerate and accumulate heavy metals, and can be used to eliminate the heavy metal contamination in soils [28,29]. However, plants that grow in the arid zone of northwest China are subjected not only to heavy metals, but to saline conditions and sometimes drought 30. Heavy metal accumulators from introduced ones cannot survive in these multiple environmental stresses. Thus, it is the best option to use native plants for phytoremediation, as they grow well in the harsh environment. The main objectives of this study were (1) to assess heavy metal pollution through different methods and (2) to identify potential phytoremediator of Cd, Cr, As, Pb, and Cu for phytoremediation in this region.

2. Materials and Methods
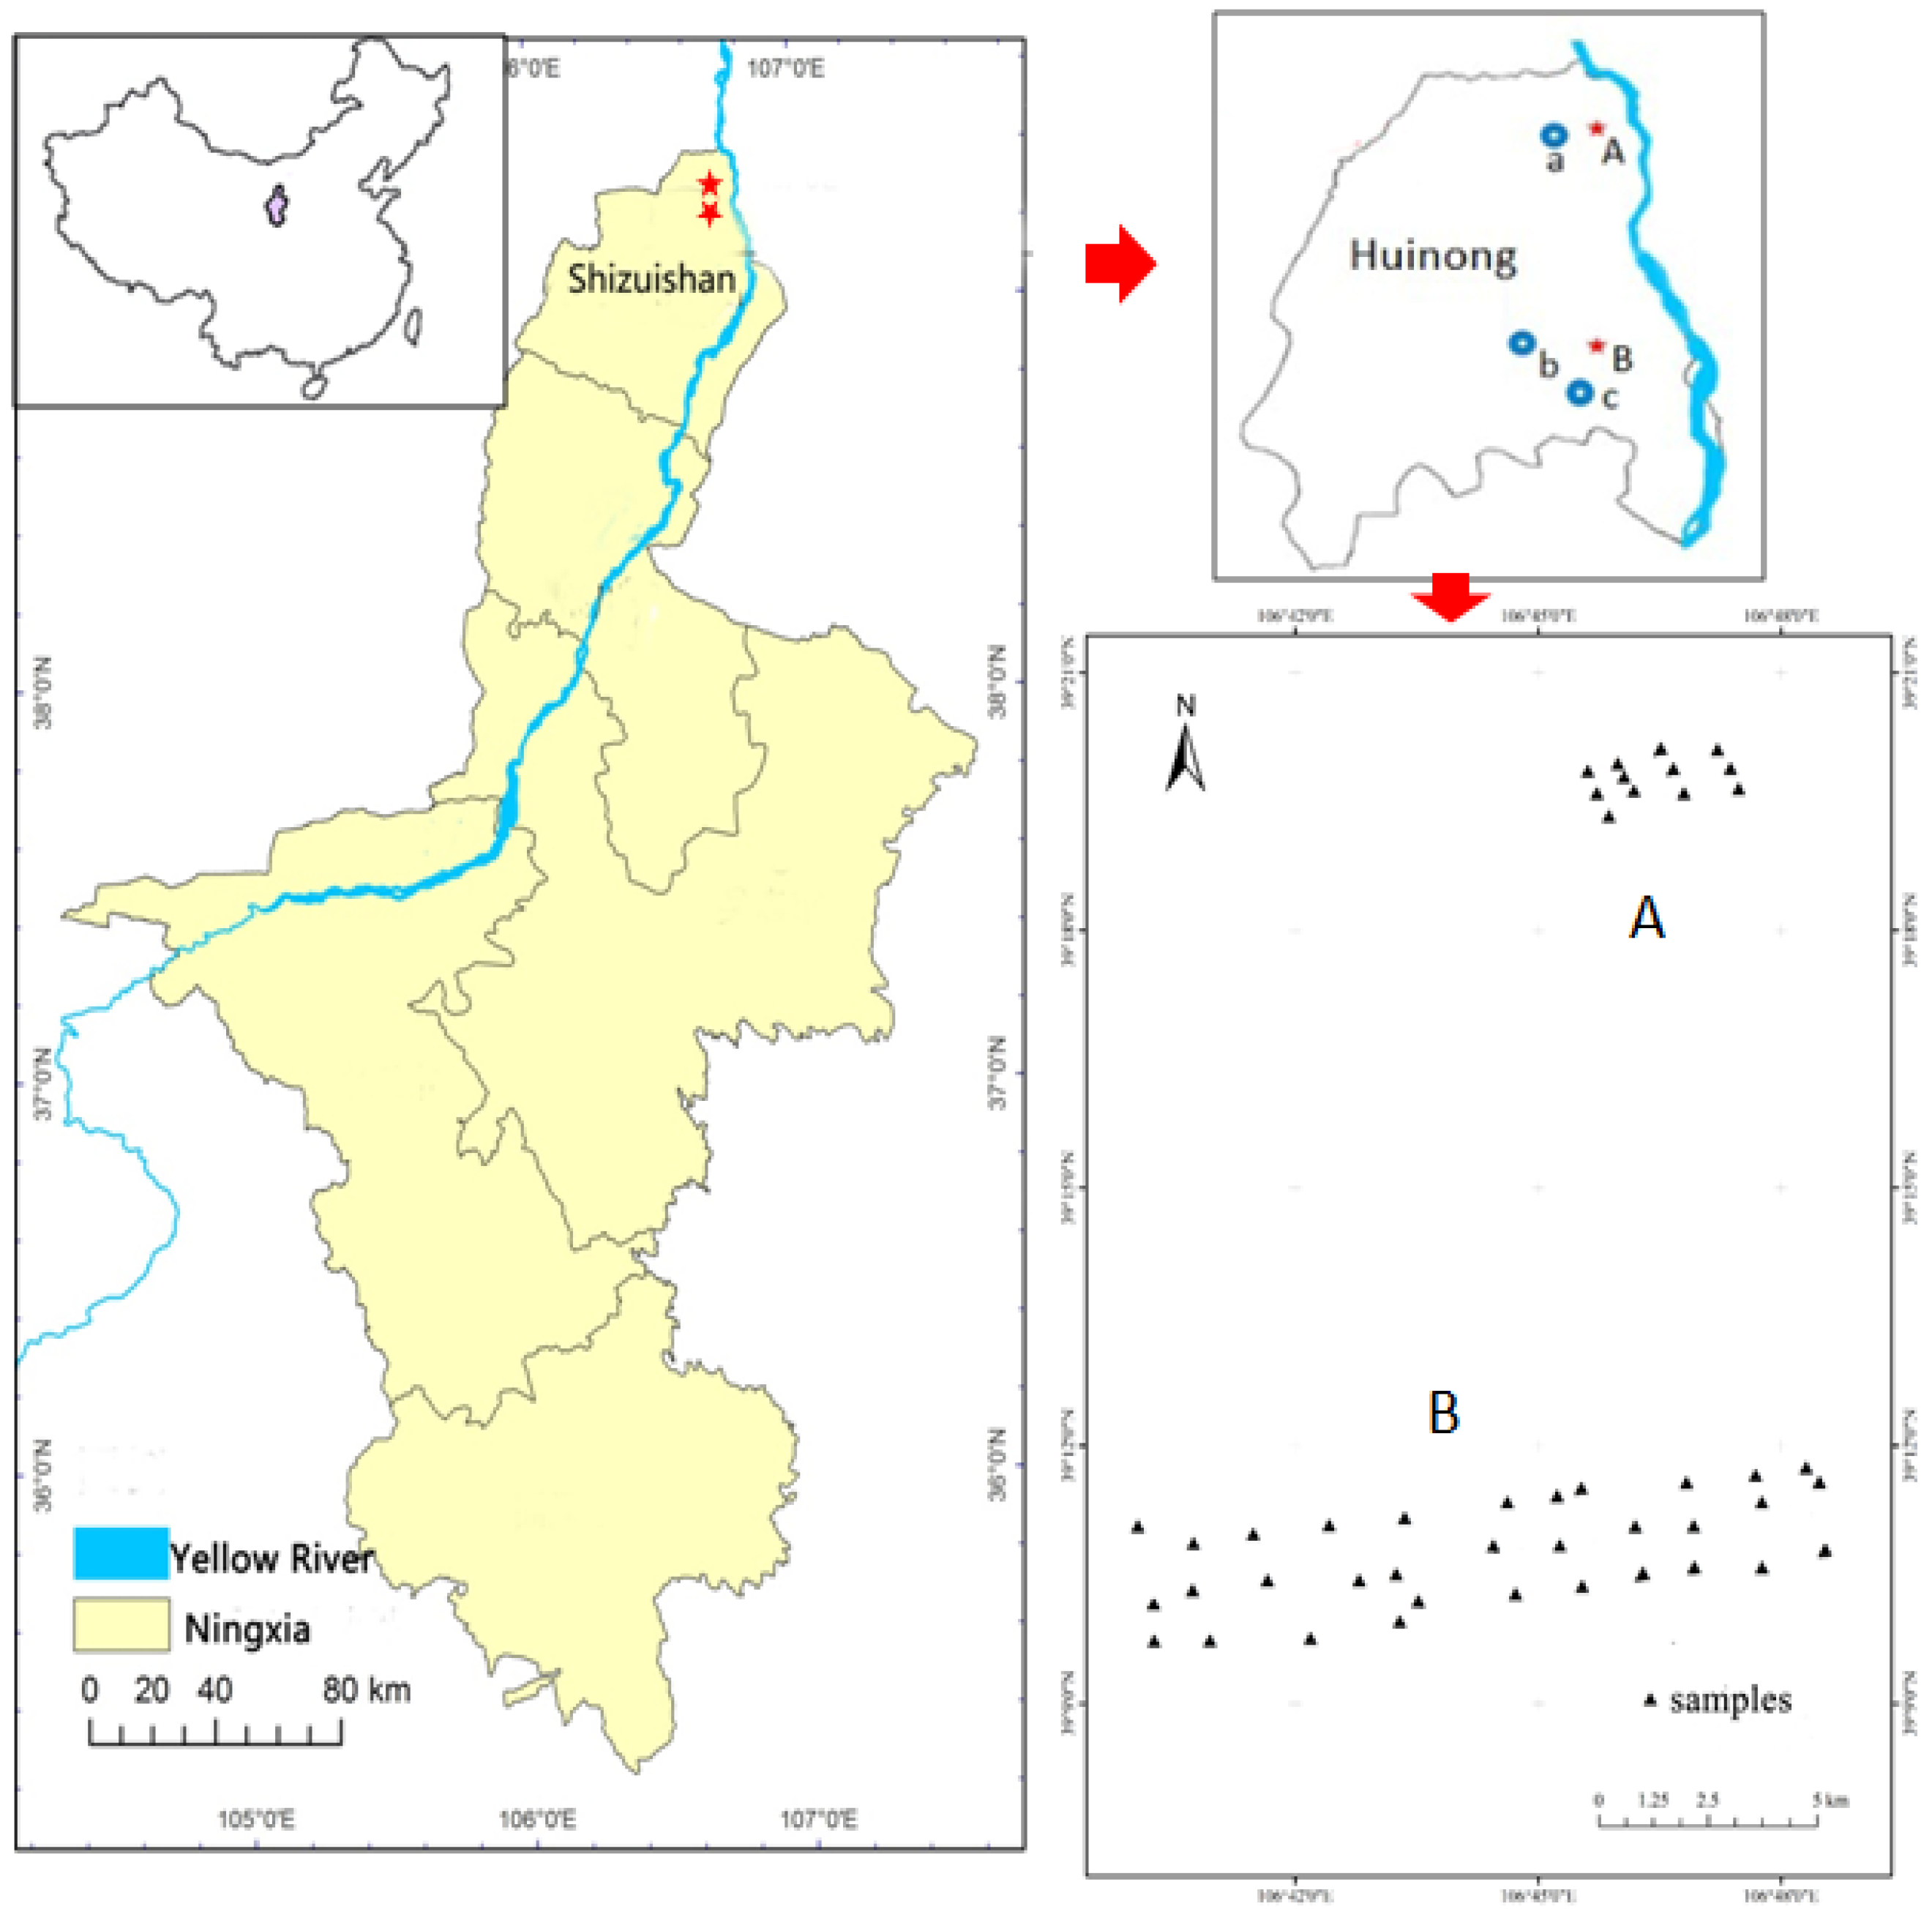
2.1. Study Area

Shizuishan is a typical industrial city in the northern part of Ningxia Province, China, which is bordered by the Yellow River in the east and Henlan Mountain in the west. There are three large industrial parks in this district, including Hebin industrial park (a), Hongguozi industrial park (b), and the Agricultural processing industrial park (c) (Figure 1); heavy metals mainly originated from the factories of the three industrial parks in the region. The area is characterized by strong solar radiation, frequent wind, and dry air. Climatic regime is a typical temperate continental monsoon climate, with an annual precipitation of 167.5–188.8 mm and a potential evaporation of 1708.7–2512.6 mm. The main soil type is gray desert soil [30]. The soil tends to be sandy textured and have pH values ranging from 8.0 to 9.1. The landscape is dominated by desert grassland, and the vegetation coverage fraction is very low in the study area. Herbaceous plants are the dominant vegetation type, such as Artemisia verbenacea, Peganum harmala, Salsola collina Pall, and so on.

2.2. Sample Collection and Analysis

To obtain representative data for the three industrial parks, 45 soil samples were collected from two sample zones (A and B) in August 2017. Based on the location of the three industrial parks, we designed zone A between the Hebin industrial park and the left bank of the Yellow River, and zone B between the center of Hongguozi and the agricultural product processing industrial park to the left bank of the Yellow River. There were 12 and 33 samples that were collected in zone A and B, respectively, by line transects of systematic sampling, with 800 m apart between the two sample locations (Figure 1).
Each sample was identified using a global positioning system (GPS) device to determine its longitude and latitude. The surface soil samples were collected between depths of 0 to 10 cm, and each composited sample (approximately 500 g) consisted of soils collected at the central point and four additional points within the radius of 2.5 m towards the north, east, south, and west.
At every soil sample point, plant species were investigated within an area of 1 m2. The height, coverage, and number of plants encountered were recorded and their important value was calculated. The important value is an indicator of the species roles in community. It is the sum of the relative height, relative frequency, and relative coverage of a species [31]. According to the important value, 21 species were collected from the corresponding soil sample locations, and three to five individuals of each species were randomly selected from the sample points. In the study area, herb species were the dominant life type, while there were rarely shrubs. There were 38 plant species of 11 families that were recorded, mainly composed of Asteraceae, Gramineae, and Chenopodiaceae, which accounted for 26.3%, 21.1%, and 21.1% of the total species, respectively (Table 1). These plants have common characteristics is dust removal, contamination resistance to heavy metals, and adaptability [32]. These plants were collected and stored in a cooler and transported to the lab immediately.
The concentration of Cd, Cr, As, Pb, Cu, and Zn in soils and plants were determined in the Key Laboratory of Eco-environment in the Three Gorges Reservoir Region of the Ministry of Education, College of Life Sciences, Southwest University, Chongqing, China. The soil samples were air-dried at room temperature, grinded and passed through a 100-mesh plastic sieve, and then oven-dried at 70 °C for 24 h. The fresh plants were separated into roots and shoots, carefully washed with deionized water, oven-dried at 70 °C for 24 h, and then the dry weight of every plant was measured after grinding into fine powder using a ball mill. For the analyses of the six heavy metals in the plant roots and shoots, approximately 0.05 g of material was digested by a microwave with a mixture of HNO3/H2O2 (3:1). Similarly, 0.05 g of soil was digested using a mixture of HNO3/H2O2/HF (7:2:1). The total concentrations of Cd, Cr, As, Pb, Cu, and Zn were determined by inductively coupled plasma-optical emission spectroscopy (ICP-OES, Thermo Fisher iCAP 6300, Loughborough, UK) [33].

2.3. Assessment of Soil Pollution

As a result of the alkaline nature of the soil in the study region, the six heavy metals were assessed using the second level standards of the Environmental Quality Standard for Soils (GBl5618-1995). The second level standards of Cd, Cr, As, Pb, Cu, and Zn were 0.6, 250, 25, 350, 100, and 300 mg∙kg1, respectively [34].
The single factor pollution index [35] was used to assess the pollution level of a single heavy metal. The Nemerow synthetic pollution index [36] was used to assess the overall pollution caused by the simultaneous presence of several heavy metals, which incorporates the mean and the maximum value of a single factor pollution index. Different heavy metal pollutions have different impacts on the environment, thus the weight coefficient of different heavy metals must be considered. This study adopted the weight coefficient suggested by Swaine [37]. To be specific, Cd, As, and Pb fell into the first category, which were the greatest environmental threats, and had a weight coefficient of three, whereas Cr, Cu, and Zn were in the second category with a weight coefficients of two.
(1)
The single factor pollution index is expressed as follows:
P i = C i / S i  
where Pi is the single factor pollution index of heavy metal i, and a larger Pi value indicates that the heavy metal pollution of soils is more serious. Ci is the measured value of the heavy metal i. Si is the second level standard of the Environmental Quality Standard for soils of heavy metal i.
(2)
The Nemerow synthetic pollution index is expressed as follows:
P N = ( C i / S i ) max 2 + ( i = 1 n w i P i / i = 1 n w i ) 2 2  
where PN is the Nemerow synthetic pollution index in every sampling site, (Ci / Si)max is the corresponding maximum value in the single factor pollution index, i = 1 n w i P i / i = 1 n w i is the corresponding weighted average value in the single factor pollution index, and w i is the weight coefficient of different heavy metals. The grade standard of the single factor pollution index and the Nemerow synthetic pollution index are showed in Table 2 [35,36].
The bioconcentration factor (BCF) and translocation factor (TF) are useful evaluate whether a particular plant is a heavy metal hyperaccumulator [38]. The ability of a plant to accumulate heavy metals from soils can be estimated using the BCF, and the ability of a plant to transfer metal from the root to the shoot is measured using the TF. BCF and TF [39,40] were calculated as follows:
BCF = CP/CS × 100%
where Cp is the heavy metal concentration in the whole plant and Cs is the heavy metal concentration in the soil (mg∙kg−1 DW).
TF = Cs/Cr × 100%
where Cs is the heavy metal concentration in the shoot of a plant and Cr is the heavy metal concentration in the root (mg∙kg−1 DW).

2.4. Statistical Analysis

Statistical analyses were performed for all of the data using SPSS 20.0 and Excel 2010, and figures were drawn using Origin 8.5. The Pearson correlation analyses were performed to establish the relationships of the heavy metals between the soil and plants. Differences between the different plants on the enrichment capability and transfer ability of heavy metals were studied with one-way analysis of variance (ANOVA) with Duncan’s multiple range test at the 5% level. All of the datasets were normal in our study.

3. Results

3.1. Heavy Metal Concentration in Soils

The descriptive statistics of six heavy metal contents in soils arre presented in Table 3.
As a whole, the mean value of the six heavy metal contents in the soils followed a descending order of Zn > Cr > As > Pb > Cu > Cd. All of the metal concentrations were far higher than their background values in Ningxia. Relatively, they were 36.91, 1.67, 7.20, 1.38, 1.27, and 6.66 times that of the corresponding background values, respectively. Based on their background values [41], the overall standard rate of six heavy metals were 90% higher, while Cd, As, and Zn were 100% higher. The coefficients of variation varied from 12.86% for Cr to 38.03% for Pb, and decreased in the order of Pb > Cd > Zn > As > Cu > Cr (Table 3).

3.2. Pollution Assessment of Heavy Metals

The single factor pollution index and Nemerow synthetic pollution index for the six heavy metals that were measured are summarized in Table 4.
The average single factor pollution index for the six heavy metals decreased in the order of Cd > As > Zn > Cr > Cu > Pb. The average single factor pollution index for Cd and As were greater than three, showing severe pollution. The values of Cd in all of the sampling sites ranged from 3.5 to 14.1, indicating serious contamination at all sites. The average single factor pollution index for Zn was between one and two, indicating that the study areas were slightly polluted by Zn. The maximum single factor pollution indices of Cr, Pb, and Cu in all of the samples were 0.40, 0.08, and 0.28, respectively. These values were lower than one, indicating that all of the samples were not polluted by Cr, Pb, and Cu. The average Nemerow synthetic pollution index in the industrial area was higher than three, which was serious pollution. On the whole, our data show that 97.78% of the samples were seriously polluted, and the rest were moderately polluted.

3.3. Relationship between Metal Levels in Soil and Plants

The correlation coefficients of the six heavy metals between the soils and plants are presented in Table 5. For Artemisia blepharolepis, Suaeda salsa, Mulgedium tataricum, Leymus secalinus, and Chloris virgata, the Cd content between the soils and plants showed a higher significant positive correlation. Polygonum aviculare, Amaranthus retroflexus, Chenopodium glaucum, Tribulus terrester, Chenopodium album, and Achnatherum splendens, their Cr content showed a higher significant positive correlation with corresponding soil, Cr. For Halogeton arachnoideus, Polygonum aviculare, Bassia dasyphylla, Suaeda salsa, Salsola collina, Mulgedium tataricum, and Chloris virgata, the Pb content between the soils and plants showed a higher significant positive correlation. For Halogeton arachnoideus, Echinochloa crusgalli, Amaranthus retroflexus, Setaria viridis, Artemisia scoparia, Achnatherum splendens, and Chloris virgata, the Cu content between the soils and plants showed a higher significant positive correlation. For Halogeton arachnoideus, Polygonum aviculare, Tribulus terrester, and Kochia scoparia, the Zn content between the soils and plants showed a higher significant positive correlation at the 0.05 probability level.

3.4. Heavy Metal Concentration in Plants

The concentration of heavy metals in the different plant samples are given in Table 6. For metal Cd, Artemisia blepharolepis and Leymus secalinus presented a higher accumulation, due to their higher biomass, than other plants. However, the Cd concentrations in the shoot and root of all of the studied plants were limited. The Cr concentrations in the shoots among the studied species had no significant differences. But Achnatherum splendens presented a higher level of Cr in the root compared with the other plants (p > 0.05). Chloris virgata had a higher value of metal Pb in the root, but the low biomass limited the application in phytoremediation. Halogeton arachnoideus and Salsola collina showed a relatively higher biomass and Pb contents than the other plants. For Cu, the concentrations in the roots among the studied species showed no significant differences, and Artemisia scoparia and Echinochloa crusgalli had significantly higher concentrations in the shoots (p > 0.05). Tribulus terrester and Halogeton arachnoideus showed higher levels of metal Zn in shoots and roots than other plants, but the biomass of Tribulus terrester was lower than that of Halogeton arachnoideus.

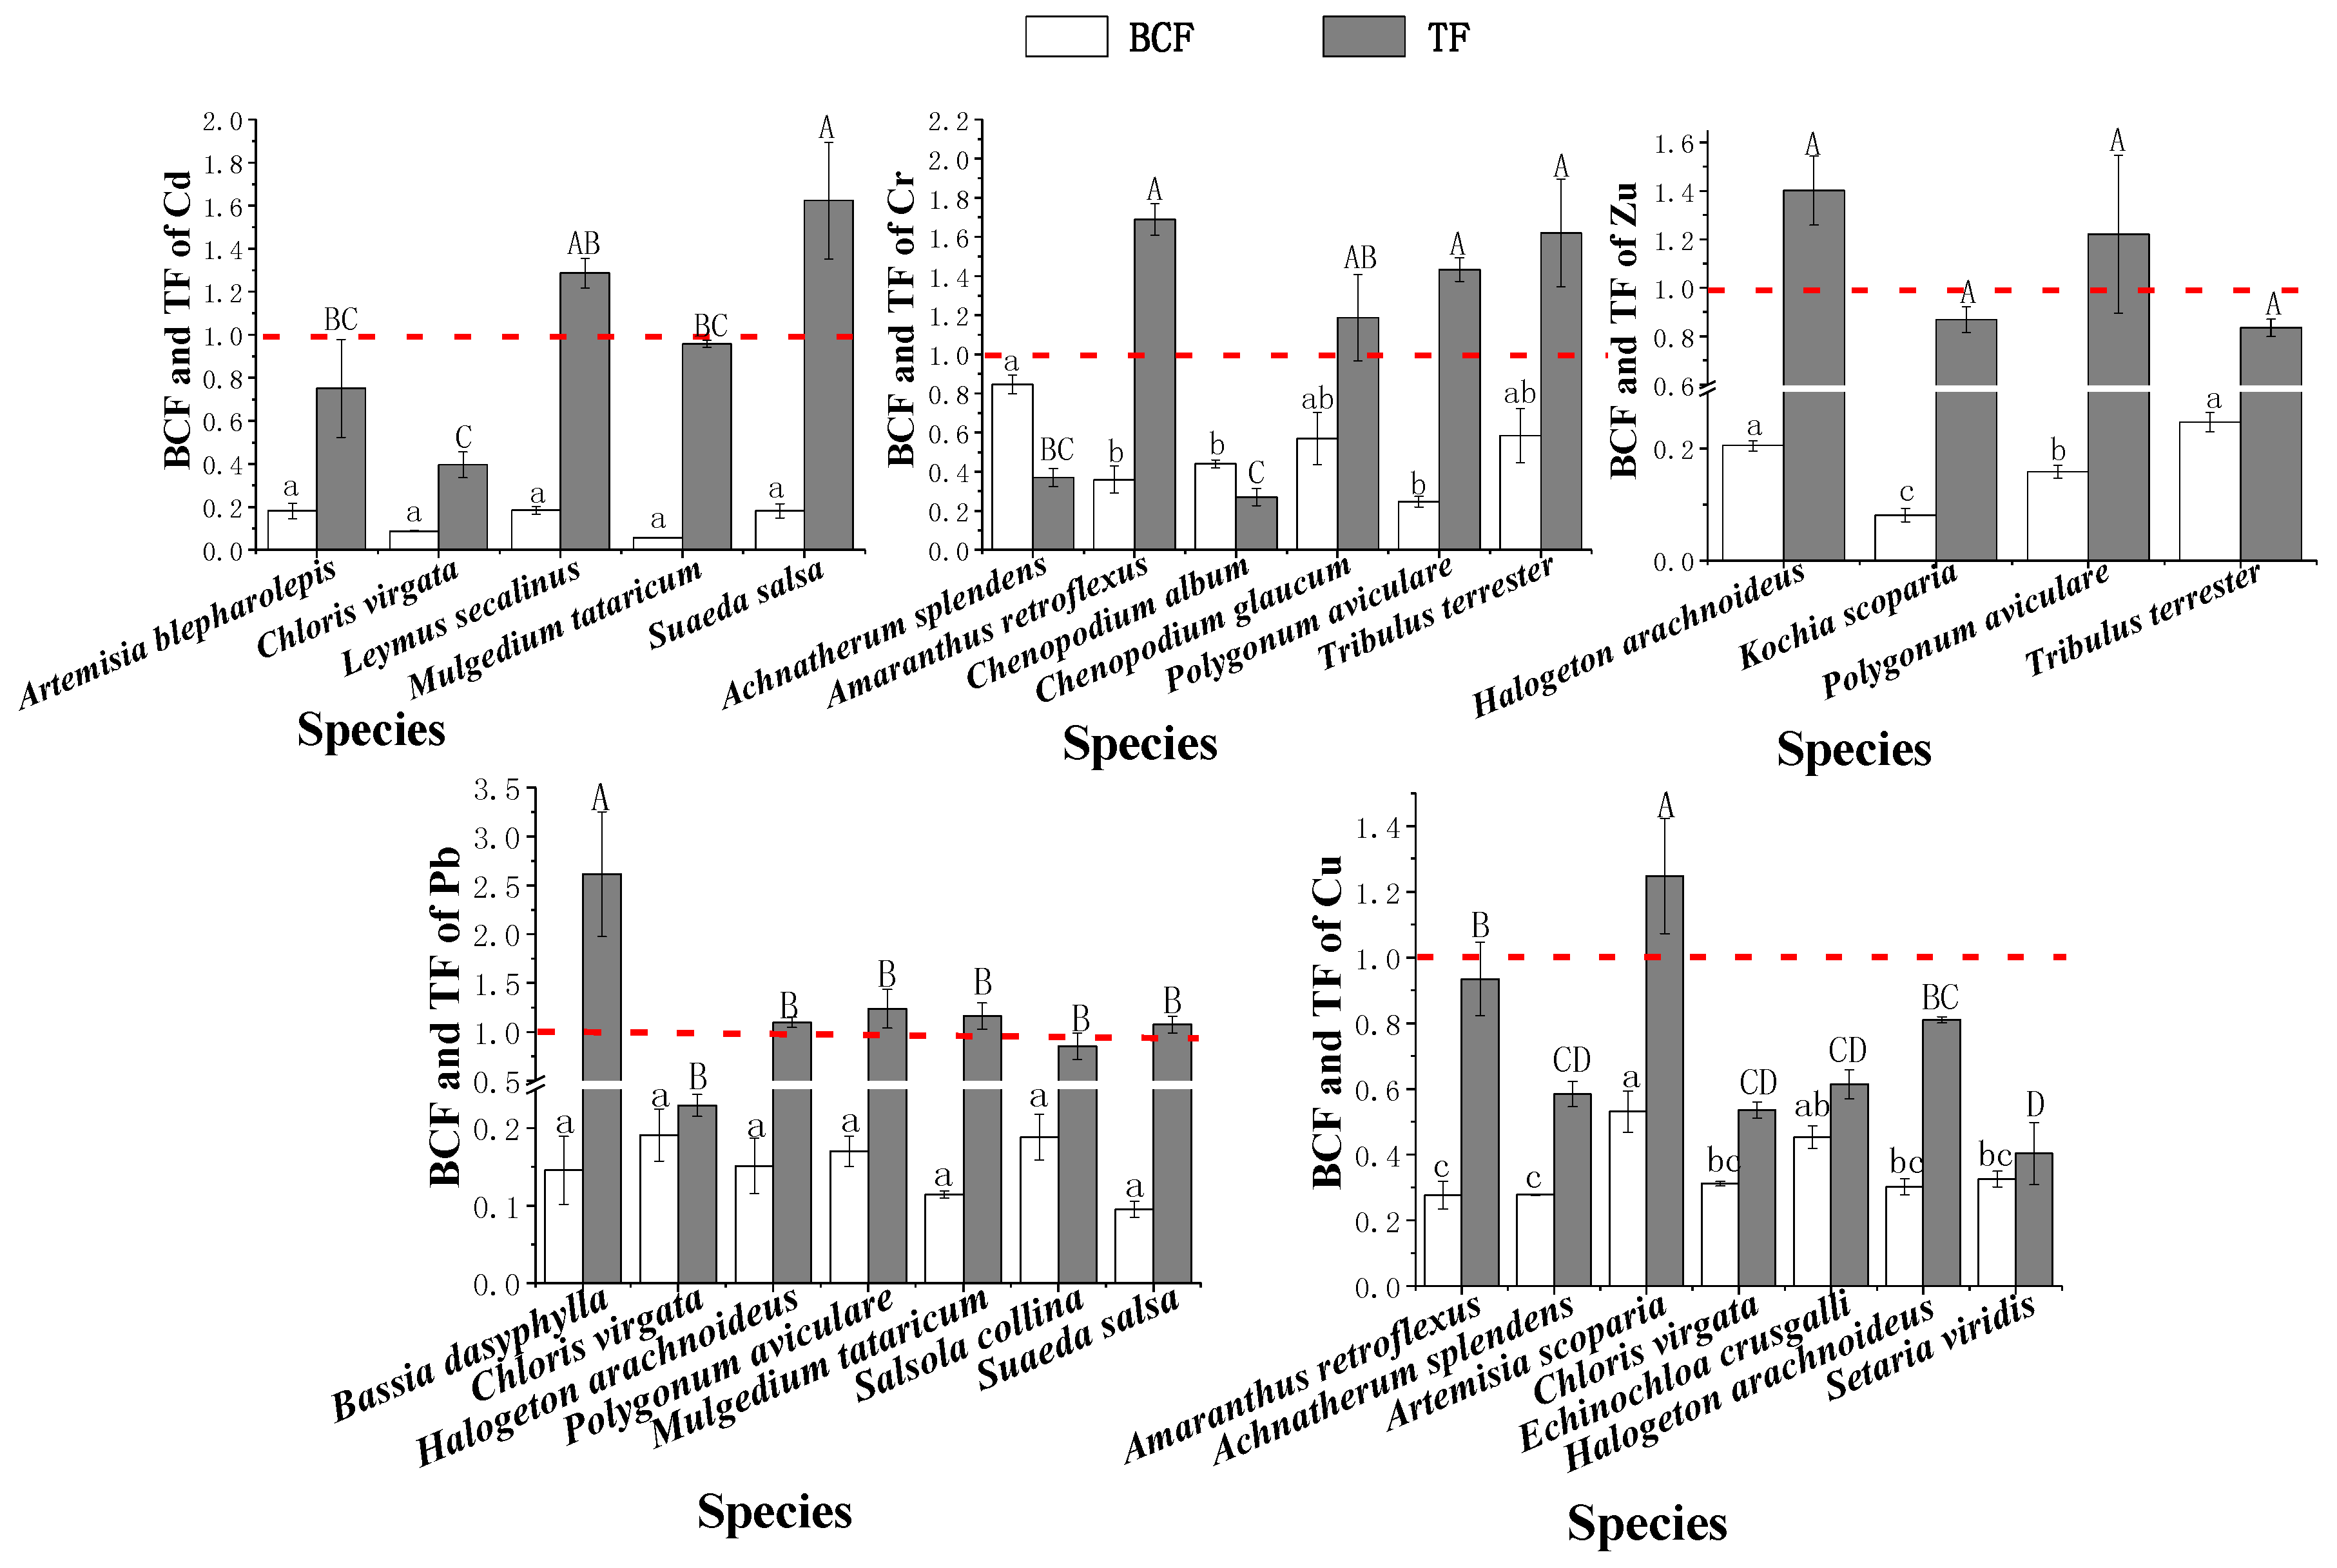
3.5. Bioconcentration and Translocation Factors in Native Plants

The ANOVA results showed that the bioconcentration factor and translocation factor were significantly different in different plants; the Duncan’s test results are shown in Figure 2 by capital and small letters.
The bioconcentration factors of Cd in the order of Leymus secalinus > Suaeda salsa > Artemisia blepharolepis > Chloris virgata > Mulgedium tataricum, and the top three species, were not significantly different at the 0.05 probability level. The translocation factors of Suaeda salsa and Leymus secalinus had the same significance (p < 0.05), but Suaeda salsa was the highest. In the studied plants for Cr, the bioconcentration factors were lower than one. Achnatherum splendens, Tribulus terrester, and Chenopodium glaucum were relatively higher than the other plants, and they were not significantly different at the 0.05 probability level. The translocation factors of Cr were in the order of Amaranthus retroflexus > Tribulus terrester > Polygonum aviculare > Chenopodium glaucum > Achnatherum splendens > Chenopodium album, and the top four species were not significant at the 0.05 probability level. For Pb, the bioconcentration factors of all of the samples were far lower than one, and they were relatively stable, ranging from 0 to 0.1. These values were not significant at the 0.05 probability level. The translocation factor of Bassia dasyphylla was significantly higher than other plants. The bioconcentration factors of Cu were lower than one in the studied species. The values of Artemisia scoparia and Echinochloa crusgalli were relatively higher than other plants, but they were not significant at the 0.05 probability level. The translocation factor of Artemisia scoparia was significantly higher than the other plants. For Zn, the bioconcentration factor of Tribulus terrester was the highest, closely followed by Halogeton arachnoideus, however, they were not significantly different at the 0.05 probability level. The translocation factors for all of the samples of Zn were not significantly different, and the highest was Halogeton arachnoideus.

4. Discussion

Most studies used soil samples to monitor the environmental metal levels [42]. This study found that the mean values of Cd, Cr, As, Pb, Cu, and Zn in soils were 36.91, 1.67, 7.20, 1.38, 1.27, and 6.66 times that of the corresponding background values, respectively. Based on their background values, the overall standard rate of the six heavy metals were higher than 90%, of which Cd, As, and Zn were 100% (Table 3). These results indicate that all of the six heavy metal contents were relatively high in the study area and almost all of the study area was contaminated by exogenous pollutants. The CV values were used for the description of global variability [43]. Large CV values indicate a considerable spatial variation and imply a significant input from external sources [44]. A low CV suggests that the nonpoint input is predominant [45]. The coefficients of variation varied from 12.86% for Cr to 38.03% for Pb, and decreased in the order of Pb > Cd > Zn > As > Cu > Cr (Table 3), which suggested that there was a moderate degree of spatial variability of the six heavy metals, and the anthropogenic factors significantly influenced the distribution of Pb and Cd.
The heavy metal of the soil pollution status was evaluated by a single factor pollution index and the Nemerow synthetic pollution index (Table 4). From the single factor pollution index, the Cd and As were found to be the most serious pollutants in the industrial area, especially Cd, as all of the samples were seriously contaminated. The study area was slightly polluted by Zn. Areas were relatively clean of Cr, Pb, and Cu, and all of the samples were not polluted by Cr, Pb, and Cu. As a result of the complexity of the soil, the Nemerow synthetic pollution index was employed to evaluate the comprehensive impact caused by the six heavy metals in soil, rather than a single factor pollution index, which can only reveal the pollution level of one metal [46]. According to the Nemerow synthetic pollution index, the industrial area was seriously polluted. As for the pollution level in every sampling site, the results showed that almost all of the samples in the industrial area were seriously polluted by anthropogenic sources. According to the Nemerow synthetic pollution index model, the high single factor pollution indices of Cd, As, and Zn are the main reasons for heavy metal pollution in this region.
Evaluating the phytoremediation potential of heavy metals in different plants should be utilized in the remediation of heavy metal contaminated soils. In general, it is regarded as a hyperaccumulator when the heavy metal concentrations, BCF, and TF for plants are up to corresponding standards [47,48,49]. However, these nominal thresholds should not be regarded as the absolute cut-off when the phytoremediation potential is assessed. Plants that grow in the semi-arid and arid regions of northwest China are subjected not only to heavy metal contamination, but also to drought and saline stresses. Thus, many studied heavy metal hyeraccumulators, such as Thlaspi caerulescens, Pteris vittata, Reynoutria sachalinensis, and so on, cannot survive and be used for phytoremediation in this region. Some similar studies for this region were conducted in the laboratory. For example, Ligustrum obtusifolium was found to have a high capacity of Pb accumulation and translocation under drought stress [50], and Buddleja alternifolia had a great potential application in Cd phytoremediation of arid regions [51]. However, these studies were conducted under controlled single heavy metal stresses, which could not reflect the hash and complex situation in situ. Thus, assessing the potential phytoremediators from native plants is necessary. Although the plants in this study are not hyperaccumulators for heavy metals, their phytoremediation potential is still valuable.
As a whole, the bioconcentration factors of five heavy metals in all of the studied species were lower than one, and presented lower levels in the shoot and root than the accumulator, but they had a stronger tolerance under the regional multi-stressful environment. Some plants with a high biomass would share a high resultant capability for phytoremediation. Based on the comprehensive consideration of heavy metal concentrations, BCF, and TF for native plants, we thought Achnatherum splendens for metal Cr presented a phytostabilization potential. It grew very well and was abundant in this study area, and had the highest BCF; what is more, the metal Cr was less distributed in the shoot than in the root. As a result of their higher shoot content and BCF in the metal Cu and Zn than other plants (p < 0.05), and the ability to tolerate the regional multi-stressful environment, Artemisia scoparia and Echinochloa crusgalli for metal Cu and Halogeton arachnoideus for metal Zn could be considered as the most promising species for phytoextraction. Almost all of the selected plants were perennials and had a higher important value, which also contributes to enhanced uptake of metal. Although the TF of some plants in metal Cd and Pb was higher than one, all of the studied species presented a low shoot content and BCF, and had no significant differences. Thus, all of the studied plants were limited as phytoremediators for Cd or Pb contaminated soil. Further research should be done in a wider region.

5. Conclusions

The discharge of heavy metals through various industrial activities is an important cause of soil contamination by heavy metals. As the study area has experienced rapid urbanization and industrialization over the past decades, the problem of heavy metal contamination has also become increasingly prominent. The results suggest that the study area was seriously polluted by Cd and As, slightly polluted by Zn, and was relatively clean for Cr, Pb, and Cu contamination. In addition, almost all of the samples in the study area were seriously polluted. The heavy metal remediation of industrial zones should be an important concern; therefore, strategies should be implemented to ban the discharging or dumping of unqualified industrial waste.
In order to reduce heavy metal risks to the human health of local residents, phytoremediation, a natural, esthetically pleasing, and low-cost technology, has opened a new avenue in the remediation of heavy metal contamination soil. The phytoremediators should adapt to heavy metal contamination, drought, and saline stresses in arid and semi-arid land of northwest China. Our results suggest that because of its low shoot content in metal Cr, BCF was the highest compared with other plants, and its ability to tolerate a regional multi-stressful environment, Achnatherum splendens for metal Cr presented phytostabilization potential. And, because of its higher shoot content and BCF, and its ability to tolerate a regional multi-stressful environment, Artemisia scoparia and Echinochloa crusgalli for metal Cu and Halogeton arachnoideus for metal Zn presented a phytoextraction potential. And, as a result of its low shoot and root content and BCF, all of the studied plants were limited as phytoremediators for Cd or Pb contaminated soil.
More importantly, the phytoremediation areas should be fenced off from wildlife to prevent contamination of the food chain. The phytoremediation areas could be combusted as biofuel feedstock after harvesting, and the ashes could be recovered from the metals or concentrated landfilled. In addition, as important characteristic of phytoremediation, time-consuming should be noticed compared with other remediation techniques. More research is needed to obtain fast-growing hyperaccumulators though genetic techniques.

Author Contributions

C.L. and H.W. conceived and designed the experiments. Y.L. performed the statistical analyses and wrote the manuscript. Y.L., X.N. and Y.Y. collected soil and plant samples. Y.L. and W.M. measured the soil and plant samples. Y.L., H.W. and Y.Y., modified the manuscript. All of the authors read and approved the manuscript.

Funding

This research was funded by the International Cooperation Program of the Ministry of Science and Technology of China (No. 2015DFA90900), the Key Forestry Science and Technology Project of Chongqing Municipality (Chongqing forest research 2015-6), and the Central Fiscal Demonstration Project on Forestry Science and Technology Extension (Chongqing forest extension [2014-10]).

Conflicts of Interest

The authors declare no conflict of interest.

References

  1. Carr, R.; Zhang, C.; Moles, N.; Harder, M. Identification and mapping of heavy metal pollution in soils of a sports ground in Galway City, Ireland, using a portable XRF analyser and GIS. Environ. Geochem. Health 2008, 30, 45–52. [Google Scholar] [CrossRef] [PubMed]
  2. Tang, J.; Chai, L.; Li, H.; Yang, Z.; Yang, W. A 10-year statistical analysis of heavy metals in river and sediment in Hengyang segment, Xiangjiang River basin, China. Sustainability 2018, 10, 1057. [Google Scholar] [CrossRef]
  3. Wang, Y.Q.; Bai, Y.R.; Wang, J.Y. Distribution of urban soil heavy metal and pollution evaluation in different functional zones of Yinchuan city. Environ. Sci. 2016, 37, 710–716. [Google Scholar]
  4. Malayeri, B.E.; Chehregani, A.; Mohsenzadeh, F.; Kazemeini, F.; Asgari, M. Plants growing in a mining area: Screening for metal accumulator plants possibly useful for bioremediation. Toxicol. Environ. Chem. 2013, 95, 434–444. [Google Scholar] [CrossRef]
  5. Li, J.; He, M.; Han, W.; Gu, Y.F. Analysis and assessment on heavy metal sources in the coastal soils developed from alluvial deposits using multivariate statistical methods. J. Hazard. Mater. 2009, 164, 976–981. [Google Scholar] [CrossRef] [PubMed]
  6. Wu, W.; Wu, P.; Yang, F.; Yang, F.; Sun, D.L.; Zhang, D.X.; Zhou, Y.K. Assessment of heavy metal pollution and human health risks in urban soils around an electronics manufacturing facility. Sci. Total Environ. 2018, 630, 53–61. [Google Scholar] [CrossRef] [PubMed]
  7. Xia, F.; Qu, L.; Wang, T.; Luo, L.L.; Chen, H.; Dahlgren, R.A.; Zhang, M.H. Distribution and source analysis of heavy metal pollutants in sediments of a rapid developing urban river system. Chemosphere 2018, 207, 218–228. [Google Scholar] [CrossRef] [PubMed] [Green Version]
  8. Xiao, R.; Wang, S.; Li, R.H.; Wang, J.J.; Zhang, Z.Q. Soil heavy metal contamination and health risks associated with artisanal gold mining in Tongguan, Shaanxi, China. Ecotoxicol. Environ. Saf. 2017, 141, 17–24. [Google Scholar] [CrossRef] [PubMed]
  9. Dong, J.; Yang, Q.W.; Sun, L.N.; Zeng, Q.; Liu, S.J.; Pan, J.; Liu, X.L. Assessing the concentration and potential dietary risk of heavy metals in vegetables at a Pb-Zn mine site, China. Environ. Earth Sci. 2011, 64, 1317–1321. [Google Scholar] [CrossRef]
  10. Yang, Q.W.; Xu, Y.; Liu, S.J.; He, J.F.; Long, F.Y. Concentration and potential health risk of heavy metals in market vegetables in Chongqing, China. Ecotoxicol. Environ. Saf. 2011, 74, 1664–1669. [Google Scholar] [CrossRef] [PubMed]
  11. Xu, L.; Lu, A.X.; Wang, J.H.; Ma, Z.H.; Pan, L.G.; Feng, X.Y. Effect of land use type on metals accumulation and risk assessment in soil in the peri-urban area of Beijing, China. Hum. Ecol. Risk Assess. 2015, 22, 265–278. [Google Scholar] [CrossRef]
  12. Sarkar, B. Heavy Metals in the Environment; CRC Express Inc.: Boca Raton, FL, USA, 1991; pp. 195–196. [Google Scholar]
  13. Adams, S.V.; Quraishi, S.M.; Shafer, M.M.; Passarelli, M.N.; Freney, E.P.; Chlebowski, R.T.; Luo, J. Dietary cadmium exposure and risk of breast, endometrial, and ovarian cancer in the Women’s Health Initiative. Environ. Health Perspect. 2014, 122, 594–600. [Google Scholar]
  14. Liang, L.C.; Liu, W.T.; Sun, Y.B.; Huo, X.H.; Li, S.; Zhou, Q.X. Phytoremediation of heavy metal-contaminated saline soils using halophytes: Current progress and future perspectives. Environ. Rev. 2016, 25, 269–281. [Google Scholar] [CrossRef]
  15. Padmapriya, S.; Murugan, N.; Ragavendran, C.; Thangabalu, R.; Natarajan, D. Phytoremediation potential of some agricultural plants on heavy metal contaminated mine waste soils, Salem District, Tamilnadu. Int. J. Phyth. 2016, 18, 288–294. [Google Scholar] [CrossRef] [PubMed]
  16. Emenike, C.U.; Jayanthi, B.; Agamuthu, P.; Fauziah, S.H. Biotransformation and removal of heavy metals: A review of phytoremediation and microbial remediation assessment on contaminated soil. Environ. Rev. 2018, 26, 156–168. [Google Scholar] [CrossRef]
  17. Basharat, Z.; Novo, L.; Yasmin, A. Genome editing weds CRISPR: What is in it for phytoremediation? Plants 2018, 7, 51. [Google Scholar] [CrossRef]
  18. Cui, S.; Zhou, Q.; Chao, L. Potential hyperaccumulation of Pb, Zn, Cu and Cd in endurant plants distributed in an old smeltery, northeast China. Environ. Geol. 2007, 51, 1043–1048. [Google Scholar] [CrossRef]
  19. Chehregani, A.; Mohsenzade, F.; Vaezi, F. Introducing a new metal accumulator plant and the evaluation of its ability in removing heavy metals. Toxicol. Environ. Chem. 2009, 91, 1105–1114. [Google Scholar] [CrossRef]
  20. Lorestani, B.; Cheraghi, M.; Yousefi, N. Accumulation of Pb, Fe, Mn, Cu and Zn in plants and choice of hyperaccumulator plant in the industrial town of Vian, Iran. Arch. Biol. Sci. 2011, 63, 739–745. [Google Scholar] [CrossRef] [Green Version]
  21. Antosiewicz, D.M.; Escudĕ-Duran, C.; Wierzbowska, E.; Skłodowska, A. Indigenous plant species with the potential for the phytoremediation of arsenic and metals contaminated soil. Water Air Soil Pollut. 2008, 193, 197–210. [Google Scholar] [CrossRef]
  22. Bini, C. From Soil Contamination to Land Restoration; Novaence Pub: New York, NY, USA, 2010. [Google Scholar]
  23. Chen, B.D.; Zhu, Y.G.; Duan, J.; Xiao, X.Y.; Smith, S.E. Effects of the arbuscular mycorrhizal fungus Glomus mosseae on growth and metal uptake by four plant species in copper mine tailings. Environ. Pollut. 2007, 147, 374–380. [Google Scholar] [CrossRef] [PubMed]
  24. Liao, M.; Xie, X.M. Effect of heavy metals on substrate utilization pattern, biomass, and activity of microbial communities in a reclaimed mining wasteland of red soil area. Ecotoxicol. Environ. Saf. 2007, 66, 217–223. [Google Scholar] [CrossRef] [PubMed]
  25. Wilcke, W.; Müller, S.; Kanchanakool, N.; Zech, W. Urban soil contamination in Bangkok: Heavy metal and aluminium partitioning in topsoils. Geoderma 1998, 86, 211–228. [Google Scholar] [CrossRef]
  26. Wang, J.Z.; Peng, S.C.; Chen, T.H.; Zhang, L. Occurrence, source identification and ecological risk evaluation of metal elements in surface sediment: Toward a comprehensive understanding of heavy metal pollution in Chaohu Lake, Eastern China. Environ. Sci. Pollut. Res. 2016, 23, 307–314. [Google Scholar] [CrossRef] [PubMed]
  27. Zhou, Y.; Wei, A.; Li, J.; Yan, L.D.; Li, J. Groundwater quality evaluation and health risk assessment in the Yinchuan Region, northwest China. Expo Health 2016, 8, 1–14. [Google Scholar] [CrossRef]
  28. Rodríguez-Bocanegra, J.; Roca, N.; Febrero, A.; Bort, J. Assessment of heavy metal tolerance in two plant species growing in experimental disturbed polluted urban soil. J. Soils Sedim. 2018, 18, 2305–2317. [Google Scholar] [CrossRef]
  29. Baker, A.J.M.; Brooks, R.R. Terrestrial higher plants which hyperaccumulate metallic elements a review of their distribution. Ecol. Phytochem. 1989, 1, 81–126. [Google Scholar]
  30. Gergel, S.E.; Turner, M.G.; Miller, J.R.; Melack, J.M.; Stanley, E.H. Landscape indicators of human impacts to riverine systems. Aquat. Sci. 2002, 64, 118–128. [Google Scholar] [CrossRef]
  31. Simpson, E.H. Measurement of diversity. Nature 1949, 163, 688. [Google Scholar] [CrossRef]
  32. Gemmell, R.P. Colonization of industrial wasteland. J. Appl. Ecol. 1978, 15, 1201–1213. [Google Scholar]
  33. Wang, T.; Wei, H.; Zhou, C.; Gu, Y.W.; Li, R.; Chen, H.C.; Ma, W.C. Estimating cadmium concentration in the edible part of Capsicum annuum, using hyperspectral models. Environ. Monit. Assess. 2017, 189, 548–561. [Google Scholar] [CrossRef] [PubMed]
  34. State Environmental Protection Administration. State Bureau of Technology Supervision. Environmental Quality Standard for Soils (GBl5618-1995). Available online: http://english.mep.gov.cn/standards_reports/standards/Soil/Quality_Standard3/200710/W020070313485587994018.pdf (accessed on 31 July 2018).
  35. Hakanson, L. An ecological risk index for aquatic pollution control. A sedimentological approach. Water Res. 1980, 14, 975–1001. [Google Scholar] [CrossRef]
  36. Yang, L.Q.; Huang, B.; Hu, W.Y.; Chen, Y.; Mao, M.C.; Yao, L.P. The impact of greenhouse vegetable farming duration and soil types on phytoavailability of heavy metals and their health risk in eastern China. Chemosphere 2013, 103, 121–130. [Google Scholar] [CrossRef] [PubMed]
  37. Swaine, D.J. Why trace elements are important. Fuel Process. Technol. 2000, 65, 21–33. [Google Scholar] [CrossRef]
  38. Ma, L.Q.; Komar, K.M.; Tu, C.; Kennelley, E.D. A fern that hyperaccumulates arsenic. Nature 2001, 411, 579. [Google Scholar] [CrossRef] [PubMed]
  39. Soda, S.; Hamada, T.; Yamaoka, Y.; Ikea, M.; Nakazatob, H.; Saekib, Y.; Kasamatsu, T.; Sakurai, Y. Constructed wetlands for advanced treatment of wastewater with a complex matrix from a metal-processing plant: Bioconcentration and translocation factors of various metals in Acorus gramineus and Cyperus alternifolius. Ecol. Eng. 2012, 39, 63–70. [Google Scholar] [CrossRef]
  40. Rai, U.N.; Upadhyay, A.K.; Singh, N.K.; Dwivedia, S.; Tripathia, R.D. Seasonal applicability of horizontal sub-surface flow constructed wetland for trace elements and nutrient removal from urban wastes to conserve Ganga River water quality at Haridwar, India. Ecol. Eng. 2015, 81, 115–122. [Google Scholar] [CrossRef]
  41. China National Environment Monitoring Station. China Soil Background Valued; China Sciences Press: Beijing, China, 1990; pp. 339–386. (In Chinese) [Google Scholar]
  42. Alam, S.; Ahmad, I.; Din, Z.U.; Bangash, F.K. Variations of contaminants in the road side agricultural soil of Thana Malakand Agency. J. Chem. Soc. Pak. 2008, 30, 800–804. [Google Scholar]
  43. Gallardo, A.; Parama, R. Spatial variability of soil elements in two plant communities of NW Spain. Geoderma 2007, 139, 199–208. [Google Scholar] [CrossRef]
  44. Li, F.; Huang, J.H.; Zeng, G.M.; Yuan, X.Z.; Li, X.D.; Liang, J.; Wang, X.Y.; Tang, X.J.; Bai, B. Spatial risk assessment and sources identification of heavy metals in surface sediments from Dongting Lake, Middle China. J. Geochem. Explor. 2013, 132, 75–83. [Google Scholar] [CrossRef]
  45. Yao, S.C.; Li, S.J. Sedimentary records of eutrophication for the last 100 years in Caohu Lake. Acta Sedimentol. Sin. 2004, 22, 343–347. [Google Scholar]
  46. Cui, X.; Sun, X.L.; Hu, P.J.; Yuan, C.; Luo, Y.M.; Wu, L.H.; Christie, P. Concentrations of heavy metals in suburban horticultural soils and their uptake by Artemisia selengensis. Pedosphere 2015, 25, 878–887. [Google Scholar] [CrossRef]
  47. Ent, A.V.D.; Baker, A.J.M.; Reeves, R.D.; Pollard, A.J.; Schat, H. Hyperaccumulators of metal and metalloid trace elements: Facts and fiction. Plant Soil 2013, 362, 319–334. [Google Scholar]
  48. Dahmani-Muller, H.; Oort, F.V.; Gélie, B.; Balabane, M. Strategies of heavy metal uptake by three plant species growing near a metal smelter. Environ. Pollut. 2000, 109, 231–238. [Google Scholar] [CrossRef]
  49. Yoon, J.; Cao, X.; Zhou, Q.; Ma, L.Q. Accumulation of Pb, Cu, and Zn in native plants growing on a contaminated Florida site. Sci. Total Environ. 2006, 368, 456–464. [Google Scholar] [CrossRef] [PubMed]
  50. Cui, Z.; Li, C.X.; Ni, X.L.; Li, J. Physiological ecological responses of Ulmus pumila “Jinye” and Ligustrum obtusifolium to lead stress. J. Chongqing Norm. Univ. 2018, 35, 127–134. (In Chinese) [Google Scholar]
  51. Yan, J.W.; Li, C.X.; Cui, Z.; Liu, Y. Effects of cadmium on growth, cadmium accumulation, and photosynthetic physiology of Buddleja alternifolia Maxim. seedlings under drought stress. Acta Ecol. Sin. 2017, 37, 7242–7250. (In Chinese) [Google Scholar]
Figure 1. Distribution of the sample locations in the study area. The left panel shows Shizuishan city of Ningxia, China; the top right panel shows sample zone A and B of Huinong district in Shizuishan city: (a) Hebin industrial park, (b) Hongguozi industrial park, and the (c) agricultural product processing industrial park. The last panel shows the sample distribution in zones A and B.
Sustainability 10 02686 g001
Figure 2. Bioconcentration factor (BCF) and translocation factors (TF) of five heavy metals found in different plants. The data were showed for the means ± standard error with one-way analysis of variance. Lowercase letters indicated that the BCF of different species has statistically significant differences at the 0.05 probability level. Uppercase letters indicated that the TF of different species has statistically significant differences at the 0.05 probability level. BCF—bioconcentration factor; TF—translocation factor. The red lines showed the threshold line of BCF and TF.
Sustainability 10 02686 g002
Table 1. The species characteristics of the study areas.
FamilySpeciesImportant ValueClassification
GramineaeAgropyron cristatum0.040Perennial
Achnatherum splendens0.034Perennial
Chloris virgata0.060Annual herb
Echinochloa crusgalli0.110Annual herb
Leymus secalinus0.043Perennial
Phragmites japonica0.101Perennial
Setaria viridis0.071Annual herb
Tragus racemosus0.026Annual herb
ZygophyllaceaePeganum harmala0.090Perennial
Tribulus terrester0.064Annual herb
AsteraceaeArtemisia blepharolepis0.084Perennial
Artemisia scoparia0.087Perennial
Artemisia verbenacea0.097Perennial
Cirsium setosum0.036Perennial
Mulgedium tataricum0.021Perennial
Scorzonera divaricata0.036Perennial
Sonchus oleraceus0.038Annual herb
Xanthium sibiricum0.053Annual herb
ChenopodiaceaeBassia dasyphylla0.053Annual herb
Chenopodium album0.048Annual herb
Chenopodium glaucum0.067Annual herb
Chenopodium serotinum0.052Annual herb
Halogeton arachnoideus0.080Annual herb
Kochia scoparia0.050Annual herb
Salsola collina0.093Annual herb
Salicornia europaea0.028Annual herb
Suaeda glauca0.060Annual herb
Suaeda salsa0.067Annual herb
PolygonaceaePolygonum aviculare0.045Annual herb
AmaranthaceaeAmaranthus retroflexus0.037Annual herb
PortulacaceaePortulaca oleracea0.020Annual herb
ConvolvulaceaeConvolvulus arvensis0.054Perennial
TyphaceaeTypha orientalis0.038Perennial
AsclepiadaceaeCynanchum chinense0.057Perennial
LeguminosaeCaragana stenophylla0.028Shrub
Medicago sativa.0.034Perennial
Lespedeza bicolor0.041Shrub
Glycyrrhiza uralensis0.036Perennial
Table 2. The grade standard for soil heavy metal pollution.
GradeSingle Factor Index (Pi)Pollution GradeNemerow Pollution Index (PN)Pollution Grade
1Pi ≤ 1No pollutionPN ≤ 0.7Clean
21 < Pi ≤ 2Low pollution0.7 < PN ≤ 1Warn limit
32 < Pi ≤ 3Moderate pollution1 < PN ≤ 2Slight pollution
4Pi > 3High pollution2 < PN ≤ 3Moderate pollution
5 PN > 3Heavy pollution
Note: Pi is the single factor pollution index of heavy metal i and PN is the Nemerow synthetic pollution index in every sampling site.
Table 3. Characteristics of soil heavy metals in study areas (n = 45; mg∙kg−1).
ElementsRangeMean ± SECoefficient of Variation (%)Distribution TypeSoil Background Content in NingxiaOver Standard Rate (1) (%)
Cd2.1~8.54.06 ± 0.2033.61normal0.11100.00
Cr59.8~132.3100.27 ± 1.9212.86normal60.0097.78
As60.3~145.191.40 ± 3.0822.62normal12.70100.00
Pb18.2~81.628.50 ± 1.6238.03normal20.6088.89
Cu18.9~42.428.16 ± 0.69516.56normal22.1091.11
Zn222.6~664.2391.37 ± 16.0827.56normal58.80100.00
Note: (1) The standard is soil background values in Ningxia.
Table 4. Single factor index (Pi) and Nemerow pollution index (PN) for heavy metals.
PiPN
CdCrAsPbCuZn
Max14.10.535.80.230.422.2110.47
Min3.50.242.40.050.190.742.67
Mean6.770.403.660.080.281.305.07
Pollution levelHeavy pollutionUnpollutedHeavy pollutionUnpollutedUnpollutedLight pollutionSerious pollution
Note: Pi is the single factor pollution index of heavy metal I and PN is the Nemerow synthetic pollution index in every sampling site.
Table 5. The correlation analysis between metal levels in soil and plants.
Speciesr
CdCrPbCuZn
Artemisia blepharolepis0.821 *−0.562−0.998 *−0.996 *0.421
Amaranthus retroflexus0.0270.727 *−0.832 *0.759 *−0.669
Artemisia scoparia0.2950.181−0.4910.5230.454
Achnatherum splendens−0.6750.573 *−0.825 *0.987 *0.029
Bassia dasyphylla0.324−0.0640.5700.3180.063
Chenopodium album−0.843 *0.960 *0.288−0.739−0.506
Chenopodium glaucum−0.3700.776 *0.129−0.180−0.216
Chloris virgata0.915 *−0.7300.911 *0.991 *−0.736 *
Echinochloa crusgalli−0.642 *−0.2820.3830.823 *0.350
Halogeton arachnoideus0.010−0.4180.938 *0.883 *0.966 *
Kochia scoparia−0.052−0.857 *−0.632−0.2340.680 *
Leymus secalinus0.901 *−0.811−0.762−0.766 *−0.663
Mulgedium tataricum0.984 *−0.840 *0.979 *−0.723−0.251
Polygonum aviculare−0.804 *0.901 *0.998 *0.3290.658 *
Peganum harmala0.173−0.668−0.2460.0720.027
Phragmites japonica0.141−0.118−0.3330.087−0.393
Salsola collina0.2970.4110.884 *0.4660.108
Suaeda glauca0.050−0.691−0.342−0.101−0.578
Suaeda salsa0.5470.2250.559 *−0.250−0.698 *
Setaria viridis−0.839 *−0.818 *−0.945 *0.886 *−0.608
Tribulus terrester0.0070.857 *0.424−0.3290.716 *
Note: r showed that the correlation coefficients between the metal levels in the soils and plants. * showed that the correlation coefficients had statistical significance at the 0.05 probability level (p < 0.05).
Table 6. Heavy metal concentrations in the shoots and roots of different plants.
ElementsSpeciesBiomass(g∙plant1)Heavy Metals Concentration(mg∙kg1)
ShootRoot
CdArtemisia blepharolepis46.100.45 ± 0.09 a0.60 ± 0.20 a
Chloris virgata2.490.19 ± 0.01 a0.50 ± 0.06 a
Leymus secalinus23.750.91 ± 0.12 a0.70 ± 0.06 a
Mulgedium tataricum5.810.29 ± 0.02 a0.30 ± 0.03 a
Suaeda salsa16.480.75 ± 0.29 a0.45 ± 0.07 a
CrAchnatherum splendens38.1055.21 ± 3.85 a152.35 ± 8.60 b
Amaranthus retroflexus10.8034.70 ± 7.14 a21.24 ± 4.33 a
Chenopodium album14.3022.41 ± 2.20 a69.28 ± 10.20 a
Chenopodium glaucum11.2860.74 ± 22.09 a59.46 ± 15.65 a
Polygonum aviculare13.7363.37 ± 46.86 a44.92 ± 23.47 a
Tribulus terrester6.8562.27 ± 18.26 a66.26 ± 31.13 a
PbBassia dasyphylla7.405.93 ± 1.47 a2.30 ± 0.49 a
Chloris virgata2.492.46 ± 0.14 a10.78 ± 0.08 c
Halogeton arachnoideus16.805.86 ± 0.59 a5.32 ± 0.27 b
Mulgedium tataricum5.813.43 ± 0.32 a2.98 ± 0.07 ab
Polygonum aviculare13.734.68 ± 0.34 a3.93 ± 0.57 ab
Salsola collina16.204.86 ± 0.78 a5.98 ± 0.91 b
Suaeda salsa16.482.56 ± 0.34 a2.37 ± 0.26 ab
CuAchnatherum splendens38.105.72 ± 0.25 a9.82 ± 0.22 a
Amaranthus retroflexus10.808.31 ± 1.18 ab10.01 ± 3.14 a
Artemisia scoparia16.8014.00 ± 3.27 c11.27 ± 0.70 a
Chloris virgata2.495.78 ± 0.59 a10.70 ± 0.61 a
Echinochloa crusgalli16.0712.44 ± 0.80 bc20.55 ± 3.55 a
Halogeton arachnoideus16.806.87 ± 0.76 ab8.47 ± 0.88 a
Setaria viridis25.896.38 ± 1.73 ab15.67 ± 1.17 a
ZnHalogeton arachnoideus16.8091.53 ± 26.59 b64.03 ± 17.51 a
Kochia scoparia13.6020.46 ± 0.93 a23.23 ± 3.31 a
Polygonum aviculare13.7372.16 ± 3.20 ab60.02 ± 14.25 a
Tribulus terrester6.8593.02 ± 8.90 b110.71 ± 6.91 b
Note: data of the heavy metal concentration were showed for the means ± standard error with one-way analysis of variance. Lowercase letters indicated heavy metal concentrations with significant differences at the 0.05 probability level.

