Article

Where Do Our Resources Go? Indium, Neodymium, and Gold Flows Connected to the Use of Electronic Equipment in Switzerland

1
Empa, Swiss Federal Laboratories for Materials Science and Technology, Technology and Society Laboratory, Lerchenfeldstrasse 5, CH-9014 St. Gallen, Switzerland
2
Department of Informatics, University of Zürich, Binzmühlestrasse 14, CH-8050 Zürich, Switzerland
3
World Resources Forum (WRF), Lerchenfeldstrasse 5, CH-9014 St. Gallen, Switzerland
4
Clausthal University of Technology, Chair of Environmental and Energy Engineering, Leibnizstraße 28, D-38678 Clausthal-Zellerfeld, Germany
*
Author to whom correspondence should be addressed.
Sustainability 2018, 10(8), 2658; https://doi.org/10.3390/su10082658
Submission received: 16 May 2018 / Revised: 23 July 2018 / Accepted: 25 July 2018 / Published: 28 July 2018
(This article belongs to the Special Issue Information and Communications Technologies (ICT) for Sustainability)

Abstract

:
The increased use of digital information and communications technologies (ICT) is giving rise to fast-growing waste streams that contain important material resources. In contrast to bulk materials and precious metals, the recovery of most critical metals has not yet been commercially established, and they are thus lost within the recycling process. In this article, we used dynamic material flow analysis to explore the stocks and flows of indium, neodymium, and gold incorporated in end-user devices in Switzerland. Our analysis covered the use, collection, recycling, and disposal phases. This enabled us to track the three metals from their entry into Switzerland as components of new devices until their recovery, disposal in landfills, or dissipation to the environment. Using statistical entropy analysis (SEA), we further analyzed the dilution or concentration of the metals during their route through the current system. The data uncertainty was addressed employing a probabilistic approach. The largest quantities of all three metals are found in the devices currently in use. The second-largest stocks are slags disposed in landfills for indium, slags used for construction for neodymium, and the output of metal recovery processes for gold. The SEA illustrates how the current collection and recycling system successfully concentrates all three metals. While 70% of gold leaving the use phase is recovered, indium and neodymium are dissipated to slags after smelting and incineration processes due to the lack of economic incentives and lacking recovery processes on a commercial scale.

1. Introduction

Digital information and communications technologies and consumer electronics (in the following referred to as “electronic equipment (EE)”) play an increasingly important role in our everyday life and change the preconditions and opportunities for sustainability [1,2]. Opportunities include for example reducing the transport of goods and people by virtual counterparts or the smarter use of energy [3]. However, the resulting waste electrical and electronic equipment (WEEE or e-waste) creates a fast growing waste stream that contains important material resources, not only bulk materials such as iron, aluminum, copper, and plastics, but also precious metals and critical raw materials [4]. Pursuant to a definition of the Ad-Hoc Working Group on Defining Critical Raw Materials of the European Commission (EC) [5,6], a material is termed “critical” when the risks of a supply shortage and its impacts on the economy are higher compared to most other raw materials. Critical raw materials found in EE can be all classified as metals [4,7] and are thus further referred to as “critical metals.”
Swico Recycling, a take-back and recycling scheme for EE was established in Switzerland more than 20 years ago. The system ensures the recovery of bulk materials and precious metals as well as the environmentally sound disposal of pollutants [8]. Many critical metals, such as indium, gallium, tantalum, or the rare earth elements (REE), are not recycled, for example, because of low contents of these materials within EE, low market prices that do not cover recycling costs, lack of recycling technologies at the commercial scale, and metallurgical limits to recovery processes. Furthermore, knowledge about overall stocks, flows, and disposal pathways of critical metals incorporated in EE is limited [9,10,11,12,13,14].
Stocks and flows of EE and the critical metals they contain are often modeled quantitatively by combining sales or stock data with estimated product lifetimes, using a dynamic material flow analysis (MFA) approach [15]. Dynamic MFAs discussed in the literature refer mostly to the global scale, focusing on the production and use process. If included, waste management processes are mostly modeled as simple processes with critical metals being lost to unspecified sinks (e.g., [16,17,18,19,20,21,22,23,24]). Many critical metals are recovered at rates below 1%, and they are either dissipated to recovered base metals or to slags that are disposed of in landfills or used for construction [10]. Dissipation of metals to the environment has been addressed from a resource point of view only in recent years, and indicators as well as data are still scarce [18,23,24,25]. To our knowledge, the high data uncertainty in dynamic MFAs of critical metals is taken into account only in a few recent studies using scenario analysis (e.g., [16,17,22,23]).
In Thiébaud et al. [15], we presented a dynamic MFA of nine different types of EE in Switzerland, identifying past and current in-use and storage stocks of EE as well as the flows between the use, storage, and disposal phases. In the present article, we derive the flows of critical metals incorporated in EE from these results. The detailed model of the use phase is extended to include the collection, recycling, and disposal phases. This allows us to track and quantify the pathways and losses of critical metals in the collection, recycling, and disposal phases over time, starting when the device types studied were first introduced to the market. We identify the most important sinks and compare them to current in-use and storage stocks in order to estimate losses through dissipation. With statistical entropy analysis (SEA), as proposed by Rechberger and Graedel [26], we introduce a complementary approach to quantify and illustrate the concentration, dilution, or dissipation, respectively, of each metal on its route through the current system. On this basis, we are able to detect the processes responsible for metal losses. The data uncertainty in our model is systematically dealt with by adopting the probabilistic dynamic MFA approach as proposed by Bornhöft et al. [27]. To implement the model, we extend the pymfa software tool presented in Thiébaud et al. [15] to include the functionality of dynamic SEA.
The goal of our research is to better understand the metabolism of the anthroposphere regarding critical metals connected to the use of EE. The information gained enables the identification of current or future problems regarding resource dissipation. On this basis, recycling system managers, recyclers, downstream processors, or policy makers can find starting points for improving the current recycling system and reducing negative environmental impacts of EE. The model and evaluation methods provide a basis for developing appropriate tools and alternatives to create more efficient recycling systems and thus increase the sustainability of life cycles of EE.
This case study of critical metals incorporated in Swiss EE is illustrated using the examples of indium and neodymium. We classified indium and neodymium as highly relevant based on a systematic multi-stage selection and evaluation process [28]. The selection criteria took into account criticality, relevance regarding the application in EE, recycling potential, and additional prioritization criteria such as ecological relevance, absolute quantities in the e-waste stream, and availability of pilot recovery processes. The most important application of indium in electronic devices is the use of indium tin oxide (ITO) as a transparent conducting layer in liquid crystal displays (LCDs) [29]. Neodymium is an REE that has been used in neodymium iron boron (NdFeB) permanent magnets since the 1990s, between 8% and 35% of which are applied in hard disk drives (HDDs), optical drives and loudspeakers in computers, and vibration alarms and loudspeakers in mobile phones as well as headphones [17,30]. Neodymium is also found in small quantities in printed wiring boards (PWBs) [31,32,33]. The main share of both metals is thus present in certain locatable components within EE, and recovery from the components in multilevel physical-chemical and metallurgical processes is technically feasible [30]. In addition to neodymium and indium, we examined gold. The recycling of gold, mainly found in PWBs, is already well established and is an important economic driver in the recycling system [14,34]. In our MFA, gold stocks and flows served as reference values to put the stocks and flows of indium and neodymium into the context of today’s recycling system. As desktop and laptop computers have undergone a technology change from HDDs containing NdFeB magnets to neodymium-free solid-state drives (SSDs), the analysis of past and current stocks and flows with their related sinks was complemented with an analysis of the future quantities of NdFeB magnets, estimating the time NdFeB magnets from HDDs will still be found in the waste stream.

2. Materials and Methods

This chapter is structured based on the standardized description ODD (overview, design concepts, details) protocol that was originally developed for the documentation of individual-based and agent-based models [35,36], but has proven to be useful for structuring MFA models as well [37]. Details on data collection, data evaluation, and methods are provided in the Supplementary Materials of this article.

2.1. Overview

The model presented in this article is built upon the dynamic MFA model developed in Thiébaud et al. [15]. The purpose is to quantify the stocks and flows of indium, neodymium, and gold incorporated in nine electronic device types in the use phase and in waste management processes in Switzerland. These device types cover around 90% of the stocks of these three metals in Swiss private households and account for over 70% of the total annual consumption of indium and neodymium in Switzerland [30]. The device types included are conventional mobile phones (referred to as “mobile phones” in this article), smartphones, desktop and laptop computers, monitors, cathode ray tube televisions (CRT TVs), flat panel display televisions (FPD TVs), digital video disk (DVD) players and headphones (for details, see [15]).The purpose of the dynamic MFA is to provide insights regarding the past, current, and future losses and sinks of critical metals and precious metals in the collection, recycling, and disposal phases.
The system under study includes the use phase as well as the collection, recycling, and disposal phases. The inner system boundary corresponds to the Swiss border, with exports to downstream processes in other, mostly European, countries. For the use phase, we adopted the cascade model presented in Thiébaud et al. [15]. The collection, recycling, and disposal phases are divided into at most 16 processes, depending on the metal in question, including all steps from collection to material recovery or slag disposal. In addition to the in-use and storage stocks, seven processes can potentially build up a stock. The system has one inflow, corresponding to the flow of metals incorporated in devices imported to and sold in Switzerland. Instead of outflows, we included various sinks within the system to show the final destination of critical metals and precious metals. Flows to and sinks within downstream processes in other countries include only metals originating from EE used in Switzerland (Figure 1). The period under study depends on the device type and starts—in accordance with Thiébaud et al. [15]—at the time when a device type was first introduced to the market up to the year 2014. In addition, for devices containing neodymium magnets, we included a prospective analysis up to the year 2050. The temporal scale is one year.

2.2. Design Concepts

2.2.1. Basic Principles and Modeling Approach

The model employs a retrospective and prospective input-driven approach, deriving the stock S[n] in kilograms (kg) at a time n (n = 1, … , N) from the net flow by using the balance of masses Equation (1), with the constant sampling rate T = 1 year [37].
S [ n ] = ( i n f l o w [ n ] o u t f l o w [ n ] ) · T + S [ n 1 ]
The outflows [n] in kg (n = 1,…,N) of the in-use stock and the storage stock are calculated based on the inflows [n] in kg (n = 1, … , N) and different lifetime distribution functions f[m] for the service lifetimes and storage times of new and used devices, according to Equation (2) [37]. The lifetime distributions f[m] are adopted from Thiébaud et al. [15].
o u t f l o w [ n ] = m = 0 n i n f l o w [ n m ] · f [ m ]
To compute the resulting indium, neodymium, and gold stocks and flows, the inflows of devices, taken from Thiébaud et al. [15], were multiplied with the respective amounts of indium, neodymium, and gold per device. If applicable, changes in the amounts of the materials in the devices over time were taken into account. More details are provided in Section 2.3.2. and Section S4 in the Supplementary Materials.
Desktop and laptop computers have undergone a technology change from HDDs containing neodymium to neodymium-free solid-state drives (SSDs). This has decreased neodymium inflows. These were computed by assuming a logistic diffusion model for the SSD technology and adding up a model for computers with HDDs and one for computers with SSDs (see Section S4.3 in the Supplementary Materials). Long total lifetimes due to storage and reuse will, however, delay the decrease of the amount of neodymium in the outflows of the use phase. In order to estimate the future quantities of neodymium magnets in the recycling system, we used logistic functions to extrapolate the inflow, that is, sales data of desktop and laptop computers, headphones, DVD-players, as well as mobile phones and smartphones up to the year 2050, based on current sales and stock data (see Section S5 in the Supplementary Materials).

2.2.2. Dissipation

Dissipative flows of indium, neodymium, and gold were considered in the collection, recycling, and disposal phases as specific flows to landfills or the environment, depending on process inflows and transfer coefficients (see Section S6 in the Supplementary Materials). A transfer coefficient refers to the relative share of a specific flow in relation to the total outflow from a specific process. Transfer coefficients are expressed as numbers between zero and one.

2.2.3. Uncertainty

To account for data uncertainty, sales data of EE, metal contents, and transfer coefficients were modeled as probability distributions. Based on the data characteristics, we chose either normal or triangular distributions (see Section 2.3.2, Section S4 and S5 in the Supplementary Materials and Reference [15] for details). The dependent variables were calculated by means of Monte Carlo simulation and were therefore again provided as probability distributions [27,38].

2.3. Details

2.3.1. Initial Condition

The sales data of EE on which the inflows of metals are based go back to the year when a device type was first introduced to the market [15]. Thus, the simulation starts from a stock = 0.

2.3.2. Model Input Data

The indium, neodymium, and gold content per device type were taken from literature [4,14,21,30,31,32,33,34,39,40,41,42,43,44,45,46,47]. As the data quality of these sources varies widely, we introduced data quality indicators similar to the pedigree matrix proposed by Weidema and Wesnæs [48] regarding the sample size, measurement or modeling approach, and the analysis method (Tables S1, S2, and S3 in the Supplementary Materials). For metal contents with more than one observation from different literature sources, the sum of the three indicators for each observation was translated to a weighting factor, and a weighted mean was calculated (Table S4 in the Supplementary Materials). We then introduced a triangular distribution for the metal content of each device type, including the weighted mean and the lowest and highest observations. The lowest and highest observations were extended by taking into account the standard deviation (SD) of the SD, as referred to in JCGM [49], so that the lower and upper limits of the triangular distribution should lie within the 95% confidence interval of the metal content (see Section S4.2 in the Supplementary Materials). According to Bangs et al. [40], the gold content in ICT hardware has declined by about 40% in the past 12 years. This temporal change is accounted for in the triangular distributions of the gold content in desktop and laptop computers as well as in mobile phones and smartphones (see Section S4.2 in the Supplementary Materials). As stated above, the decreasing neodymium content in desktop and laptop computers was computed by adding up a model for computers with HDDs and one for computers with SSDs (see Section S4.3 in the Supplementary Materials). In addition to magnets, neodymium is also found in PWBs, although its exact source is unknown [31,32,33]. For other device types and metals, no information on the change of the metal content over time was available.
Inflow data of EE, lifetime distribution functions for the service lifetime and the storage time, as well as the transfer coefficients for the flows within and out of the cascade model are adopted from Thiébaud et al. [15] and Thiébaud (Müller) et al. [50]. The uncertainties of inflow data are modeled as normal distributions, the transfer coefficients as triangular distributions. Only the lifetime distribution parameters are not modeled probabilistically [15]. For the prospective MFA of neodymium in magnets, the sales data of desktop computers, headphones, mobile phones, smartphones, and DVD players were extrapolated with logistic functions up to the year 2050, based on current sales and stock data (see Section S5 in the Supplementary Materials). For laptop computers, we assumed future sales in a steady state at the level of 2014. All lifetime distribution functions and transfer coefficients were assumed to remain constant at the level of 2014. All sales flows were modeled with uncertainty increasing from 2014–2050, as sales predictions over two to three decades depend on changing technological, economic, and social factors and are thus very uncertain. As we intended to cover the period in which magnets from HDDs will remain in the waste stream, the extension of the time horizon to 2050 was necessary to cover the delay in the use phase.
To model the collection, recycling, and disposal phases, we needed data regarding transfer coefficients to refurbishment, preprocessing, downstream processes, and disposal. CRT TVs, desktop computers, headphones, and mobile phones already had significant outflows before the Swiss recycling system for EE was established in 1994. We assume that before 1994, indium, neodymium, and gold incorporated in EE ended up in Swiss landfills directly or via municipal solid waste incineration. Data on transfer coefficients for mobile phones and smartphones were collected in interviews with two major Swiss telecommunication providers and a large Swiss EE retailer [51,52,53]. We further conducted interviews with four major Swiss e-waste recyclers, who together treat over 85% of Swiss e-waste, to assess transfer coefficients to manual and mechanical preprocessing as well as to downstream processes according to Figure 1 [54,55,56,57] (see Section S6 in the Supplementary Materials). Measurements of indium, neodymium, and precious metals in output fractions were possible in just one recycling plant [31]. For the other recyclers, data on the pathways of indium, neodymium, and gold in their recycling process were partly based on estimates. The uncertainties of transfer coefficients in the collection, recycling, and disposal phases were modeled as triangular distributions based on the information provided by the interviewees.

2.3.3. Model Output Data and Evaluation

Model output data comprise stochastic time series of the stocks and flows depicted in Figure 1, depending on the metal in question. The probability distributions of the time series were visualized by the 10th percentile, the mean, and the 90th percentile. The median is very close to the mean, which is why we decided to display the mean in addition to the percentiles.
To illustrate further the dilution or concentration of metals during their route through the system and changes over time, we evaluated the model output data with SEA. The advantage of SEA, compared to other evaluation methods such as entropy production or exergy analysis [58], is its direct applicability to an MFA database without further data compilation [59]. SEA is able to visualize the metabolism of anthropogenic systems in a straightforward way using relative statistical entropy (RSE) [26]. The RSE is the ratio between the statistical entropy H of each stage and the maximum statistical entropy Hmax, calculated from the content of each of the three metals in the Earth’s crust. An RSE of one indicates a dilution similar to the average content of Earth’s crust, that is, a point at which enhanced metal resources no longer exist [26]. An RSE of zero indicates a concentration of the substance with 100% purity. As this method requires information not only on metal contents for each flow shown in Figure 1, but also material flows (e.g., flows of devices, metals, plastics, or PWBs containing indium, neodymium, or gold), we extended the model described in Thiébaud et al. [15] with a simple MFA of the collection, recycling, and disposal phases for each device type, based on batch tests run by Swico Recycling [60]. For more details on the SEA, see Section S7 in the Supplementary Materials.

2.3.4. Detailed Model Description

The conceptual model as described in Figure 1 was implemented using our own MFA simulation tool called pymfa. The tool is written in Python 3, using the numpy, scipy, and matplotlib libraries [15]. The model was simulated for each device type and metal, producing results in kg metal per product up to the year 2014. For device types containing neodymium, we simulated future flows up to the year 2050. Each simulation run was repeated 10,000 times.
As the SEA is connected to the MFA system, we extended the pymfa tool with a functionality to calculate the RSE overall system stages and years. See Section S8 in the Supplementary Materials for more details. The SEA was calculated deterministically for each metal from 1990 to 2014, based on the mean metal and material flows.

3. Results and Discussion

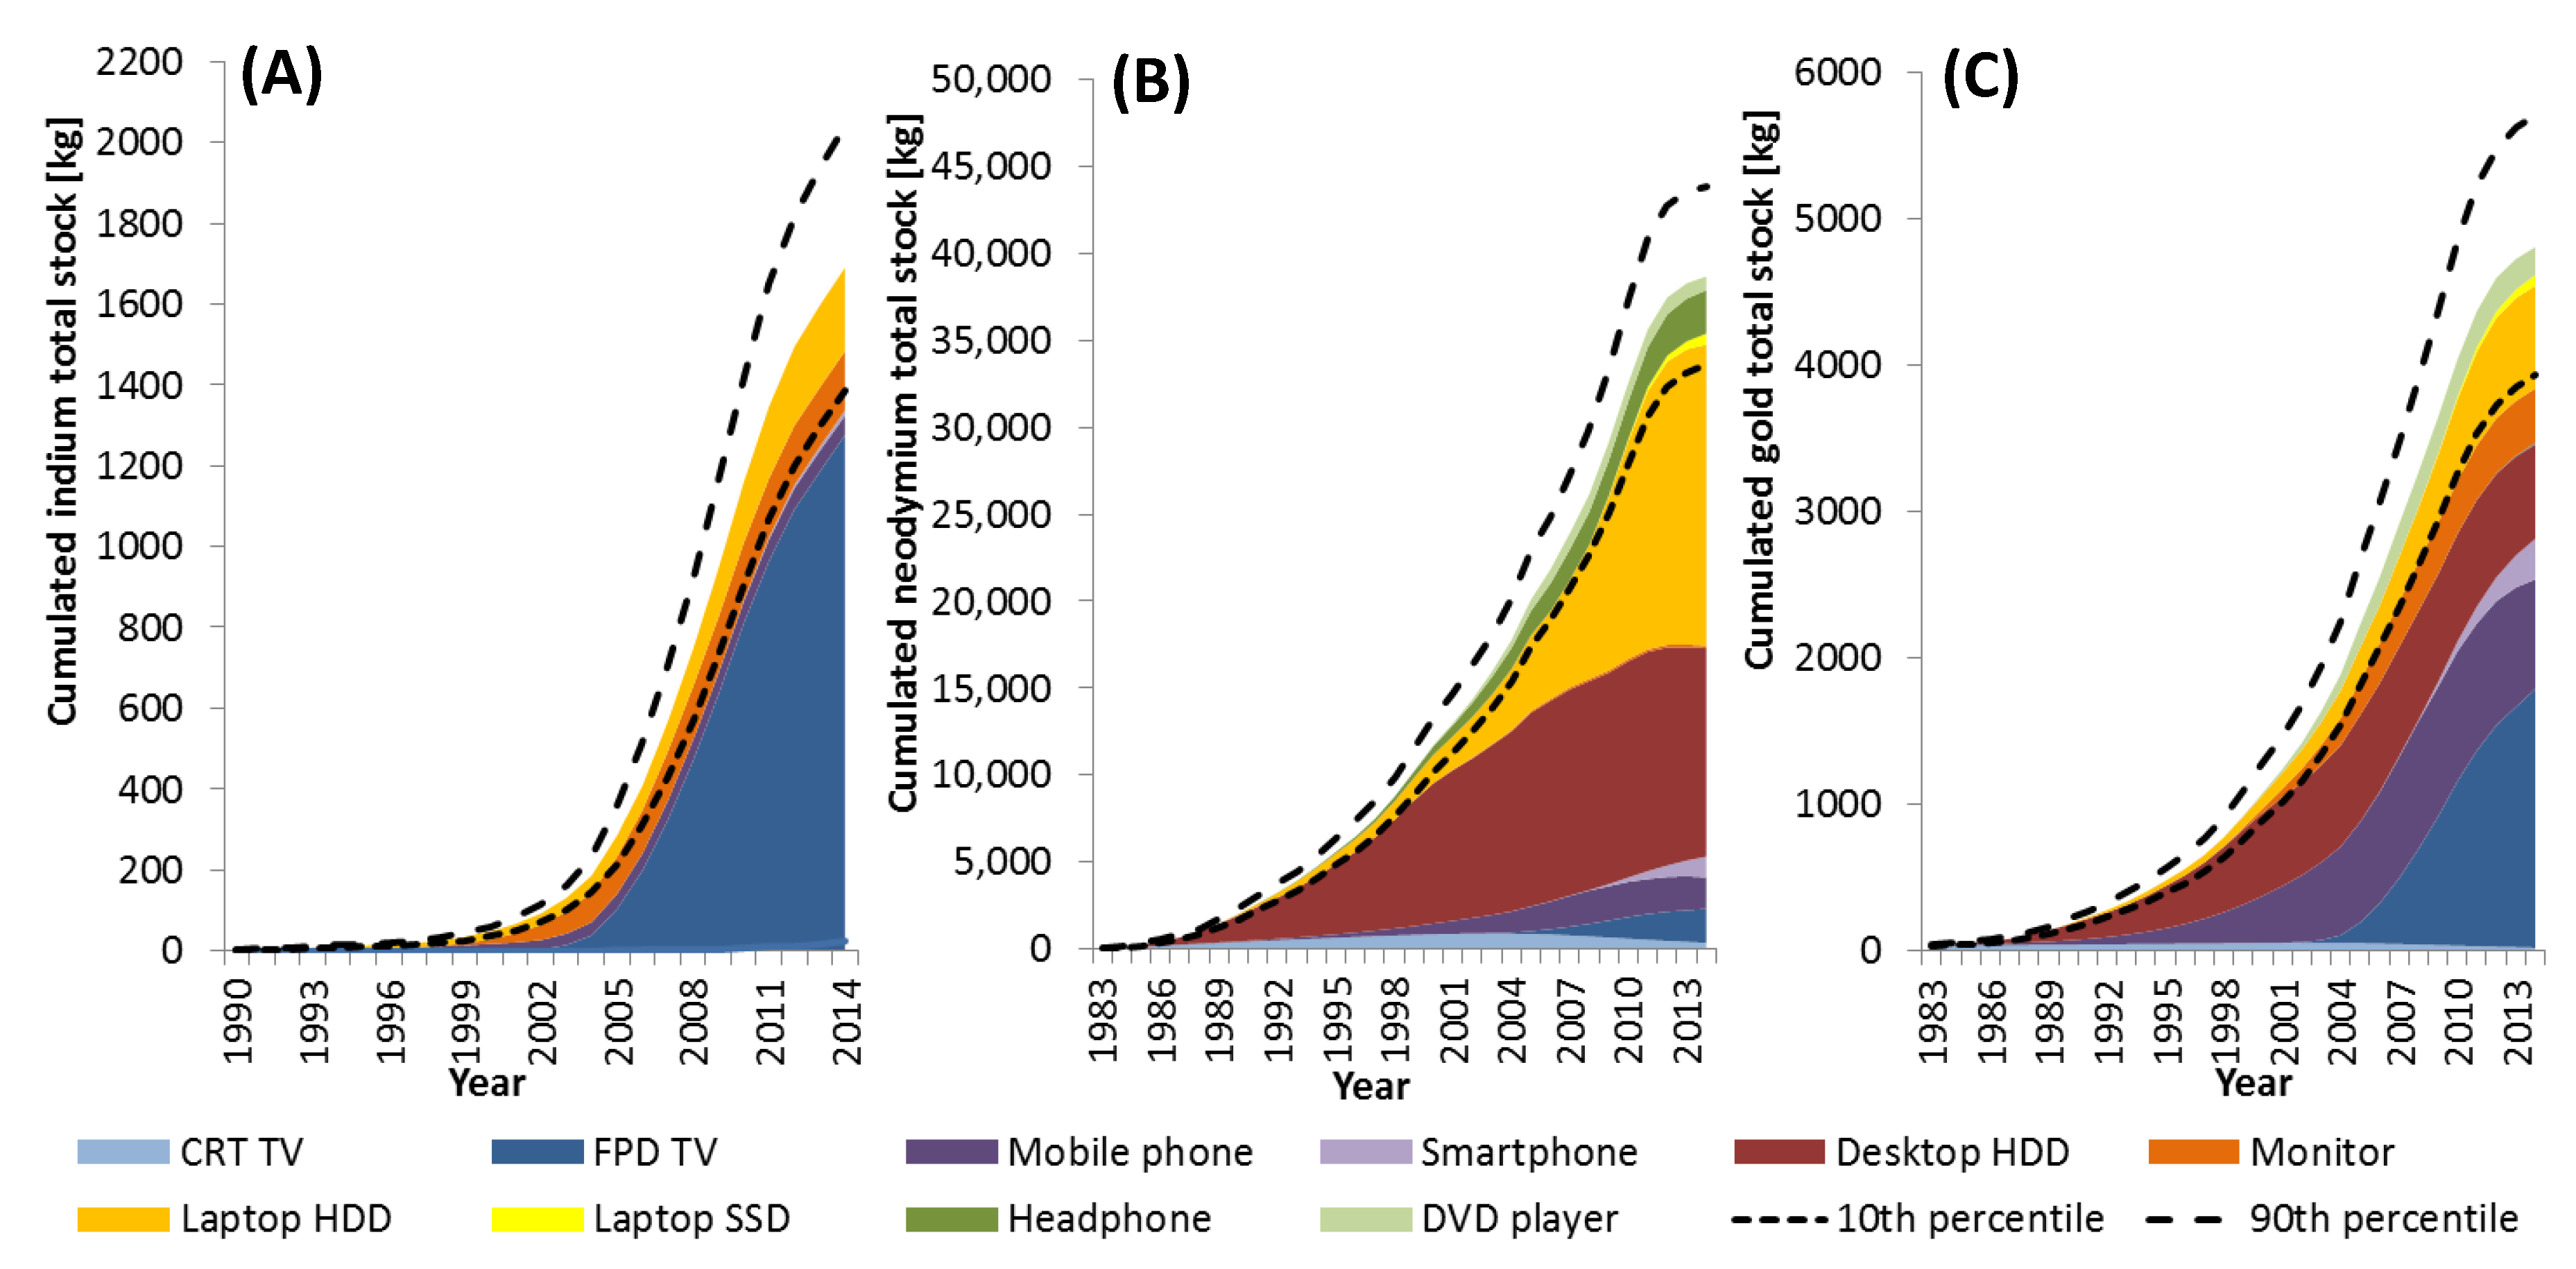
3.1. Development of Stocks

The results of the dynamic MFA include the development of stocks and flows of indium, neodymium, and gold, and their distribution among device types over the period under study. As the knowledge of in-use stocks is crucial for understanding flows to the waste management processes, we present the development of the total stocks of the three metals over time and their distribution among device types in Figure 2. Indium is primarily stocked in FPD TVs. Neodymium is mainly stocked in desktops and laptops. With the exception of headphones, all device types include PWBs with some gold content. The growth rate of the indium stock is slowly decreasing, highly depending on FPD TVs sales, and amounted to 6% in 2014. The neodymium stock grew at a 1% rate in 2014 and is expected to peak in the near future due to the technology change from HDDs to SSDs. The growth rate of the gold stock was only 2% in 2014 and will further decline due to the decreasing gold content in EE introduced to the market and the market saturation of most device types. The nine device types represent the following total stocks in the use phase in Switzerland in 2014: indium 1.7 metric tons ±19%, neodymium 39 metric tons ±13%, gold 4.8 metric tons ±20%.

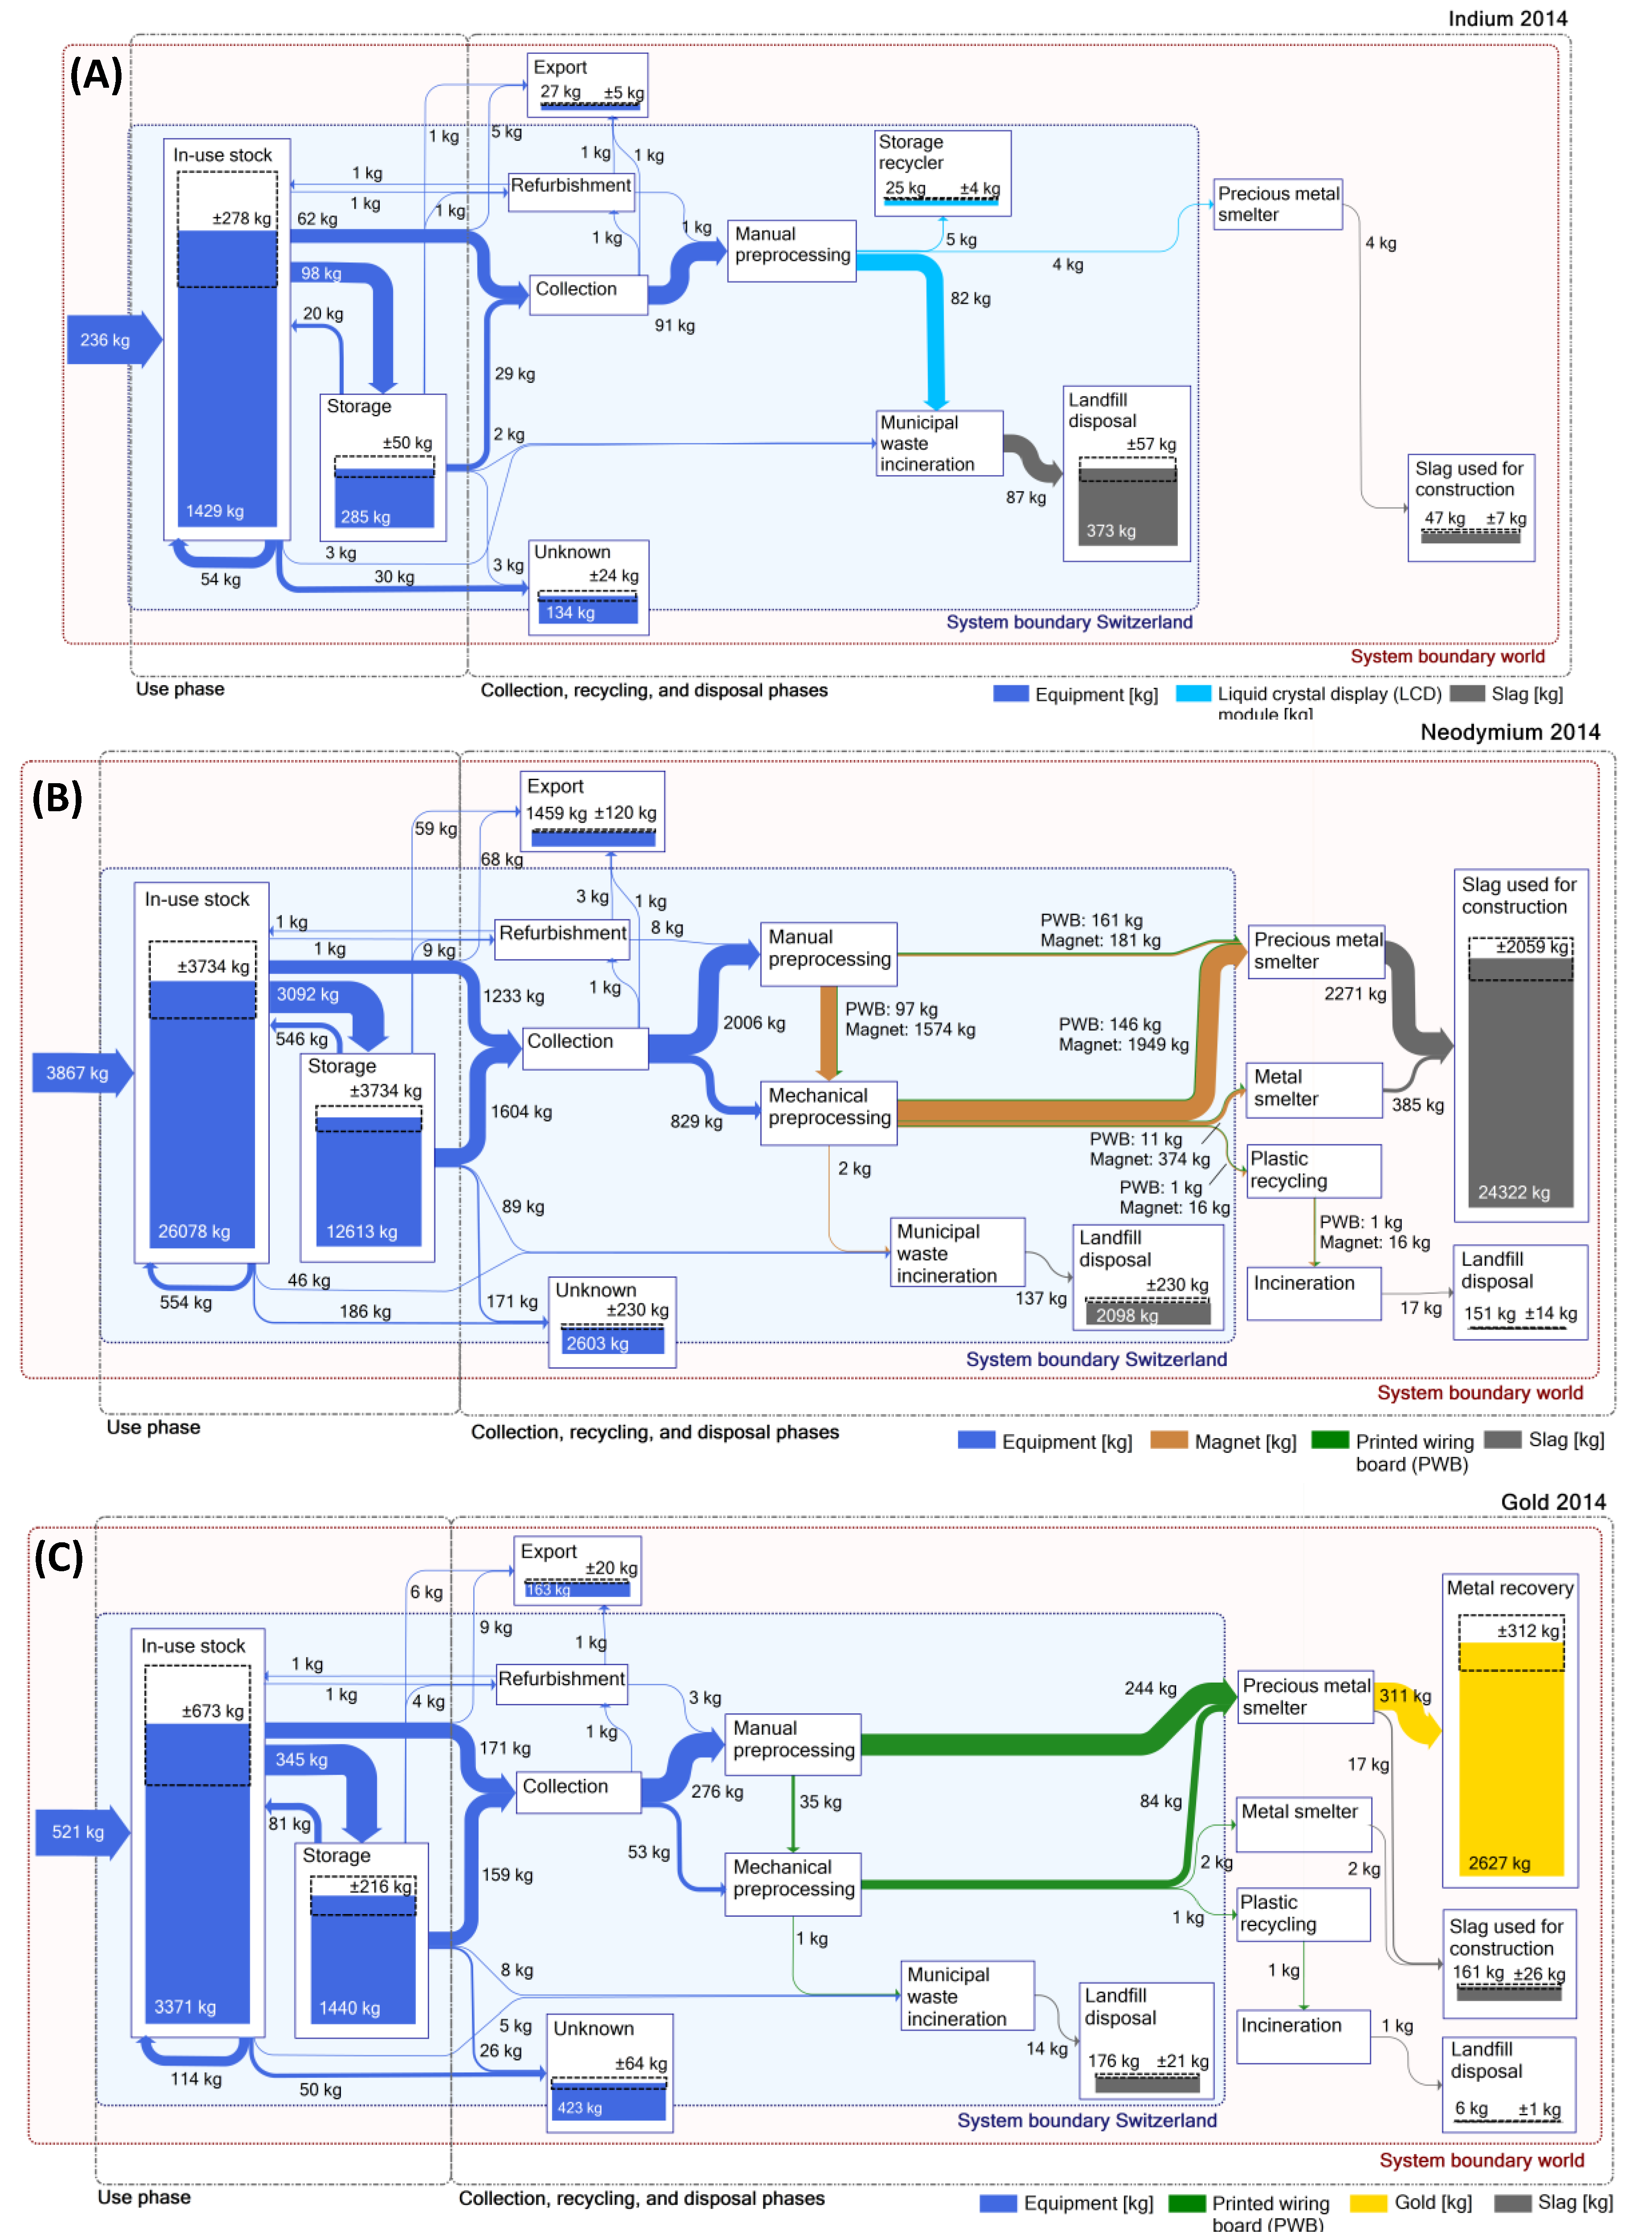
3.2. Stocks and Flows in 2014

Three snapshots of the simulated stocks and flows to and within the current system connected to the use of EE in Switzerland are shown in Figure 3 for indium, neodymium, and gold in 2014. For the sake of clarity, we included uncertainty ranges only for stocks and not for flows in the figure and rounded all figures to zero decimal places.
The amount of indium incorporated in EE sold in Switzerland in 2014 is 236 kg ± 50%. Disposal of EE accounted for 135 kg ± 20% leaving the use phase, of which 45 kg ± 20%, or 30%, did not reach recycling processes due to export, incineration of indium-containing devices, or unknown disposal pathways. Currently, all indium-containing devices reaching recycling processes in Switzerland go through manual preprocessing, either due to possible mercury-containing backlights in FPDs or lithium-ion batteries in phones and laptops, which require depollution before further treatment [61,62]. Of the indium from LCD panels, 90% is sent to municipal waste incinerators (MWIs), where it ends up in the slag. 5% is stored for possible further treatment in the future, and another 5% (in FPDs of phones) reach precious metal smelters (PMSs), where indium ends up in the slag as well.
The inflow of neodymium in EE in 2014 amounted to 3900 kg ± 35%. With 2800 kg ± 14%, 80% of the outflows from the use phase reached the recycling processes. Of the collected neodymium, 70% reaches manual preprocessing. This is due to the need to depollute laptops and phones, as described above, or to manually remove valuable components from desktops. HDDs and optical drives from laptops and desktops containing neodymium magnets are still sent to mechanical preprocessing after manual dismantling, while most neodymium in manually dismantled PWBs as well as in phones is directly sent to PMSs. The pathways of neodymium from mechanical preprocessing to PMSs and metal smelters are uncertain. According to the data available from a Swiss recycler, most neodymium reaches the finest fraction that is sent to PMSs [31]. Estimations of other recyclers and literature data suggest, however, that neodymium is mostly transferred to the magnetic steel fraction [63,64]. Either way, neodymium in magnets and PWBs reaches a smelting process, where it ends up in the slag.
The amount of gold found in EE sold in Switzerland in 2014 was 520 kg ± 50%. The outflow of the use phase amounted to 440 kg ± 20%, of which 25% did not reach the recycling scheme due to export, incineration, or unknown disposal pathways. Of the collected gold in EE, 84% is sent to manual preprocessing, due to regulatory requirements as described above or the removal of high-value PWBs. Manually dismantled PWBs are directly sent to PMSs without further treatment or losses. Only a small amount of PWBs from laptops (after displays have been removed) is further sent to mechanical preprocessing. From mechanical preprocessing, around 5% of the gold is lost in fractions going to MWI, metal smelters, and plastic recycling. This result is contrary to Chancerel et al. [34], who report that only 25% of gold reaches fractions from which it may potentially be recovered. The difference can be explained by the fact that they focused on small WEEE, whereas we consider EE with mostly high-grade PWBs. Data from a Swiss recycling plant confirm significant amounts of precious metals reaching finely graded plastic fractions [31]. Therefore, some recyclers send such fractions also to PMSs. Large amounts of precious metals in ferrous metal and aluminum fractions were not found [31]. Gold reaching PMSs is recovered at a rate of at least 95%. Overall, 70% of the gold leaving the use phase is recovered, with the highest losses occurring directly after the use phase.
As our system boundaries have no outflows, the total amount of indium, neodymium, and gold that entered Switzerland within the nine considered device types until 2014 is distributed among the respective stocks as shown in Figure 3. These accumulated stocks provide information regarding the importance of pathways (e.g., “export”) and sinks (e.g., “landfill”) within the system. All three metals are mainly found in the use phase (indium: 60–90%, neodymium: 50–60%, gold: 50–70%, including uncertainty ranges). The second-largest stocks are: for indium, slags in Swiss landfills (15–20%); for neodymium, slags used for construction (30–40%); and for gold, the recovered metal (30–35%). These three stocks represent the main fate of the metals in question. Although we assumed that before 1994, most metals incorporated in EE reached Swiss landfills, the share of neodymium (3%) and gold (2%) in Swiss landfills in the total stocks of these metals within the system is small. The large stocks in the use phase for all three metals indicate that most of the resources that have entered the system could theoretically still be recovered. The potential quantities for recycling are lowered by losses mostly due to unknown disposal pathways. They account for 10–24% of the use phase’s outflows and lead to a reduction of 3–7% of the total amount of metals in the system. Although it is possible that material reaching unknown disposal pathways may still end up in a collection system [15], it is more likely that a significant amount of these resources are lost at the end of the use phase.
The average metal quantities reaching recycling in 2014 were low: 90 kg of indium, 2800 kg of neodymium, and 330 kg of gold. Based on current metal prices, the value of the metal flows to recycling is 36,000 US $ for indium, 200,000 US $ for neodymium and 13,600,000 US $ for gold [65,66,67]. Thus, although neodymium flows to recycling are nine times larger than gold flows, the revenues for gold are almost 70 times higher. The small quantities combined with low prices discourage recyclers from adapting their preprocessing and finding appropriate downstream processes for recovering indium and neodymium. These conditions also provide little incentive for downstream processors to establish commercial-scale recovery processes for indium and neodymium [14], although various recycling technologies are available for indium and neodymium on a laboratory or pilot scale [39,68,69,70]. An economic feasibility study investigating the Swiss recycling system showed that indium recycling could be covered financially with a marginal increase of the advance recycling fee by at most 0.2 US $/product [30]. Without appropriate financing mechanisms in place, all indium and neodymium is currently irrecoverably dissipated to the slag of MWIs, PMSs, or metal smelters.

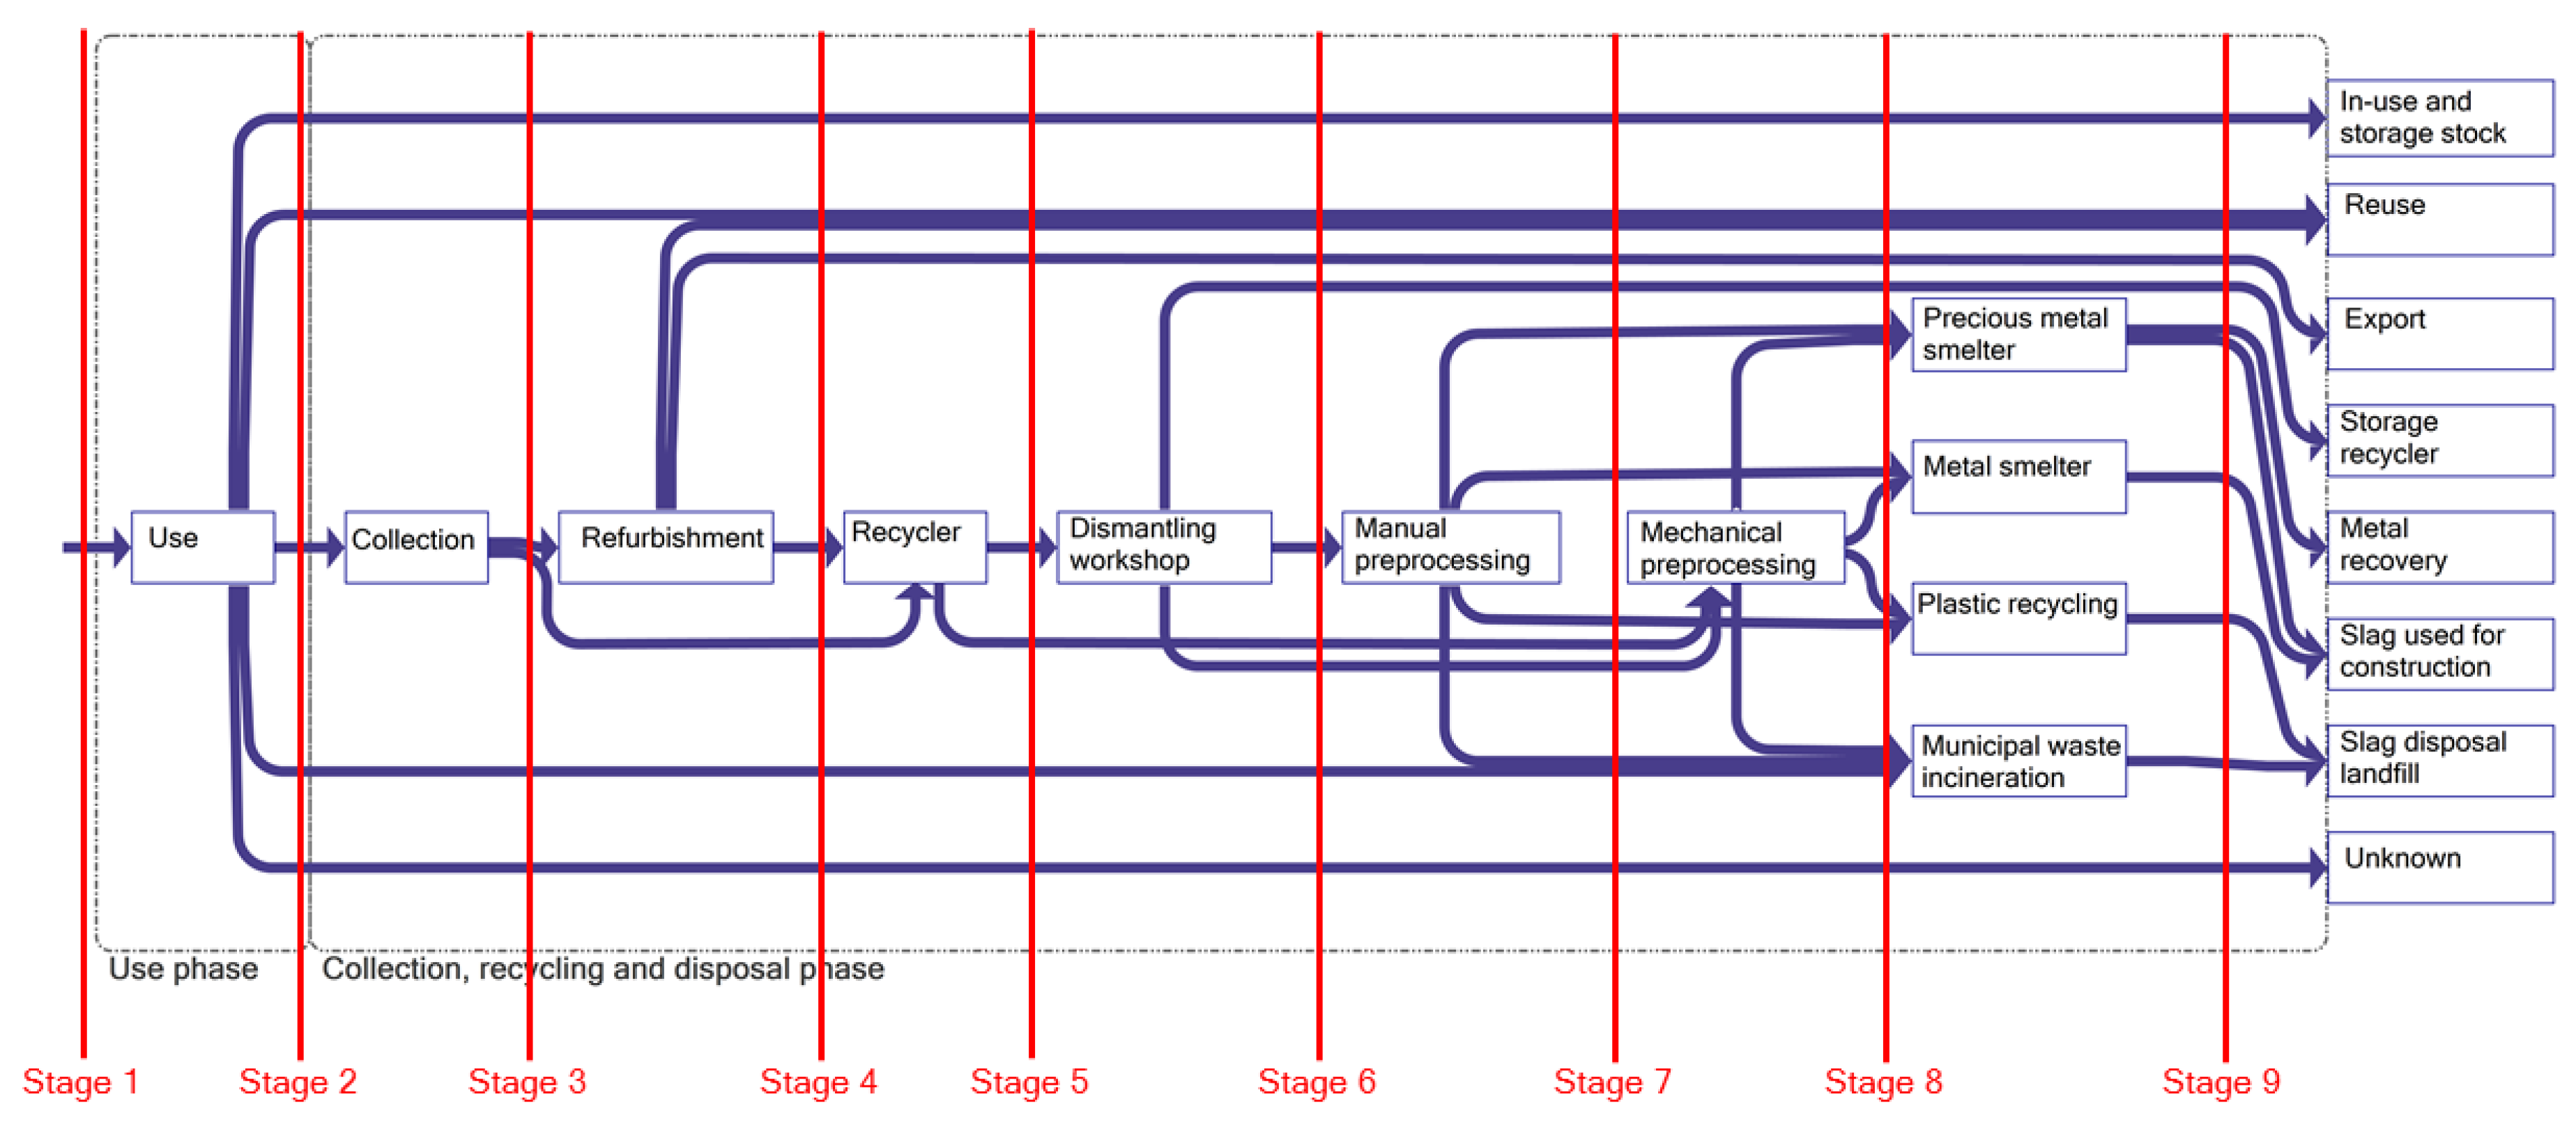
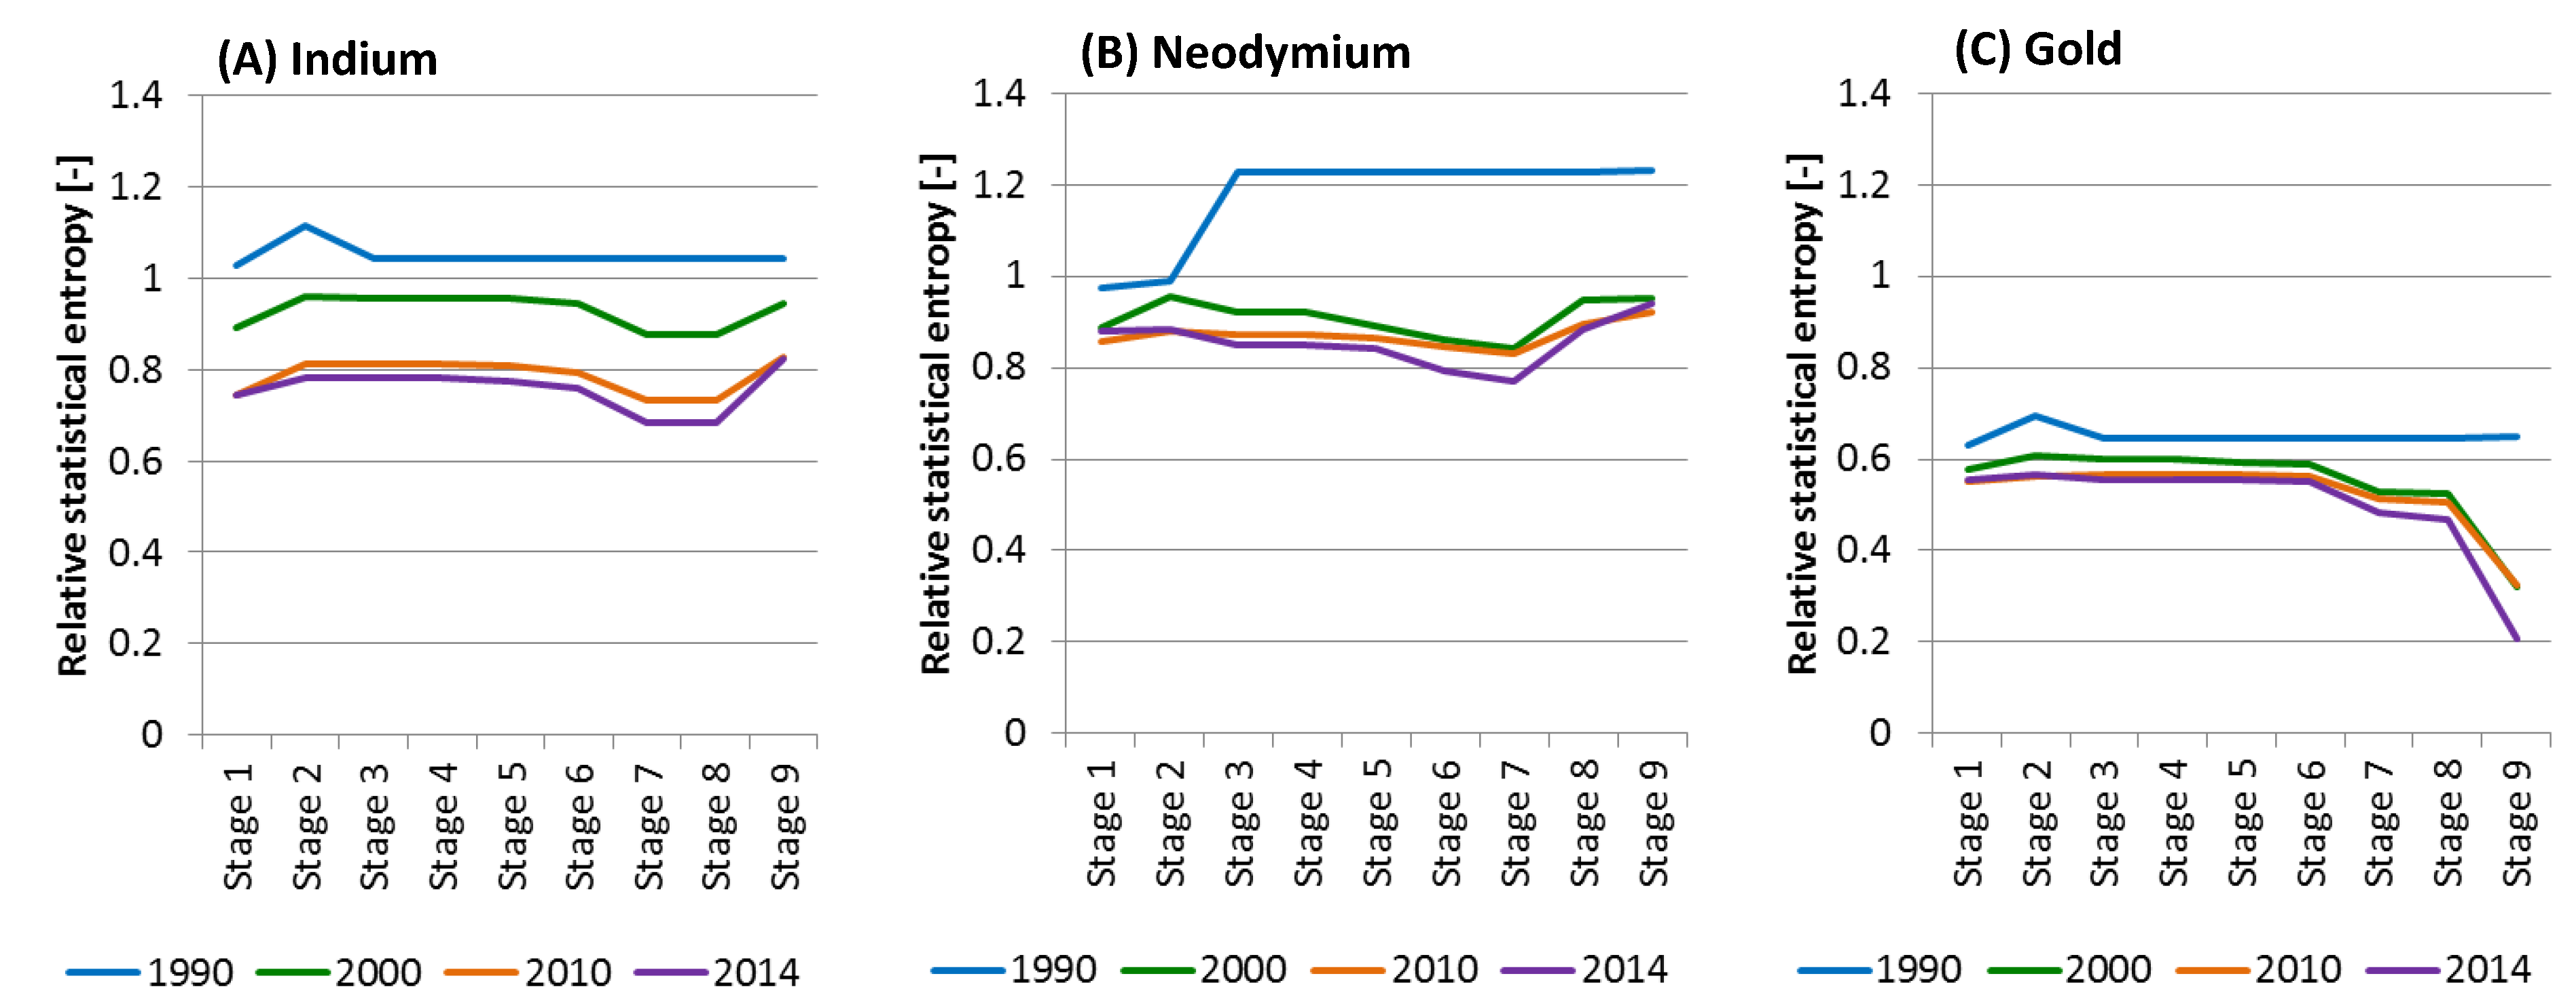
3.3. Statistical Entropy Analysis

To measure the dilution or dissipation of metals during their route through the system, the SEA was performed for every year, enabling the comparison of the RSE among system stages as well as years. The system under study (Figure 1), transferred to the respective stages according to the procedure described in Rechberger and Graedel [26], is depicted in Figure 4.
The trends of the RSE for the total indium, neodymium, and gold stocks and flows along the use, collection, recycling, and disposal phases are illustrated in Figure 5 for the years 1990, 2000, 2010, and 2014.
The RSE values of 1990 correspond to the status of the system before an e-waste collection system was established. For the years 2000–2014, the differences in the RSE are due to changed compositions of EE put on the market. Due to the low indium, neodymium, and gold contents within EE, these metals are already highly diluted when the devices are put on the market (stage 1) and get even further diluted when they are in the stock (stage 2). Compared to indium and neodymium, gold is the least diluted metal in EE with reference to the content in the Earth’s crust. Dilution during stages 1 and 2 changes over time depending on the share of devices with higher metal contents. In 1990, EE was sent to MWIs and metals were dissipated to the slag disposed of in landfills. This results in low metal contents (for indium and neodymium below those in the Earth’s crust) and high RSE. The decreasing RSE within stages 3–7 for the years 2000–2014 shows the ability of the system to concentrate the metals during the collection and recycling phase. Indium is concentrated to the level of dismantled LCD panels, neodymium to that of dismantled HDDs or optical drives, and gold to that of dismantled PWBs or precious metal-containing fractions after mechanical preprocessing. However, the decrease in RSE is reversed for indium after stage 8, where LCD panels are incinerated and indium is dissipated to the slag. Within Switzerland, slags from MWIs are disposed of in specified landfill sites. According to data from a Swiss MWI, the content of indium in the slag is similar to very low-grade zinc deposits [71,72]. These data, however, are very uncertain and it is not known whether the recovery of indium from slags in landfills would be economically viable. For neodymium, after separation, HDDs and optical drives are sent to mechanical treatment with other EE (stage 7) with the resulting fractions treated in a smelter where neodymium is dissipated to the slag (stage 8/9). Slags from PMSs and metal smelters are often used for construction, either in landfills or, for example, to reinforce dams. Neodymium in smelter slag is thus further dissipated to the environment in contents well below those of primary mines (see Section S7 in the Supplementary Materials for more details on slag contents). As gold is recovered with a purity of 99.99%, the RSE shows a sharp drop after stage 8. Due to losses in the system, the RSE stays at 0.2.
The SEA illustrates how the current collection and recycling system successfully concentrates indium and neodymium after the use phase, mostly because of manual dismantling that is either required due to depollution targets or done voluntarily due to valuable fractions in EE. The content of indium in LCD modules amounts to 130–230 ppm, which is higher than contents in primary mines of 1–100 ppm [30,39,72]. A life cycle assessment of primary and secondary production of indium indicated that secondary production after manual preprocessing is favorable or at least equal to primary production in terms of environmental impact [30]. The content of neodymium in dismantled HDDs and optical drives sent from manual to mechanical treatment (250–560 ppm) is lower than contents in primary mines (1200–17,600 ppm). This fraction should, therefore, be further physically separated and concentrated before it is sent to metallurgical extraction [11]. The secondary production of neodymium oxide from HDDs is clearly preferable to primary production from an environmental point of view [30]. However, due to the lack of economic incentives and lacking recovery processes on a commercial scale, the metals are diluted or dissipated within the incineration or smelting process.

3.4. Future Developments

The absolute quantities of indium from EE in the recycling process are very low. According to Yoshimura et al., worldwide losses in the mining, smelting, and refining processes are more than 900 times higher than in the recycling processes [18]. Significant changes in indium quantities flowing to the recycling processes are not expected in the near future. Gold quantities flowing to the recycling processes are slowly decreasing, and significant changes are not expected, either [40]. Recycling of neodymium magnets, particularly from HDDs, seems promising due to significant quantities in the waste stream, also compared to other neodymium-containing technologies [17]. However, it is expected that by 2025, most computers will only contain SSDs.
The prospective MFA predicts a first decline of neodymium in magnets in the flow to recycling in 2018 (Figure 6). By 2030, the flow will be more than halved from 2900 kg/year to 1100 kg/year. In 2050, unless other technology changes alter the use of neodymium magnets in EE, the flow to recycling will stabilize at 600 ± 20% kg, consisting mainly of neodymium magnets in speakers from smartphones, laptops, and headphones. Despite decreasing neodymium flows, most of the existing neodymium stock could be “mined” within the next 30 years if suitable recovery processes are available. Although the demand for neodymium in EE will decrease, overall demand for it is likely to increase due to emerging technologies such as electric vehicles (e.g., [73,74,75]).

4. Conclusions and Outlook

The dynamic MFA modeling approach, complemented with SEA, has proven to be a powerful tool to quantify the development of stocks and flows of critical metals and to assess their dissipation in the waste management processes. By including sinks instead of outflows in the MFA system, we are able to show the final destinations of metals that were originally imported as components of electronic devices. The results of the case study indicate that for the metals in question, the largest stocks are still in the use phase today. Therefore, most resources that have entered the system can theoretically still be recovered. The current system with a large share of manual preprocessing offers favorable conditions for the recovery of critical metals. However, due to small metal quantities, low metal prices, and the lack of recycling technologies at the commercial scale, indium and neodymium are irrecoverably dissipated in the recycling process. Starting points to improve the current system could be small additional fees levied by recycling systems, which could provide sufficient funds to encourage recyclers and downstream processors to adapt and establish the necessary infrastructure for the recovery of indium and neodymium. Stricter regulations regarding metal-specific recycling rates could further encourage system operators, recyclers, and downstream processors to request and establish commercial-scale recovery options and thus close material cycles. Intermediate storage of indium and neodymium-containing fractions would also be a viable option to prevent resource losses. As metal quantities are very low, further treatment and recovery should take economies of scale into account in order to reach sufficient input quantities. Future research should therefore contribute to the improvement and upscaling of technological solutions to recover critical metals. In addition, financing mechanisms for currently unviable recovery processes should be developed, as well as regulations with resource-specific recovery targets.
The generic model can be customized for any type of end-user product or substance by simply adding or removing specific processes. The data to determine the flows connecting the processes, however, have to be collected empirically for each particular case. The data for modeling the collection, recycling, and disposal phases—collected from interviews and the literature—reveal losses to unknown disposal pathways and large discrepancies between preprocessing facilities. These data could be improved by additional research aiming to break down and analyze disposal pathways and the fate of critical metals within preprocessing in more detail. With a harmonized approach (as proposed by Ueberschaar et al. [64]), results would become more comparable across recycling facilities and countries. The RSE, resulting from the SEA, proved to be a simple, comprehensible, and meaningful indicator to measure the level of dilution or concentration of a metal on its pathway through the MFA system. By indicating which processes are responsible for concentration and dilution, the SEA could be useful for communicating the strengths and weaknesses of the current recycling system to system managers or policy makers. Recyclers could use the result as a basis for improving their process chains. The SEA, as a tailor-made evaluation method for MFA, can be applied to any kind of MFA system. With stock and flow information available over time, the SEA can also be performed for each time step over a longer time period.
The high uncertainty for the stocks and flows of indium, neodymium, and gold presented in our case study results from the uncertainty regarding device inflows combined with a high variability in the metal content per device. Sources of uncertainty are, for example, small samples of measured devices per data source or variable display sizes and metal contents in the case of indium. Such uncertainties challenge the usefulness and interpretability of the results we presented. However, this situation is typical for dynamic MFAs of critical metals, where data are generally still very scarce and often have to be combined from many different sources. In our study, we included input data uncertainties in the form of probability distributions and treated them with Monte-Carlo simulation, delivering the resulting stocks and flows in the form of probability distribution as well. It was possible using this approach to account for the variable data quality in a comprehensive and transparent way. For recycling system managers, recyclers, or downstream processors, being aware of and reducing uncertainties of collection flow data could be crucial to better estimate within which ranges the expected flows could fluctuate, and to better plan financing mechanisms or the dimensioning of recycling capacities.
Sales predictions over several decades are obviously uncertain. We intended to cover at least the period in which magnets from HDDs will remain in the waste stream and in which the transition from HDDs to SSDs is expected to happen. We believe that our assumptions regarding technologies and socio-economic contexts within this timeframe are permissible simplifications. The extension of the time horizon to 2050 is necessary to cover the delay due to use and storage. However, an attempt to model the economic mechanisms of supply and demand for devices and commodities would go far beyond the scope of this research. Our model is therefore not capable of anticipating the effects of global prices changes, e.g., due to increasing scarcity of some metals, on the decision-making of producers, consumers, and recyclers.

Supplementary Materials

The Supporting Information is available online at https://www.mdpi.com/2071-1050/10/8/2658/s1. It provides more detail regarding data quality indicators and the change of metal contents over time, the extrapolation of sales data up to the year 2050, the flows of EE in the Swiss collection, recycling, and disposal system and the corresponding transfer coefficients as well as all related uncertainties. It further includes more information on the SEA and the extended software tool used to implement the SEA. Additional results include a table on the shares of stocks, losses, and sinks in the total amounts of indium, neodymium and gold in the current system and results of the SEA.

Author Contributions

Conceptualization, E.T., L.M.H., M.F.; Methodology, E.T. and L.M.H.; Formal Analysis, E.T.; Investigation, E.T.; Resources, H.W.B.; Writing (Original Draft Preparation), E.T. and L.M.H.; Writing (Review & Editing), M.S., H.W.B. and M.F.; Supervision, M.F.

Funding

This research received no external funding.

Acknowledgments

We thank Dimitri Kohler from the University of Zürich for refining and extending the pymfa tool for the statistical entropy analysis calculations.

Conflicts of Interest

The authors declare no conflict of interest.

References

  1. Bieser, J.C.T.; Hilty, L.M. Indirect Effects of the Digital Transformation on Environmental Sustainability: Methodological Challenges in Assessing the Greenhouse Gas Abatement Potential of ICT. Digit. Transf. Environ. Sustain. 2018, 68–53, 68–81. [Google Scholar] [CrossRef]
  2. Hilty, L.; Aebischer, B. ICT Innovations for Sustainability, Advances in Intelligent Systems and Computing; Springer: Berlin/Heidelberg, Germany, 2015; ISBN 978-3-319-09227-0. [Google Scholar]
  3. Bieser, J.C.T.; Hilty, L.M. An approach to assess indirect environmental effects of digitalization based on a time-use perspective. 2018. accepted for publication. [Google Scholar]
  4. Buchert, M.; Manhart, A.; Bleher, D.; Pingel, D. Recycling Critical Raw Materials from Waste Electronic Equipment; Oeko-Institut e.V.: Breisgau, Germany, 2012. [Google Scholar]
  5. European Commission. Critical Raw Materials for the EU. Report of the Ad-hoc Working Group on Defining Critical Raw Materials; European Commission: Brussels, Belgium, 2014. [Google Scholar]
  6. European Commission. Critical Raw Materials for the EU. Report of the Ad-hoc Working Group on Defining Critical Raw Materials; European Commission: Brussels, Belgium, 2010. [Google Scholar]
  7. Buchert, M.; Schueler, D.; Bleher, D. Critical Metals for Future Sustainable Technologies and Their Recycling Potential; Öko-Institut: Freiburg, Germany, 2009. [Google Scholar]
  8. Streicher-Porte, M. SWICO/S.EN.S., the Swiss WEEE recycling systems and best practices from other European systems. In Proceedings of the 2006 IEEE International Symposium on Electronics and the Environment, San Francisco, CA, USA, 8–11 May 2006; pp. 281–287. [Google Scholar]
  9. Gerst, M.D.; Graedel, T.E. In-Use Stocks of Metals: Status and Implications. Environ. Sci. Technol. 2008, 42, 7038–7045. [Google Scholar] [CrossRef] [PubMed]
  10. Graedel, T.E.; Allwood, J.M.; Birat, J.-P.; Buchert, M.; Hagelüken, C.; Reck, B.K.; Sibley, S.F.; Sonnemann, G. What do we know about metal recycling rates? J. Ind. Ecol. 2011, 15, 355–366. [Google Scholar] [CrossRef]
  11. UNEP. Metal Recycling: Opportunities, Limits, Infrastructure, A Report of the Working Group on the Global Metal Flows to the International Resource Panel; Reuter, M.A., Hudson, C., van Schaik, A., Heiskanen, K., Meskers, C., Hagelüken, C., Eds.; UNEP: Nairobi, Kenya, 2013. [Google Scholar]
  12. Van Schaik, A.; Reuter, M.A. Dynamic modelling of E-waste recycling system performance based on product design. Miner. Eng. 2010, 23, 192–210. [Google Scholar] [CrossRef]
  13. Reuter, M.A. Limits of design for recycling and “sustainability”: A review. Waste Biomass Valorization 2011, 2, 183–208. [Google Scholar] [CrossRef]
  14. Cucchiella, F.; D’Adamo, I.; Lenny Koh, S.C.; Rosa, P. Recycling of WEEEs: An economic assessment of present and future e-waste streams. Renew. Sustain. Energy Rev. 2015, 51, 263–272. [Google Scholar] [CrossRef] [Green Version]
  15. Thiébaud, E.; Hilty, L.M.; Schluep, M.; Faulstich, M. Use, Storage, and Disposal of Electronic Equipment in Switzerland. Environ. Sci. Technol. 2017. [Google Scholar] [CrossRef] [PubMed]
  16. Schulze, R.; Buchert, M. Estimates of global REE recycling potentials from NdFeB magnet material. Resour. Conserv. Recycl. 2016, 113, 12–27. [Google Scholar] [CrossRef]
  17. Sprecher, B.; Kleijn, R.; Kramer, G.J. Recycling Potential of Neodymium: The Case of Computer Hard Disk Drives. Environ. Sci. Technol. 2014, 48, 9506–9513. [Google Scholar] [CrossRef] [PubMed]
  18. Yoshimura, A.; Daigo, I.; Matsuno, Y. Global substance flow analysis of indium. Mater. Trans. 2013, 54, 102–109. [Google Scholar] [CrossRef]
  19. Alonso, E.; Sherman, A.M.; Wallington, T.J.; Everson, M.P.; Field, F.R.; Roth, R.; Kirchain, R.E. Evaluating Rare Earth Element Availability: A Case with Revolutionary Demand from Clean Technologies. Environ. Sci. Technol. 2012, 46, 3406–3414. [Google Scholar] [CrossRef] [PubMed]
  20. Du, X.; Graedel, T.E. Global In-Use Stocks of the Rare Earth Elements: A First Estimate. Environ. Sci. Technol. 2011, 45, 4096–4101. [Google Scholar] [CrossRef] [PubMed]
  21. Du, X.; Graedel, T.E. Global Rare Earth In-Use Stocks in NdFeB Permanent Magnets. J. Ind. Ecol. 2011, 15, 836–843. [Google Scholar] [CrossRef]
  22. Zuser, A.; Rechberger, H. Considerations of resource availability in technology development strategies: The case study of photovoltaics. Resour. Conserv. Recycl. 2011, 56, 56–65. [Google Scholar] [CrossRef]
  23. Saurat, M.; Bringezu, S. Platinum group metal flows of europe, part II exploring the technological and institutional potential for reducing environmental impacts. J. Ind. Ecol. 2009, 13, 406–421. [Google Scholar] [CrossRef]
  24. Elshkaki, A.; Van Der Voet, E. The consequences of the use of platinum in new technologies on its availability and on other metals cycles. In Conservation and Recycling of Resources: A New Research; Loeffe, C.V., Ed.; Nova Publishers: Hauppauge, NY, USA, 2006; p. 245. ISBN 1-60021-125-9. [Google Scholar]
  25. Yamasue, E.; Nakajima, K.; Daigo, I.; Hashimoto, S.; Okumura, H.; Ishihara, K.N. Evaluation of the potential amounts of dissipated rare metals from WEEE in Japan. Mater. Trans. 2007, 48, 2353–2357. [Google Scholar] [CrossRef]
  26. Rechberger, H.; Graedel, T.E. The contemporary European copper cycle: Statistical entropy analysis. Ecol. Econ. 2002, 42, 59–72. [Google Scholar] [CrossRef]
  27. Bornhöft, N.A.; Sun, T.Y.; Hilty, L.M.; Nowack, B. A dynamic probabilistic material flow modeling method. Environ. Model. Softw. 2016, 76, 69–80. [Google Scholar] [CrossRef] [Green Version]
  28. Thiébaud, E. Critical Metals in Electronic Equipment: A Methodology to Model End-User Stocks and Flows; TU Clausthal: Clausthal-Zellerfeld, Germany, 2017. [Google Scholar]
  29. Licht, C.; Peiró, L.T.; Villalba, G. Global Substance Flow Analysis of Gallium, Germanium, and Indium: Quantification of Extraction, Uses, and Dissipative Losses within their Anthropogenic Cycles. J. Ind. Ecol. 2015, 19, 890–903. [Google Scholar] [CrossRef]
  30. Böni, H.; Wäger, P.; Thiébaud, E.; Du, X.; Figi, R.; Nagel, O.; Bunge, R.; Stäubli, A.; Spörry, A.; Wolfensberger-Malo, M.; et al. Projekt e-Recmet—Rückgewinnung von kritischen Metallen aus Elektronikschrott am Beispiel von Indium und Neodym. Schlussbericht [Project e-Recmet—Recovery of Critical Metals from e-Waste, the Example of Indium and Neodymium. FINAL Report]; Empa: St. Gallen, Switzerland, 2015. [Google Scholar]
  31. Wäger, P.; Widmer, R.; Restrepo, E.; Fernandes, M. Seltene Technische Metalle in Fraktionen Aus der Maschinellen Aufbereitung von WEEE; Federal Office for the Environment: Bern, Switzerland, 2014. [Google Scholar]
  32. Blaser, F.; Castelanelli, S.; Wäger, P.; Widmer, R. Seltene Metalle in Elektro- und Elektronikaltgeräten—Vorkommen und Rückgewinnungstechnologien; Bundesamt für Umwelt: Bern, Switzerland, 2011. [Google Scholar]
  33. MoE; METI. Report of the Study Group for Less Common Metal Recovery from Used Small Electric Appliances 2009 (in Japanese); Ministry of Environment; Ministry of Economy, Trade and Industry: Tokyo, Japan, 2010.
  34. Chancerel, P.; Meskers, C.; Hagelüken, C.; Rotter, V.S. Assessment of Precious Metal Flows During Preprocessing of Waste Electrical and Electronic Equipment. J. Ind. Ecol. 2009, 13, 791–810. [Google Scholar] [CrossRef] [Green Version]
  35. Grimm, V.; Berger, U.; DeAngelis, D.L.; Polhill, J.G.; Giske, J.; Railsback, S.F. The ODD protocol: A review and first update. Ecol. Model. 2010, 221, 2760–2768. [Google Scholar] [CrossRef] [Green Version]
  36. Grimm, V.; Berger, U.; Bastiansen, F.; Eliassen, S.; Ginot, V.; Giske, J.; Goss-Custard, J.; Grand, T.; Heinz, S.K.; Huse, G.; et al. A standard protocol for describing individual-based and agent-based models. Ecol. Model. 2006, 198, 115–126. [Google Scholar] [CrossRef]
  37. Müller, E.; Hilty, L.M.; Widmer, R.; Schluep, M.; Faulstich, M. Modeling Metal Stocks and Flows: A Review of Dynamic Material Flow Analysis Methods. Environ. Sci. Technol. 2014, 48, 2102–2113. [Google Scholar] [CrossRef] [PubMed]
  38. Gottschalk, F.; Scholz, R.W.; Nowack, B. Probabilistic material flow modeling for assessing the environmental exposure to compounds: Methodology and an application to engineered nano-TiO2 particles. Environ. Model. Softw. 2010, 25, 320–332. [Google Scholar] [CrossRef]
  39. Ueberschaar, M.; Schlummer, M.; Jalalpoor, D.; Kaup, N.; Rotter, V.S. Potential and Recycling Strategies for LCD Panels from WEEE. Recycling 2017, 2, 7. [Google Scholar] [CrossRef]
  40. Bangs, C.; Meskers, C.; Van Kerckhoven, T. Trends in electronic products—the canary in the urban mine. In Proceedings of the Electronic Goes Green 2016+, Berlin, Germany, 7–9 September 2016. [Google Scholar]
  41. Ueberschaar, M.; Rotter, V.S. Enabling the recycling of rare earth elements through product design and trend analyses of hard disk drives. J. Mater. Cycles Waste Manag. 2015, 17, 266–281. [Google Scholar] [CrossRef] [Green Version]
  42. Habib, K.; Schibye, P.K.; Vestbø, A.P.; Dall, O.; Wenzel, H. Material Flow Analysis of NdFeB Magnets for Denmark: A Comprehensive Waste Flow Sampling and Analysis Approach. Environ. Sci. Technol. 2014, 48, 12229–12237. [Google Scholar] [CrossRef] [PubMed]
  43. Sander, K.; Schilling, S.; Marscheider-Weidemann, F.; Wilts, H.; von Gries, N.; Hobohm, J. Abfallwirtschaftliche Produktverantwortung Unter Ressourcenschutzaspekten, Meilensteinbericht August 2012; Ökopol GmbH, Fraunhofer Gesellschaft ISI, TU Darmstadt, TU Hamburg-Harburg: Hamburg, Germany, 2012. [Google Scholar]
  44. Westphal, L.; Kuchta, K. Permanent Magnets from Small Waste Electrical and Electronic Equipment. In Proceedings of the Sardinia 2013, Sardinia, Italy, 30 September–4 October 2013. [Google Scholar]
  45. IUTA; fem Forschungsinstitut Edelmetalle. Metallurgische Rückgewinnung von Indium, Gallium und Germanium aus Elektronikschrott und Entwicklung Entsprechender Aufbereitungsmethoden Für Die Verwertungsindustrie; fem Forschungsinstitut Edelmetalle; Metallchemie, Schwäbisch-Gmünd; Institut Für Energie, Umwelttechnik e.V.: Schäbisch Gmünd/Duisburg, Germany, 2011. [Google Scholar]
  46. Oguchi, M.; Murakami, S.; Sakanakura, H.; Kida, A.; Kameya, T. A preliminary categorization of end-of-life electrical and electronic equipment as secondary metal resources. Waste Manag. 2011, 31, 2150–2160. [Google Scholar] [CrossRef] [PubMed]
  47. Chancerel, P. Substance Flow Analysis of the Recycling of Small Waste Electrical and Electronic Equipment; An assessment of the recovery of gold and palladium; Technische Universität Berlin, Institut für Technischen Umweltschutz, ITU-Schriftenreihe: Berlin, Germany, 2010. [Google Scholar]
  48. Weidema, B.P.; Wesnæs, M.S. Data quality management for life cycle inventories—An example of using data quality indicators. J. Clean. Prod. 1996, 4, 167–174. [Google Scholar] [CrossRef]
  49. JCGM. JCGM 100:2008. Evaluation of Measurement Data—Guide to the Expression of Uncertainty in Measurement (GUM); Joint Committee for Guides in Metrology: Paris, France, 2008. [Google Scholar]
  50. Thiébaud-Müller, E.; Hilty, L.M.; Schluep, M.; Widmer, R.; Faulstich, M. Service lifetime, storage time and disposal pathways of electronic equipment: A Swiss case study. J. Ind. Ecol. 2017, 22, 196–208. [Google Scholar] [CrossRef]
  51. Swisscom, AG. Personal Communication with Senior Corporate Responsibility Manager; Swisscom AG: Bern, Switzerland, 2016. [Google Scholar]
  52. Salt Mobile, SA. Personal Communication with Director Logistics and Retail Development; Salt Mobile SA: Renens, Switzerland, 2016. [Google Scholar]
  53. Media Markt Management, AG. Personal Communication with Head Business Process Management & Masterdata; Media Markt Management AG: Dietikon, Switzerland, 2016. [Google Scholar]
  54. Immark, AG. Personal Communication with Head Material Flow Management; Immark AG: Düren, Germany, 2016. [Google Scholar]
  55. RUAG Environment, AG. Personal Communication with Head Quality Management/Deputy Head of Production; RUAG Environment AG: Schattdorf, Switzerland, 2016. [Google Scholar]
  56. Solenthaler Recycling, AG. Personal Communication with Head Quality Management; Solenthaler Recycling AG: Gossau, Switzerland, 2016. [Google Scholar]
  57. Bühlmann Recycling, AG. Personal Communication with Head Environmental Officer; Bühlmann Recycling AG: Murten, Switzerland, 2016. [Google Scholar]
  58. Gössling-Reisemann, S. What Is Resource Consumption and How Can It Be Measured? Application of Entropy Analysis to Copper Production. J. Ind. Ecol. 2008, 12, 570–582. [Google Scholar] [CrossRef]
  59. Brunner, P.H.; Rechberger, H. Practical Handbook of Material Flow Analysis; Lewis Publishers: Boca Raton, FL, USA, 2004. [Google Scholar]
  60. SWICO. Swico Tätigkeitsberichte 2006–2015 (Swico Activity Reports 2006–2015); SWICO Recycling: Zürich, Switzerland, 2016. [Google Scholar]
  61. Swico Recycling; SENS eRecycling. Technical Regulations for the Recycling of Electrical and Electronic Equipment; Swico Recycling; SENS eRecycling: Murten, Switzerland, 2013. [Google Scholar]
  62. CENELEC. Collection, Logistics & Treatment Requirements for WEEE—Part 1: General Treatment Requirements; CENELEC: Brussels, Belgium, 2014. [Google Scholar]
  63. Habib, K.; Parajuly, K.; Wenzel, H. Tracking the Flow of Resources in Electronic Waste—The Case of End-of-Life Computer Hard Disk Drives. Environ. Sci. Technol. 2015, 49, 12441–12449. [Google Scholar] [CrossRef] [PubMed]
  64. Ueberschaar, M.; Geiping, J.; Zamzow, M.; Flamme, S.; Rotter, V.S. Assessment of element-specific recycling efficiency in WEEE pre-processing. Resour. Conserv. Recycl. 2017, 124, 25–41. [Google Scholar] [CrossRef]
  65. Commodity Trade GmbH Indium: Preis & Markt. Available online: http://www.indium-preis.de/ (accessed on 20 April 2017).
  66. Mineral Fund Advisory Pty. Ltd Mineralprices.com—The Global Source for Metals Pricing. Available online: http://mineralprices.com/ (accessed on 26 July 2018).
  67. Gold Price Limited Gold Price. Available online: http://goldprice.org/ (accessed on 20 April 2017).
  68. Zhang, K.; Wu, Y.; Wang, W.; Li, B.; Zhang, Y.; Zuo, T. Recycling indium from waste LCDs: A review. Resour. Conserv. Recycl. 2015, 104 Pt A, 276–290. [Google Scholar] [CrossRef]
  69. Binnemans, K.; Jones, P.T.; Blanpain, B.; Van Gerven, T.; Yang, Y.; Walton, A.; Buchert, M. Recycling of rare earths: A critical review. J. Clean. Prod. 2013, 51, 1–22. [Google Scholar] [CrossRef]
  70. Maât, N.; Nachbaur, V.; Lardé, R.; Juraszek, J.; Le Breton, J.-M. An Innovative Process Using Only Water and Sodium Chloride for Recovering Rare Earth Elements from Nd–Fe–B Permanent Magnets Found in the Waste of Electrical and Electronic Equipment. ACS Sustain. Chem. Eng. 2016, 4, 6455–6462. [Google Scholar] [CrossRef]
  71. Morf, L.S.; Gloor, R.; Haag, O.; Haupt, M.; Skutan, S.; Lorenzo, F.D.; Böni, D. Precious metals and rare earth elements in municipal solid waste—Sources and fate in a Swiss incineration plant. Waste Manag. 2013, 33, 634–644. [Google Scholar] [CrossRef] [PubMed]
  72. USGS. Mineral Commodities Summaries 2016; U.S. Department of the Interior; U.S. Geological Survey: Washington, DC, USA; Reston, WV, USA, 2016.
  73. Fishman, T.; Myers, R.J.; Rios, O.; Graedel, T.E. Implications of Emerging Vehicle Technologies on Rare Earth Supply and Demand in the United States. Resources 2018, 7, 9. [Google Scholar] [CrossRef]
  74. Yano, J.; Muroi, T.; Sakai, S. Rare earth element recovery potentials from end-of-life hybrid electric vehicle components in 2010–2030. J. Mater. Cycles Waste Manag. 2016, 18, 655–664. [Google Scholar] [CrossRef]
  75. Busch, J.; Steinberger, J.K.; Dawson, D.A.; Purnell, P.; Roelich, K. Managing Critical Materials with a Technology-Specific Stocks and Flows Model. Environ. Sci. Technol. 2013. [Google Scholar] [CrossRef] [PubMed]
Figure 1. System overview. The grey boxes within processes represent stocks or sinks. Stocks and flows outside of Switzerland only include metals originating from EE used in Switzerland.
Sustainability 10 02658 g001
Figure 2. Cumulated total stock of (A) indium; (B) neodymium; and (C) gold in kg in the use phase. Desktops with SSDs are not included in the figure, as quantities are still too low in 2014.
Sustainability 10 02658 g002
Figure 3. (A) Indium, (B) neodymium, and (C) gold stocks and flows in kg in 2014 connected to the use of electronic equipment in Switzerland. The arrows representing inflows to processes show values from 2014, whereas the boxes representing the processes show the total stock accumulated since the introduction of the metal in question as a component of electronic equipment in Switzerland up to 2014.
Sustainability 10 02658 g003
Figure 4. Allocation of the MFA system′s material flows to stages.
Sustainability 10 02658 g004
Figure 5. Relative statistical entropy for (A) indium, (B) neodymium, and (C) gold for the years 1990, 2000, 2010, and 2014. The exact values of the RSE are listed in the Supplementary Materials.
Sustainability 10 02658 g005
Figure 6. Flows of neodymium in magnets to recycling in kg/year from 1994–2050.
Sustainability 10 02658 g006

