Article

Impact of the Planning from the Kanban System on the Company’s Operating Benefits

by
María Mojarro-Magaña
1,
Jesús Everardo Olguín-Tiznado
1,*,
Jorge Luis García-Alcaraz
2,
Claudia Camargo-Wilson
1,
Juan Andrés López-Barreras
3 and
Rubén Jesús Pérez-López
1
1
Faculty of Engineering of Ensenada, Universidad Autónoma de Baja California, Ensenada 22860, Mexico
2
Department Industrial Engineering and Manufacturing, Universidad Autónoma de Ciudad Juárez, Juárez 32310, Mexico
3
School of Chemical Sciences and Engineering, Universidad Autónoma de Baja California, Tijuana 22390, Mexico
*
Author to whom correspondence should be addressed.
Sustainability 2018, 10(7), 2506; https://doi.org/10.3390/su10072506
Submission received: 5 June 2018 / Revised: 6 July 2018 / Accepted: 10 July 2018 / Published: 17 July 2018
(This article belongs to the Special Issue Sustainable Materials and Manufacturing)

Abstract

:
This article reports a model regarding the structural equations of the impact of the planning phase and the benefits acquired in the implementation of the kanban system. It begins with a literature review of the activities of the planning phase, based on which a questionnaire was developed and applied in manufacturing companies in the state of Baja California, in the municipalities of Ensenada, Tijuana, Tecate, and Mexicali. The responses were obtained from 118 questionnaires and were validated by the Cronbach’s alpha index for internal validity and the R-squared index for predictive validity. A model of the structural equations of the planning phase was developed and validated through three latent variables, namely, human resources, preliminary analysis, and kanban integration, which correspond to 22 activities and one variable that integrate 11 operational benefits. The model shows six hypotheses to verify the causal relationships between these variables. Partial least-squares algorithms are used to validate the hypothesis, and the results indicate that the preliminary analysis is the basis for the success of the implementation of the kanban in the planning stage, through the application of activities, such as 5’s, value stream mapping (VSM), material handling, flow diagram, and visual aids with a sustainable approach, according to the efficient flow of materials and minimum downtime.

1. Introduction

Small and medium enterprises (SMEs) are important contributors to the economy of a country and, in recent years, because of globalization and competition in the market, have struggled to survive. Luna and Bednarek [1] mention that, in order to achieve an increase in competitiveness, companies can opt for different innovation strategies, one of which is ‘lean manufacturing’ (LM), as well as the tools that make it up.
In addition, emphasis has been placed on sustainability in production systems, which is rooted in the need for human beings to maintain current and future economic profitability, environmental protection, and standards of quality of life [2].

1.1. Lean Manufacturing

For Wahab, et al. [3], LM has been one of the most popular paradigms in the elimination of waste in manufacturing companies. Fortunately, in the last 20 years, the principles and teachings of LM have spread throughout the world in companies of diverse sectors and vocations [4]; inclusively, in more recent years, applications have been presented in non-manufacturing sectors, such as in the health sector, as presented by Robinson, et al. [5], Wellman, et al. [6].
LM started in the 1990s, particularly in the automotive and aerospace industry [7]. For Posada [8], LM consists in the systematic and habitual application of different tools for the improvement of productive processes by incorporating numerous tools and techniques (Luna and Bednarek [1], Shah and Ward [9], Liker [10], Villaseñor Contreras and Galindo Cota [11], Eswaramoorthi, et al. [12], Stone [13], Unver [14], Sundar, et al. [15]).
Hartini and Ciptomulyono [16] mention that there is a relationship between ‘lean’ and waste reduction in the productive activities of companies, where it is also pointed out that the links between lean and sustainability are growing rapidly.
In order to achieve LM, it is based on tools that are focused on the flow of materials; these tools help with the identification and elimination of waste and can improve the quality, time, and cost of production, because, usually, the values of this flow of materials is not what is added to the product, but it is rather to the costs [17].
For Malik [18], Just in Time (JIT) is a pillar of LM and it is a management philosophy and not a technique, which is confirmed in García, et al. [19], who define it as a philosophy that eliminates the waste associated with space, time, work, and storage, so that a company produces only the requests of the real customer and not for prediction. The JIT within the company requires other techniques, such as kanban, which help optimize the flow of materials.

1.2. Kanban and JIT

Taiichi Ohno is considered the father of kanban (Ohno [20]). According to (Becker [21], Akturk and Erhun [22]), kanban plays an important role in the JIT production system, as it is the tool that communicates the needs of each workstation. The Japanese term kanban means “visual record” [17], and it is thought that the idea originated in the supermarkets of the United States, where customers obtain what is needed when necessary, as well as in the necessary quantity [23].
On the other hand, Kumar and Panneerselvam [24] assure that kanban became the hallmark of JIT as a pull system, which contains information on the production characteristics of a product and the transport route within the organization. For Carreras and García [25], in the pull production system, the flow of material is replaced in the process at the same rate that it is consumed. In addition, Cimorelli [26] mentions that, with a pull system, the process makes more pieces only when the next process removes the pieces, in order to pull the parts when they are necessary.
In Rahman, Sharif and Esa [17], it is mentioned that kanban is a card-based control system to convey instructions that are supported by the logic that nothing will be produced until it is needed; however, as part of JIT, Junior and Godinho Filho [27] confirm that kanban is a subsystem of this and that it was created to control the levels of inventory, production, and the supply of components and raw material, and so the objective of this technique is to minimize the inventory of the work in process (WIP) and the total cost of inventory [28].
Kanban can control the levels of the inventories in the system, to regulate production. When a buffer reaches its pre-established maximum level, the machine is told to stop producing that piece [17]. In summary, kanban is one of the tools used by JIT for flow control, inventory, and production levels, as well as the supply of components and raw materials [29].

1.3. Kanban Taxonomies

To control the flow of materials and information, according to Tapping [30], there are internal kanbans that regulate the flow inside the factory, and the external kanban that regulates the flow with the suppliers or clients. Ohno [20] presents the two original kanban types, namley the production order kanban (POK) and withdrawal kanban (WK); however Berkley [31], and Akturk and Erhun [22] mention that, in real practice, individually, a single or combined type of card can be used.
The POK contains the work instructions that precede each station, indicating the type of product and the quantity to be manufactured, while the WK specifies the quantity of product that is required, which the next process must withdraw [24]. An individual kanban is used if the workstations are located together in a row, and in the middle of the workstations, the inventory (small warehouse) is located. A combined (dual) kanban system is used when a POK and a WK are used simultaneously, so as to control both the production and the flow of movement of the materials [32].
Huang and Kusiak [23] present other types of withdrawal kanban that can be used in the conveyance of materials, according to the requirements of the organization, as shown in Table 1.
Many organizations reject or do not implement kanban because of their fears; they fear losing their control, fear that their employees would lack the ability, and fear being left without material, among others. The answer to these fears is to develop plans to solve these fears [33].

1.4. Cases on Kanban Implementation

For Louis [34], the implementation of kanban is divided into six categories. Each one is defined so that the company designs its own kanban system, with the options of the following categories:
  • Strategy for the construction of the final product.
  • Calculation of the kanban lot size.
  • Kanban containers, activation, and maintenance.
  • Reception, inspection, shipping, and handling of materials.
  • Operating the kanban in manufacturing.
  • Operate the kanban with suppliers.
In Adnan, et al. [35], the paper studied the implementation of the kanban system at a local auto-component company in Malaysia, and notes the activities of the establishment, such as:
  • Kanban flow design based on the operation of the company.
  • The collection of manufacturing data.
  • The calculation of the optimal number of kanbans.
  • The establishment of the extraction mechanism and the rules of use.
Lee-Mortimer [36] examines the control of production through the kanban system in an electronic company in the United Kingdom, and mentions that the application of kanban, combined with the participation of the employees, the treatment of cultural change, and training and training in the kanban system, generate benefits in the control of inventories.
However, in the revision of the literature cases of the implementation of kanban, no evidence was found regarding the relationship that exists in the implementation of the kanban system in the planning phase and the benefits.

1.5. Kanban Implementation Stages

The key to having an effective kanban system begins with understanding the needs of the organization’s environment, and then designing and implementing the appropriate kanban system to meet those needs [34]. Three stages are essential in the implementation of the kanban system, namely, the planning, implementation, and control.
In the planning stage, the guidelines are established, strategies are defined, and alternatives and courses of action are selected based on economic, social, and political objectives and goals, considering the availability of resources [37]. The lack of adequate plans leads to the failure of the objective, as mentioned by Luna and Bednarek [1].
In the kanban system implementation stage, care must be taken not to exaggerate the quantity of kanbans, as the smaller the number, the better; if there are too many kanbans, the information is no longer accurate [38]. This stage contains the activities for the design, programming, circulation, and improvement of kanbans [39].
The control stage performs audits of the kanban system to evaluate its effectiveness and to ensure its correct operation; in addition, it identifies the opportunities for continuous improvement [26]. Likewise, Maarof and Mahmud [40] mention that some of the most important activities have to do with the way in which companies document and keep information regarding implementation, as well as what measures they take after analyzing these reports.
The systematic and complete commitment to the implementation of the kanban system is crucial in order to guarantee its effectiveness and finally achieve customer satisfaction [35].

1.6. Planning for the Implementation of Kanban

Planning is the pillar in the implementation of a change in the production system [41]. Before and during the planning process, it is important that the organization clearly understands the goals, policies, and problems they face [42]. For Louis [34], the key to having an effective kanban system begins with understanding the needs of the specific environment of the organization, and then designing, applying, and adapting it to meet those needs.
For Burrows [43], the planning of the kanban system starts with the commitment and the preparation of the participants, places, tools, support material, and so on, which will be necessary. Meanwhile, Cimorelli [26] recommends the implementation of kanban as a formal project, by using project management tools such as a Gantt chart, lists of action items, analysis of gaps, among others.

1.7. Benefits of Implementing Kanban

All of the the lean manufacturing tools are applied in the industry in order to obtain a benefit, as otherwise, it would not be worth implementing them. Lee-Mortimer [36] mentions that the application of kanban generates profits in the control of inventories; in addition, kanban allows the reduction of the inventory to minimum levels, an increase in flexibility, and a reduction in the operating costs [35,44]. On the other hand, kanban is a tool to eliminate overproduction, thus helping the company to respond to the consumers’ demand, as well as coordinating the production of small lots in a wide variety of products [39]. Likewise, kanban offers a reduction in the waiting times and space used [26]. Kanban is an effective tool to support the continuous operation of a production system as a whole, and is an excellent way to promote continuous improvement [45].

1.8. Research Problem and Objective

Although the importance of kanban in the productive systems as well as its benefits have been extensively researched, there is currently no statistical evidence to help quantitatively determine the impact of the activities developed in the planning stage when implementing the kanban system, as well as the benefits obtained from it. Although the success obtained by kanban has been evidenced in countries around the world [46], there are also authors who mention factors that hinder its implementation (Sundar, Balaji and Kumar [15]; Rahman, Sharif and Esa [17]; Kumar and Panneerselvam [24]; Berkley [31]). Thus, the main objective of this article is to quantify the impact of the implementation of kanban, through the relationship between the planning activities and the benefits obtained by companies, so that the people responsible for the decision-making process can focus their attention in those that are most important.

2. Review of Literature and Hypothesis

Given that, in this investigation, only the planning for the implementation of kanban is reported, this stage is divided into other variables that represent it, such as human resources, preliminary analysis, and integration of kanban, as well as the activities prior to the implementation and design of the kanban system, and the operational benefits that are obtained.

2.1. Human Resources

The implementation of kanban is possible with the commitment of senior management, employees, and the involvement of suppliers [24]. In addition, top management must also create interest in the implementation, and communicate the changes within the organization when implementing kanban [47].
For the implementation of kanban, a multifunctional team is needed, which must include operators, material handlers, supervisors, material planners, and senior management, who will address the operational and logistical conditions of the kanban system [33]. In addition, a project leader must be assigned, who is trained in the implementation of the kanban system and has the confidence and support of senior management, as well as the support of the employees [26]. Together, the kanban system requires the commitment of the supplier in order to provide fast and effective services in the supply of raw materials [48].
The key to success when implementing kanban is to have clearly defined roles and responsibilities among human resources, but senior management must also ensure that the individual elements support the overall process [26]. Therefore, the commitment and positive relationship among the employees and senior management fosters an organizational culture that ensures the achievement of its objectives [17].
In addition, top management must design an adequate forming and training plan that provides knowledge of the advantages that can be obtained from the system that is being implemented, as well as knowledge of its weak points, in order to mitigate its drawbacks [49]. Therefore, senior management must participate actively in the planning of the training program, as it includes educational, administrative, economic, technical, and total collaboration of the components of the areas to which the program is being designed [50]. Kanban is an advanced visual control system and depends on the discipline and understanding that has grown since the implementation of 5’s. This tool includes a series of activities to identify problems and eliminate waste, which contributes to errors, defects, and injuries [26]. This is important, because if the areas involved do not have the discipline to keep the workplace organized, they will not have the discipline necessary to maintain a manual production control system [51].

2.2. Preliminary Analysis

The kanban system serves as a tool to regulate the material flow pattern that effectively links previous operations with subsequent operations [35]. These operations can be analyzed through the value stream mapping (VSM) technique, which integrates the flow of materials and information necessary to coordinate the activities carried out by manufacturers, suppliers, and distributors, for the delivery of products to clients [15].
The current VSM consists of a map that describes the initial conditions of a process and a future status map that defines the improved process [52]. A current VSM design is made with the original data of the production processes, identifying the times of each workstation; the piece flow map is shown to verify the movement of materials between the workstations, stocks, and metrics, which help to characterize the process and set some goals [53].
The VSM identifies sources of waste and helps to highlight improvements that can be applied in the production area [54]. A simulation tool in VSM is necessary in order to predict the inventory level in uncertainties demands, and to observe how the inventory can vary in different scenarios [55]. The kanban system consists of the control of the transformation and movement of materials, through the use of visual devices such as labels, cards, containers, and signs [56]. A visual factory creates the communication support between the real process and the employee in the system; therefore, everyone is aware of the conditions of production in real time [35].
Human resources (managers, leaders, and supervisors) support the standardized process as a multifunctional team allows for aligning efforts and building relationships among co-workers [57]. The VSM analysis reflects the current situation in the consumption of resources, namely, human, financial, temps, space, team, and so on, and shows a future condition that incorporates the improvements that are still to be made, so that those team members, usually with the help of an experienced facilitator, can identify improvements by questioning the current paradigms and by thinking creatively about how to improve the process [58]. Knowledge about the handling of materials, space requirements, and machinery is essential. A deficiency or lack of information results in a problem in the production rate, where operators must devote time to look for, wait, verify, and re-establish the work, thus producing a significant operational obstacle [59].
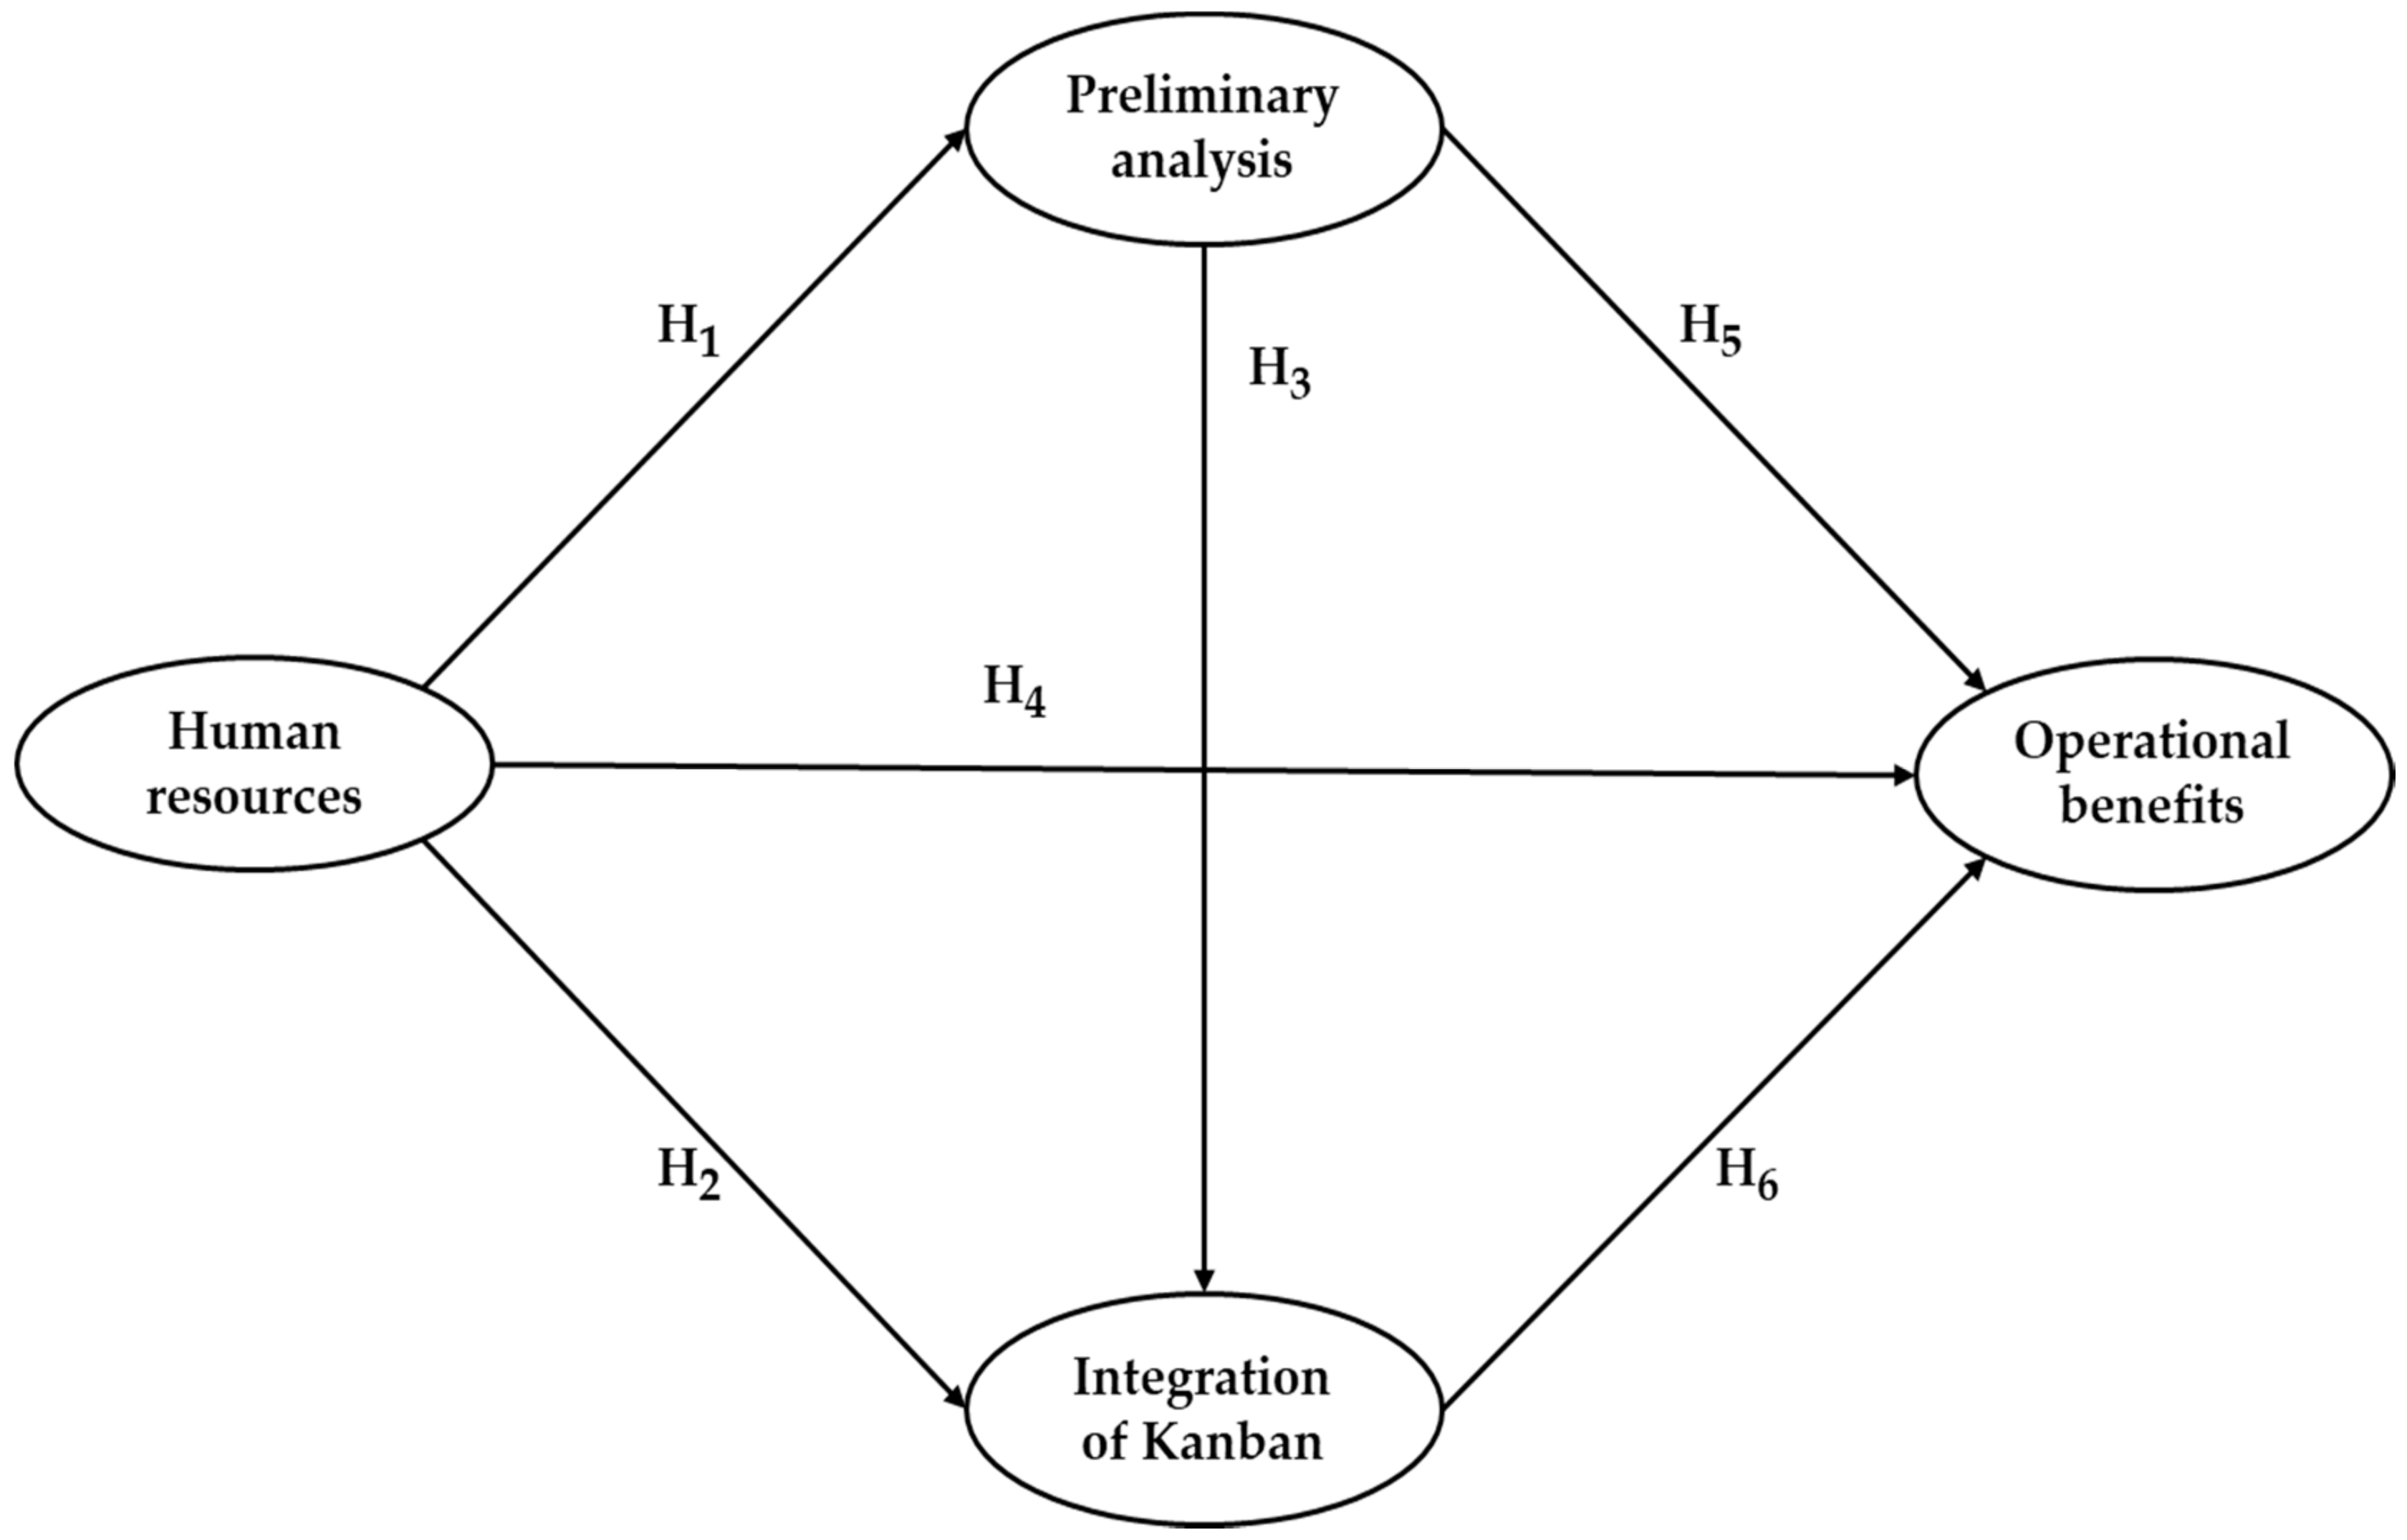
However, it is human resources, with their capabilities and abilities that perform the analysis of the environment and of the situation that the productive systems have; therefore, the following hypothesis is proposed:
Hypothesis 1 (H1). 
Human resources and their abilities and skills have a direct and positive effect on the Preliminary analysis of the productive system during the planning process of the kanban system.

2.3. Integration of Kanban

Kanban is known as a pull-type production control system [60]. This type of system achieves lower inventories and shorter production times than push systems [44].
In the pull system, the flow of material is replaced in the process at the same rate that it is consumed [25]. In addition, the process manufactures pieces only when the next process removes the pieces, performing the effect of pulling the parts only when necessary [26]; this communication between the processes is given through kanban [34]. For the design of the material flow, three criteria are considered, namely, the distance of the process, the method of operation, and the method to convey the information to determine the waiting point of the kanban in the flow [35].
The kanban team must manage the implementation by using a project calendar that describes the typical tasks, the sequence, and the duration; in addition, these must be adapted to the needs of the company [26], so a timeline and a budget for implementation should be included [33]. Likewise, a cost-benefit analysis is useful in the implementation of kanban [34], and a pilot area should be selected to demonstrate and evaluate the capabilities of kanban and the initial acceptance by the members of the company [61].
In addition, the kanban team should consider parameters such as the demand rate and processing time [62] in order to select the product where the implementation will begin, considering the volume of the components that are necessary for its manufacture [63]. The analysis by ABC is also taken into account, so as to estimate the costs of manufacturing the product [64] and the economic order quantity (EOQ) to produce a certain quantity of product, which minimizes the costs in the order size while the shortage situation is solved [33].
In the integration of kanban, the programming team will have regular meetings to evaluate the workflow and to determine whether the materials between the activities and the inventory limits should be modified [65]. Kanban principles include the following: visualizing workflow, limiting work in process (WIP), making explanatory policies, and recognizing process improvement opportunities [66]. Therefore, it is observed that the skills and abilities of human resources are responsible for carrying out the integration of kanban, so the following hypothesis is proposed:
Hypothesis 2 (H2). 
The skills and abilities of human resources have a direct and positive effect on the integration of kanban in the planning process.
However, depending on the state of the production systems, which is determined by the preliminary analysis, the integration of kanban is planned with the other lean tools, methodologies, and techniques that are already established. One of these analyses refers to the cost-benefit of the changes proposed in the future status map, when applying the kanban technique [53], so the next hypothesis is proposed as follows:
Hypothesis 3 (H3). 
The preliminary analysis of the productive system has a direct and positive effect on the integration of kanban in the planning process of it.

2.4. Operating Benefits

The main benefits of implementing the kanban system are divided into two, namely the precision benefits, where the kanban system is a mechanism to manage and control the flow of material, emphasizing the minimum level of inventory through the provision of the correct parts, in the right amount and at the right time [35]; and, on the other hand, the economic benefits, which are reflected by reducing the delivery time, transportation, reprocessing, and defects [26], as well as by increasing the flexibility [67].
By implementing a kanban system, the workers are directly involved in the transformation, causing an increase in participation, commitment, and communication [68]. In addition, kanban reduces the need for labor to track the demand and inventory in the organization, therefore improving the communication with the supplier [69]. Based on the above, the following hypothesis is put forward:
Hypothesis 4 (H4). 
The capabilities and abilities of human resources have a direct and positive effect on the operational benefits obtained when implementing the kanban system.
VSM allows for improvements through kanban by identifying the problems of production flow, inventory synchronization, and material flow between the production operations [53,70]. In addition, it minimizes the excessive movement of workers and allows for the easy identification of parts in the process [71]. However, the cost-benefit analysis that is done at the beginning is what allows us to identify the current situation and plan the benefits obtained, so the following hypothesis is proposed:
Hypothesis 5 (H5). 
The preliminary analysis of the productive system has a direct and positive effect on the operating benefits obtained when planning the implementation of the kanban system.
By integrating the pull system through the kanban cards, the inventory in the process is reduced and the cycle time is minimized; furthermore, the input of raw material becomes shorter, so that the creation of a defect is detected early, resulting in improvements in quality [72]. Likewise, an optimal inventory level decreases the product delivery times by effectively using resources such as people, machines, and so on [15], where the end result is a more efficient system with lower costs [73]. The above shows that kanban is not a system that operates in isolation in the production system, but that it must be integrated with the techniques and tools that have already been established, where it must offer and receive support for its proper execution, so the following hypothesis is proposed:
Hypothesis 6 (H6). 
The integration of kanban in the productive system, with other techniques and tools already applied, has a direct and positive effect on the operational benefits obtained.
A graphical representation of the hypotheses above is illustrated in Figure 1.

3. Methodology

The methodology for this research is based on the analysis of data, which are explained in the following paragraphs.

3.1. Construction of the Questionnaire

A literature review is conducted to identify kanban’s Critical Success Factors (CSFs) and their benefits. There are 43 activities and 11 benefits identified in the implementation of the kanban system. With them, the questionnaire is divided into five sections. The first section includes the demographic data of the company and the general data of the respondent. The next section includes the 22 items corresponding to the planning stage; then, the eight items associated with the implementation; then, the control section with six items; and, finally, the section with the benefits obtained, with 11 items included. In the same way, the 43 activities of the questionnaire were divided into seven latent variables, and the 11 benefits formed two latent variables.
However, only the items that make up the planning stage have been analyzed in this investigation, which have been identified from a literature review, as indicated below.
For the latent variable human resources, composed of eight items identified in the literature, illustrated in Table 2, the most important thing is the application of the 5’s technique and to assign responsibilities as it has nineteen references.
For the preliminary analysis of the productive system, integrated by eight items, shown in Table 3, it is observed that, according to the literature review, the most important thing concerning this variable is the analysis of the demand, the handling of material, and the kanban flow diagram.
For the variable integration of kanban, which is integrated by six items, shown in Table 4, the most important thing is the kanban schedule, the pull system, and cost-benefit analysis.
For the variable operational benefits, which is composed of 11 items, shown in Table 5, it is observed that the most important benefit is to minimize the inventories and achieve a greater accuracy of orders.
These items are integrated into a questionnaire, which must be answered by using the Likert scale, which includes values between 1 and 5 [78]. The values of the scale are shown in Table 6, and answers the following questions: “How important are the following activities during the implementation of the kanban system?”, and with respect to the benefits, “What is the level of benefit obtained after implementing the kanban system?”

3.2. Application of the Questionnaire

The application of the questionnaire is developed through the database of the National Statistical Directory of Economic Units (DENUE, for its acronym in Spanish), belonging to the National Institute of Statistics and Geography (INEGI, for its acronym in Spanish), from which the manufacturing companies with more than 30 employees (all of them in the state of Baja California, Mexico) were identified. The consultation took place in October 2016, and it should be mentioned that the municipality of Playas de Rosarito was not considered, because it had only 10 companies registered with the described characteristics.
Three different strategies were used for the application of the questionnaire; one of them was to electronically send the data obtained from DENUE. Another strategy that was used was sending through the support of associations such as the National Chamber of the Transformation Industry (CANACINTRA, for its acronym in Spanish) and the National Chamber of Commerce (CANACO, for its acronym in Spanish). In-person visits were also made to the companies to inform them about the interest of the investigation, by physically leaving the survey and collecting the results in the following days. For the questionnaires that were answered electronically, the Google Drive Forms application was used, and the physically applied ones were captured manually.

3.3. Creation and Debugging of the Database

With the information from the questionnaires, a database was designed in the SPSS 23® software. This software was used for the debugging of the data, identifying the questionnaires with duplicate answers, and identifying the lost values and replacing them with the median [79,80,81].
Once the database was been debugged, two types of analysis were performed in the same software, namely a descriptive analysis of the data and a reliability analysis of the latent variables to detect the underlying variables, which are described in the following paragraphs.

3.4. Descriptive Analysis of the Sample and Items

The descriptive analysis of the sample was done through tables to appreciate the behavior of the data and to represent the information in an orderly manner, in a categorical way, and to quickly identify characteristics in the behavior of the data [82,83]. This analysis is done with the use of demographic information.
In the analysis of the items, the median is used as a measure of the central tendency, given that the data were obtained on an ordinal scale. High values of the median indicate that this activity is very important for the respondents, or that the benefit is always obtained, while low values indicate that this activity is not important for the respondent or that the benefit is not obtained. As a measure of dispersion, the interquartile range (IR) was used, which is the difference between the third and first quartile, where the high values indicate a lower consensus among the respondents, and the low values indicate a consensus among them in relation to an activity or benefit.

3.5. Validation of Latent Variables

Several indexes were used to validate the latent variables that are integrated into the model, among which are the following:
  • The Cronbach’s alpha index for internal validity and content. Values greater than 0.70 [84,85,86,87] are accepted.
  • The composite reliability coefficient is also known as the Rho coefficient of Dillon–Goldstein [88]. It is an alternative reliability measure and measures the internal validity of the content. Values greater than 0.7 are accepted [89].
  • The average variances extracted (AVE) is used in the evaluation of discriminant validity, and values greater than 0.5 are accepted [89].
  • Full collinearity variance inflation factors (VIF) are provided to measure global collinearity, and values less than 3.3 are preferred [89].
  • The adjusted R-squared and R-squared coefficient reflect the percentage of variance explained and measure the parametric predictive validity, and values greater than 0.02 are preferred [89].
  • The Q-squared coefficient is used as a non-parametric measure of predictive validity. It is often similar in value to the measure of R-squared. If its value is greater than zero, then it is considered a good validity [89].

3.6. Model Evaluation

To evaluate the model of the structural equations of Figure 1, the partial least squares regression technique was used, since it has been used in similar works [90,91,92,93,94].
According Lomax and Schumacker [95], structural equation modeling is becoming popular because researchers are becoming more aware of the need to use multiple observed variables, as the use of a small number of variables to understand complex phenomena is limiting, and greater recognition is given to the validity and the reliability of the observed scores from the measurement instruments. Thus, it increases the ability to analyze more advanced theoretical SEM models, with the interaction terms included so that the main effects and interaction effects can be tested.
On the other hand, limitations of the structural equation model, presented by Ruiz, et al. [96], are as follows: It is questioned whether the conceptually central models lack significant effect, because a model with a good fit does not exclude that there may be other tentative models that can also be well adjusted to the data, because of the theoretical model with all of the parameters and variables proposed, as well as the final model which only contains the different parameters of zero and the variables with statistical effect significant. This type of model supports few variables (10–20) and recommends estimates with larger samples of up to 100 subjects. The abuse of adjustment and readjustment of the possible theoretical relationships, including and excluding the effects and variables, makes it advisable to maintain a certain skepticism when a study does not report in detail the manipulations that have suffered the data and the model. One should not use categorical variables, however, we have frequently used questions in the format of the ordinal Likert-type questionaire, in order to measure the subject in a manner that involves them responding at their own ease [97]. Specific applications are applied in Vinodh and Joy [98], with the purpose of analyzing lean manufacturing practices and identifying the critical factors for their implementation in different companies of Tamil, India. It was also used by Youssef, et al. [99], for the purpose of examining the relationship between the intensity levels of the JIT practices and the manufacturing flexibility, based on more than 212 manufacturing companies in three industry sectors in the United States of America. In Ciudad Juárez, Chihuahua, México, this technique has been used in studies by García-Alcaraz, et al. [100], where 31 advantages or benefits in the JIT implementation integrated to four dimensions are analyzed, namely, the human resources, production process, inventory management, and economic performance of the companies.

3.7. Evaluation of the SEM Model

The SEM model was designed based on the variables that were validated for the planning stage, and the specialized software for SEM, called WarpPLS 5.0®, was used. This software uses algorithms based on partial least squares regression (PLS), which is recommended for small samples [89].

3.8. Validation of the Model and Its Effects

To evaluate the SEM, three quality and global adjustment indexes were obtained, which are as follows: average path coefficient (APC), the average R-squared (ARS), and the inflation factor of the average variance of blocks (AVIF). For the APC and ARS, the values of p were analyzed to determine the efficiency of the model, and to establish a cut-off value of p ≤ 0.05. The null hypothesis that was tested was that APC and ARS were equal to zero, contrary to the alternative hypothesis, where APC and ARS were different from zero. The AVIF index measure the collinearity phenomenon among the underlying variables, and the ideal value is less than 3.3; however, 5 is the maximum acceptable value [89].
In the model of Figure 1, three types of effects were evaluated among the variables, as follows:
  • The direct effects that represent the hypotheses proposed. The null hypothesis is tested, where the value of β = 0, versus the alternative hypothesis where β ≠ 0. Logically, for a relationship between the latent variables to be statistically significant, the regression parameter must be different from zero. It is important to mention that the statistical tests were performed with 95% confidence, so the p values that were associated with the regression parameters must be less than 0.05.
  • The indirect effects, which make use of mediating variables, have two or more segments. This analysis is important, as many times, the direct effects between the variables are statistically not significant, but the indirect effects are.
  • The total effects represent the sum of the direct and indirect effects. In the same way, use is made of the sizes of the effects to decompose the values of the R-squared method, and to be able to determine the independent variables with a greater predictive power in the latent dependent variable.

4. Results

Next, the results that were obtained in each of the phases of the aforementioned methodology are presented.

4.1. Descriptive Analysis of the Sample

We collected 118 surveys that were distributed geographically, as follows: 57 in Tijuana, 6 in Mexicali, 10 in Tecate, and 45 in Ensenada. Out of the 118 surveys, 16.9% belong to the automotive industry, followed by the electronics sector with 16.1%, which together represent 33% of the surveys, and their distribution is shown in Table 7. In addition, 77.12% of the companies surveyed are large in size, with more than 251 employees.
The results on the position of the respondents in the company indicate 72 production line supervisors, followed by 36 managers/head of departments, which together represent 91.53% o the resondants, indicating that the respondents were mostly people who have knowledge and power in making decisions along the production line of the company. Only 10 surveys were answered by operators.

4.2. Statistical Analysis of the Items

As previously discussed, the survey is answered with a five-point Likert scale for subjective assessments. As this is an ordinal scale, the median was considered as the measure of the central tendency of the following items: high values indicate a consistency in the importance of the activity and low values indicate that not all must be carried out to guarantee the benefits.
The measure of data dispersion estimated was the interquartile range (IQR), is the difference between the upper and the lower quartiles. High values imply great dispersion of data, and thus little consensus among respondents regarding the median value of an item and low values are desired, as they reveal a consensus among survey respondents regarding the median value of an item. For instance, if the IQR value of an item is 0, it means that all of the respondents rated the value equally [101]. The median and the IQR were calculated in Excel Office® software for each variable, and the results are shown below.
Table 8 shows the descriptive analysis of the eight items analyzed for the variable human resources. The items appear ordered from highest to lowest, according to the value of the median, where it is observed that the most relevant items were “Train each one of those involved” and “Assignment of responsibilities”, as they had the highest median, with 4.72 and 4.51, respectively, and coincided with the least amount of variance. Furthermore, the item “Creation of a kanban team” is the least notable, as it only has 4.23 and corresponds to the greatest amount of variance with 1.58. However, in general terms, it is observed that all of the items have medians greater than four, which indicates that they are important activities for the respondents in the kanban planning stage.
With respect to the preliminary analysis variable, the eight items that integrate it are shown in Table 9, and appear ordered from highest to lowest, according to the value of the median. It is observed that the most relevant items are “Calculate space requirements” and “Develop visual aids”, given that they have a value of 4.54 and 4.48, respectively, and they coincide with the least amount of variance. While the item “Develop a future value chain” is the least notable, with a median value of 4.23, which corresponds to the greatest amount of variance, with 1.48. However, it is observed that all of the activities are important for the respondents, as all of them have a median greater than four.
On the other hand, the variable integration of kanban with six items is shown in Table 10, ordered from the highest to lowest, according to the value of the median. It is observed that the most relevant items are “Adopt pull systems” and “Develop a calendar with implementation activities”, given that they have a value of 4.50 and 4.40 in their median, respectively, and coincide with the least amount of variance. Meanwhile, the item “Integrate kanban with MRP II“ is the least notable, with a median value of 3.92, which corresponds to the largest amount of variance with 1.52. Note that this is the only item with a median of less than four and may be because of the fact that it is considered trivial in this type of industry.

4.3. Validation of the Latent Variables

Table 11 shows the validation of the latent variables analyzed (activities and benefits), and according to the presented values, it is observed that the internal validity of these is acceptable, given that the Cronbach’s alpha value is greater than 0.7 in all of them. In addition, the AVE values are greater than the minimum cutoff value of 0.5 in all of the variables, so it is concluded that they have discriminant and convergent validity.
Table 12 shows that the R-squared values for each latent dependent variable are acceptable, because all of the values are greater than 0.2. In addition, although there is no general agreement on the maximum value that can be measured in VIF for collinearity, it is observed that all of the values are less than five, which means that there are no problems of collinearity between the latent variables. On the other hand, the Q-squared statistical value for each latent dependent variable is greater than zero, so the nonparametric predictive validation is acceptable.

4.4. Model Evaluation

Given that the latent variables have proved to be sufficiently validity, they are integrated into the model and the efficiency indexes used are APC, ARS, and AVIF, whose results are illustrated in Table 12.
The APC index shows that the average of the coefficients of the betas is 0.402, with a p value of ≤0.001, which indicates that it is significant and different from zero. The ARS index shows that the average of the sum of the R-squared regression coefficients is 0.601, as well as a p value of ≤0.001, so it is also significant and different from zero. On the other hand, the AVIF index has a value of 3.055 and is acceptable, because it is less than 3.3. The model evaluated is illustrated in Figure 2, where the values of the β and its associated value, p, are indicated, as well as the value of R-squared in the dependent latent variables.

4.4.1. Direct Effects

The direct effects allow for validating the hypotheses proposed in Figure 1, so, based on the results illustrated in Figure 2, the following is concluded:
H1. 
There is sufficient statistical evidence to indicate that human resources and their abilities and skills have a direct and positive effect on the preliminary analysis of the productive system during the planning process of the kanban system, as, when the first latent variable increases its standard deviation, the second does it by 0.762 units.
H2. 
There is enough statistical evidence to indicate that the skills and abilities of Human resources have a direct and positive effect on the integration of kanban in the planning process of the system, given that when the first latent variable increases its standard deviation, the second does so by 0.485 units.
H3. 
There is enough statistical evidence to indicate that the Preliminary analysis of the productive system has a direct and positive effect on the integration of kanban in the planning process, as, when the first latent variable increases its standard deviation, the second does so by 0.418 units.
H4. 
There is not enough statistical evidence to indicate that the skills and abilities of human resources have a direct and positive effect on the operational benefits obtained in the planning of the kanban system, as the associated p value is less than 0.05.
H5. 
There is enough statistical evidence to indicate that the preliminary analysis of the productive system has a direct and positive effect on the operational benefits obtained when planning the implementation of the kanban system, given that when the first latent variable increases its standard deviation, the second does so in 0.508 units.
H6. 
There is sufficient statistical evidence to indicate that the integration of kanban in the productive system with other techniques and tools, once applied, have a direct and positive effect on the operational benefits obtained, given that when the first latent variable increases its standard deviation, the second does so in 0.164 units.

4.4.2. Size of the Effects

Table 13 illustrates the sizes of the effects, which are a decomposition of the variance extracted in the dependent latent variables, and based on the results obtained there, therefore, the following is concluded:
  • The preliminary analysis variable is explained by 58.1%, by human resources.
  • The integration of kanban variable is explained by 72.1%, from which human resources explains 39.1% and preliminary analysis 33%.
  • The operational benefits variable is explained by 51.2%, from which human resources explains only 5%, preliminary analysis 35.7%, and the integration of kanban 10.5%.
According to the results obtained, it is concluded that the variable that is most explained in the model is the integration of kanban, by 72.1%; in addition, the influence of human resources can be observed in activities such as the creation of a kanban team, naming a leader, forming and training for operators, as well as the support of top management, which influences 39.1% in the integration of kanban; the preliminary analysis influences 33%, which indicates that the influence of activities such as a VSM, the management of material, the components of the machinery, and the visual aids also support the integration of the kanban system.
The next variable is the preliminary analysis, which is explained by 58.1% for the variable human resources, showing the importance of forming and training, in addition to previous activities, such as the 5’s and rebalancing, which are essential for the flow and handling of necessary materials in a kanban system, coinciding with Singh, Garg and Sharma [70].
For the operational benefits, explained by 51.2%, the most important variable is the preliminary analysis, as it explains it by a 35.7%, which indicates that the benefits of kanban have greater influence in activities such as VSM, visual aids, and flowchart kanban, which are similarities found by Adnan, Jaffar, Yusoff and Halim [35]. The operational benefits are also explained, to a lesser extent, by the variable integration of kanban by 10.5%, however, in the model, it is observed that human resources do not have a direct effect on the operational benefits, however their impact is given through the variables preliminary analysis and integration of kanban.

4.4.3. Indirect Effects

In the model, there are indirect effects of two and three segments, which is the path that includes two or three latent variables that influence one another. Table 14 shows the results for the sum of the indirect effects and its respective effect size (ES).
The indirect relationship between human resources and the integration of kanban results in an effect, β = 0.318, with a p value < 0.001, which is significant and is given through the variable preliminary analysis. That is to say, it is human resources that performs the preliminary analysis and then executes the integration of all of the resources.
It is the same case for the human resources and operational benefits relationship, where a direct statistically significant relationship was not found; however, the indirect relation has an effect of β = 0.519 and the p value is <0.001, which seems to make no common sense.
All of the contrary occurs with the indirect relationship of the preliminary analysis and the operational benefits, where there is statistical evidence of a direct effect; however, the indirect effect is not statistically significant between the variables with a value of β = 0.068 and a p value = 0.143.

4.4.4. Total Effects

The direct effects are associated with all of the latent variables that are linked through one or more routes, with more than one segment. Figure 2 shows the direct effects that there are between the dimensions analyzed; however, there are the indirect effects between the factors, which in turn allow for obtaining the total effects, which are shown in Table 15.
Shown as an example, the total effect between the human resources on the integration of kanban variable is obtained by adding the direct and indirect effect (0.485 + 0.318) = 0.803, with a p value less than 0.05, statistically concluding that there is a significant total effect between the variables. The calculation of the other total effects is carried out in the same way, and it should be mentioned that the p value for the other relationships between the factors is less than 0.05; therefore, all of the total effects are statistically significant.
It is worth mentioning that human resources do not have a direct effect among the operational benefits, however, through the preliminary analysis and integration of kanban, there is an indirect effect that is significant as an indirect and total effect.

5. Conclusions and Industrial Implications

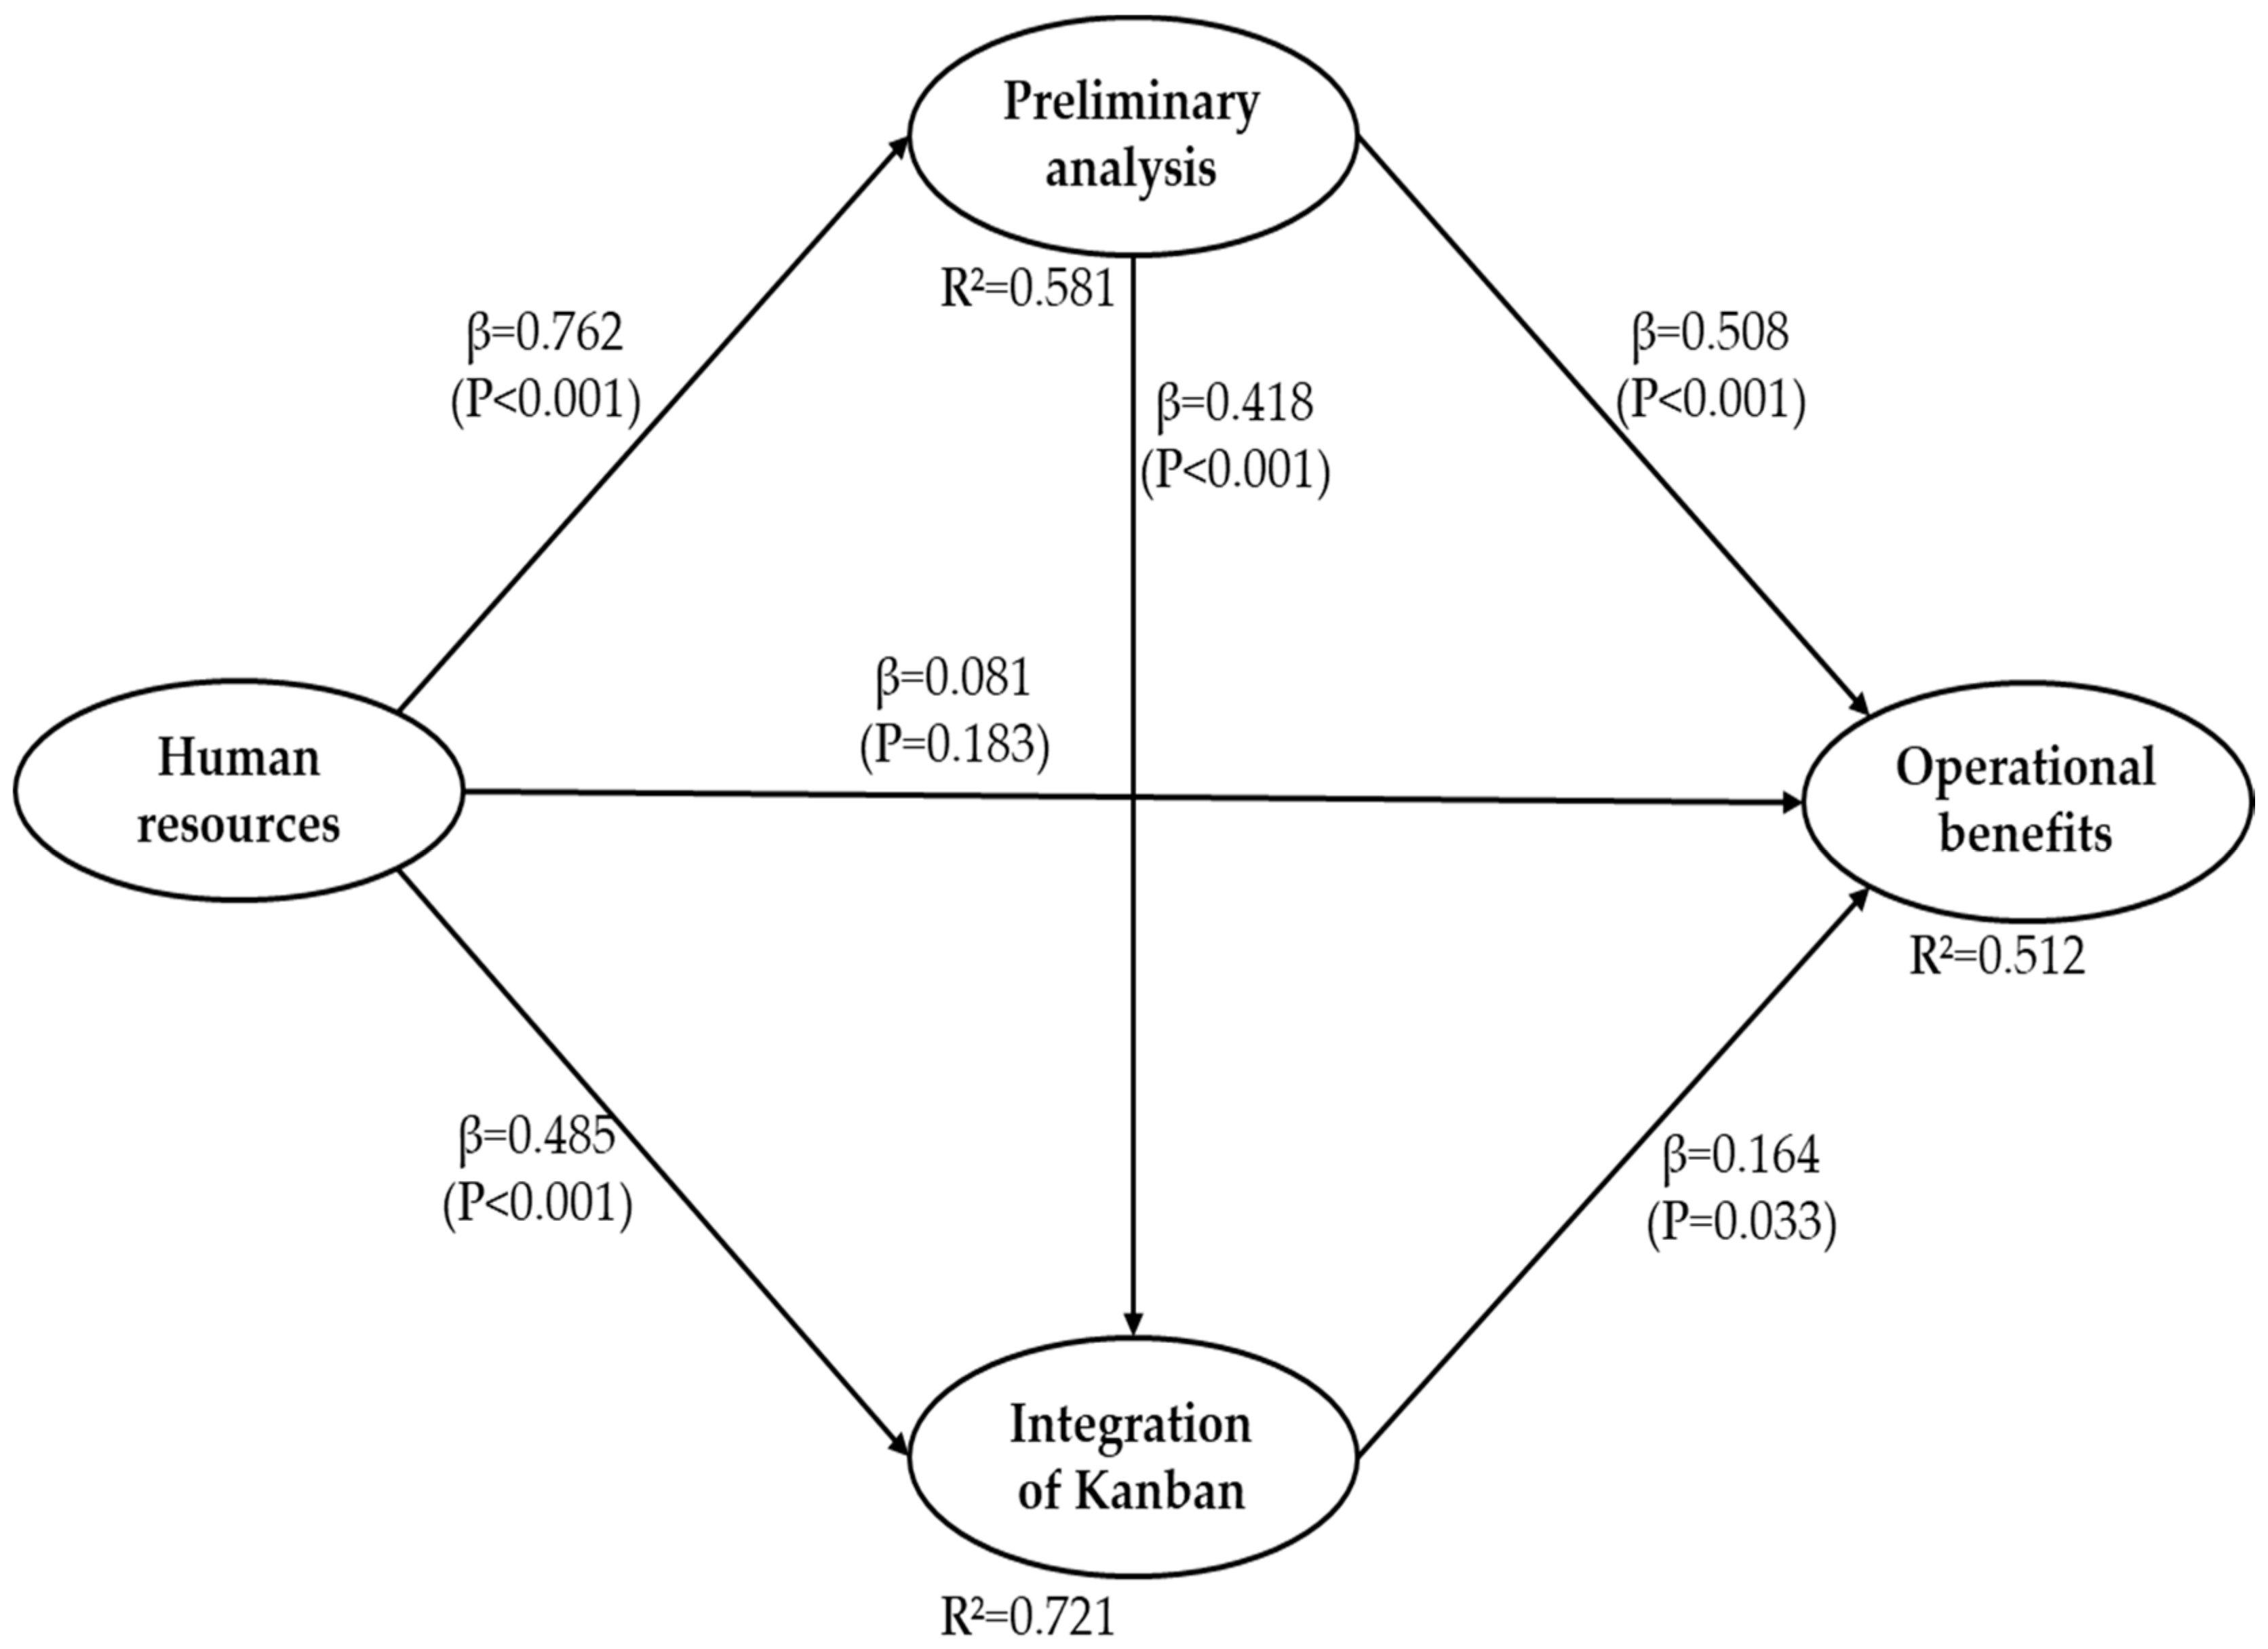
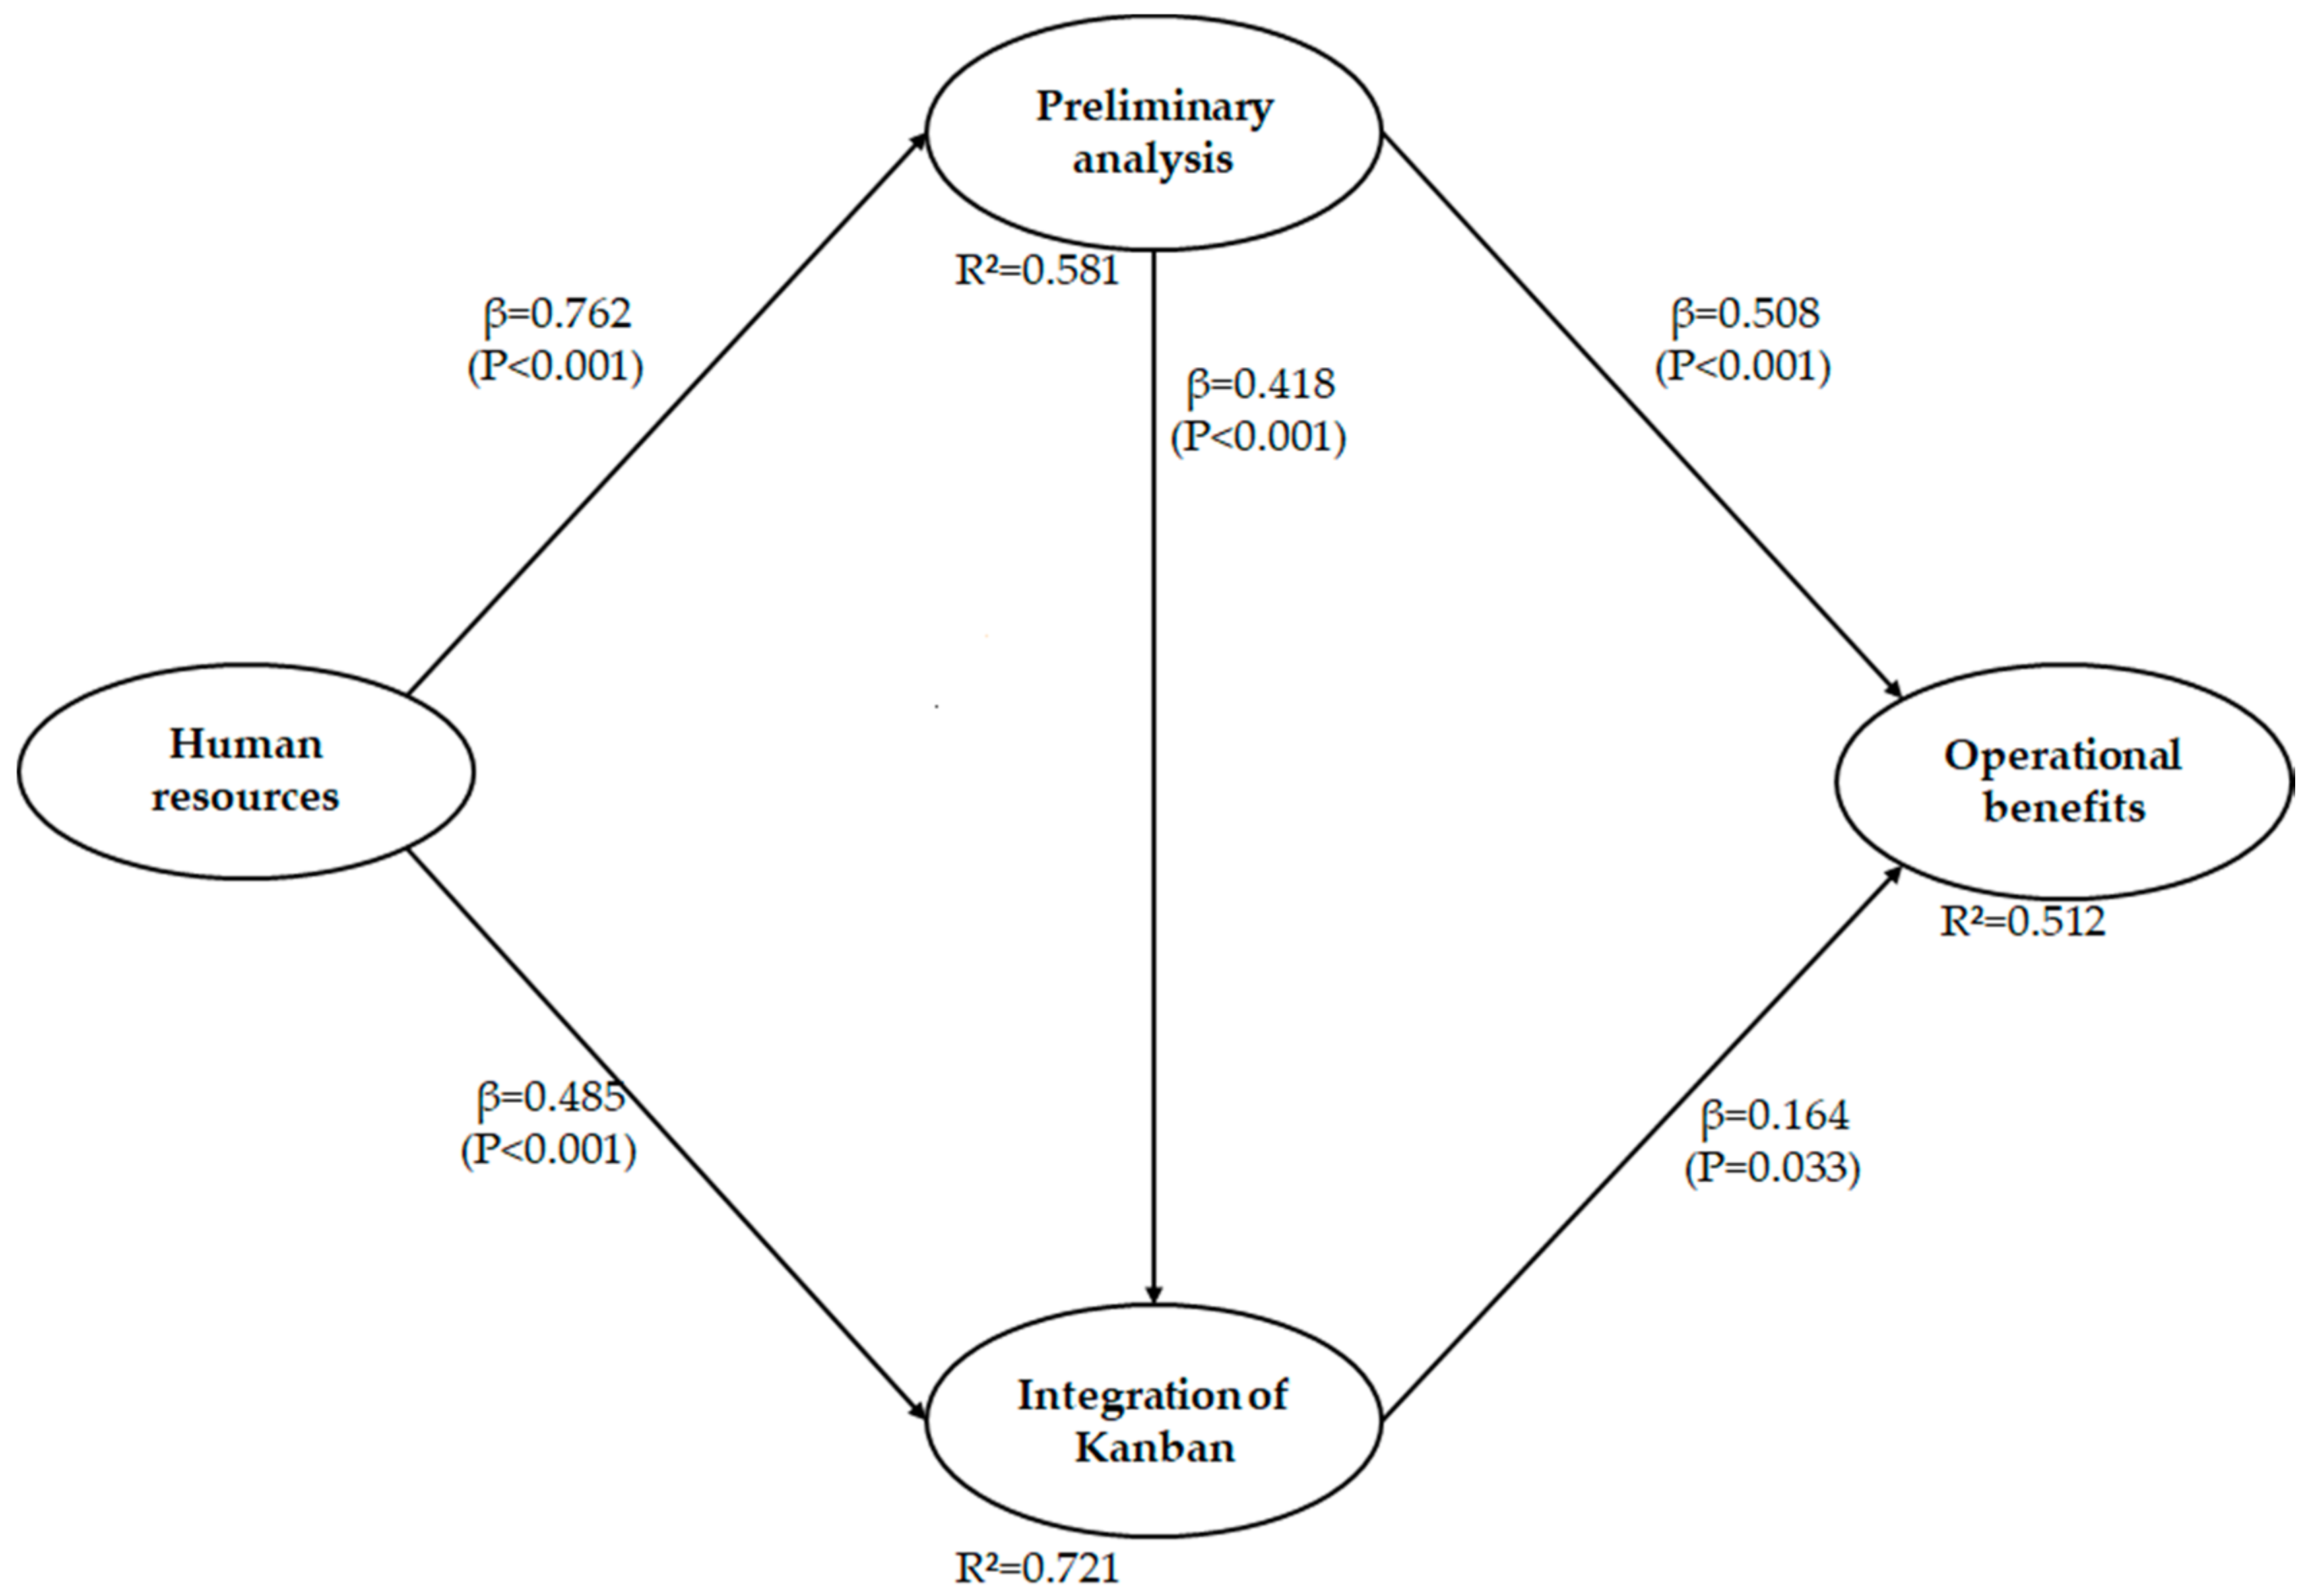
With the obtained results, the objective of quantifying the impact of the relationships between the planning activities and the obtained benefits is achieved. The Figure 3 shows the proposed final model eliminating the H4 hypothesis, which represents the relationship between human resources and operating benefits, because it is statistically not significant.
Also, Table 16 shows a summary of the six hypotheses proposed, with which it can be concluded that, in this work, it was found that the manufacturing companies in Baja California, Mexico, should pay attention to the kanban planning activities, as they affect the operational benefits that are obtained, that is, planning plays a very important role for the implementation of kanban in an organization, as it allows one to foresee the best possible implementation scenarios and the previous tools that should be considered, as well as the proper use of resources in order to achieve a successful implementation.
Within the planning of the kanban system, it was found that human resources directly affect the preliminary analysis, which implies that management must train and commit their work team; invest in hard training staff to manage, schedule, and monitor the kanban; and it must be able to perform a demand analysis to respond to market fluctuations. They must also be trained in previous tools, such as 5’s and VSM, giving greater confidence so as to solve the existing needs of the productive processes.
It was also found that the human resources variable directly affects the integration of kanban variable through the implementation of the pull system and the scheduling of activities that must be carried out by the work team.
Regarding the operational benefits, it was found that the preliminary analysis is the variable that most affects the elimination of waste, obtaining the reduction of inventory costs, flexibility, predictability in orders, reduction of time waiting, and improvements in the process, propitiating a competitive advantage for the organization. In the same sense, it was found that the company must take into account the variable of integration of kanban, as it directly affects the operational benefits, which means that the cost-benefit analysis promotes the best use of resources during the implementation.
Although the results indicate that the company must take into account that the variable human resources does not directly affect the operational benefits, it is observed that there are strong indirect effects on the variables of preliminary analysis and integration of kanban, which indicates that, if no in depth analysis is made of the productive system, and without a holistic and integrating vision being held by the company’s personnel, the results obtained cannot be guaranteed.
On the other hand, regarding sustainable impact, Faulkner and Badurdeen [102] mention that sustainability is the ability to maintain the benefits expected by shareholders, to manufacture without harming the environment, and to improve the quality of life of the interested parties. Elkington [103] also defines sustainability as the balance of the economic, social, and environmental dimensions, mentioned by Helleno, et al. [104] as the concept of triple bottom line (TBL).
Thus, the economic sustainability points to the decision making in the present, which will make the company prosper in the future [105]. In this sense, the reduction of the WIP level can be obtained by balancing the time and the efficiency of the operations when implementing kanban systems [104]. In addition, kanban can be applied to the management of the environment, which allows an efficient flow of materials, a shortened delivery time, and a minimum waste of time [106,107,108].
Therefore, based on the results of the model, it is recommended that before starting a kanban system implementation program, the planning stage should be established, and that within it, the integration between human resources and the variable of preliminary analysis should be encouraged, as well as human resources and the integration of kanban, as they are the strongest relationships that have been found for the successful and sustainable implementation of the kanban system. Supporting the idea that the cultural change of the company should be promoted, should be done by focusing on continuous improvement, as suggested by (Bortolotti, Boscari and Danese [46], García, et al. [109]).

Author Contributions

The six authors all participated in this manuscript. C.C.-W. made the questionnaire design and validation. R.J.P.-L. and J.E.O.-T. made the data analysis. M.M.-M. and J.L.G.-A. developed the methodology and the validation of the structured equation model. M.M.-M. and J.A.L.-B. made the final revision of the document and the corrections.

Funding

This research received support from the Program for Professional Teacher Development (PRODEP).

Acknowledgments

The authors acknowledge the Mexican National Council for Science and Technology (CONACYT).

Conflicts of Interest

The authors declared no conflict of interest.

References

  1. Luna, L.F.N.; Bednarek, M. Metodología para implantar el sistema de manufactura esbelta en PyMES industriales mexicanas. Ideas CONCYTEG 2010, 5, 65. [Google Scholar]
  2. Gupta, S.M. Lean Manufacturing, Green Manufacturing and Sustainability. J. Jpn. Ind. Manag. Assoc. 2016, 67, 102–105. [Google Scholar]
  3. Wahab, A.N.A.; Mukhtar, M.; Sulaiman, R. A conceptual model of lean manufacturing dimensions. Procedia Technol. 2013, 11, 1292–1298. [Google Scholar] [CrossRef]
  4. Rivera Cadavid, L. Justificación conceptual de un modelo de implementación de Lean Manufacturing. Heurística 2013, 15, 91–106. [Google Scholar]
  5. Robinson, S.; Radnor, Z.J.; Burgess, N.; Worthington, C. SimLean: Utilising simulation in the implementation of lean in healthcare. Eur. J. Oper. Res. 2012, 219, 188–197. [Google Scholar] [CrossRef] [Green Version]
  6. Wellman, J.; Jeffries, H.; Hagan, P. Leading the Lean Healthcare Journey: Driving Culture Change to Increase Value; CRC Press: Boca Raton, FL, USA, 2016. [Google Scholar]
  7. Sánchez, A.M.; Pérez, M.P. Lean indicators and manufacturing strategies. Int. J. Oper. Prod. Manag. 2001, 21, 1433–1452. [Google Scholar] [CrossRef]
  8. Posada, J.G.A. Interacción y conexiones entre las técnicas 5s, SMED y Poka Yoke en procesos de mejoramiento continuo. Rev. Tecnura 2007, 10, 139–148. [Google Scholar]
  9. Shah, R.; Ward, P.T. Lean manufacturing: Context, practice bundles, and performance. J. Oper. Manag. 2003, 21, 129–149. [Google Scholar] [CrossRef]
  10. Liker, J.K. The Toyota Way; Esensi: Ciracas, Indonesia, 2004. [Google Scholar]
  11. Villaseñor Contreras, A.; Galindo Cota, E. Manual de Lean Manufacturing, Guía Básica; Editorial Limusa: Mexico City, Mexico, 2007. [Google Scholar]
  12. Eswaramoorthi, M.; Kathiresan, G.; Prasad, P.S.; Mohanram, P. A survey on lean practices in Indian machine tool industries. Int. J. Adv. Manuf. Technol. 2011, 52, 1091–1101. [Google Scholar] [CrossRef]
  13. Stone, K.B. Four decades of lean: A systematic literature review. Int. J. Lean Six Sigma 2012, 3, 112–132. [Google Scholar] [CrossRef]
  14. Unver, H.O. An ISA-95-based manufacturing intelligence system in support of lean initiatives. Int. J. Adv. Manuf. Technol. 2013, 65, 853–866. [Google Scholar] [CrossRef]
  15. Sundar, R.; Balaji, A.; Kumar, R.S. A review on lean manufacturing implementation techniques. Procedia Eng. 2014, 97, 1875–1885. [Google Scholar] [CrossRef]
  16. Hartini, S.; Ciptomulyono, U. The relationship between lean and sustainable manufacturing on performance: Literature review. Procedia Manuf. 2015, 4, 38–45. [Google Scholar] [CrossRef]
  17. Rahman, N.A.A.; Sharif, S.M.; Esa, M.M. Lean manufacturing case study with Kanban system implementation. Procedia Econ. Finance 2013, 7, 174–180. [Google Scholar] [CrossRef]
  18. Malik, S. How to implement Just-in-time in small scale industry. Int. J. Res. Eng. Appl. Sci. 2012, 2, 63–65. [Google Scholar]
  19. García, A.J.L.; Maldonado, A.A.; Iniesta, A.A.; Robles, G.C.; Hernández, G.A. A systematic review/survey for JIT implementation: Mexican maquiladoras as case study. Comput. Ind. 2014, 65, 761–773. [Google Scholar]
  20. Ohno, T. El Sistema de Producción Toyota: Más Allá de la Producción a Gran Escala; Gestión: New York, NY, USA, 1991. [Google Scholar]
  21. Becker, R.M. Lean manufacturing and the Toyota production system. In Encyclopedia of World Biography; Gale Research: Detroit, MI, USA, 1998. [Google Scholar]
  22. Akturk, M.; Erhun, F. An overview of design and operational issues of kanban systems. Int. J. Prod. Res. 1999, 37, 3859–3881. [Google Scholar] [CrossRef] [Green Version]
  23. Huang, C.-C.; Kusiak, A. Overview of kanban systems. Int. J. Comput. Integr. Manuf. 1996, 9, 169–189. [Google Scholar] [CrossRef]
  24. Kumar, C.S.; Panneerselvam, R. Literature review of JIT-KANBAN system. Int. J. Adv. Manuf. Technol. 2007, 32, 393–408. [Google Scholar] [CrossRef]
  25. Carreras, M.R.; García, J.L.S. Lean Manufacturing. La Evidencia de Una Necesidad; Ediciones Díaz de Santos: Fernandez, Spain, 2010. [Google Scholar]
  26. Cimorelli, S. Kanban for the Supply Chain: Fundamental Practices for Manufacturing Management; CRC Press: Boca Raton, FL, USA, 2013. [Google Scholar]
  27. Junior, M.L.; Godinho Filho, M. Variations of the kanban system: Literature review and classification. Int. J. Prod. Econ. 2010, 125, 13–21. [Google Scholar] [CrossRef]
  28. Al-Tahat, M.D. Optimizing of work in progress (WIP) in Kanban controlled production lines. Dirasat Eng. Sci. 2010, 32, 123–132. [Google Scholar]
  29. Ahmad, M.O.; Markkula, J.; Oivo, M. Kanban in software development: A systematic literature review. In Proceedings of the 2013 39th Euromicro Conference on Software Engineering and Advanced Applications, Santander, Spain, 4–6 September 2013; pp. 9–16. [Google Scholar]
  30. Tapping, D. The New Lean Pocket Guide: Tools for the Elimination of Waste; MCS Media: Southfield, MI, USA, 2007. [Google Scholar]
  31. Berkley, B.J. A revïew of the Kanban Production control research literature. Prod. Oper. Manag. 1992, 1, 393–411. [Google Scholar] [CrossRef]
  32. Diaz, R.; Ardalan, A. An Analysis of Dual-Kanban Just-In-Time Systems in a Non-Repetitive Environment. Prod. Oper. Manag. 2010, 19, 233–245. [Google Scholar] [CrossRef]
  33. Gross, J.M.; McInnis, K.R. Kanban Made Simple: Demystifying and Applying Toyota's Legendary Manufacturing Process; AMACOM Div American Mgmt Assn: New York, NY, USA, 2003. [Google Scholar]
  34. Louis, R.S. Custom Kanban: Designing the System to Meet the Needs of Your Environment; CRC Press: Boca Raton, FL, USA, 2006. [Google Scholar]
  35. Adnan, A.N.B.; Jaffar, A.B.; Yusoff, N.B.; Halim, N.H.B.A. Implementation of Just in Time Production through Kanban System. System 2013, 3, 6. [Google Scholar]
  36. Lee-Mortimer, A. A continuing lean journey: An electronic manufacturer's adopting of Kanban. Assem. Autom. 2008, 28, 103–112. [Google Scholar] [CrossRef]
  37. Mintzberg, H.; Quinn, B. Planeación Estratégica; Ediciones Díaz de Santos: Madrid, Spain, 2007. [Google Scholar]
  38. Association, J.M. Kanban Just-in Time at Toyota: Management Begins at the Workplace; CRC Press: Boca Raton, FL, USA, 1986. [Google Scholar]
  39. Developed, P.P. Kanban for the Shopfloor; Productivity Press: New York, NY, USA, 2002. [Google Scholar]
  40. Maarof, M.G.; Mahmud, F. A review of contributing factors and challenges in implementing kaizen in small and medium enterprises. Procedia Econ. Finance 2016, 35, 522–531. [Google Scholar] [CrossRef]
  41. Veilleux, R.F. Tool and Manufacturing Engineers Handbook, Vol. 5: Manufacturing Management, 4th ed.; Petro, L.W., Ed.; Society of Manufacturing Engineers: Southfield, MI, USA, 1988. [Google Scholar]
  42. Mintzberg, H.; Quinn, J.B.; Voyer, J. El Proceso Estratégico: Conceptos, Contextos y Casos; Pearson Educación: London, UK, 1997. [Google Scholar]
  43. Burrows, M. Kanban from the Inside; Blue Hole Press: Sequim, WA, USA, 2014. [Google Scholar]
  44. Riezebos, J.; Klingenberg, W. Advancing Lean Manufacturing, the Role of IT; Elsevier: New York, NY, USA, 2009. [Google Scholar]
  45. Chauhan, P.; Rangrej, S.; Samvatsar, K.; Patel, J. A Review on Scope, Study & Need of Setup Time Reduction for Conveyor Pulley Manufacturing. Int. J. Adv. Res. Eng. Sci. Technol. 2015, 2, 2393–9877. [Google Scholar]
  46. Bortolotti, T.; Boscari, S.; Danese, P. Successful lean implementation: Organizational culture and soft lean practices. Int. J. Prod. Econ. 2015, 160, 182–201. [Google Scholar] [CrossRef]
  47. Boyer, M.; Sovilla, L. How to identify and remove the barriers for a successful lean implementation. J. Ship Prod. 2003, 19, 116–120. [Google Scholar]
  48. Ali, A.; Santini, N.; Rahman, M.A. Kanban supplier system as a standardisation method and WIP reduction. Int. J. Ind. Syst. Eng. 2012, 11, 179–188. [Google Scholar] [CrossRef]
  49. Tamayo García, A.; Urquiola García, I. Concepción de un procedimiento para la planificación y control de la producción haciendo uso de herramientas matemáticas. Rev. Métodos Cuant. Econ. Empresa 2014, 18, 130–145. [Google Scholar]
  50. López, J.M.G. El proceso de capacitación, sus etapas e implementación para mejorar el desempeño del recurso humano en las organizaciones. Contrib. Econ. 2011. Available online: http://biblioteca.iplacex.cl/RCA/El%20proceso%20de%20capacitaci%C3%B3n,%20sus%20etapas%20e%20implementaci%C3%B3n%20para%20mejorar%20el%20desempe%C3%B1o%20del%20recurso%20humano%20en%20las%20organizaciones.pdf (accessed on 16 July 2018).
  51. Vatalaro, J.; Taylor, R. Implementing a Mixed Model Kanban System: The Lean Replenishment Technique for Pull Production; CRC Press: Boca Raton, FL, USA, 2005; Volume 1. [Google Scholar]
  52. Voehl, F.; Harrington, H.J.; Mignosa, C.; Charron, R. The Lean Six Sigma Black Belt Handbook: Tools and Methods for Process Acceleration; CRC Press: Boca Raton, FL, USA, 2013. [Google Scholar]
  53. Álvarez, R.; Calvo, R.; Peña, M.M.; Domingo, R. Redesigning an assembly line through lean manufacturing tools. Int. J. Adv. Manuf. Technol. 2009, 43, 949. [Google Scholar] [CrossRef]
  54. Rahani, A.; Al-Ashraf, M. Production flow analysis through value stream mapping: A lean manufacturing process case study. Procedia Eng. 2012, 41, 1727–1734. [Google Scholar] [CrossRef]
  55. McDonald, T.; Van Aken, E.M.; Rentes, A.F. Utilising simulation to enhance value stream mapping: A manufacturing case application. Int. J. Logist. 2002, 5, 213–232. [Google Scholar] [CrossRef]
  56. Arbós, L.C. Planificación de la Producción. Gestión de Materiales: Organización de la Producción y Dirección de Operaciones; Ediciones Díaz de Santos: Madrid, Spain, 2012. [Google Scholar]
  57. Tyagi, S.; Choudhary, A.; Cai, X.; Yang, K. Value stream mapping to reduce the lead-time of a product development process. Int. J. Prod. Econ. 2015, 160, 202–212. [Google Scholar] [CrossRef] [Green Version]
  58. Emiliani, M.; Stec, D. Using value-stream maps to improve leadership. Leadership Organ. Dev. J. 2004, 25, 622–645. [Google Scholar] [CrossRef]
  59. Gong, Q.; Yang, Y.; Wang, S. Information and decision-making delays in MRP, KANBAN, and CONWIP. Int. J. Prod. Econ. 2014, 156, 208–213. [Google Scholar] [CrossRef]
  60. Dallery, Y.; Liberopoulos, G. Extended kanban control system: Combining kanban and base stock. IIE Trans. 2000, 32, 369–386. [Google Scholar] [CrossRef]
  61. Mukhopadhyay, S.; Shanker, S. Kanban implementation at a tyre manufacturing plant: A case study. Prod. Plan. Control. 2005, 16, 488–499. [Google Scholar] [CrossRef]
  62. Chan, F. Effect of kanban size on just-in-time manufacturing systems. J. Mater. Process. Technol. 2001, 116, 146–160. [Google Scholar] [CrossRef]
  63. Liu, J. Assembly Cell Layout and Kanban System Design for an Oilfield Services Company; Massachusetts Institute of Technology: Boston, MA, USA, 2010. [Google Scholar]
  64. Özbayrak, M.; Akgün, M.; Türker, A. Activity-based cost estimation in a push/pull advanced manufacturing system. Int. J. Prod. Econ. 2004, 87, 49–65. [Google Scholar] [CrossRef]
  65. Turner, R.; Lane, J.A. Goal-Question-Kanban: Applying lean concepts to coordinate multi-level systems engineering in large enterprises. Procedia Comput. Sci. 2013, 16, 512–521. [Google Scholar] [CrossRef]
  66. Anderson, D.J. Kanban: Successful Evolutionary Change for Your Technology Business; Blue Hole Press: Sequim, WA, USA, 2010. [Google Scholar]
  67. Wakode, R.B.; Raut, L.P.; Talmale, P. Overview on Kanban Methodology and its Implementation. IJSRD-Int. J. Sci. Res. Dev. 2015, 3, 2518–2521. [Google Scholar]
  68. Losonci, D.; Demeter, K.; Jenei, I. Factors influencing employee perceptions in lean transformations. Int. J. Prod. Econ. 2011, 131, 30–43. [Google Scholar] [CrossRef] [Green Version]
  69. Singh, B.; Garg, S.; Sharma, S.; Grewal, C. Lean implementation and its benefits to production industry. Int. J. Lean Six Sigma 2010, 1, 157–168. [Google Scholar] [CrossRef]
  70. Singh, B.; Garg, S.K.; Sharma, S.K. Value stream mapping: Literature review and implications for Indian industry. Int. J. Adv. Manuf. Technol. 2011, 53, 799–809. [Google Scholar] [CrossRef]
  71. Gupta, S.M.; Al-Turki, Y.A.; Perry, R.F. Flexible kanban system. Int. J. Oper. Prod. Manag. 1999, 19, 1065–1093. [Google Scholar] [CrossRef]
  72. Hopp, W.J.; Spearman, M.L. To pull or not to pull: What is the question? Manuf. Serv. Oper. Manag. 2004, 6, 133–148. [Google Scholar] [CrossRef]
  73. Ghrayeb, O.; Phojanamongkolkij, N.; Tan, B.A. A hybrid push/pull system in assemble-to-order manufacturing environment. J. Intell. Manuf. 2009, 20, 379. [Google Scholar] [CrossRef]
  74. Espejo Ruiz, L. Aplicación de Herramientas y Técnicas de Mejora de la Productivitat en una Planta de Fabricación de Artículos de Escritura; Polytechnic University of Catalonia: Barcelona, Catalonia, Spain, 2011; pp. 49–82. [Google Scholar]
  75. Moreno Salcido, M. Implementación de un Sistema Kanban en Línea de Producción; Universidad Autónoma de Ciudad Juárez: Ciudad Juárez, Mexico, 2003. [Google Scholar]
  76. Page, J. Implementing Lean Manufacturing Techniques: Making Your System Lean and Living with It; Hanser Gardner Publications: Munich, Germany, 2004. [Google Scholar]
  77. Fullerton, R.R.; McWatters, C.S. The production performance benefits from JIT implementation. J. Oper. Manag. 2001, 19, 81–96. [Google Scholar] [CrossRef]
  78. Likert, R. A technique for the measurement of attitudes. Arch. Psychol. 1932, 22, 55. [Google Scholar]
  79. Wang, C.; Li, J.; Guo, P. The normalized interval regression model with outlier detection and its real-world application to house pricing problems. Fuzzy Sets Syst. 2015, 274, 109–123. [Google Scholar] [CrossRef]
  80. Manenti, F.; Buzzi-Ferraris, G. Criteria for outliers detection in nonlinear regression problems. Comput. Aided Chem. Eng. 2009, 26, 913–917. [Google Scholar]
  81. Diaz Monroy, L.G. Estadística multivariada: Inferencia y métodos. Fac. Cienc. Univ. Nac. Colomb. 2002, I, 972–980. [Google Scholar]
  82. Castañeda, M.B. Procesamiento de Datos y Análisis Estadísticos Utilizando SPSS: Un Libro Práctico Para Investigadores y Administradores Educativos; Edipucrs: Porto Alegre, Brazil, 2010. [Google Scholar]
  83. Pérez López, C. Muestreo Estadistico. Conceptos y Problemas Resueltos; 8420544116; Universidad Complutense de Madrid; Instituto de Estudios Fiscales: Madrid, Spain, 2005. [Google Scholar]
  84. Cronbach, L.J. Coefficient alpha and the internal structure of tests. Psychometrika 1951, 16, 297–334. [Google Scholar] [CrossRef] [Green Version]
  85. Gorsuch, R.L. Common factor analysis versus component analysis: Some well and little known facts. Multivar. Behav. Res. 1990, 25, 33–39. [Google Scholar] [CrossRef] [PubMed]
  86. Kaiser, H.F. Coefficient alpha for a principal component and the Kaiser-Guttman rule. Psychol. Rep. 1991, 68, 855–858. [Google Scholar] [CrossRef]
  87. Adamson, K.A.; Prion, S. Reliability: Measuring internal consistency using Cronbach’s α. Clin. Simul. Nurs. 2013, 9, e179–e180. [Google Scholar] [CrossRef]
  88. Tenenhaus, M.; Vinzi, V.E.; Chatelin, Y.-M.; Lauro, C. PLS path modeling. Comput. Stat. Data Anal. 2005, 48, 159–205. [Google Scholar] [CrossRef]
  89. Kock, N. WarpPLS 5.0 User Manual. 2015; ScriptWarp Systems: Laredo, TX, USA, 2015. [Google Scholar]
  90. Carraher, S.M.; Mendoza, J.L.; Buckley, M.R.; Schoenfeldt, L.F.; Carraher, C.E. Validation of an instrument to measure service-orientation. J. Qual. Manag. 1998, 3, 211–224. [Google Scholar] [CrossRef]
  91. Markham, I.S.; Mathieu, R.G.; Wray, B.A. Kanban setting through artificial intelligence: A comparative study of artificial neural networks and decision trees. Integr. Manuf. Syst. 2000, 11, 239–246. [Google Scholar] [CrossRef]
  92. Hamilton, B.H.; Nickerson, J.A.; Owan, H. Team incentives and worker heterogeneity: An empirical analysis of the impact of teams on productivity and participation. J. Political Econ. 2003, 111, 465–497. [Google Scholar] [CrossRef]
  93. Razi, M.A.; Athappilly, K. A comparative predictive analysis of neural networks (NNs), nonlinear regression and classification and regression tree (CART) models. Expert Syst. Appl. 2005, 29, 65–74. [Google Scholar] [CrossRef]
  94. Thun, J.-H.; Drüke, M.; Grübner, A. Empowering Kanban through TPS-principles—An empirical analysis of the Toyota Production System. Int. J. Prod. Res. 2010, 48, 7089–7106. [Google Scholar] [CrossRef]
  95. Lomax, R.G.; Schumacker, R.E. A Beginner’s Guide to Structural Equation Modeling; Psychology Press: Hove, UK, 2004. [Google Scholar]
  96. Ruiz, M.A.; Pardo, A.; San Martín, R. Modelos de ecuaciones estructurales. Papeles del Psicólogo 2010, 31, 34–45. [Google Scholar]
  97. Finney, A.J.; DiStefano, C. Non-normal and categorical data in structural equation modeling. In Structural Equation Modeling: A Second Course; CIA: Charlotte, NC, USA, 2006; pp. 269–314. [Google Scholar]
  98. Vinodh, S.; Joy, D. Structural equation modelling of lean manufacturing practices. Int. J. Prod. Res. 2012, 50, 1598–1607. [Google Scholar] [CrossRef]
  99. Youssef, M.A.; Youssef, E.M.; Motwani, J.G. A structural equation model for measuring the JIT intensity and its impact on manufacturing flexibility. Int. J. Bus. Excel. 2015, 8, 324–356. [Google Scholar] [CrossRef]
  100. García-Alcaraz, J.; Prieto-Luevano, D.; Maldonado-Macías, A.; Blanco-Fernández, J.; Jiménez-Macías, E.; Moreno-Jiménez, J. Structural equation modeling to identify the human resource value in the JIT implementation: Case maquiladora sector. Int. J. Adv. Manuf. Technol. 2015, 77, 1483–1497. [Google Scholar] [CrossRef]
  101. García-Alcaraz, J.L.; Oropesa-Vento, M.; Maldonado-Macías, A.A. Kaizen Planning, Implementing and Controlling; Springer: Berlin, Germany, 2016. [Google Scholar]
  102. Faulkner, W.; Badurdeen, F. Sustainable Value Stream Mapping (Sus-VSM): Methodology to visualize and assess manufacturing sustainability performance. J. Clean. Prod. 2014, 85, 8–18. [Google Scholar] [CrossRef]
  103. Elkington, J. Towards the sustainable corporation: Win-win-win business strategies for sustainable development. Calif. Manag. Rev. 1994, 36, 90–100. [Google Scholar] [CrossRef]
  104. Helleno, A.L.; de Moraes, A.J.I.; Simon, A.T. Integrating sustainability indicators and Lean Manufacturing to assess manufacturing processes: Application case studies in Brazilian industry. J. Clean. Prod. 2017, 153, 405–416. [Google Scholar] [CrossRef]
  105. Martínez-Jurado, P.J.; Moyano-Fuentes, J. Lean management, supply chain management and sustainability: A literature review. J. Clean. Prod. 2014, 85, 134–150. [Google Scholar] [CrossRef]
  106. Mike, R. Toyota Kata Managing People for Improvment, Adaptiveness and Supeior Resolts; McGraw-Hill: New York, NY, USA, 2010. [Google Scholar]
  107. Minh, N.D.; Nguyen, N.D.; Cuong, P.K. Applying Lean Tools and Principles to Improve Sustainability of Waste Management: A Case Study. Preprints 2018. [Google Scholar] [CrossRef]
  108. Rother, M.; Shook, J. Learning to See: Value Stream Mapping to Add Value and Eliminate Muda; Lean Enterprise Institute: Cambridge, MA, USA, 2003. [Google Scholar]
  109. García, J.L.; Maldonado, A.A.; Alvarado, A.; Rivera, D.G. Human critical success factors for kaizen and its impacts in industrial performance. Int. J. Adv. Manuf. Technol. 2014, 70, 2187–2198. [Google Scholar] [CrossRef]
Figure 1. Planning model with hypothesis.
Sustainability 10 02506 g001
Figure 2. Evaluation of the proposed model.
Sustainability 10 02506 g002
Figure 3. Proposed final model.
Sustainability 10 02506 g003
Table 1. Types of withdrawal kanban.
Types of KanbanDescription
Supply kanbanInstruction of the warehouse route or plant for the flow of supplies
Acquisition kanbanInstruction used for the products to travel from outside the plant to the final destination
Subcontract kanbanInstruction of the raw material between intermediaries or between companies
Auxiliary or emergency kanbanSpecial communication to produce something that had not been contemplated
Kanban signalInstruction that warns the station to be prepared to manufacture a product
Table 2. Human resources in the planning of the kanban system.
ActivityReferenceFrequency
Application of 5’s and rebalancing[15,26,33,38,39,51,61,63,74,75]10
Assign responsibilities[17,26,33,34,51,61,63,75,76]9
Create a kanban team[17,26,33,34,51,61,74,76]8
Training[17,26,33,51,61,74,75,76]8
Team leader[26,33,34,51,74,75,76]7
Approval from the management office[17,26,33,34,51,61,74]7
Supply equipment[17,26,33,63,75,76]6
Training program[26,33,51,74,76]5
Table 3. Preliminary analysis in the planning of the kanban system. VSM—value stream mapping.
ActivityReferenceFrequency
Analysis of the demand[26,33,34,39,51,61,63,74,76]9
Material handling[26,33,34,38,63,74,76]7
Flowchart kanban[15,26,33,34,51,63,74]7
Current VSM[15,26,33,34,51,63]6
Visual aids[26,33,34,38,39,76]5
Space requirements[26,63,75,76]4
Future VSM [26,34,51]3
Machinery components[33,51]2
Table 4. Integration in the planning of the kanban system. EOQ—economic order quantity.
ActivityReferenceFrequency
Kanban scheduling[26,33,34,51,61,74]6
Pull system[15,26,39,76]4
Cost-benefit analysis[26,33,34,51]4
Volume of components[26,63,77]3
Kanban with MRP II (Material Requirements Planning)[39,51]2
Apply EOQ[26,33]2
Table 5. Kanban system operational benefits.
BenefitsReferenceFrequency
Minimize inventories[17,26,31,33,34,38,39,51,61,63,74,75,76,77]14
Order accuracy[17,26,27,33,34,38,39,63,74,75,76]11
Flexibility and predictability[17,26,27,38,39,51,61,74,75,76]10
Process improvement[17,26,33,34,51,63,74,75,76,77]10
Reduction of waiting time[17,26,27,38,63,74,75,76,77]9
Eliminate waste[17,26,51,61,74]5
Effective use of resources[26,33,74,77]4
Supply chain reduction[17,26,33,77]4
Easy to control[26,27,51,77]4
Variability reduction[17,27,61]3
Greater technical, geographical, and/or price competition[17]1
Table 6. Value scale.
Value12345
ActivityUnimportantLess importantRegularly importantImportantVery important
BenefitNeverVery rarelyOccasionallyFrequentlyAlways
Table 7. Sector to which the survey belongs.
Industrial SectorQuantityPercentage
Automotive2016.90%
Electronics1916.10%
Medical1512.70%
Machining1210.20%
Aeronautical108.50%
Textile86.80%
Metal Mechanic54.20%
Electric54.20%
Other2420.30%
Total118100.00%
Table 8. Descriptive analysis of the variable human resources.
Human ResourcesMedianInterquartile Range
Train each one of those involved4.720.82
Assignment of the responsibilities to each department or member of the kanban team4.511.11
Select a team leader4.541.12
Prepare the production lines by applying a 5’s and rebalancing4.541.12
Develop a program for the training of the personnel involved4.461.19
Acquire approval from the high management4.431.26
Create a team which is responsible for managing supplies4.251.34
Creation of a kanban team4.231.58
Table 9. Descriptive analysis of the variable preliminary analysis.
Preliminary AnalysisMedianInterquartile Range
Calculate the space requirements4.541.12
Develop kanban visual aids that are easy to interpret4.481.29
Analyze the variability of the demand, to later be able to define the safety inventories4.451.29
Analysis of material handling4.391.33
Create a current status of the value chain to observe the areas of opportunities4.361.35
Determination of the components for each machinery4.381.43
Develop a kanban flow diagram4.381.50
Develop a future value chain4.231.48
Table 10. Descriptive analysis of the integration of kanban variable.
Integration of KanbanMedianInterquartile Range
Adopt a pull production system4.501.17
Develop a calendar with specific activities for the implementation of the kanban4.401.34
Develop an analysis of the costs and benefits in the implementation of the kanban4.391.41
Focus mainly on the components whose sales volume is higher to apply the kanban4.221.43
Perform an analysis of the inventory behavior by using the EOQ formula to determine the order size to minimize costs4.131.52
Integrate kanban with MRP II3.921.52
Table 11. Validation of the questionnaire.
IndexPreliminary AnalysisHuman Resources Integration of KanbanOperational Benefits
R-squared0.577 0.7170.508
Compound reliability (Rho from Dillon–Goldstein)0.9330.9040.8810.940
Cronbach’s alpha0.9180.8780.8370.873
Average variance extracted (AVE)0.6360.5420.5540.887
Full VIF3.4463.1923.5671.957
Q-squared0.5720.7160.508
Table 12. Model efficiency indexes. APC—average path coefficient; ARS—average R-squared; AVIF—inflation factor of the average variance of blocks.
IndexesResultsEvaluation Criteria
APC0.402, p < 0.001It is recommended that the p values for APC and ARS be equal to or less than 0.05; that is, significant at the 0.05 level
ARS0.601, p < 0.001
AVIF3.055Acceptable ≤ 5, ideal ≤ 3.3
Table 13. Size of the effects.
Human ResourcesPreliminary AnalysisIntegration of KanbanR-Squared
Preliminary analysis0.5810.581
Integration of kanban0.3910.3300.721
Operational benefits0.050.3570.1050.512
Table 14. Sum of indirect effects.
Human ResourcesPreliminary Analysis
Integration of kanban0.318 (p < 0.001)
ES = 0.256
Operational benefits0.519 (p < 0.001)
ES = 0.318
0.068 (p = 0.143)
ES = 0.048
Table 15. Total Effects of the SEM.
Human ResourcesPreliminary AnalysisIntegration of Kanban
Preliminary analysis0.762 (p < 0.001)
ES = 0.581
Integration of kanban0.803 (p < 0.001)
ES = 0.647
0.418 (p < 0.001)
ES = 0.330
Operational benefits0.600 (p < 0.001)
ES = 0.367
0.576 (p < 0.001)
ES = 0.405
0.164 (p = 0.033)
ES = 0.105
Table 16. Validation of hypotheses.
HypothesesVariablesβp ValueConclusion
fromto
H1Human resourcesPreliminary analysis0.762<0.001Accepts H0
H2Human resourcesIntegration of kanban0.485<0.001Accepts H0
H3Preliminary analysisIntegration of kanban0.418<0.001Accepts H0
H4Human resourcesOperational benefits0.0810.183Rejects H0
H5Preliminary analysisOperational benefits0.508<0.001Accepts H0
H6Integration of kanbanOperational benefits0.1640.033Accepts H0

