1. Introduction
Lately China’s economy has been buoyed by household spending. Rising incomes bolstered by urbanization have enabled this recent phenomenon. While China’s population was less than 20% urban in 1980, it was over 52.3% urbanized by 2012. Urbanization has boosted household consumption as urban households tend to be wealthier. It also alters the nature of energy use. During the 15 years from 1992–2007, direct and indirect carbon dioxide (CO
2) emissions from household consumption accounted for more than 40% of all carbon emissions due to primary energy use in China [
1]. By 2012, a typical Chinese household consumed 1426 kilograms standard coal equivalent, about 44% of the US level in 2009 and 38% of that for EU [
2]. Rising household income and the continuing fast pace of urbanization cause rising household energy consumption and, hence, CO
2 emissions [
3].
The residential sector is the second-largest energy consumer in China, and it appears to be on the precipice of a growth boom [
4]. Decomposition analysis is commonly used to understand the underlying proximate economic causes of trends of energy consumption and energy-related CO
2 emission. Index decomposition analysis (IDA) is often used in this regard. It is less data-demanding since it decompose at rather aggregate sectoral levels, ignoring interindustry interdependence [
5,
6,
7,
8]. Using the Log Mean Divisia Index (LMDI) method, Zhang and Guo [
6] and Zha, Zhou and Peng [
8] found that household income is a critical growth factor for China’s residential energy consumption and the efforts at curbing energy intensity efforts have dampened energy consumption. Zhang, Song, Li and Li [
7] have shown that energy efficiency per unit of space has been important in decreasing urban residential energy consumption, while population growth and floor areas rises have pushed up urban residential energy consumption.
Structural decomposition analysis (SDA), which uses input-output (I-O) tables, also has been frequently used by researchers to identify proximate forces of change in energy use and CO
2 emission by industries [
9]. Compared to IDA, SDA can account simultaneously for both the supply and demand side effects, as well as distinguishing between direct and indirect effects through the supply chains [
9,
10,
11,
12,
13,
14,
15,
16,
17]. Using SDA, Zhang, Bian, Tan and Song [
15] have found that per capita household consumption and energy intensity appear to be main motivators of rising indirect residential CO
2 emissions in China. Zhang, Lahr and Bi [
16] have noted that changes in inter-industry input mix and household consumption preferences have elevated household indirect energy use. Chinese households have been increasingly shifting their consumption toward more energy- and material-intensive goods [
17].
Like many spatially large nations, great social and economic differences exist across China’s geography. The variations lead to regional discrepancies in both household income and wealth and, hence, in energy consumption [
18,
19]. Thus, it is critical to identify the main economic drivers of household energy use, especially when framing and forming regional energy policies. Like its wealth and economic activity, China’s most energy-efficient provinces are those located on its east coast; its least energy-efficient provinces are those furthest inland [
10,
18,
20,
21,
22]. Few researchers, however, have examined regional disparities in the patterns of Chinese household energy-use. Dividing China into four regions: Eastern, Central, Western, and Northeastern, Feng et al. [
23] found that household indirect energy consumption and CO
2 emissions differ by region. By tracing lifestyle changes of five representative provinces in China, they found that recent household consumption change was driven by enhanced income levels and a rise in the localization of supply chains for the goods and services produced. Based on households’ carbon footprints, Zheng et al. [
24] ranked 74 Chinese major cities and found that cities with colder Januarys tend to yield higher household carbon emissions due, naturally enough, to fuel and electricity usage, likely in the form of room heating. Liu, Liang and Wang [
19] found that the share of interregional carbon flows in national carbon emission rose from 15.2% in 2002 to 21.1% in 2007. The carbon flows from the Central and Northwest regions to the Eastern Coastal region were the greatest contributors to both the total interregional carbon flows in 2007. Liang, Fan and Wei [
21] found that improvement in energy end-use efficiency by region appears to generate significant intra-regional energy savings in China.
Current studies on China’s household energy consumption focus largely on a nationwide phenomenon. Regional studies tend to focus either only on selected cities or provinces or across short timeframes. A comprehensive overview of household energy-use patterns across regions has not yet been completed. Thus, our paper provides a more comprehensive study of contributors to China’s household energy uses from a multiregional perspective by exploring how technology improvements, economic structure change, urbanization, lifestyle changes and interregional trade influence household energy uses across different regions from 2002 to 2012. In this vein, the findings of our research will help policymakers in China to form regional-specific policies that curb China’s rapidly rising household energy demand from multi-angle perspectives.
In this paper, we define household energy use as both (1) the energy consumed directly by households in the conduct of their daily lives as well as (2) the energy embodied in the goods and services used by households (indirectly used energy). We examine the transition of household energy consumption across regions from 2002 to 2012. In doing so, we explore how regional disparities in climate, space heating and cooling, as well as electric home appliance usage affect household energy use across different regions. Then, we use SDA to identify the main economic drivers of household indirect energy use at the region level during that same period. We also investigate the effects of lifestyle changes and interregional trade on household indirect energy use of each region. Based on this multiregional and multi-angle analysis, we also offer some valuable regional-specific policy suggestions for China in guiding its residents’ lifestyles toward greener consumption.
2. Methodology and Data
2.1. Regional Classification and Regional Disparities
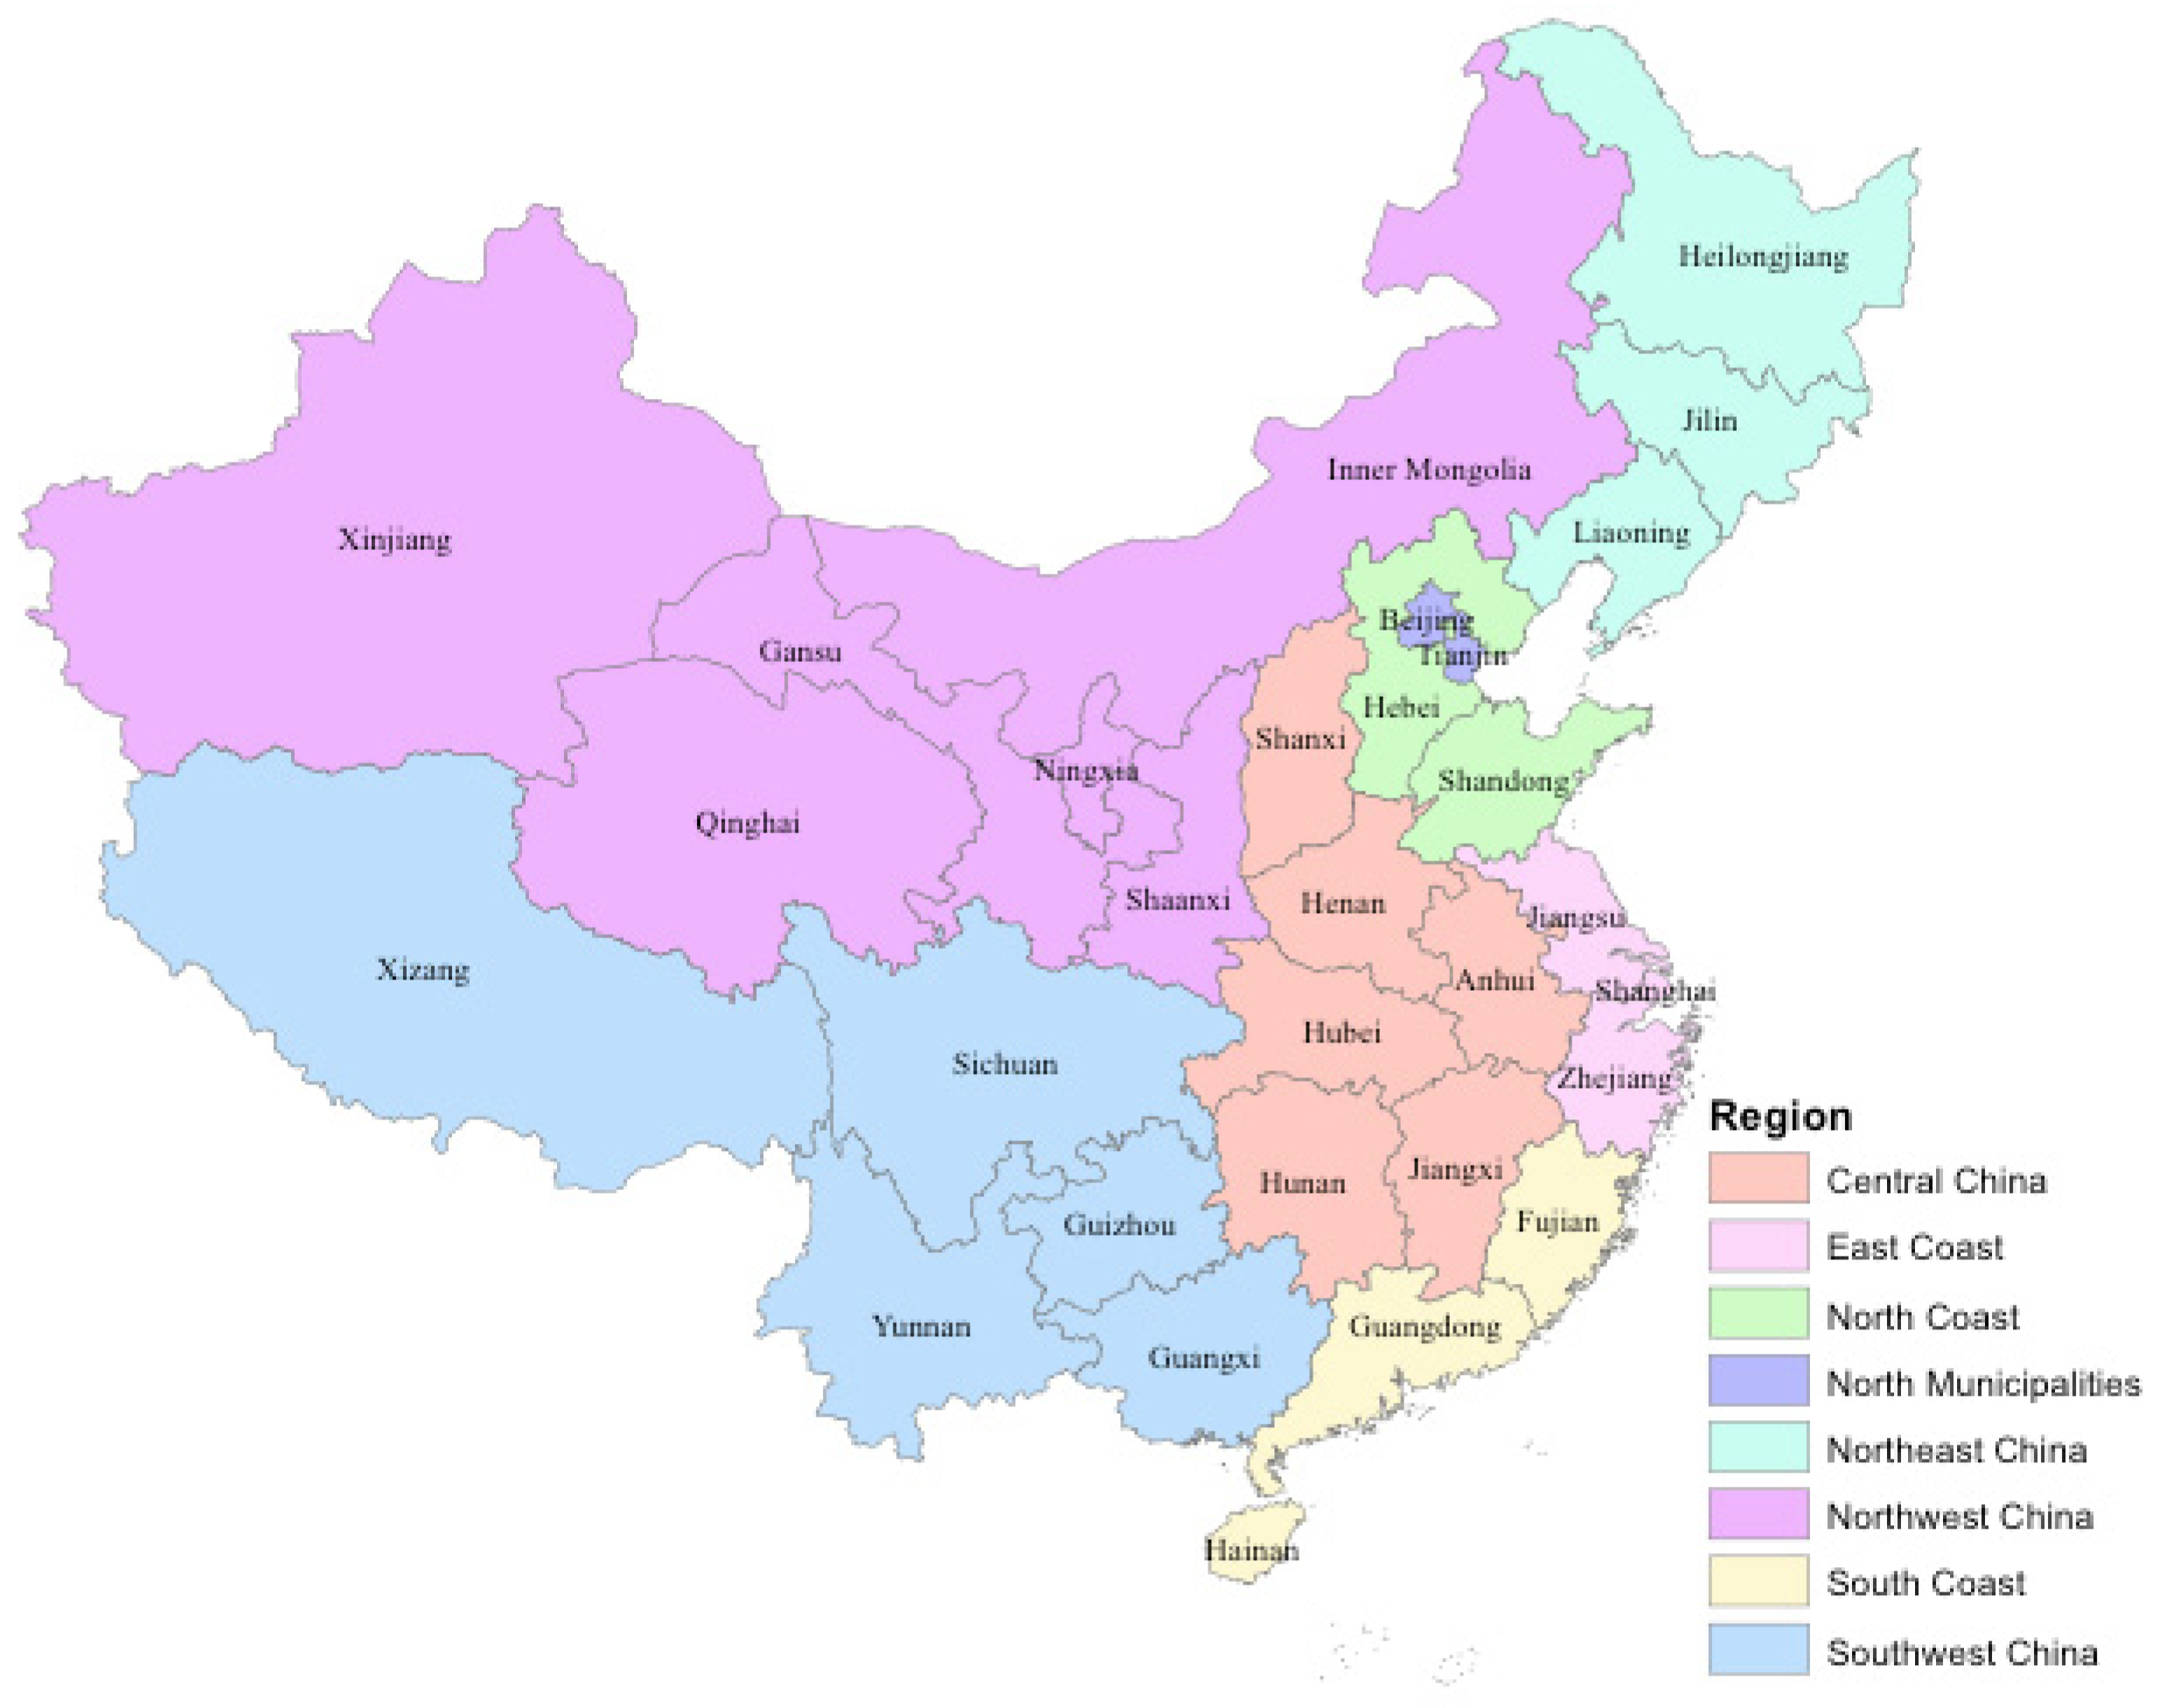
In the following analysis, China is divided into eight regions: Northeast China (NE), Northern Municipalities (NM), North Coast (NC), East Coast (EC), South Coast (SC), Central China (CC), Northwest China (NW), and Southwest China (SC) (see
Figure 1 and
Table 1). In 2002, income disparities across the eight regions were sizeable. Northern Municipalities, the East Coast and the South Coast were the most affluent regions in China. The poorest region, Southwest China (SW), had a Gross Domestic Product (GDP) per capita that was just 21% that of the richest region (NM) In this paper, we use the acronym GDP as the abbreviation of real GDP. We convert all the nominal GDP values into 2012 prices.
To mitigate regional inequality and encourage growth in its hinterlands, China launched a series of regional development policies: the “Western Development Strategy” in 2000, the “Revitalization of Northeast China Strategy” in 2002 and the “Central China Rising Strategy” in 2004. The series seems to have worked. From 2002 to 2012, the average annual growth rates of GDP per capita in the target areas were 12.3% for Northeast China, 12.4% for Central China, 13.1% for Northwest China and 12.9% for Southwest China. All of these annualized GDP growth rates were higher than the nation’s during the same period (12.0%).
Energy resource endowments vary across regions too. Coal mines are concentrated in Northwest and Central China, while natural gas reserves are concentrated in Northwest and Southwest China [
18,
25]. The East Coast and South Coast are energy sinks, “importing” coal and natural gas from the nation’s hinterland.
Energy consumption was also quite unequal across China’s geography. Energy use per person in the northern parts of China was much higher than in the East Coast, South Coast, Central China and Southwest China. In 2012, Northwest China used 5.19 ton SCE per person, about 159% more than the consumption per capita in Southwest China. All regions had experienced a significant rise in energy consumption from 2002 to 2012. In particular, the average annual growth rates of energy consumption was 12.1% in the Northwest, 9.9% in the North Coast and 9.0% in Southwest China; all were higher than the nation’s average annual growth rate of 8.4% for the same period.
In China, energy intensity (energy consumption per GDP) is an official indicator both for local economic performance and for energy conservation policies. The Northern Municipalities, the East Coast, and the South Coast experienced lower-than-average energy intensity from 2002 to 2012. China set targets to reduce the energy intensity of its economy by 16% from 2010 level by 2015, and by 17% from the 2015 level by 2020. In both 12th and 13th five-year plans, China’s energy intensity reduction targets varied across regions, with regional efforts ranging from 10% to 15% reduction of energy intensities in the less-developed west regions and 17% to 18% reduction in the coastal regions. The regions that have higher energy intensity and use the least-advanced technologies have less-stringent intensity targets than do the most affluent and technologically advanced regions, where the costs of marginal energy efficiency improvement are much higher [
11]. Given the unequal distribution of energy resources in favor of the interior provinces, it seems the use of “consumption-based” accounting of energy is better for China to reflect regions’ abilities to pay the costs of energy efficiency improvement [
26].
2.2. Structural Decomposition Analysis
Multiregional input-output (MRIO) analysis is often used to explore the energy embodied in upstream aspects of a commodity’s supply chain [
27]. We use Equation (1) to calculate household indirect energy use for a particular time point:
We therefore adopt a multiplicative SDA framework to identify driving forces of households’ energy use at the regional level between 2002 and 2012. Let N represent the number of industries per region and R the number of regions. Other variable definitions are as follows: E is the aggregated household indirect energy consumption (scalar); the vector of elements , which are the energy inputs per unit of output of industry in region ( vector); L is the Leontief-inverse –the matrix of total input requirements ( matrix), in which A is the industry-by-industry direct requirements matrix, is the identity matrix ( matrix); H represents the matrix of household final demand by region of destination ( matrix), in which each element denotes households’ final demand for commodities of industry produced in region , by household type from region ; = 1, …, ; denotes household type, rural or urban households; and h: the vector with each element indicating the household demand for commodities of industry in region ( vector); h is the row sum of matrix H (, where f is the summation vector consisting of ones).
Since total population of each region changes over years, we decompose household spending (h) into regional per capita rural and urban household spending ( matrix) and the population for rural and urban population in each region ( vector) with . To capture total population change and the effect of urbanization, is further decomposed into ∘ s, where p indicates total population in region ( vector) and s shows the shares of urban and rural population of total population in region ( vector). (∘ denotes Hadamard product (element-by-element multiplication of matrices). In addition, is decomposed into structure and volume components with , where shows per capita household consumption structure by region and by household type ( matrix) and is per capita household consumption level by region and by household type ( diagonal matrix). Thus, we know that .
Following Dietzenbacher et al. [
28] and Zhang and Lahr [
18], we decompose
A and
further to show the effects of changing interregional trade. The Leontief inverse can be written as
and per capita household spending can be written as
.
: the matrix constructed by stacking R identical N × NR matrices of aggregate intermediate inputs per unit of gross output by industry by region ( matrix), ;
: intermediate trade coefficients that show the input shares of each region in aggregated inputs by industry by region ( matrix). , note that ;
: matrix constructed by stacking R identical matrices of household spending for product by region and household type ( matrix), ;
: household consumption trade coefficients that indicate the shares of region in aggregated household spending of household type for product in region ( matrix). , note that ;
The final decomposition of household indirect energy use change of region
can then be written as:
Thus, change in indirect household energy consumption is decomposed into eight component effects. (In this paper, we only show one side of the polar decomposition. In our study, we examine both polar decompositions and use Fisher indexes to analyze results. Fisher indexes are obtained by taking the geometric average of corresponding elements of the polar decompositions.)
: effect of changes in energy requirements per unit of output-;
: effect of changes in inter-industrial input structure;
: productivity effect of changed regional trade structures of intermediate inputs-;
: effect of changes in household consumption structure-;
: effect of changes in interregional trade structure of commodities and services consumed by households-;
: effect of changes in per capita household consumption level-;
: effect of changes in total population of each region-;
: effect of changes in the share of urban population of each region-;
2.3. Data Sources and Data Compilation
Multiregional input-output (MRIO) tables provide regional information as well as estimates of interregional trade [
18]. In this study, we use the 2002 and 2012 MRIO tables for China. These tables were compiled by the China State Information Center and include 17 sectors and 8 regions [
29]. Since the MRIO tables used here were published in current prices, RAS is used to convert these tables to constant 2012 prices [
28,
30] In this article, we used the agricultural producer price index for the primary industry and free-on-board price index for the secondary industry to adjust prices. For the tertiary and construction industries, a set of implicit GDP price indexes was used. Implicit GDP is dividing nominal GDP by real GDP of these industries.
Households’ direct use of commercial energy is drawn from Provincial Energy Balance Tables in China Energy Statistical Yearbooks [
31,
32,
33] Many rural households still use non-commercial forms of energy such as biomass in their daily life. Since China Energy Statistical Yearbooks stopped publishing rural noncommercial energy statistics after 2008, household direct energy use in the context of this paper only refers to commercial sources of energy. Household indirect energy use is calculated from the MRIO tables. Regional energy consumption data is aggregated from Provincial Energy Balance Tables in China Energy Statistical Yearbooks [
31,
32]. Since Provincial Energy Balance Tables report only production-related energy consumption for 6 sectors, we use national energy consumption data by industry to map regional energy use for 17 sectors. All other demographic and GDP data are from the China Statistical Yearbook [
34,
35].
3. Results
3.1. Residential Direct Energy Use
From 2002 to 2012, residential direct energy use rose at an average annual rate of 9.0% from 142 million tons of coal equivalent (Mtce) in 2002 to 338 Mtce in 2012. Meanwhile household indirect energy use increased at an average annual rate of 5.7% from 482 Mtce in 2002 in 836 Mtce in 2012. In 2012, household consumed 1174 Mtce both directly and indirectly, accounting for 29% of China’s total energy use.
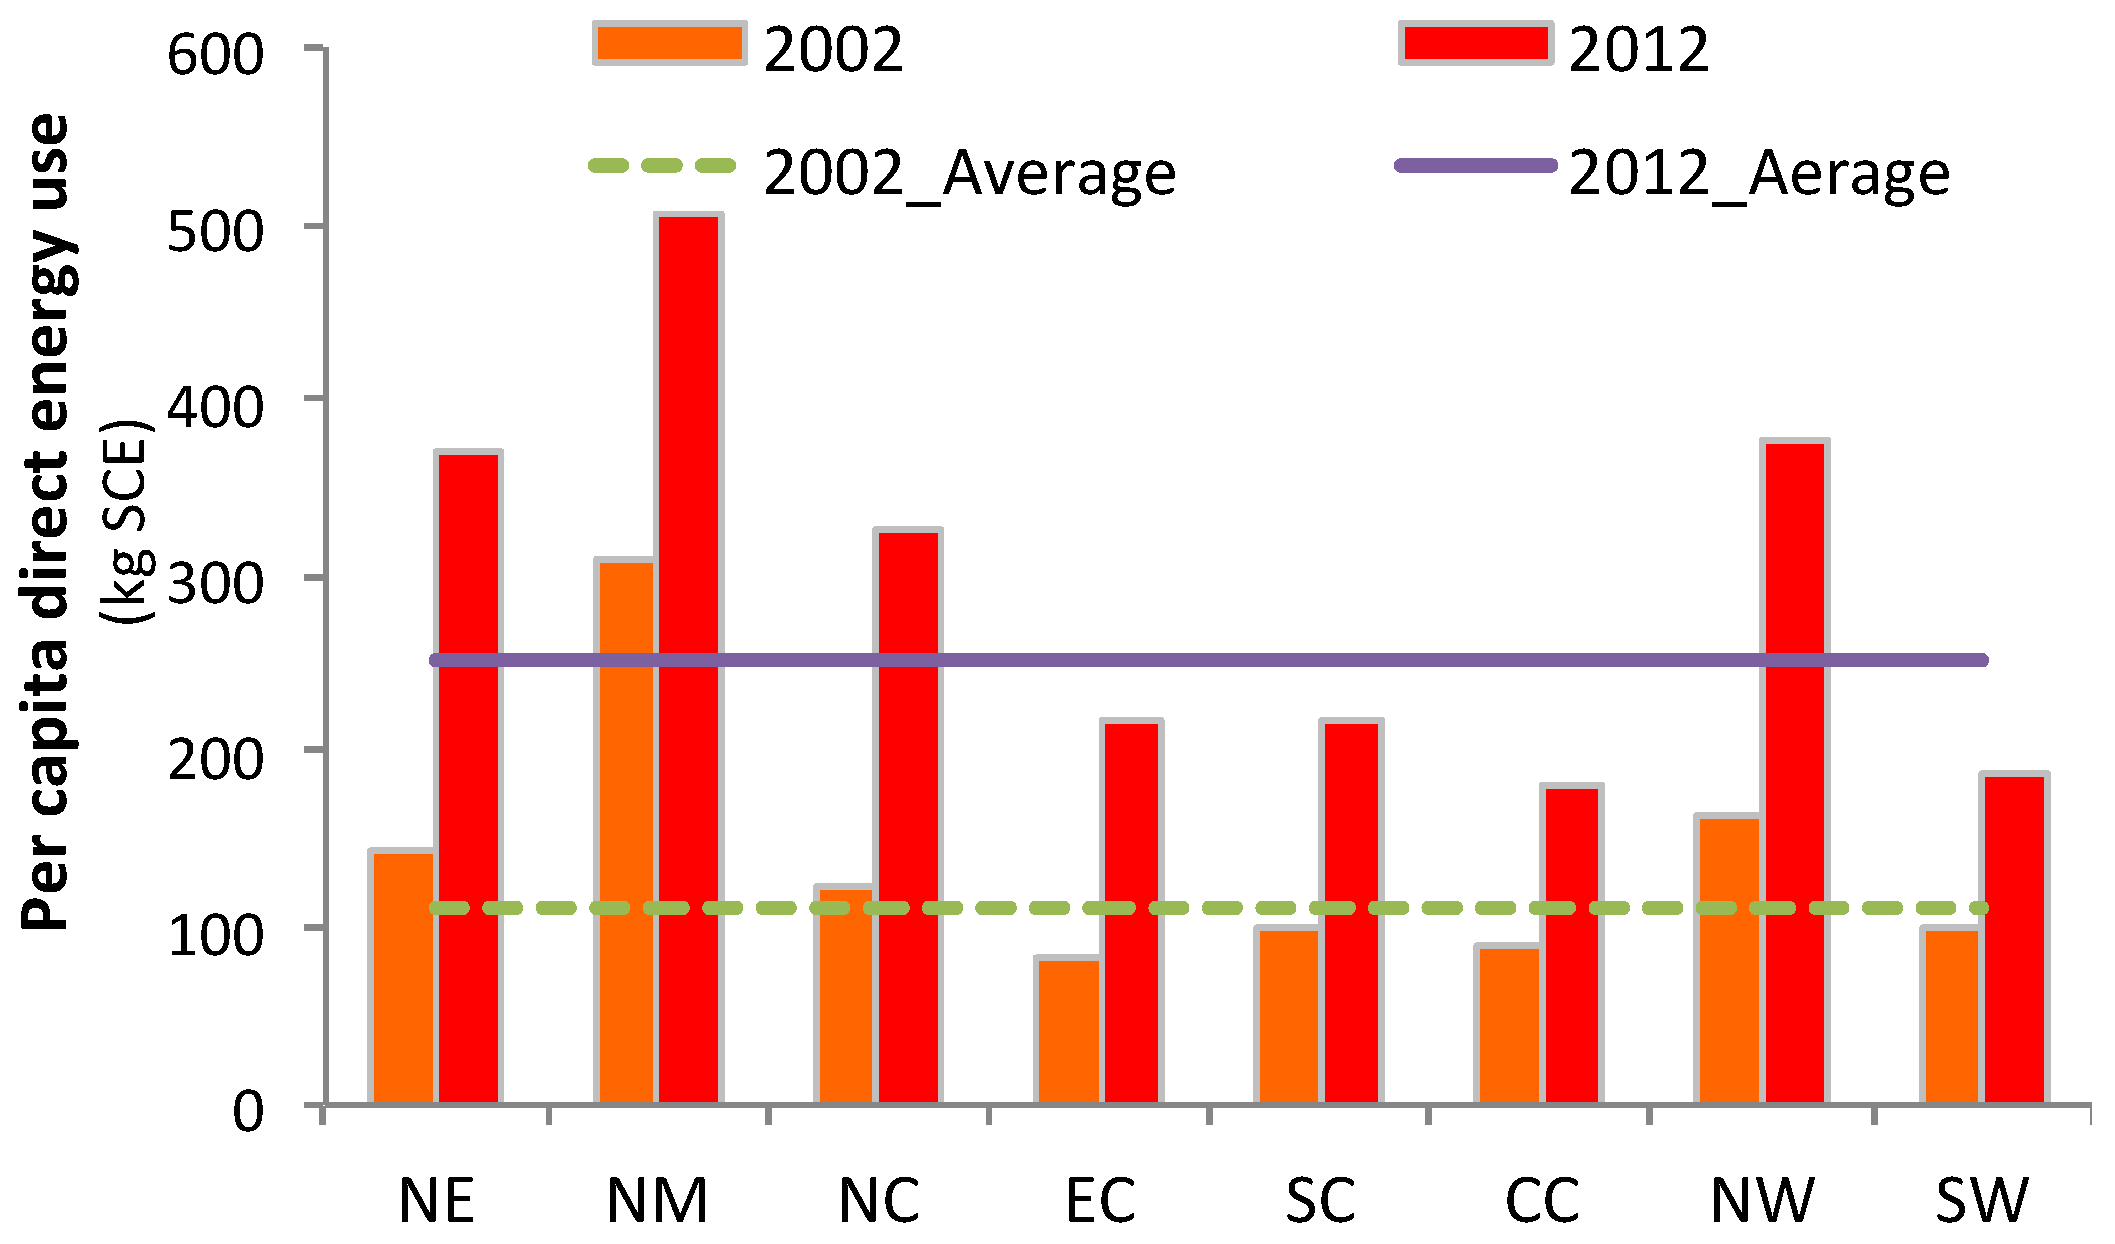
Residential direct energy use per capita varied across regions (see
Figure 2). On average, China’s households consumed 250 kg standard coal equivalents (SCE) per capita directly in 2012. Residents in the Northern Municipalities (NM) consumed 506 kg SCE energy per capita, which was much higher than other regions. Cold climatic conditions largely explain why households in Northeast China (NE), North Coast (NC) and Northwest China (NW) consume 48%, 31% and 50%, respectively, more than the national average. The relatively wealthy East Coast (EC) and South Coast (SC) both consumed 13% less energy per capita than the national average. Conversely, the relatively poor and warm Central China (CC) and Southwest China (SW) consumed 28% and 25% less energy per capita directly than the national average.
China is a typical dualistic rural and urban society. From 2002 to 2012, per capita direct energy use rose at an average annual rate of 6.8% from 162 kg SCE to 312 kg SCE for urban households and rose at an average rate of 8.6% from 79 kg SCE to 181 kg SCE for rural households. The urban–rural gap reduced substantially from 2002 to 2012. On a per capita basis, rural households consumed just 49% of the energy used directly by their urban counterparts. This share rose to 58% by 2012. Indeed, in 2012, rural households in the relatively developed Northern Municipalities, East Coast and South Coast even consumed more energy directly per capita than their urban counterparts.
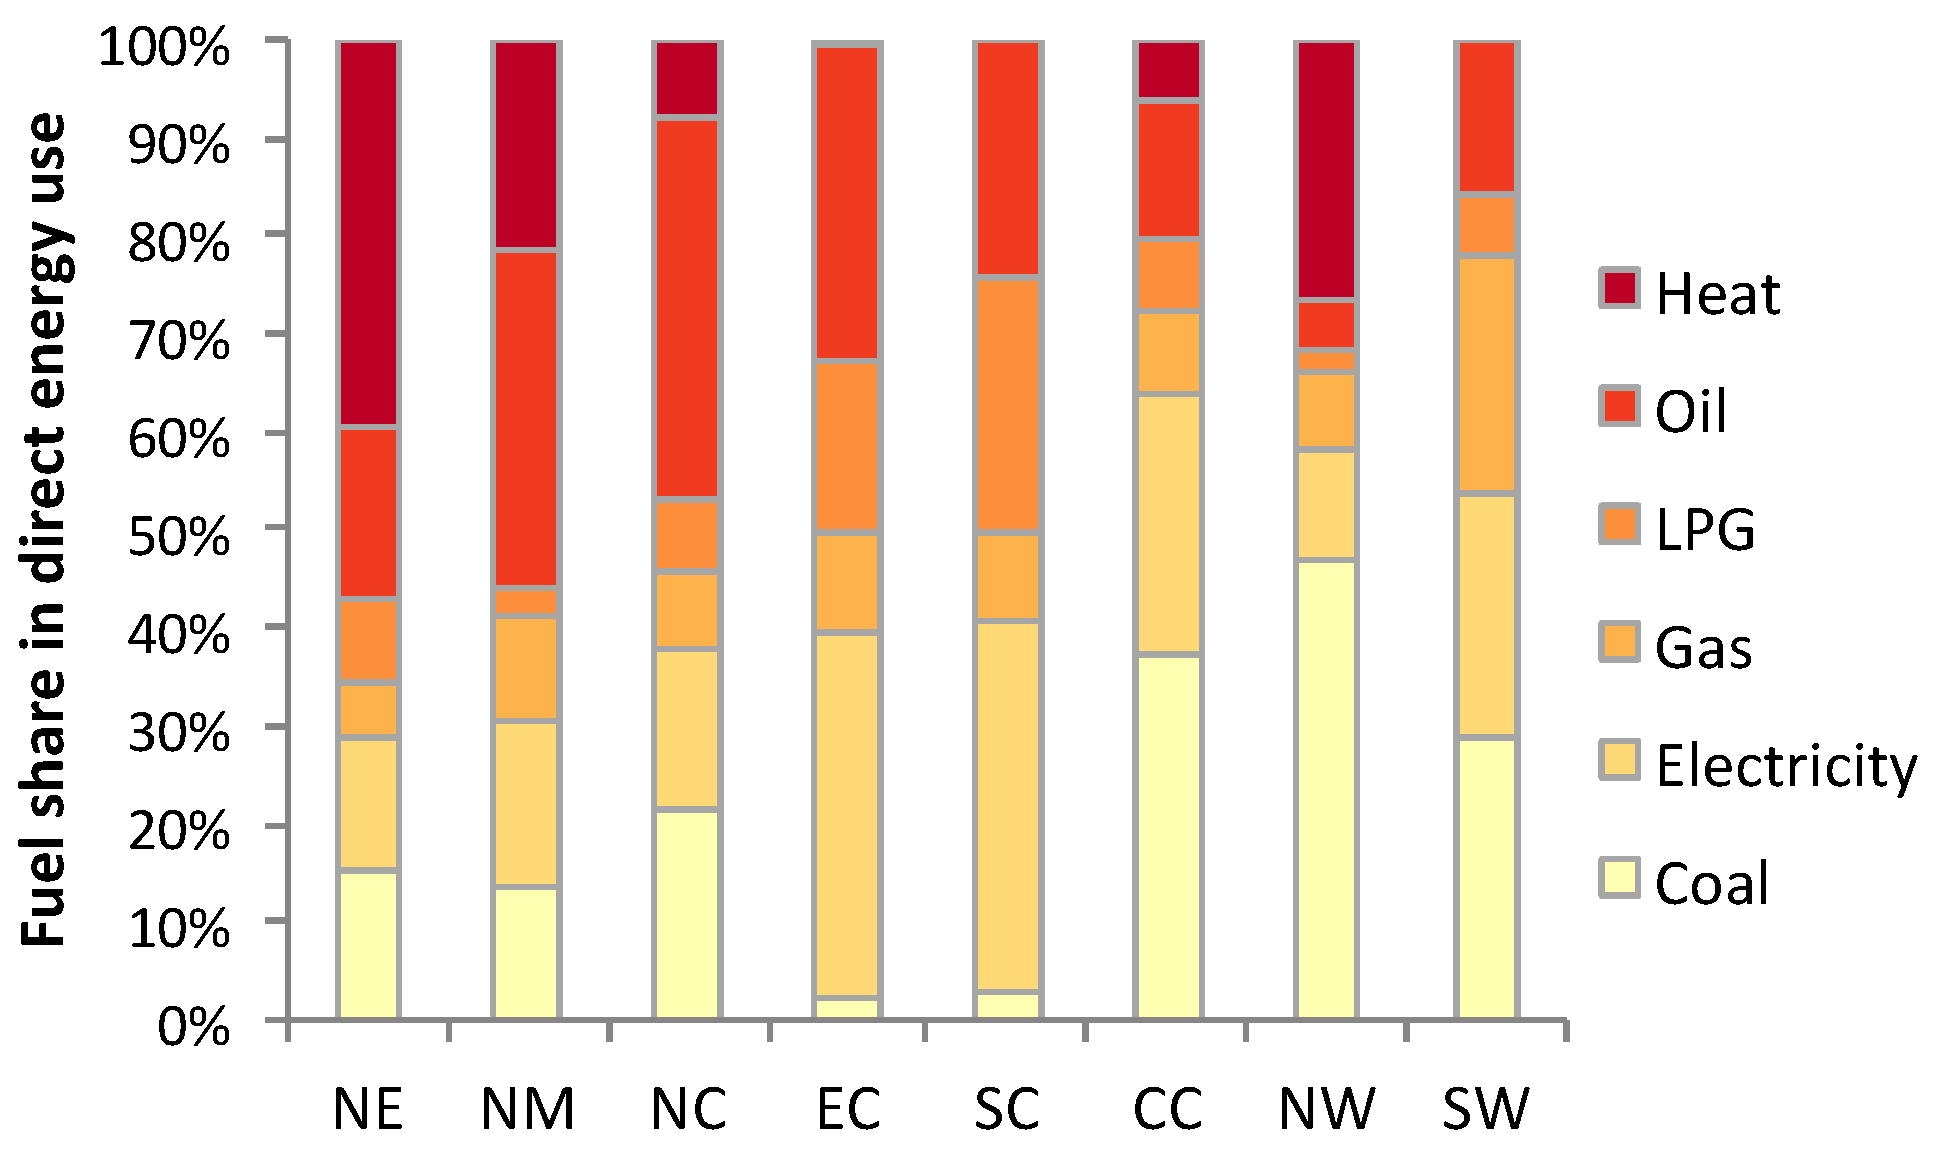
Households in China have engaged in significant interfuel substitution over the past decade. Moreover, the fuel mix of direct residential energy use varied across regions (see
Figure 3). Nationwide, coal’s share reduced sharply from 51% in 2002 to 24% in 2012 and the share of liquefied petroleum gas (LPG) reduced from 13% to 9%. During the same time period, oil’s share jumped from 4% to 22%, electricity’s share rose from 17% to 23%, the share of centralized steam heat rose from 7% to 12%, and the share of natural gas rose from 8% to 10%. Still, as of 2012, coal remained a major energy source for households in less-developed Central China (37%), Northwest (47%), and Southwest China (29%). In the wealthy East Coast and South Coast, household direct use of coal contributed just 2% of all direct residential energy use in 2012.
Over the past decade, personal mobility in China has risen rapidly. Private car ownership escalated at an annual average rate of 25% from 9.7 million in 2002 to 88.4 million in 2012. Car ownership has led to skyrocketing demand for petroleum products [
16]. Electricity also has played an important role in the lives of households across all regions. This is especially the case in the East Coast and the South Coast, which now accounts for over 38% of residential direct energy use. The share of natural gas in direct residential energy use was low in all regions in 2002. Its share was higher in the Northwest and Southwest China, where China’s natural gas bases are located. Since 2005, however, since the inception of a state project entitled “Transmit Natural Gas from Western Areas to East China”, residents in coastal areas have begun using natural gas in their homes. Cleaner and more convenient natural gas began and will continue to play a more important role in Chinese households’ lives.
Residential direct energy use depends highly on climate [
20]. To improve thermal comfort, the use of heat and other directly used fuels have increased in China during the past decade. The share of centralized heat rose from 7% in 2002 to 12% in 2012. The Chinese government provides central heating to urban households in most northern Chinese cities. The shares of heat and other fuels rose most rapidly in China’s coldest northern regions. From 2002 to 2012, residential directly used heat per capita increased from 35 kg SCE to 148 kg SCE in Northeast China, from 75 kg SCE to 109 kg SCE in North Municipalities, from 20 kg SCE to 99 kg SCE in Northwest China, and from 8 kg SCE to 26 kg SCE in North Coast. In 2012, heat accounted for 40% of residential directly used energy in Northeast China, 26% in Northwest China, 22% in North Municipalities, and 8% in the North Coast.
With rising income and the improved availability of commercial energy, more Chinese households are trending toward using cleaner, more efficient, and more convenient fuels. They are gradually replacing traditional noncommercial fuels and coal, which are both dirty and less energy efficient. Climate differences affect regional household direct energy use through both heating and cooling requirements. With income increases, rapid urbanization, and lifestyles changes in China, households’ demand for thermal comfort has been rising.
3.2. Residential Indirect Energy Use
Compared to direct energy use, households use more energy indirectly. From 2002 to 2012, indirect energy use by households increased at an average annual rate of 5.7% from 484.9 Mtce to 836.4 Mtce. Household indirect energy use rose in all regions. The North Coast (6.6%), South Coast (8.2%), East Coast (7.4%), Southwest China (6.4%) and Central China (5.7%) all enjoyed above annual average rises in household indirect energy use. However, the rises in the Northwest China (4.8%), Northern Municipalities (3.0%), and Northeast China (1.8%) were slower than the national average level.
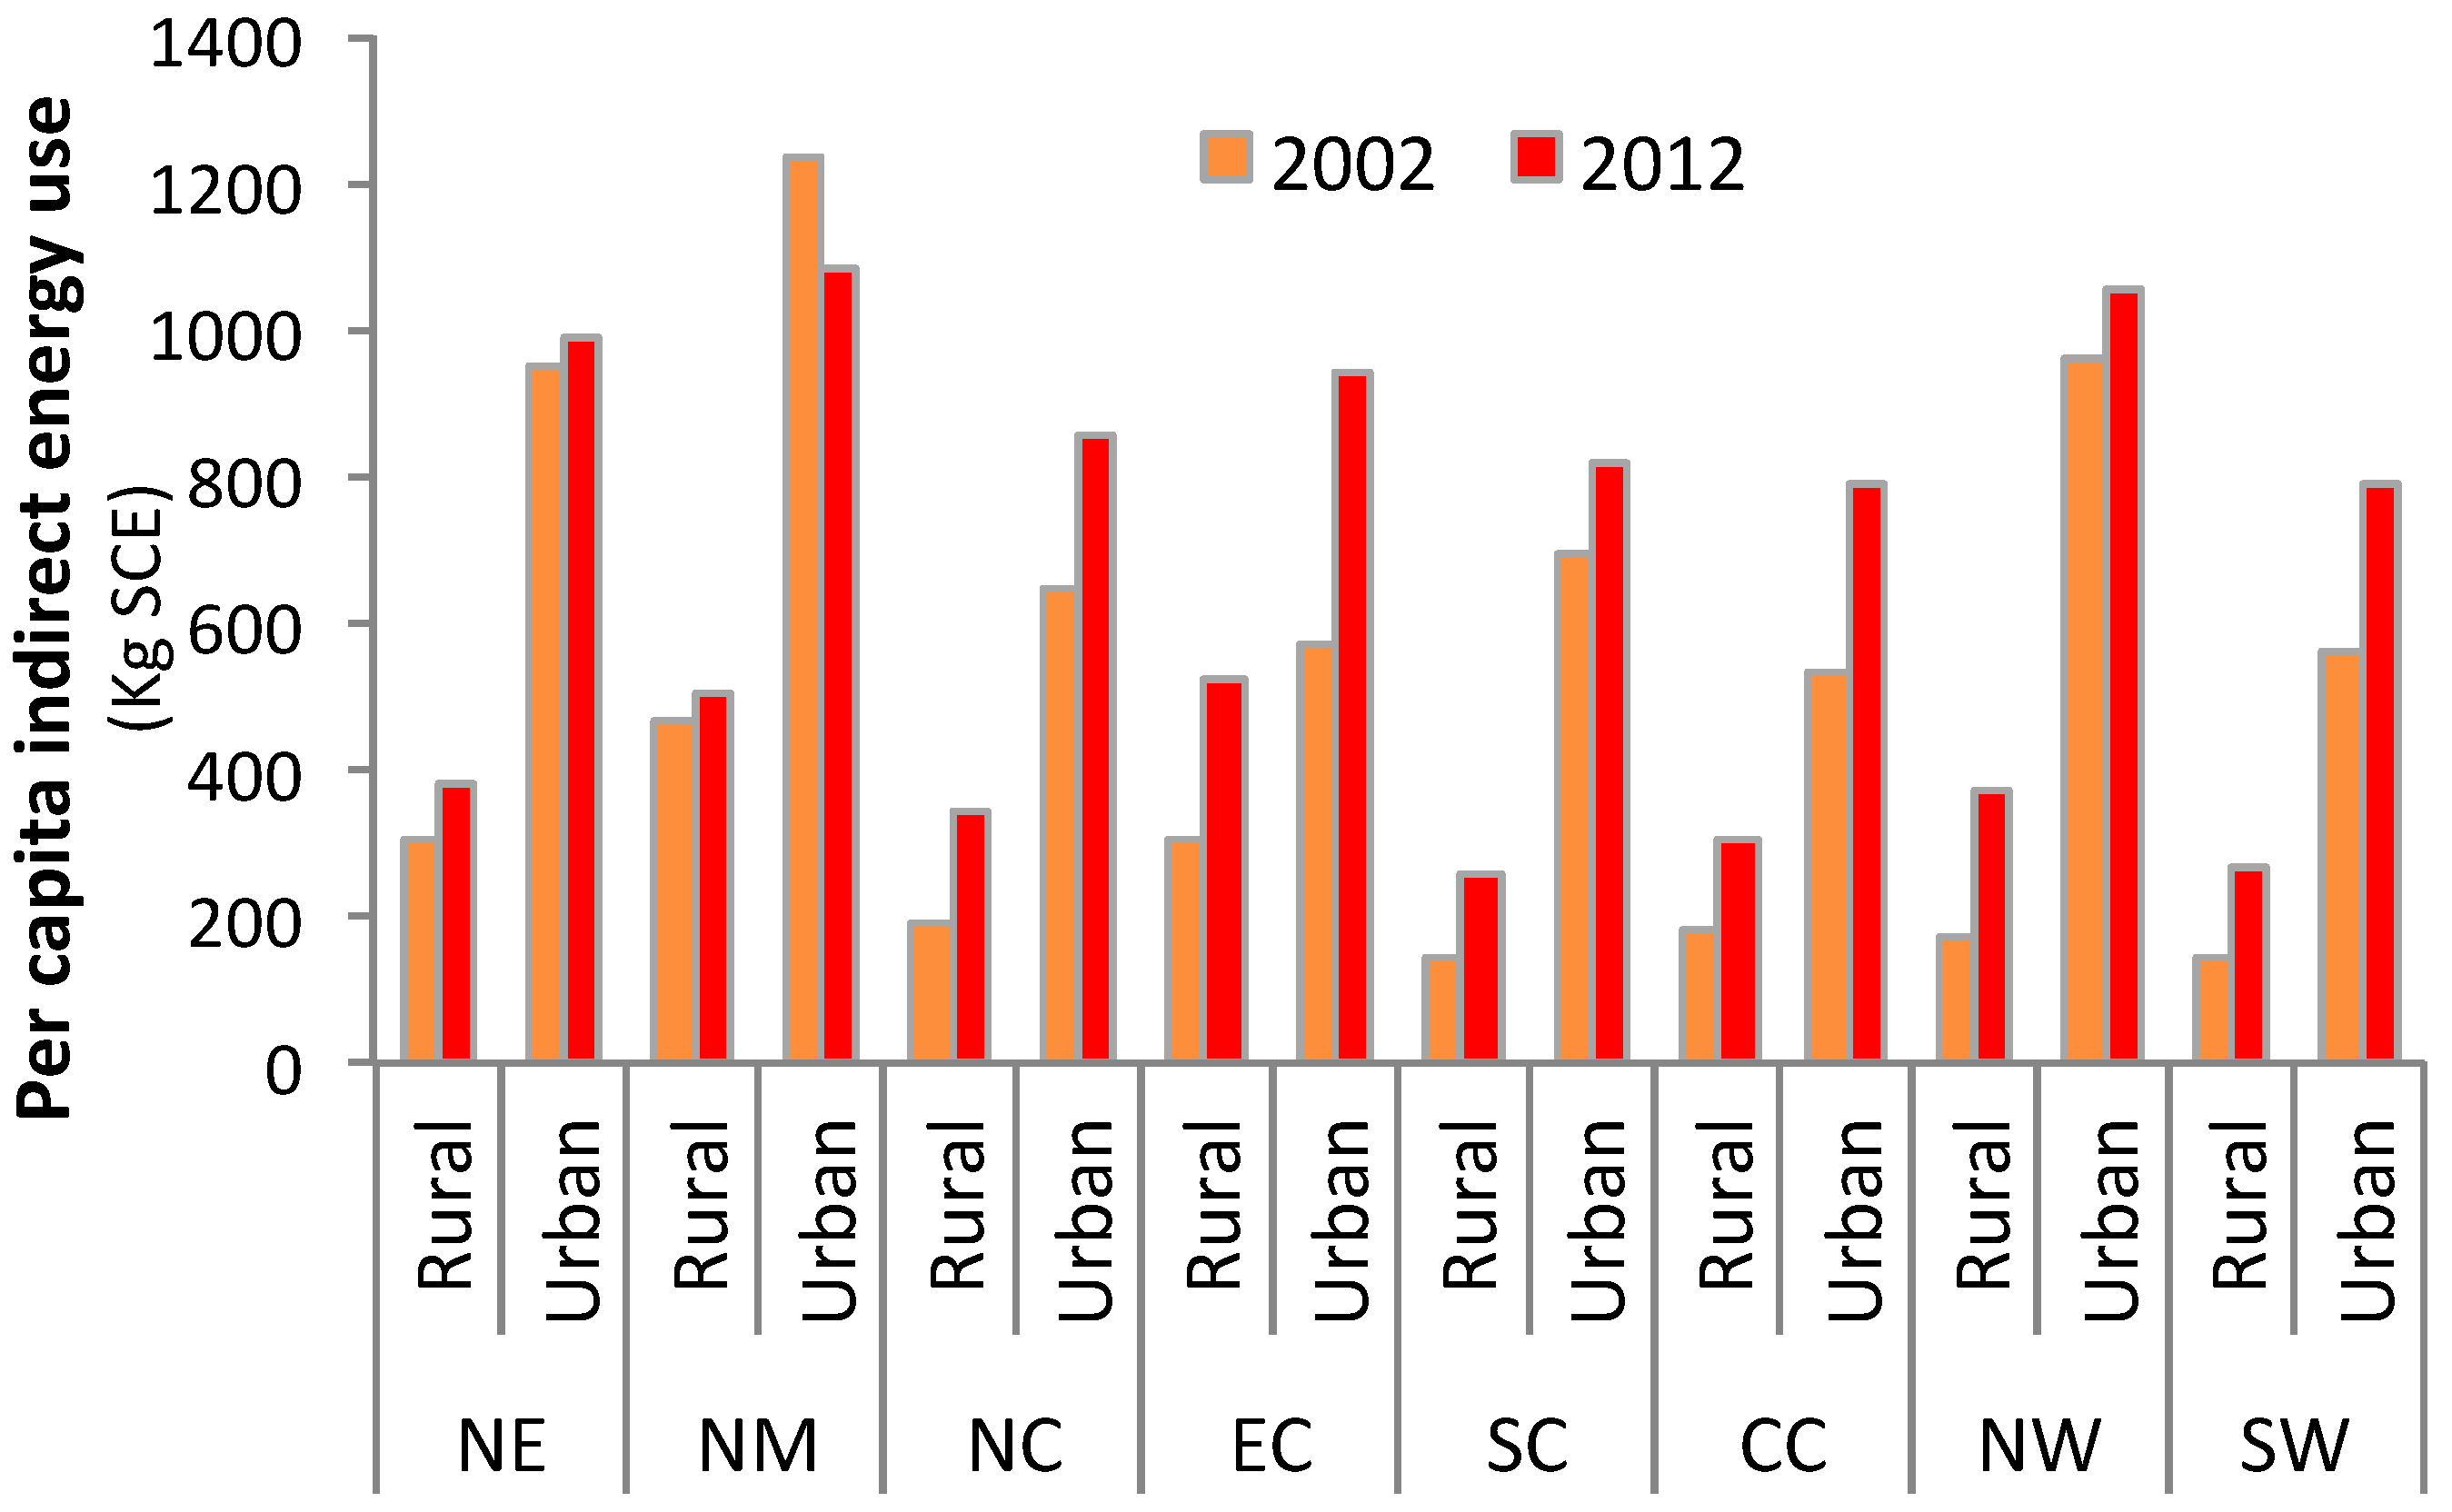
Energy embodied in household consumption varied widely across regions and even between rural and urban areas in the same region. In 2012, indirect energy consumption of urban households varied from 1085 kg SCE per person in the North Municipalities to 790 kg SCE per person in Central China. Regional disparities in households’ indirect energy use are likely caused most by both climate and the disparities in household income across regions. Rural households in the East Coast consumed more energy indirectly than did their counterparts in other rural regions. Rural households in the warm South Coast only consumed 79% of the average rural household indirect energy consumption level. Rural households in less-developed Southwest China and Central China consumed about 18% and 9% less than the average level of rural China, respectively. In addition, rural households in cold Northeast and Northwest China consumed about 14% more than the average level (see
Figure 4).
The within-region rural-urban gap in per capita household indirect energy use is generally larger than interregional disparities. In 2002, rural residents consumed less than 40% of that consumed by their urban counterparts, regardless of the region. Even in the relatively developed East Coast and the Northern Municipalities, rural residents only consumed 56% and 46% of their urban counterparts’ indirect energy consumptions, respectively. Compared to its urban counterparts, the level of consumption per rural household grew more quickly. From 2002 to 2012, the gap in per capita indirect energy consumption between urban and rural residents declined in all regions. In 2002, per capita indirect energy use of a typical urban resident was 3.7 times that of a typical rural resident. This ratio decreased to 2.7 by 2012. In 2012, this urban-to-rural ratio varied from 3.1 in South Coast to 1.8 in the East Coast. With rapid urbanization, rural residents migrated to urban areas. In doing so, they gradually adopted local urban lifestyles with high ownership of electric appliances. Thus, urbanization is likely to continue to be an important determinant of the growth in energy use.
From 2002 to 2012, the average amount of embodied energy consumed by urban households in China increased at an average annual rate of 2.5% from 682 kg SCE per person to 876 kg SCE, while indirect energy consumed by rural household rose much faster at an average annual rate of 5.9% from 186 kg SCE per person in 2002 to 331 kg SCE in 2012 (See
Figure 4). Per capita household indirect energy use augmented in most regions, except for urban households in the North Municipalities. For urban residents in the North Municipalities, the average indirect energy use decreased at an average annual rate of 1.3% from 1235 kg SCE in 2002 to 1085 kg SCE in 2012. The growth of rural residents in the North Municipalities was also lowest from 2002 to 2012.
3.3. The Contributions of Different Drivers to Household Indirect Energy Use
Household indirect energy use rose 16.7% from 482 Mtce in 2002 to 836 Mtce in 2012. Here, we examine how regional aggregate household energy demand is affected by changes in the household consumption baskets, changes in the level of consumption per capita, changes in urbanization, and population changes based on SDA. From 2002 to 2012, changes in per capita household consumption (
) contributed most to the rises in household indirect energy use in all regions (see
Table 2). It drove up household indirect energy use by 70% in China. Changes in production energy efficiency (
) offset increased due to changing household consumption per capita in most regions, except in the East Coast and Southwest China.
The changing structure of intermediate inputs () also drove the rise of household indirect energy use in all regions. Changes in the trade structure of intermediate inputs () had slightly increased household indirect energy use in all regions from 2002 to 2012. It enhanced indirect energy use by 14% in the South Coast and by 11% in the East Coast. Changes in the trade structure of final goods and services () drove up household indirect energy use in all regions, especially in the East Coast, South Coast, Central China and Southwest China. Compared to effects of other factors, those from changes within the household consumption baskets () were relatively trivial in all regions. However, it enhanced indirect energy use slightly in the coastal regions. That is, households in Coastal regions adopted more energy-intensive purchasing patterns.
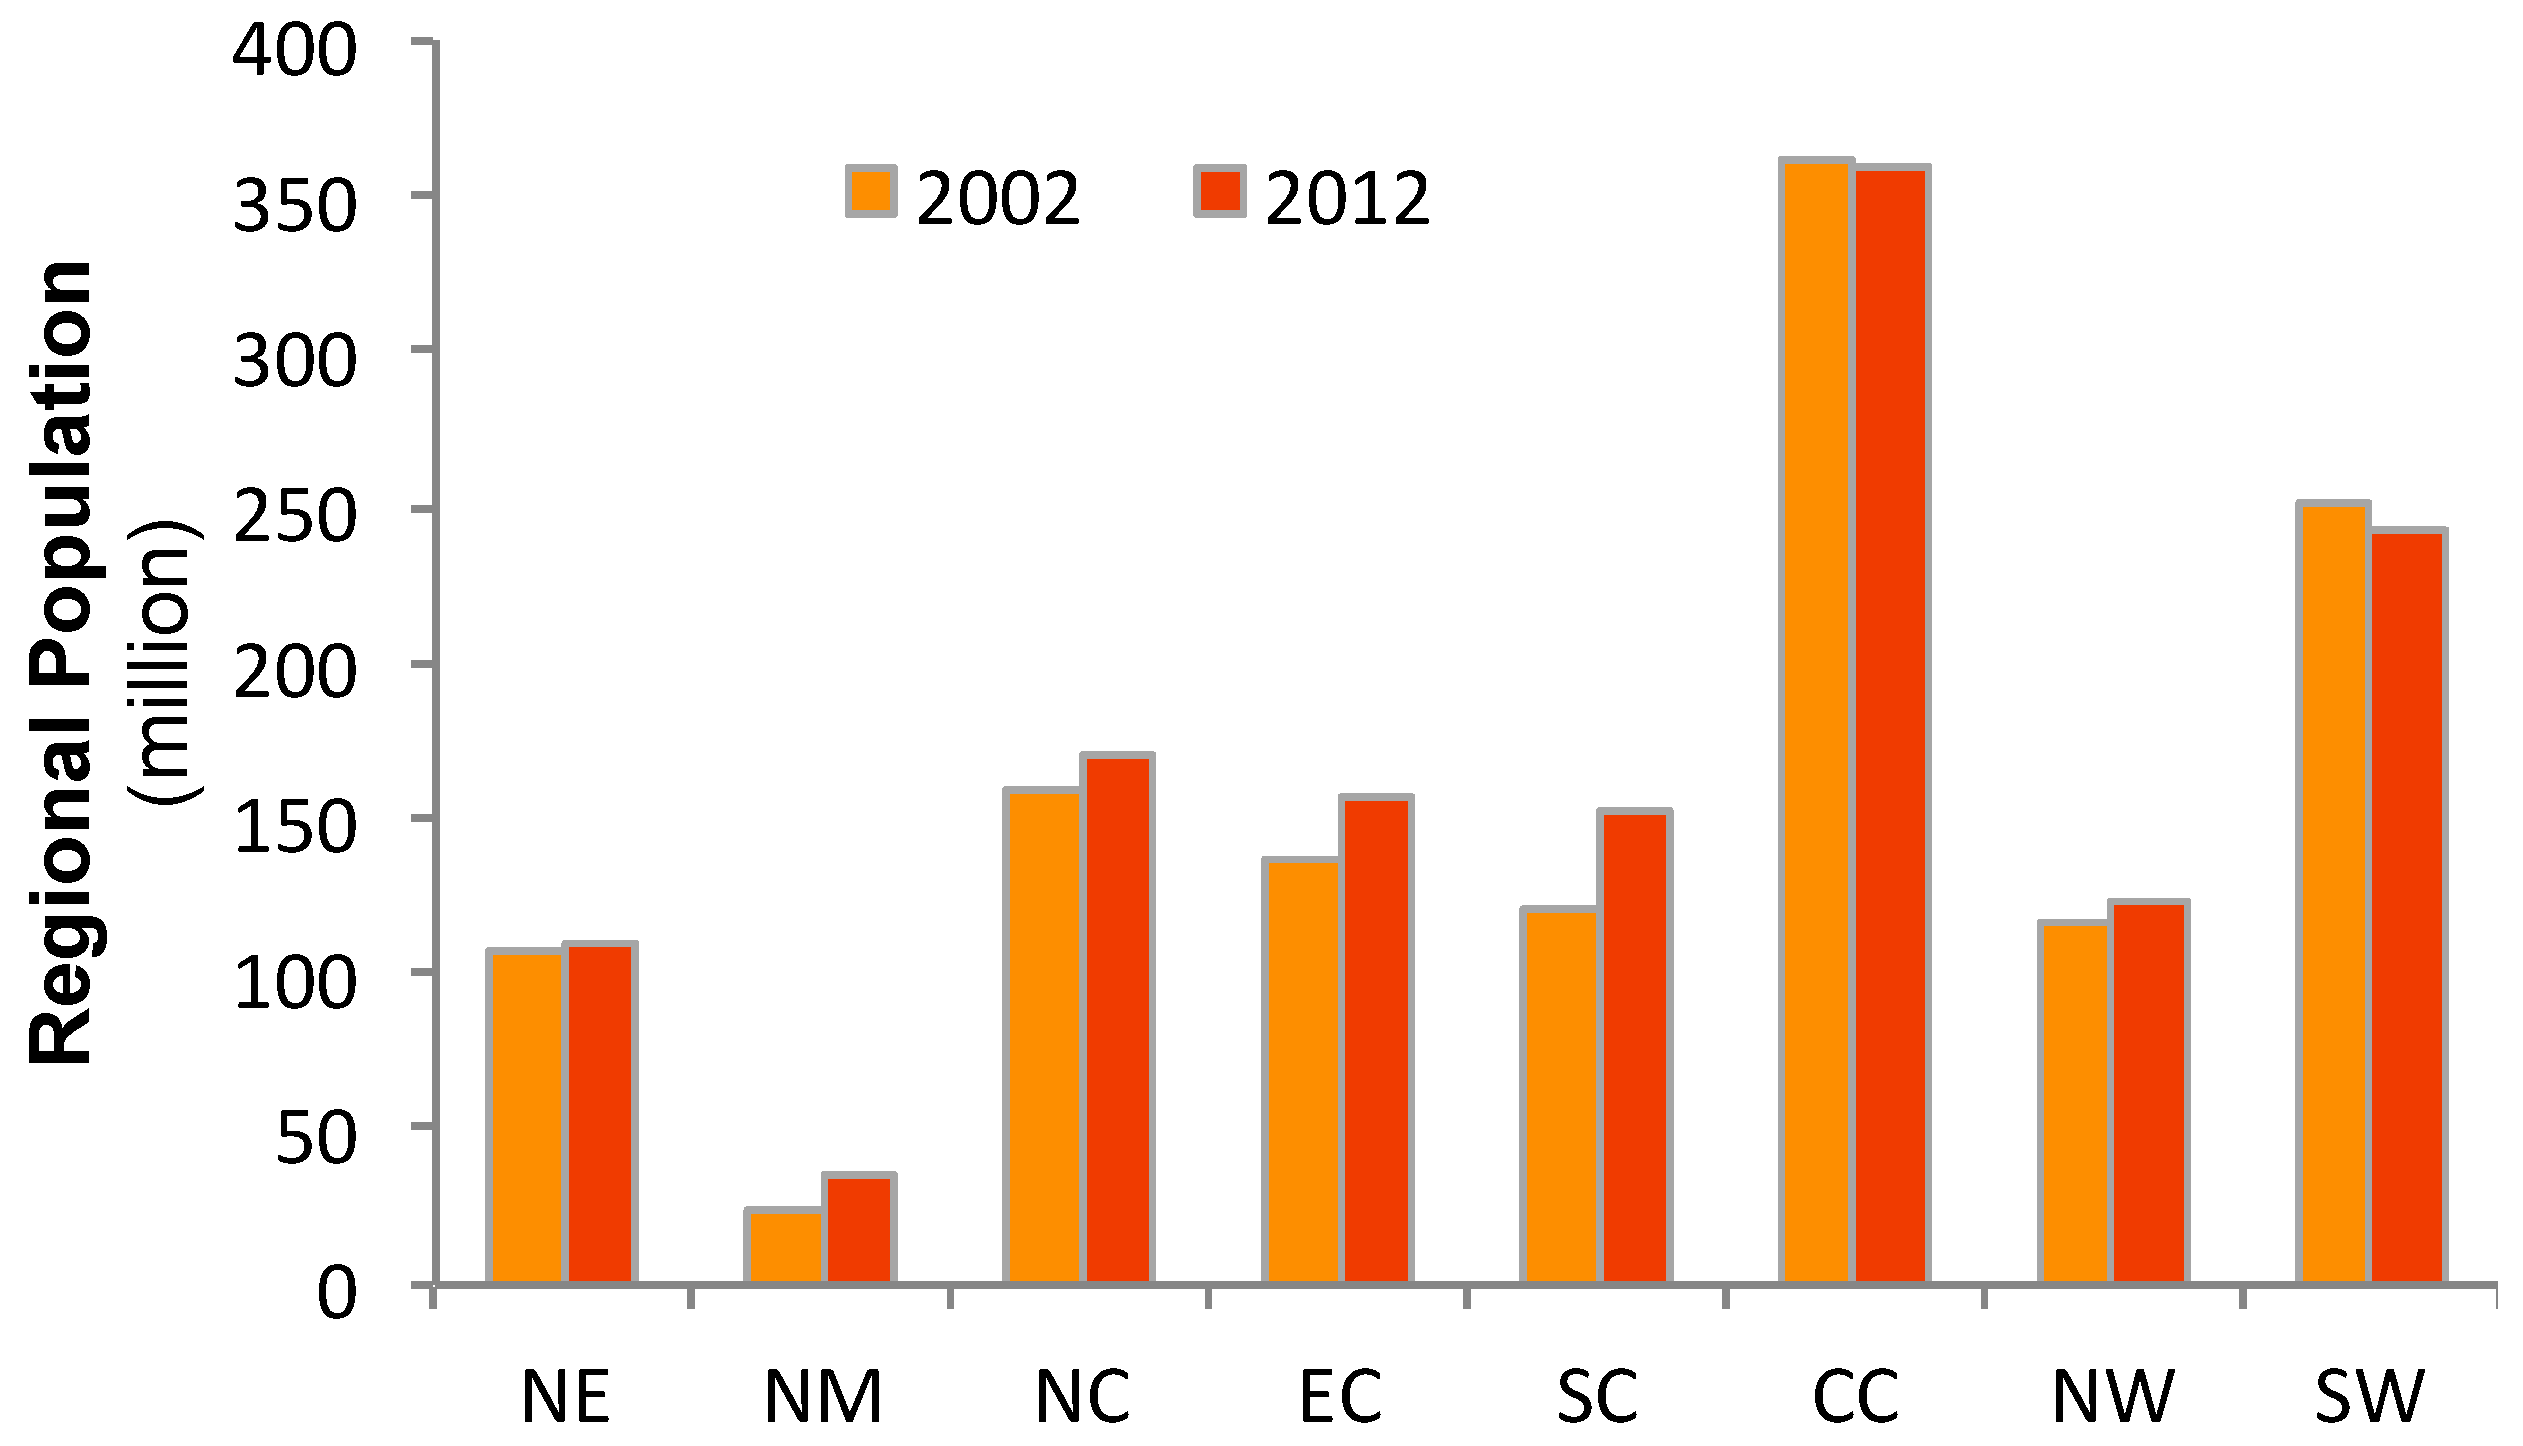
Regional population change (
) drove up household indirect energy use in most regions. Changes in total population increased household indirect energy use by 42% in the Northern Municipalities, 35% in the South Coast, and 21% in the East Coast. However, changes in total population damped household indirect energy use by 5% in the Southwest China and 1% in Central China. After the implementation of the “One Child Policy” in the 1980s, population growth rate slowed in China. China’s total population increased at an average annual rate of just 0.6% from 1275 million in 2002 to 1348 million in 2012. Nonetheless, the Northern Municipalities and the South Coast enjoyed average annual population growth rate of 3.7% and 2.3%, respectively, during the decade. Furthermore, the number of inhabitants in the East Coast and North Coast grew 1.5% and 0.7% annually (see
Figure 5). During this decade, the population in coastal China rose faster than elsewhere. Generally speaking, China’s people have been migrating from the nation’s hinterland to its coast in search of better job opportunities [
30]. The large stream of migrants from China’s less-developed interior to its more-developed coast was largely responsible for increasing the amount of direct and indirect energy use by households there.
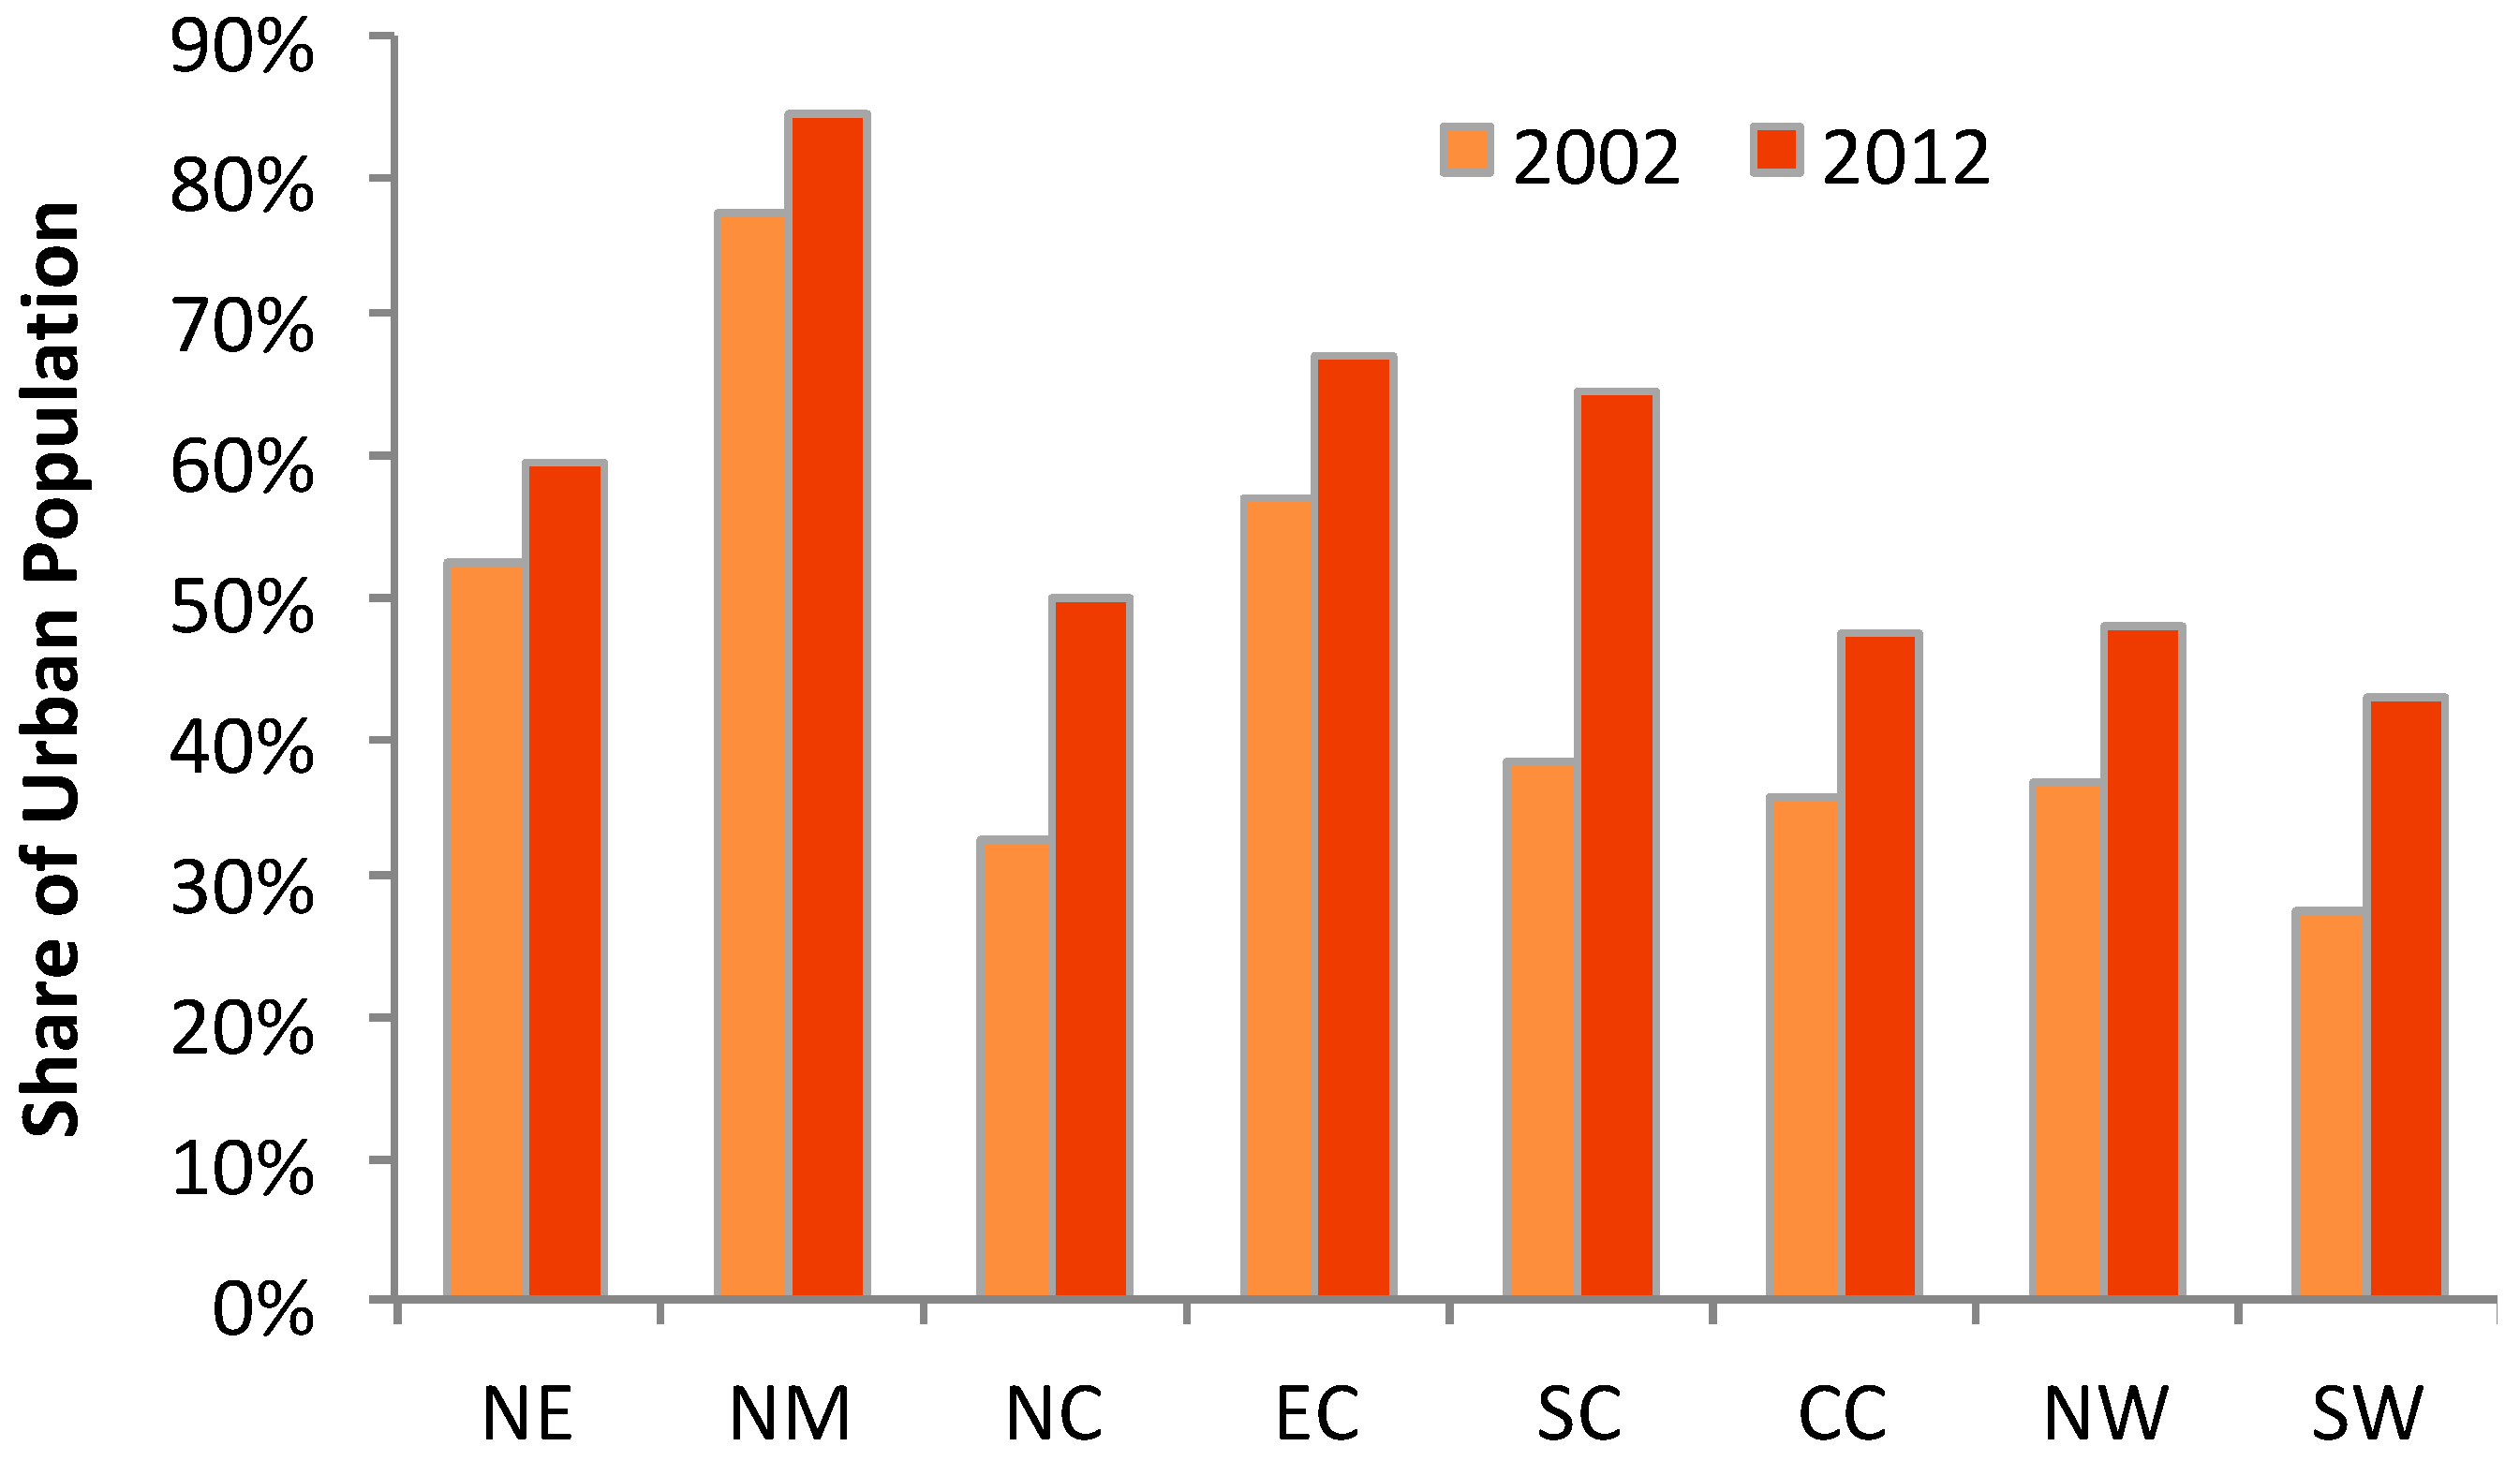
Rural-to-urban migration also increased household indirect energy use in all regions as former rural households adopted urban lifestyles. The share of population living in urban China rose from 38.6% in 2002 to 53.1% in 2012. The rate of urbanization varied by region (see
Figure 6). Not surprisingly, urbanization levels of coastal areas (except the North Coast) and Northeast China are much higher than in Central and Western China. Changes in the urbanization levels (
) significantly increased household indirect energy use in the South Coast (47%), Southwest China (27%), and North Coast (25%). The share of urban population rose more quickly in these three regions than elsewhere in China from 2002 to 2012. The share of people living in urban areas increased from 38% to 65% in the South Coast, from 33% to 50% in the North Coast and from 28% to 43% in Southwest China.
3.4. Changing Trend of Household Consumption Pattern
Per capita household indirect energy use rose in all rural regions and most urban regions, except in the North Municipalities. As mentioned above, most of these rises were caused by increased household consumption levels and by changed trade structure of final goods and services. The rapid rising final demand of Chinese households drove per capita household indirect energy use at average annual rates that ranged from 6.8% in the East Coast and Southwest China to 1.1% in the South Coast. The effects of rising household consumption levels even outpaced the effects of efficiency gains in the East Coast and Southwest China.
For both urban and rural residents, strong growth in the use of
Metal Products accounted for much of the rise in household indirect energy use across all regions (see
Table 3). For urban households, per capita indirect energy use through
Metal Products grew 137 kg SCE in the South Coast and 110 kg SCE in the East Coast. Rural households also enjoyed a substantial rise in household indirect energy use through the use of
Metal Products, ranging from 67 kg SCE in the East Coast to 17 kg SCE in Southwest China.
Chemical Products also played an important role in increasing household indirect energy use in all regions, except in the Northern Municipalities.
Non-metallic Mineral Products contribute significantly to the increment of indirect energy use in all rural regions. Due to the rising demand of these products, per capita household indirect energy use through
Mining grew substantially in most regions.
For urban households,
Transportation & Trade played an important role in increasing household indirect energy use in all regions, except in the South Coast and Northwest China. In addition, per capita indirect energy use through
Education, Health & Other Services rose in most regions, except in Northern Municipalities and the South Coast. For rural households, per capita indirect energy use through
Transportation & Trade and
Education,
Health & Other Services grew substantially in all regions.
Electricity & Gas Consumption contributed significantly to the growth of per capita household indirect energy use in rural China. This was also the case for urban areas of the relatively less-developed North Coast, Central China, Northwest and Southwest China and well-developed East Coast. This is not only due to the increased ownership and usage of electrical appliances, but also due to the increased electricity usage to produce goods and services [
10].
3.4.1. Electric Home Appliances Usage
Home appliances enable either time-saving benefits or a shift in demand for sanitation or comfort [
36]. Regardless, the increased use of such appliances reflects a substantive change in lifestyle. It also contributes substantially to the growth of residential energy consumption. Home appliances like color TVs, washing machines, and refrigerators had already penetrated the lives of most urban households in all regions of China by 2002. From 2002 to 2012, the use of home appliances rapidly spread to all rural regions. From 2002 to 2012, home appliance ownership per 100 rural households rose from 61 to 116 for color TVs, from 32 to 67 for washing machines, and from 15 to 99 for refrigerators. But ownership of some home appliances by rural households varied widely across regions. In rural areas, the ownership of air conditioners was higher in the Northern Municipalities and the East Coast. Although ownership of home appliances appears to have saturated urban China and most of rural China, ownership of these items remains lower than in developed countries. In Japan, households owned 1.2 refrigerators and 2.2 air conditioners on average in 2000 [
37]. If Chinese households opt for a lifestyle that is more like that in Japan, the demand for refrigerators and air conditioners will cause substantial rises in energy use.
3.4.2. Space Heating and Cooling
With increased demand for indoor thermal comfort, Chinese households’ demands for heating and cooling are expected to rise rapidly. This will greatly increase household direct energy use in winter and summer. Heating demands will likely increase rapidly in the Hot Summer, Cold Winter Zone, where governmental central heating is not provided.
Compared to heating, space cooling remains a relatively less important energy use in many developing countries. Nevertheless, its demand is growing quite rapidly in China [
38]. The demand for cooling is high in the South Coast, the East Coast, and Central China, where the weather is hot and humid for more than nine months every year. Energy consumption for cooling is highly related to appliance ownership. Most households in urban areas of the South Coast, the East Coast, and the Northern Municipalities have more than one air conditioner. On average, rural households in the Northern Municipalities and the East Coast owned about one air conditioner per family. However, the ownership rate of air conditioners is very low in other rural areas. Regional disparities in air conditioner ownership suggest that space-cooling demand is affected by both the prevailing climate and household income level. Households in the relatively developed Northern Municipalities have much higher ownership rates than do households in the North Coast, even though these two regions have similar climates. With increased income, cooling demand is expected to rise in the urban areas of Central China and the North Coast, as well as nearly all rural areas in China. Due to the increasing demand for cooling in rural China as well as urban areas in Central China and the North Coast, electricity usage during summers is also expected to increase. Local governments face an urgent question of how to meet the rising electricity demand and how to ameliorate “summer peaks” in electricity demand.
3.5. Role of Interregional Trade
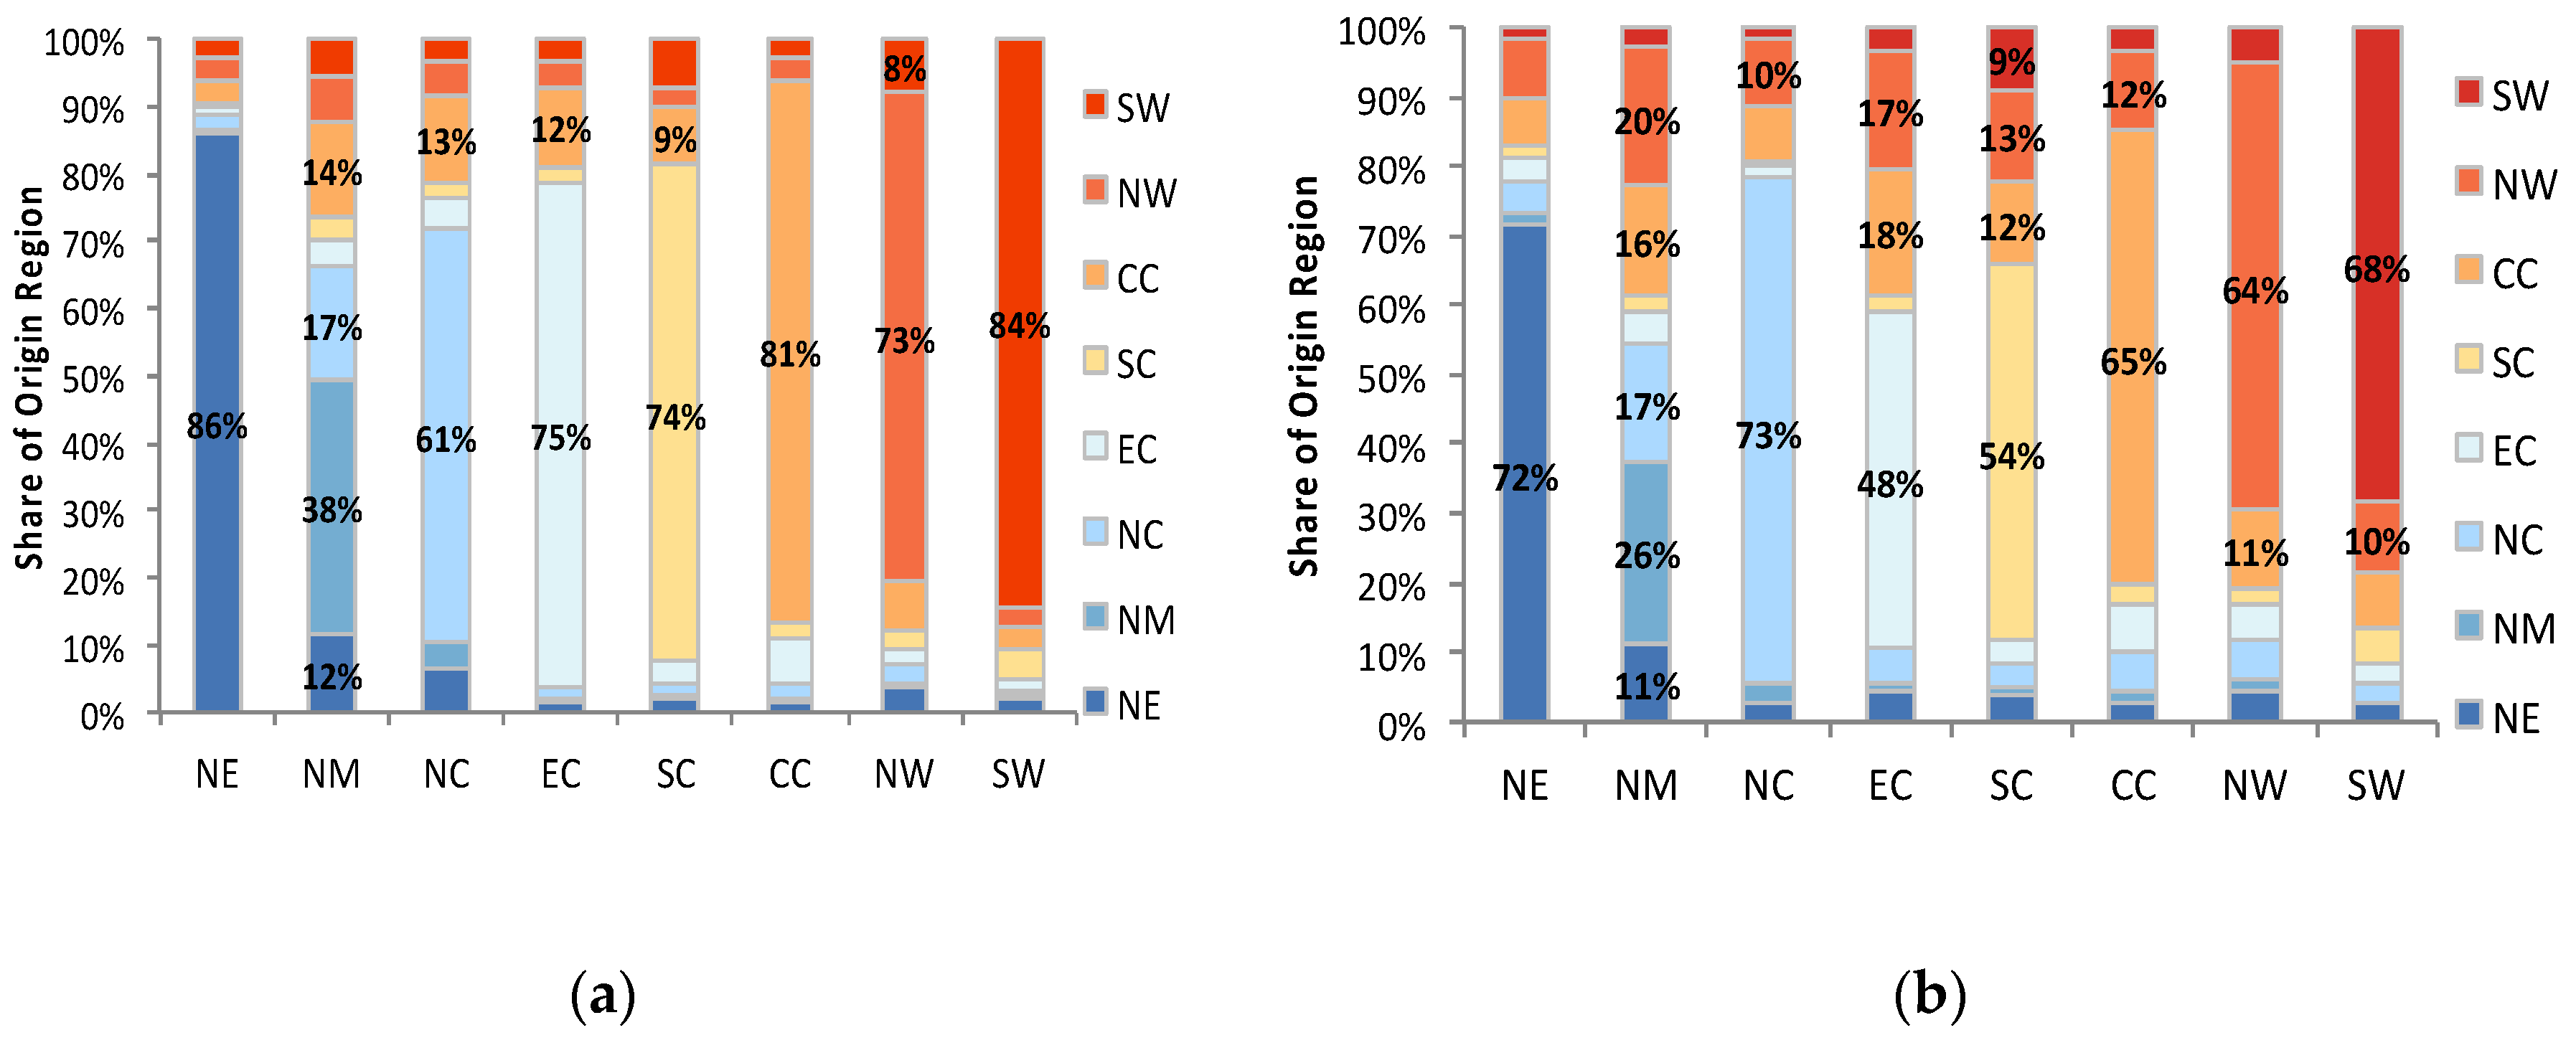
From 2002 to 2012, Chinese households relied heavier on interregional trade to meet their household indirect energy use. The contribution of interregional trade to household indirect energy use rose from 24.8% in 2002 to 38.4% in 2012. In 2012, interregional trade contributed 321.2 Mtce of household indirect energy use. In 2002, households in the coastal regions, especially in the Northern Municipalities relied heavily on interregional trade to meet their indirect energy needs (see
Figure 7a). As the main coal-producing region, Central China was a key source of indirect energy for other regions, contributing a significant share of indirect energy to other regions. In 2002, Central China contributed 14% of indirect energy use in North Municipalities, 13% in North Coast, 12% in East Cast and 9% in South Coast. Most of the indirect energy was embodied in
Mining, Metal Products, and
Chemical Products. Central China also accounted for a significant share of household indirect energy use through its supply of
Electricity, Gas & Water Supply to other regions, especially to the Northern Municipalities and the East Coast. The North Coast and Northeast China are also important contributors to nearby Northern Municipalities’ household indirect energy use. The North Coast contributed 14% of the North Municipalities’ indirect energy use, mainly through the demand for
Chemical Products and
Electricity, Gas & Water Supply. Northeast China contributed 12% of North Municipalities’ indirect energy use, mainly through the demand for
Chemical Products,
Metal Products, and
Trade & Transport.
From 2002 to 2012, all regions but the North Coast relied even more heavily on interregional trade of final goods and services to meet their households’ indirect energy needs (see
Figure 7b). Central China, Northwest China, and North Coast played important roles in 2012 in providing indirect energy resources as embodied in goods and services delivered to households in other regions. Northwest China provided about 20% of energy indirectly used by households in North Municipalities, 17% in East Coast, 13% in South Coast, 12% in Central China and around 10% in Northwest and Southwest China. Most of the indirect energy provided by the Northwest China was through
Mining and
Electricity,
Gas & Water Supply. The North Coast contributed 17% of households’ indirect energy use in the North Municipalities and around 6% in Central China, Northwest China, East Coast, and Northeast China. The East Coast provided 7% of the indirect energy in Central China and around 5% of the indirect energy in Northwest China, the North Municipalities, and South Coast. In addition, the Southwest China contributed 9% of the indirect energy in South Coast and 5% of the indirect energy in Northwest China. Changes in the domestic trade structure of final goods and services (
) drove up household indirect energy use in all regions, especially in the East Coast, South Coast, Central China, and Southwest China (see
Table 2).
4. Conclusions and Outlooks
Household energy use varies across China’s regions. In 2012, per capita direct energy use by households varied from 506 kg SCE in the Northern Municipalities to 181 kg SCE in Central China. Due to colder weather patterns, residents in Northern China consumed more energy directly than did their southern counterparts. Compared to energy that they used directly, Chinese households consumed more energy indirectly as embodied in the goods and services they consume. Regional differences in energy embodied in household consumption are also large. In 2012, urban households in the North Municipalities consumed 1085 kg SCE energy per capita indirectly, while their counterparts in Central China consumed just 790 kg SCE per capita. The disparities in household indirect energy use between urban and rural residents within the same region are even larger than interregional disparities across China. In most regions, rural residents consumed less than 40% of what their urban counterparts consumed indirectly. Much of the differences is due to the relative self-sufficiency of rural households as well as the extreme wealth gap between urban and rural areas of China.
From 2002 to 2012, per capita household indirect energy use rose in all regions, except in the North Municipalities. Increasing levels of household consumption contributed most to the increment of household indirect energy use. Improved energy efficiency in production offset the rising effects of heightened household consumption in most regions. Fast urbanization and interregional migration from hinterland to coastal regions contributed heavily to the rise of household indirect energy use in China.
As a spatially large and heterogeneous country, it is crucial to identify differences in China’s regional household energy consumption patterns as well as the key forces that drive differences in the growth of household energy use to design appropriate region-specific energy conservation policies. This paper provide a compressive analysis of the changing trends of China’s regional household energy use from multi-angles and yields some interesting and relevant implications.
First, Chinese households have engaged in significant inter-fuel substitution during the past decade. Cleaner electricity and natural gas have been substituting coal in Chinese households. Since 2012, the rising public call for clean air has promoted the government to expedite the shift from coal to natural gas. This fuel shift led to an acute shortage of natural gas in the winter of 2017 [
39]. Furthermore, the rapidly rising ownership of private cars drove up petroleum consumption. Due to the relatively small pool of oil and natural gas reserves, China mostly depends on imports to meet the rising oil demand. To ensure energy security, China should expedite building its storage capacity such as more distributed oil and gas storage infrastructure to prevent future gas shortages. In addition, for any measure to run after a “blue sky”, local governments should fully consider residents’ needs and tailor policies according-to local conditions.
Second, direct household energy use is highly affected by climate conditions. With rising demand for thermal comfort, electricity demand is expected to rise rapidly in all regions, especially in rural areas. Improving the energy efficiency of air conditioners will remain an important way to achieve energy conservation. Thus, China should adopt stringent energy efficiency standards for boilers, furnaces, and air conditioners to improve their overall energy efficiency. At the same time, the Chinese government should promote highly efficient products by labeling, offering subsidies, tax credits, or low interest loans to households to encourage their use.
Third, interregional trade also played increasingly important roles in household indirect energy use in all regions from 2002 to 2012. Households increasingly relied on interregional trade to meet their energy needs. Central China, Northwest China, and North China are the main suppliers of household indirect energy use. That is, energy is flowing from Northwest China, Central China, and North China to the coast directly in forms of energy resources, as well as indirectly as energy-intensive goods and services produced in these regions. Energy intensities of these three net energy-exporting regions are higher than the national average. Thus, energy efficiency improvements focused on these regions, especially in the energy-intensive Electricity, Gas & Water Supply and Metal Products sectors would have a major effect on household energy use across all regions.
Fourth, rapid urbanization increased household indirect energy use in all regions. People migrated to economically developed and urbanized coastal areas for better job opportunities. Baeumler et al. [
40] projected that China’s small and medium-sized cities will experience the greatest increase in urban population over the next 15 years. Rapid urbanization in these cities will lead to a great surge in demand for infrastructure construction as well as city planning. Urbanization will lead to more energy demand in
Metal Products,
Non-metallic Mineral Products,
Transportation & Trade and
Education, Health & Other Service sectors. Thus, it is both a challenge and an opportunity for local planners and government to develop these cities in a smart and compact way and improve energy efficiency in the key energy intensive sectors.
Last but not least, guiding Chinese residents’ lifestyles toward greener consumption will be a critical strategy for future energy conservation in China. The Chinese government should play a central role in promoting green consumption by implementing regulations, like stricter building codes and energy efficiency standards for electric appliances. In addition, the government and non-government organizations (NGOs) should educate schools and communities on sustainable production and consumption, in an effort to help Chinese households become more aware of sustainable lifestyles.


