Article

Influence of Rice Straw Fibers on Concrete Strength and Drying Shrinkage

Concrete Industry Management Program, California State University-Chico, Chico, CA 95929, USA
Sustainability 2018, 10(7), 2445; https://doi.org/10.3390/su10072445
Submission received: 1 June 2018 / Revised: 9 July 2018 / Accepted: 10 July 2018 / Published: 13 July 2018
(This article belongs to the Special Issue Sustainable Cementitious Materials for the Construction Industry)

Abstract

:
Fibers have been used in construction materials for centuries. This study investigated the impact of the addition of rice straw fibers (RSF) on the compressive and flexural strengths of concrete, drying shrinkage, and on the heat of cement hydration. RSF was saturated before being added to concrete. Addition of RSF in concrete reduced concrete strength, increased concrete drying shrinkage, and increased the induction period of cement hydration. It was suggested that water squeezed out of RSF during mixing and sample consolidation increased effective water-to-cement ratios (w/c) and resulted in reduction of concrete strength and increase of concrete drying shrinkage. The increase of retardation time was attributed to leaching of organic and inorganic compounds out of RSF into the pore solution. It was shown that samples containing washed RSF did not have noticeable improvement in compressive strength over samples containing unwashed (as received) RSF. However, samples containing washed RSF had lower drying shrinkage and shorter induction period compared to those containing unwashed RSF.

1. Introduction

Utilization of fibers in construction materials has a long history. The oldest form of fibers used in construction materials, such as bricks and masonry mortar, were straw and horsehair [1]. Today, several types of fibers are manufactured and are used in various engineering materials including concrete and ceramics. Fibers are used in concrete to enhance various concrete properties such as tensile strength, impact resistance, and shrinkage [1,2].
Natural fibers (or vegetable fibers), such as wood pulp and straw, are organic-based materials; cellulose, hemicellulose, and lignin are their main composition. Natural fibers can be divided into two groups, unprocessed and processed natural fibers [1]. The difference between processed and unprocessed natural fibers is that the processed natural fibers undergo chemical, mechanical, thermal, or a combination of these three treatment techniques to change the chemical and/or physical properties of natural fibers.
Natural fibers could provide a renewable and widely available source of fibers for concrete at low cost [3,4]. Natural fibers have been used in manufacturing non-pressure pipes and roof sheeting [1,5]. In a study, Mezencevova et al. [6] showed that adding thermomechanical pulp fibers in cementitious systems reduced heat of hydration rate and delayed set time, but decreased autogenous shrinkage of paste samples. Another study found that adding 40 mm long hemp and elephant grass fibers to concrete increases the fracture toughness of concrete [3]. It has also been shown that sisal fibers reduce plastic shrinkage and restrained shrinkage cracking of concrete; however, sisal fibers increase drying shrinkage of concrete [7]. In their study, Khorami and Ganjian [8] showed that addition of bagasse and wheat fibers (length of fibers were approximately 1.2 mm) in concrete increases flexural strength and ductility of concrete samples.
Using natural fibers in concrete presents some challenges though. Natural fibers degrade in concrete overtime [9,10]. It has been shown that pulp fibers degrade in concrete under wetting and drying conditions [10]. This has been attributed to loss of bond between fibers and the cement matrix and the embrittlement of fibers due to mineralization of hydration produces, mainly calcium hydroxide, in lumens of fibers [10,11]. However, it has been shown that using supplementary cementitious materials (SCMs), such as metakaolin and slag, in concrete mix could prevent natural fiber degradation in concrete [9].
Rice straw, which is a by-product of rice production, is another natural and sustainable resource that could be used to produce fibers for concrete. Rice straw is available worldwide in large amounts. Commonly, rice straw is used either as a livestock feed, burned at the field, or incorporated into the soil. Each of these rice straw utilization methods presents challenges [12]. Although burning rice straw on site is the cheapest method of rice straw disposal, this method raises environmental concerns as burning rice straw releases carbon dioxide. This is why some states, like California, banned the burning of rice fields and thus rice farmers face challenges in rice straw disposal. Using rice straw as a livestock feed is not a favorable option because of its poor quality. Incorporating rice straw in soil can be costly and can pose other challenges to rice farmers [12]. Using rice straw to produce natural fibers for concrete application can benefit both the rice industry as well as the concrete industry.
This research aims to investigate the impact of washed and unwashed rice straw fibers (RSFs) on concrete properties. Different percentages of RSFs were added in concrete. Two water-to-cement ratios and two different fiber sizes were used. Compressive strength, flexural strength, heat of hydration, and drying shrinkage of concrete containing RSFs were measured and compared with that of concrete with no RSF.

2. Materials and Methods
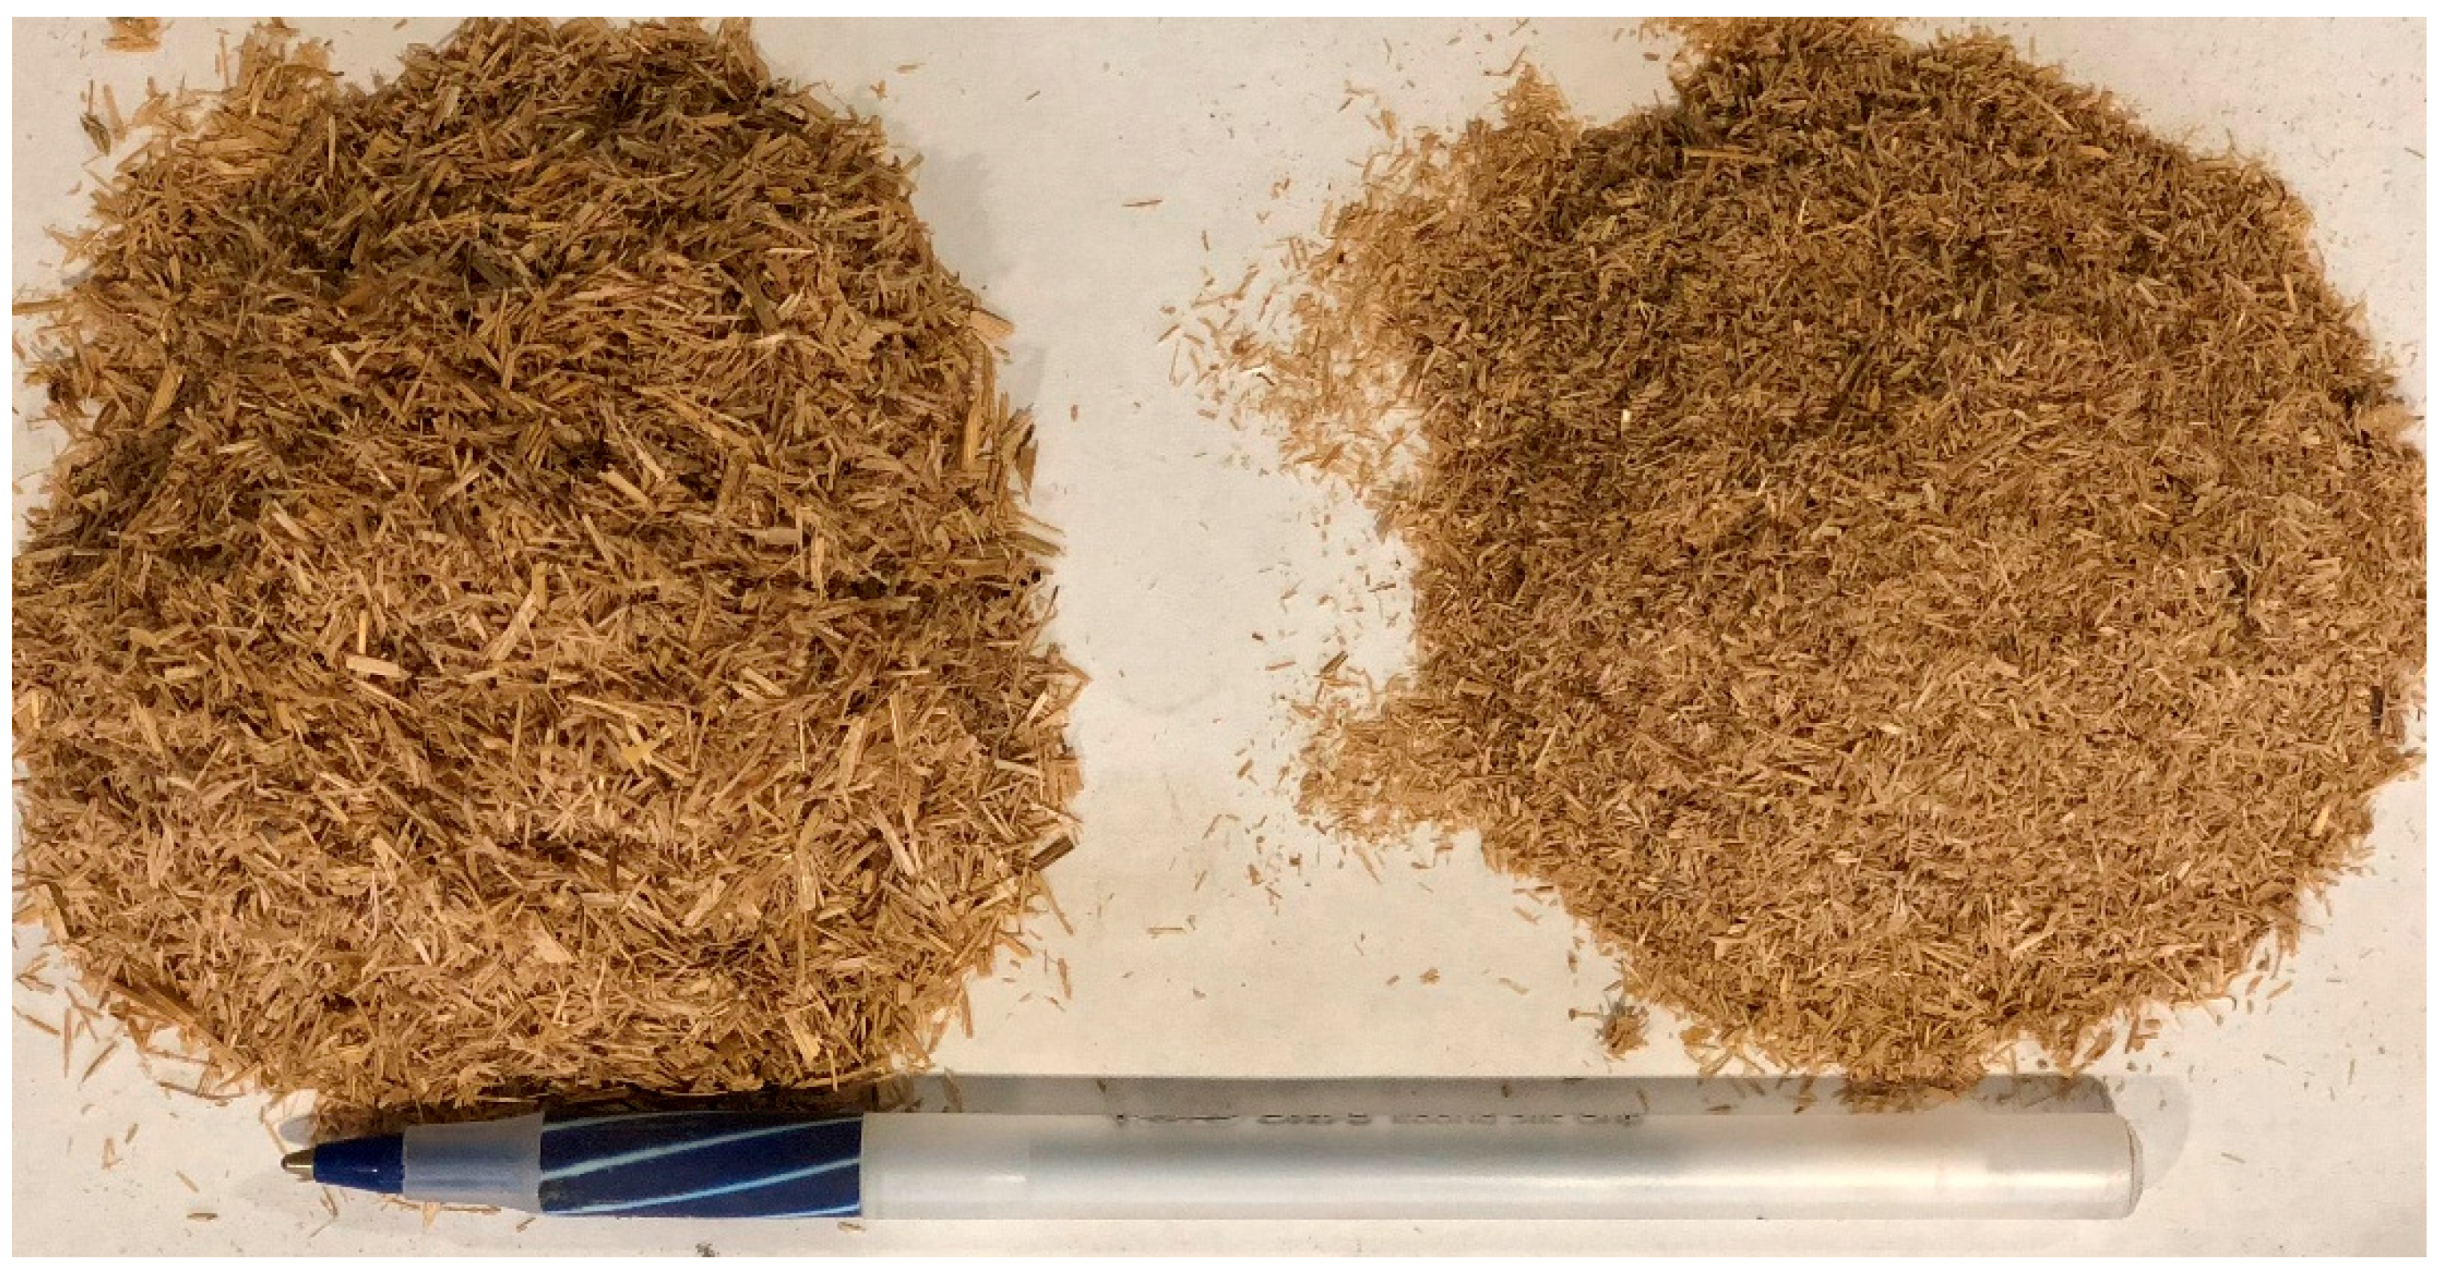
2.1. Materials

Type II/V Portland cement, conforming to ASTM C150 [13], was used in this study. Chemical and physical properties of cement are shown in Table 1. A 1 inch (25 mm) maximum size aggregate was used. Rice straw was obtained from a local farm and was ground into two different sizes of approximately 5 mm (coarse RSF) and 2 mm (fine RSF). Figure 1 shows pictures of coarse and fine RSF. Coarse RSF and fine RSF will be referred to as RSF-C and RSF-F, respectively. Two different water-to-cement ratios (w/c) of 0.54 and 0.42 were used. Saturated surface dry (SSD) course aggregate and oven-dried sand were used for all concrete mixtures; this was done to better control the water content of the mixtures. Sand water absorption was taken into consideration when calculating water content for concrete mixtures. The aggregate and sand contents for concrete mixtures with a w/c of 0.54 were 994 kg/m3 and 831 kg/m3, respectively. Concrete mixtures with a w/c of 0.42 contained 1058 kg/m3 of aggregate and 817 kg/m3 of sand. Table 2 shows proportions of concrete mixtures.

2.2. Methods

2.2.1. Concrete Mixing Procedure

Dry RSF was saturated with water 30 min before adding to the concrete mix. The amount of water added to RSFs was 5-times the weight of RSFs. This amount of water was enough to make RSF saturated to make sure fibers did not absorb water during mixing. RSF was then mixed with sand, aggregate and about one-third of the mix water for a minute to ensure even distribution of fibers within the mix. Cement and the remaining mix water were then added to finish the mixing process.

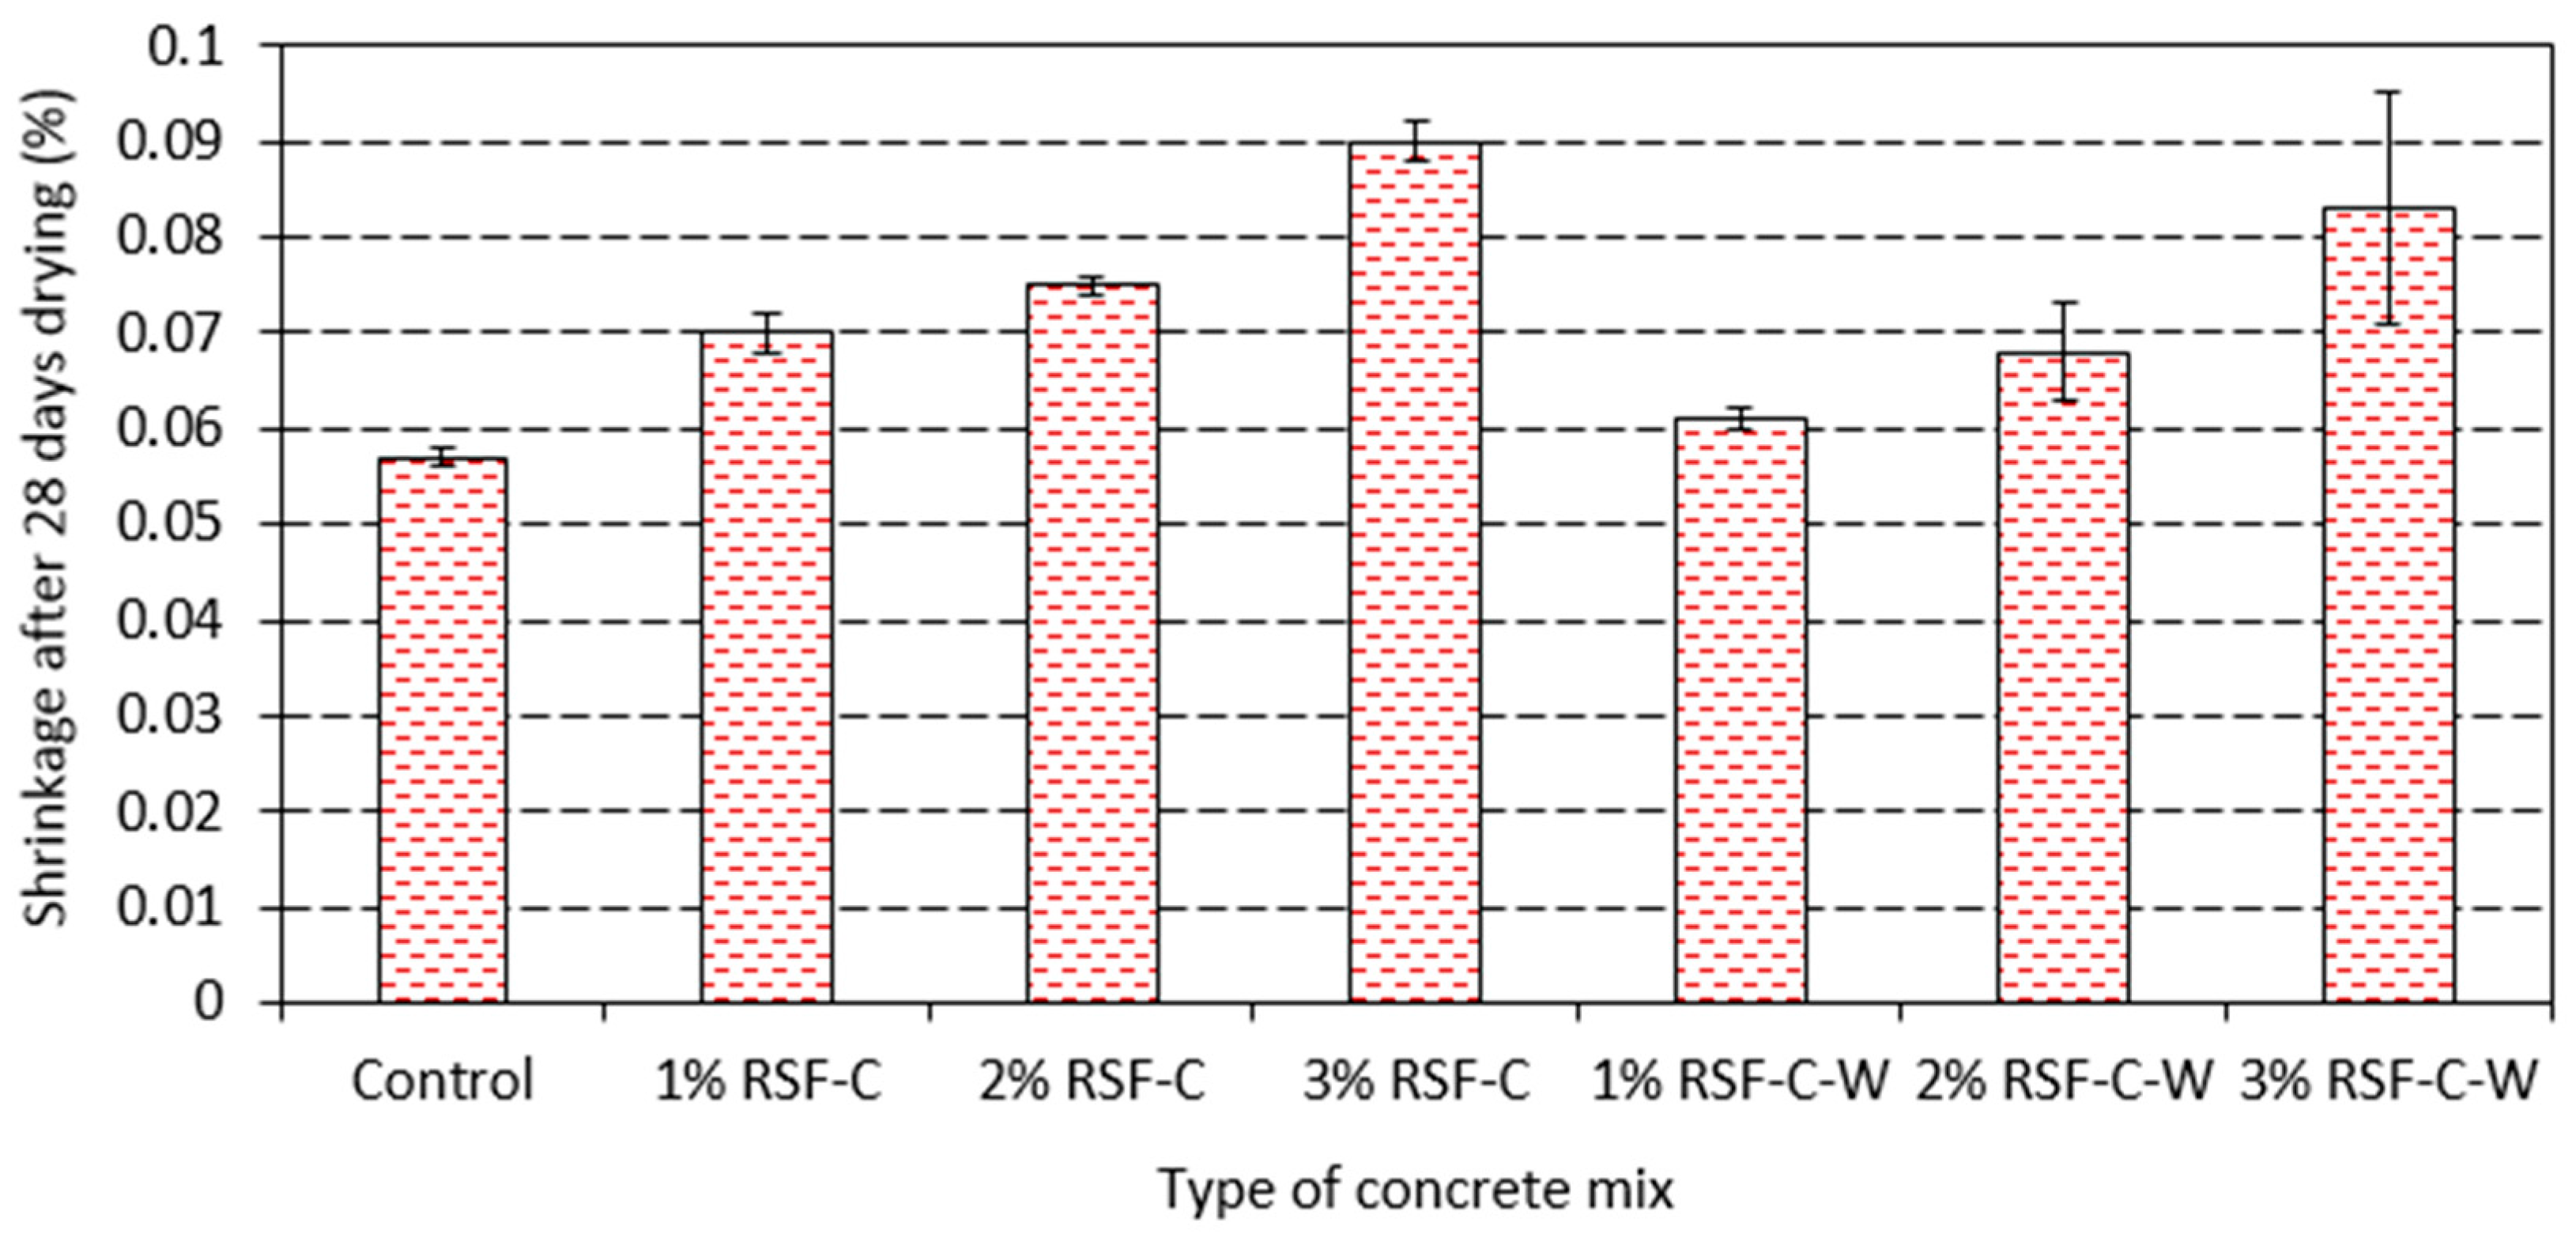
2.2.2. RSF Washing Procedure

As received (unwashed) RSF and washed RSF were used in this study. To wash RSF, 200 g of ground RSF was immersed in 3500 mL of water in a four-liter glass jar at 23 °C for 24 h. Then, RSF was rinsed twice and dried in an oven at 100 °C. Samples of leachate were collected and analyzed to determine the amount of sodium, potassium, total organic carbon, and phosphorous. Sodium and potassium were analyzed using Inductively Coupled Plasma Atomic Emission Spectroscopy (ICP-AES); phosphorous content was obtained using a spectrophotometer. A Total Organic Carbon (TOC) analyzer was used to determine TOC content of the leachates. Washed samples were designated with a letter “W” at the end of the sample name; for example RSF-C-W means coarse rice straw fiber which was washed before adding to concrete; RSF-F-W indicates fine rice straw fiber which was washed before adding to concrete. As received (unwashed) samples have no “W” letter in their name.

2.2.3. Experimental Procedures

Compressive strength tests were performed on 100 mm × 200 mm (4 × 8 inch) cylinders according to ASTM C39 [14]. Flexural tests were conducted in accordance with ASTM C78 [15]. Drying shrinkage tests were performed following ASTM C157/157M, except that concrete prisms samples were wet-cured for one week and then moved to a drying chamber (50% RH) for four more weeks [16].
Heat of hydration measurements were performed using a four-channel isothermal calorimeter at 23 °C to determine the impact of RSF addition on cement induction period. Approximately 50 g of cement paste samples with and without RSF were used to measure heat of hydration. A 0.45 water-cementitious material ratio (w/cm) was used. Paste samples were mixed with a vertical laboratory mixer [17]. Distilled water was added to the cementitious material and mixed at 500 rpm for 120 s, followed by a 60 s rest period, and then mixed for 60 s. To obtain the induction period, the slope of the acceleration peak of heat of hydration was extended to the x-axis (time axis). The intersection point between the extended slope and x-axis was considered as the induction period [18].

3. Results and Discussion

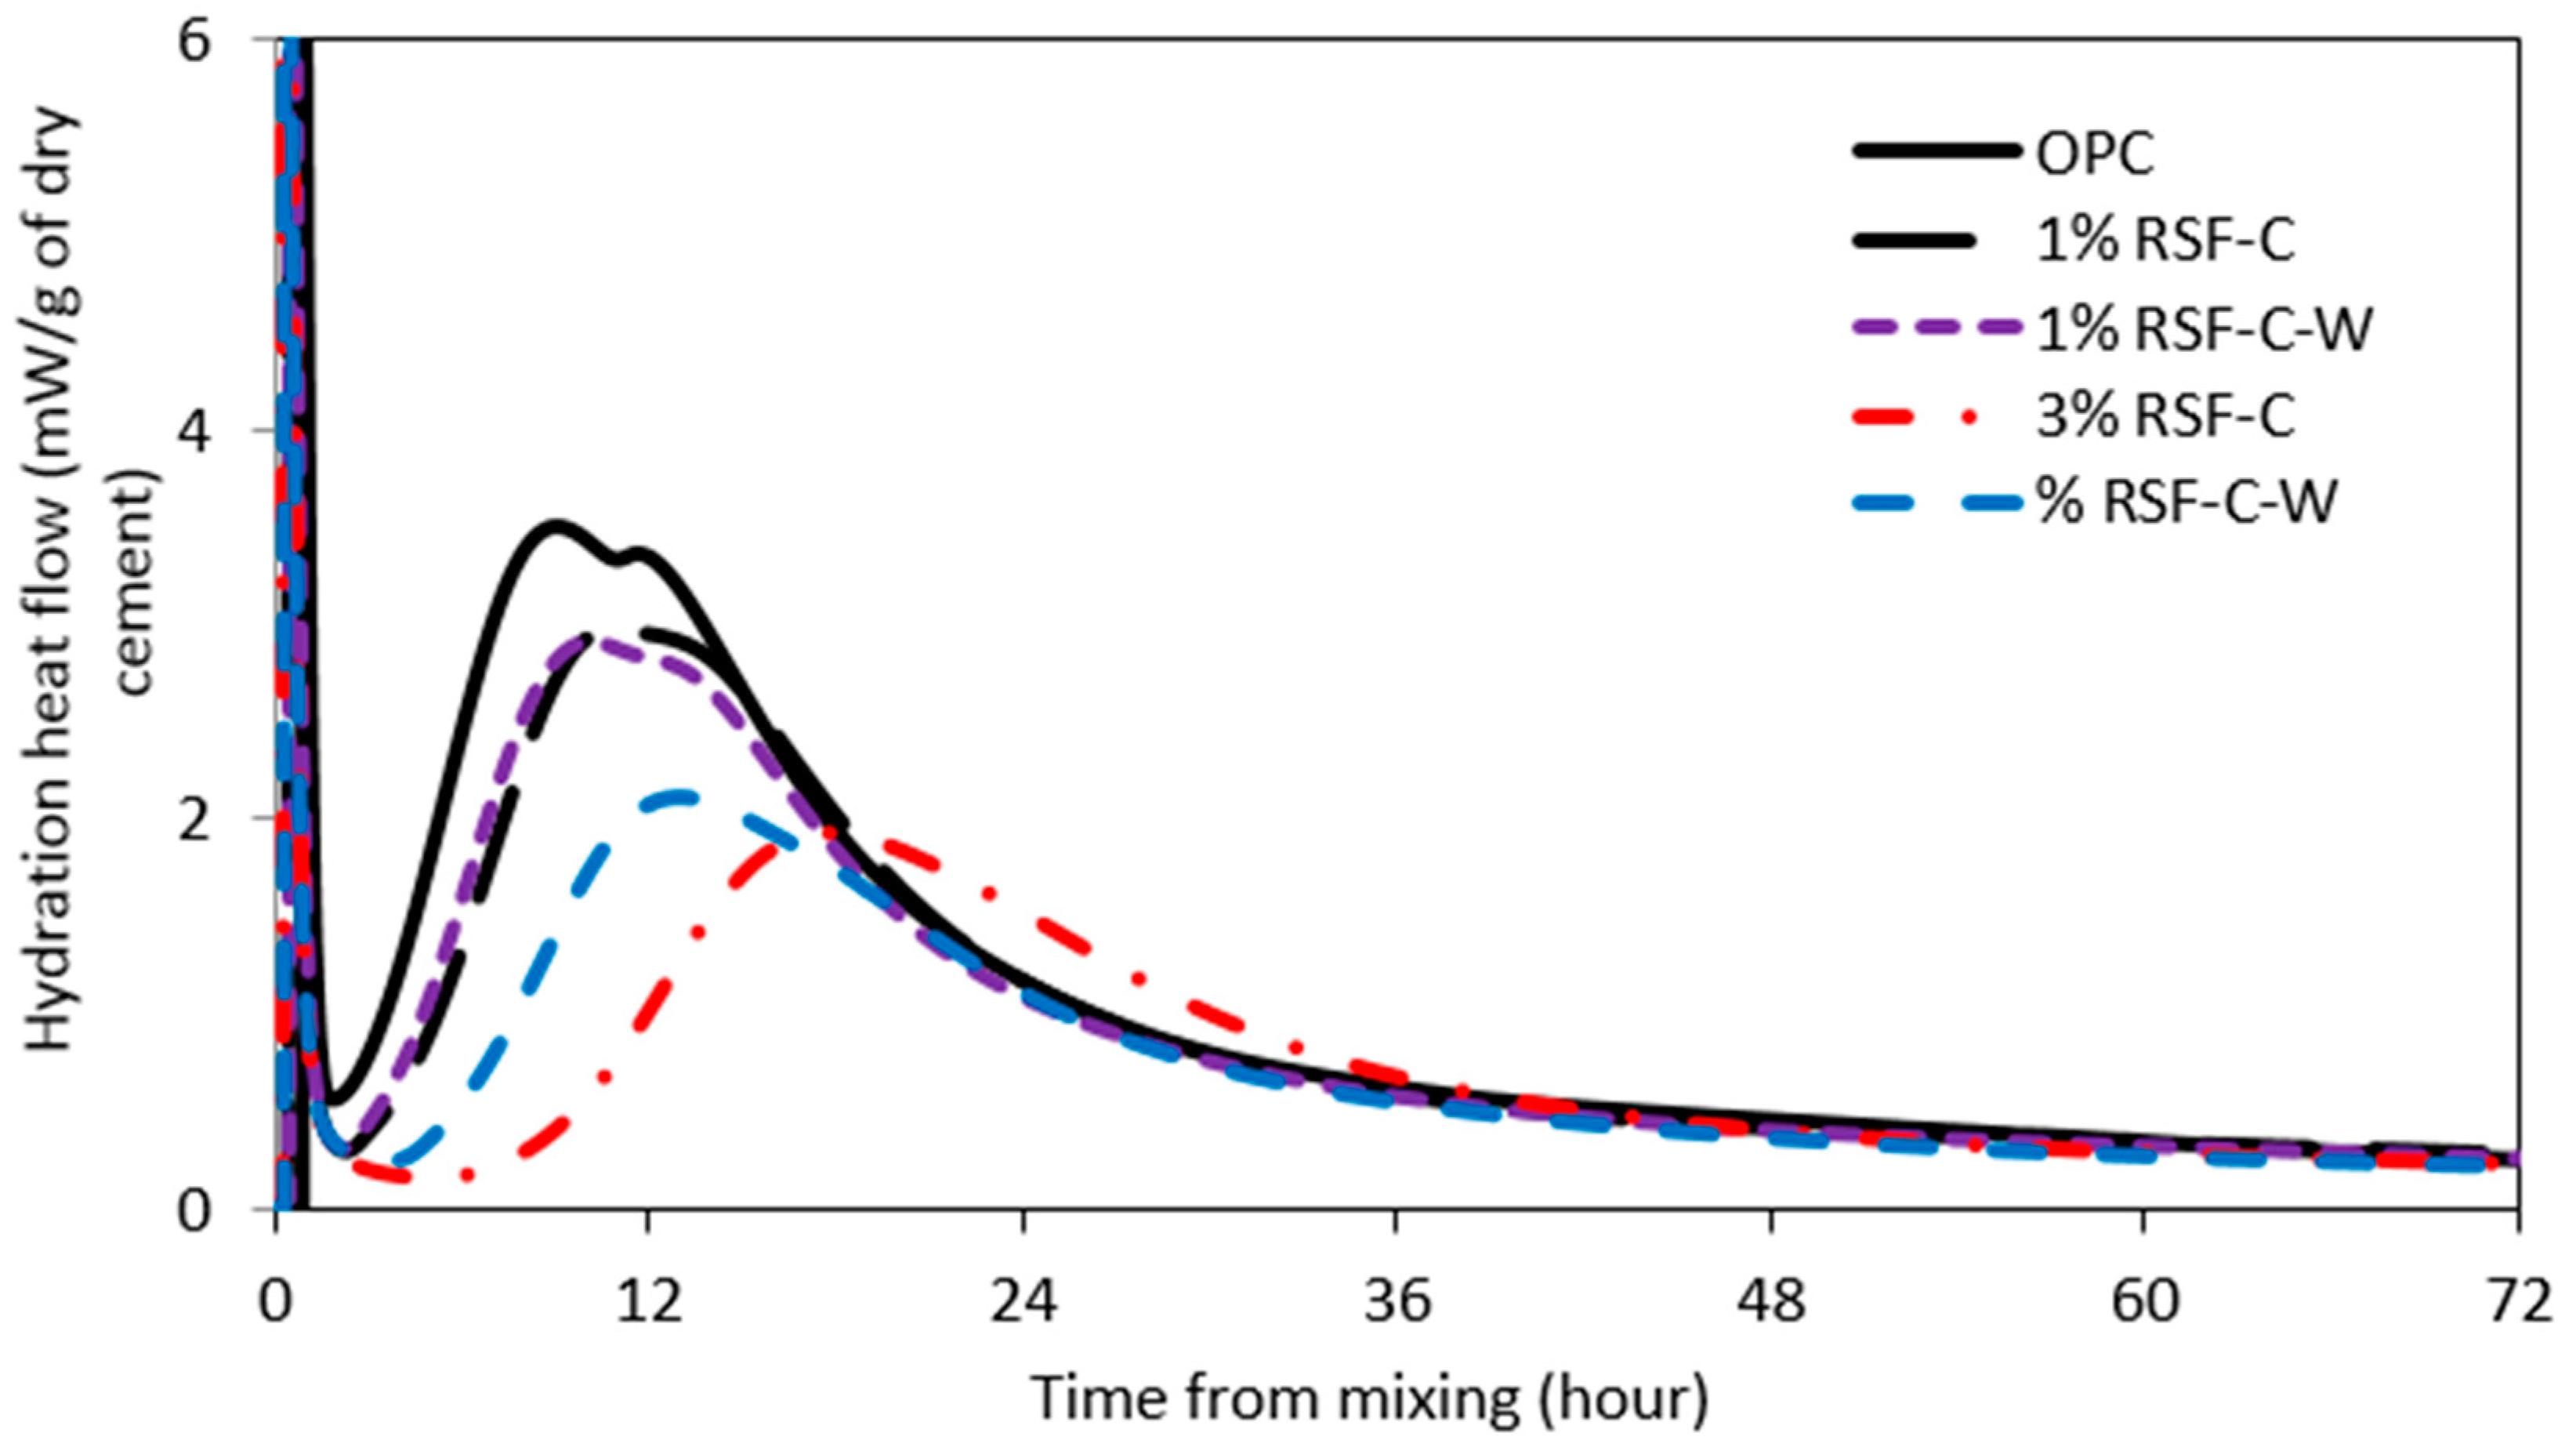
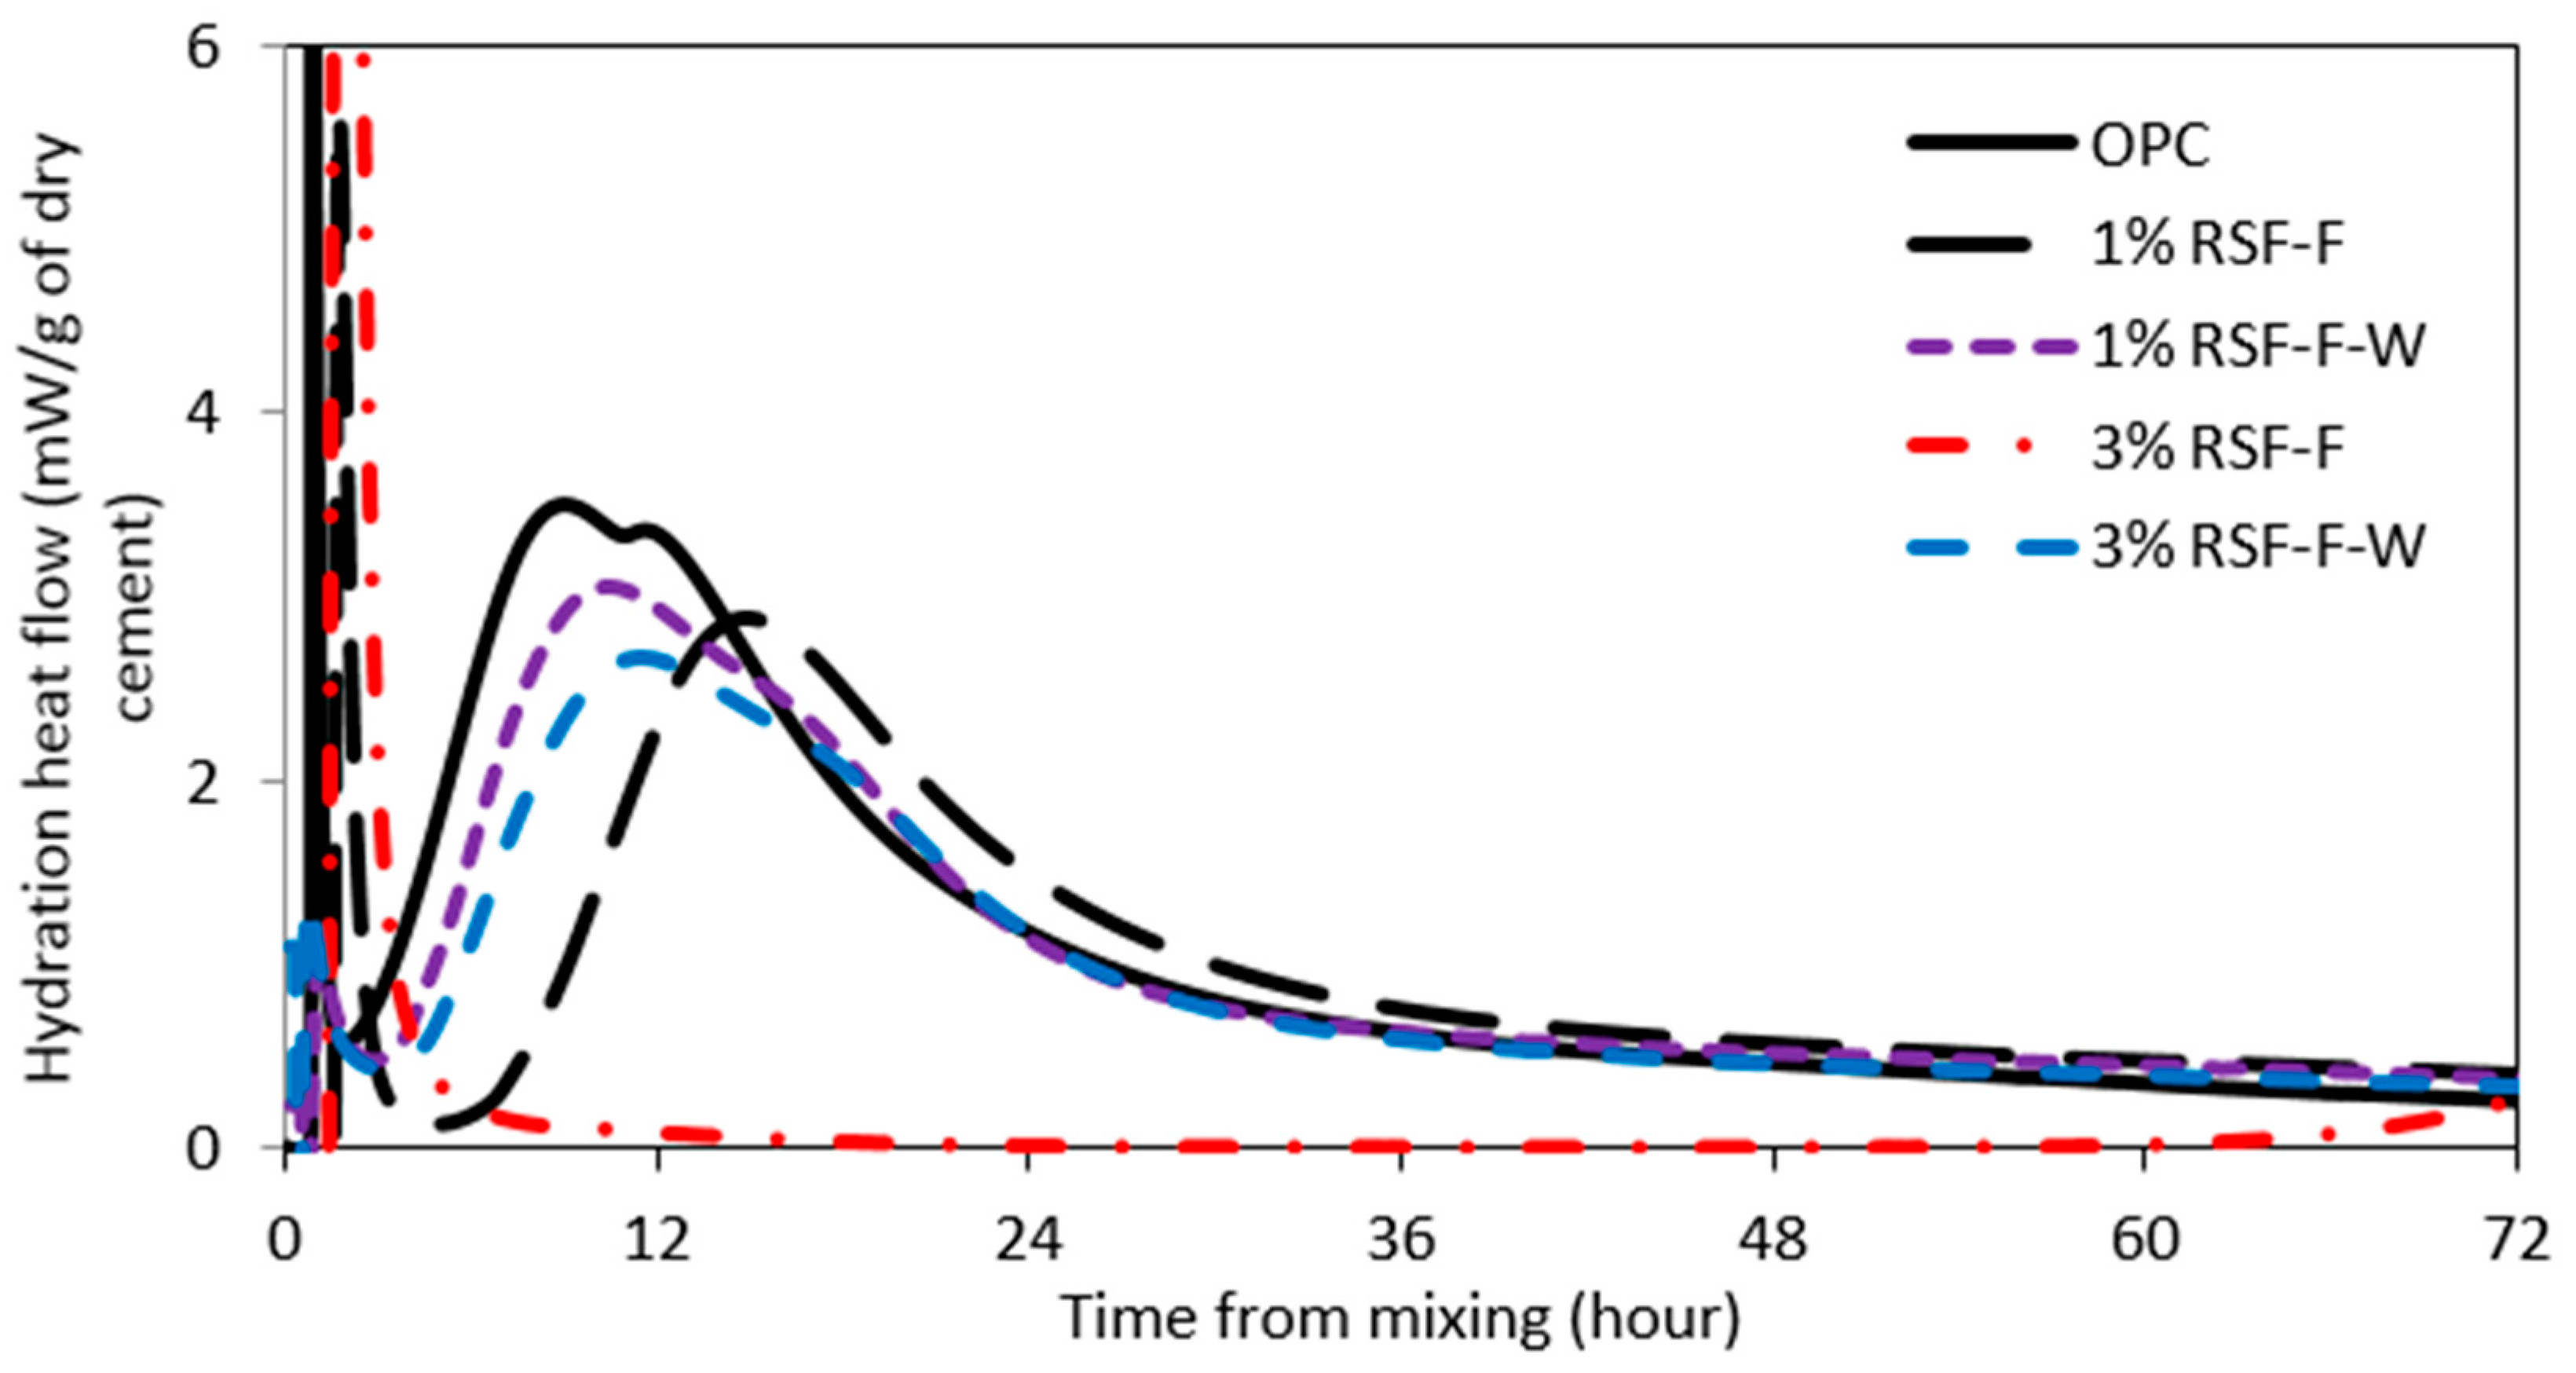
3.1. Impact of RSF Addition on Concrete Heat of Hydration

Isothermal heat of hydration of cementitious systems are commonly used to study various properties of these systems. In particular, heat of hydration graphs are used to obtain the induction (dormant) period of cementitious systems. Induction period of cementitious systems is a time frame during which hydration of cement slows down. During the induction period concrete is in plastic (workable) state, and this enables concrete to be transported, placed, and finished. Although the induction period can vary depending on the application, it typically lasts up to 4 h.
Isothermal heat of hydration of samples containing RSF-C and RSF-F are shown in Figure 2 and Figure 3, respectively. Addition of RSF prolonged the induction period. The higher the amount of RSF in the system, the longer the induction period would be. As can be seen in Figure 2, paste samples containing 1% of RSF-C showed a small increase in induction period. However, the induction period for samples with 3% RSF-F was around 70 h. It was also found that RSF-F had a more noticeable effect on retardation compared to RSF-C. For example, comparing the induction period of paste samples containing 3% RSF-C (Figure 2) with those of 3% RSF-F (Figure 3), one can see that samples with RSF-F have a much longer induction period (almost 60 h longer). Samples containing 1% RSF-C had negligible impact on retardation time; nevertheless, adding 1% of RSF-F to paste samples increased the induction period by about 5 h compared to the control sample (OPC). This could be because RSF-F is finer than RSF-C; a higher amount of inorganic impurities (such as Na and K) and organic contents (such as hemicellulose) could be leached out of RSF-F into the pore solution which could lead to longer dormant period. It is well known that the induction period increases as the organic compounds increase in pore solution [18].
Washing RSF before adding to paste samples, however, reduced the induction period of samples containing RSF (see Figure 2 and Figure 3). This was more pronounced in samples with fine RSF (RSF-F). For instance, the induction period for paste samples with 3% RSF-F-W was about 3 h, whereas samples with 3% RSF-F had an induction period of about 70 h. The induction period for samples containing 3% RSF-F-W was even less than that of samples containing 1% RSF-F (Figure 3). The decrease in induction period due to washing could be attributed to removal of some of the inorganic and organic compounds from RSF by washing method. Table 3 shows the amount of sodium (Na), potassium (K), phosphorous (P), and total organic carbon (TOC) that were leached out of RSF-C and RSF-F by washing. As can be seen, more organic and inorganic compounds were leached from RSF-F compared to RSF-C; this is because the RSF-F is finer compared to RSF-C. Removal of higher amount of TOC from RSF-F by washing could be the reason washing impact on retardation time of samples containing RSF-F was more noticeable compared to those samples containing RSF-C.

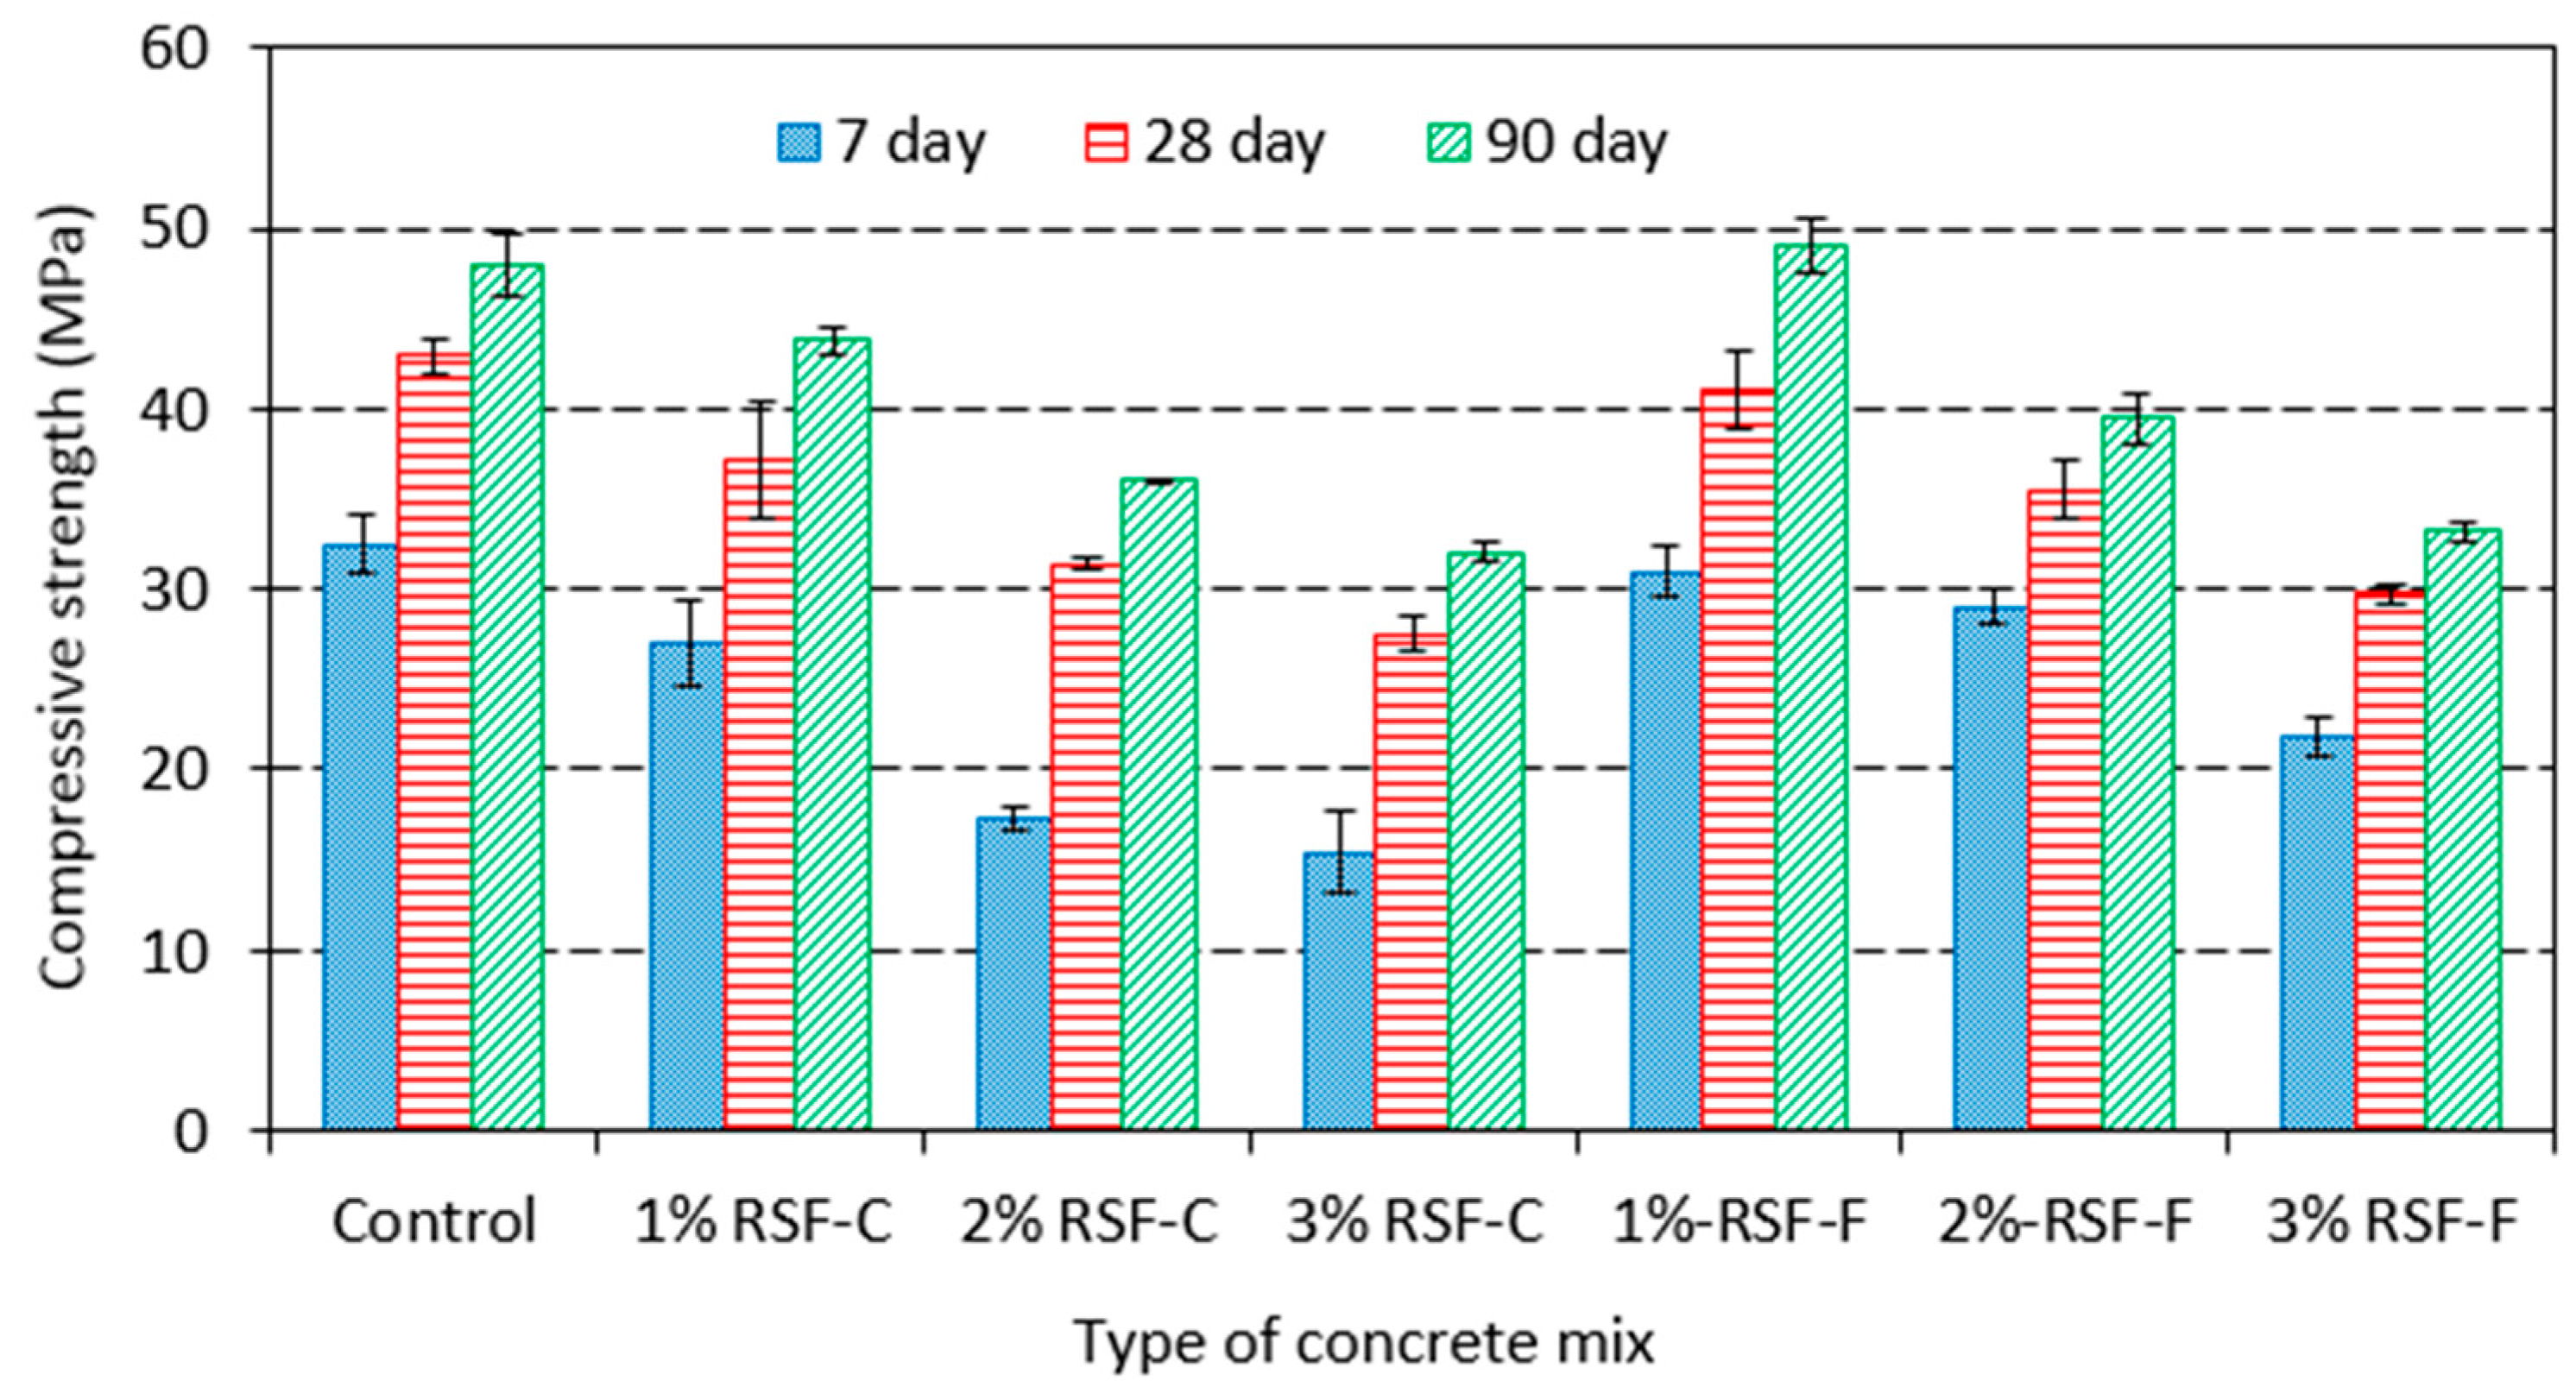
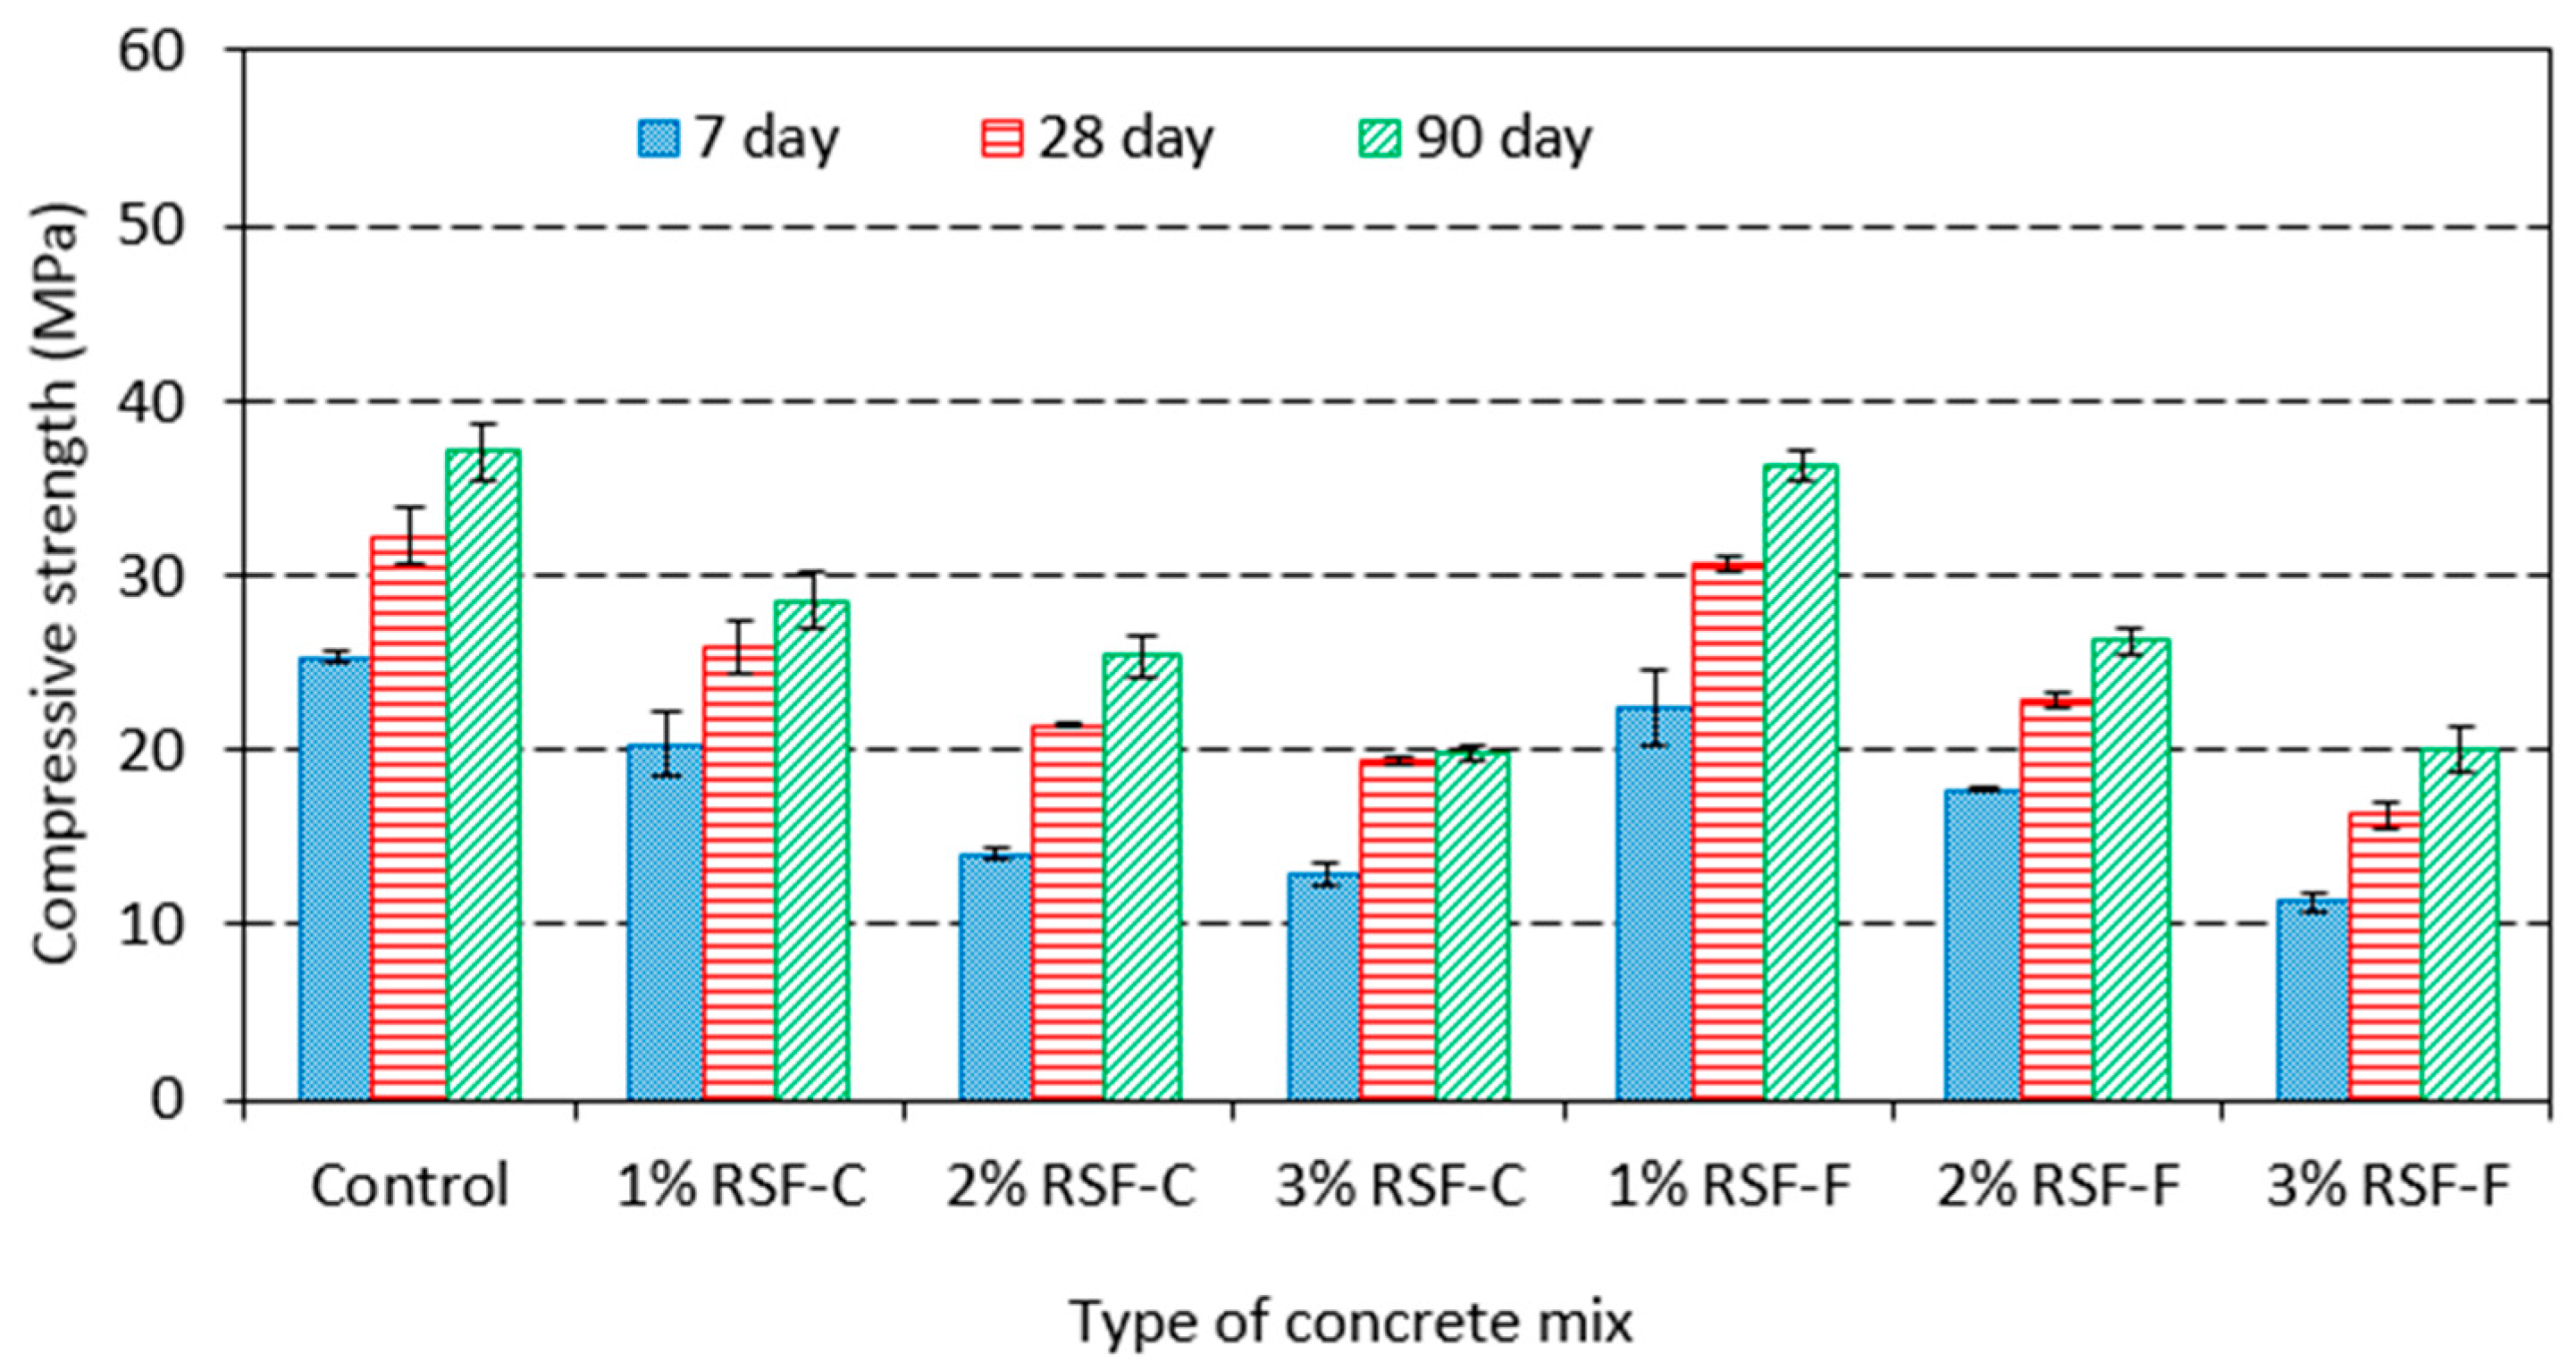
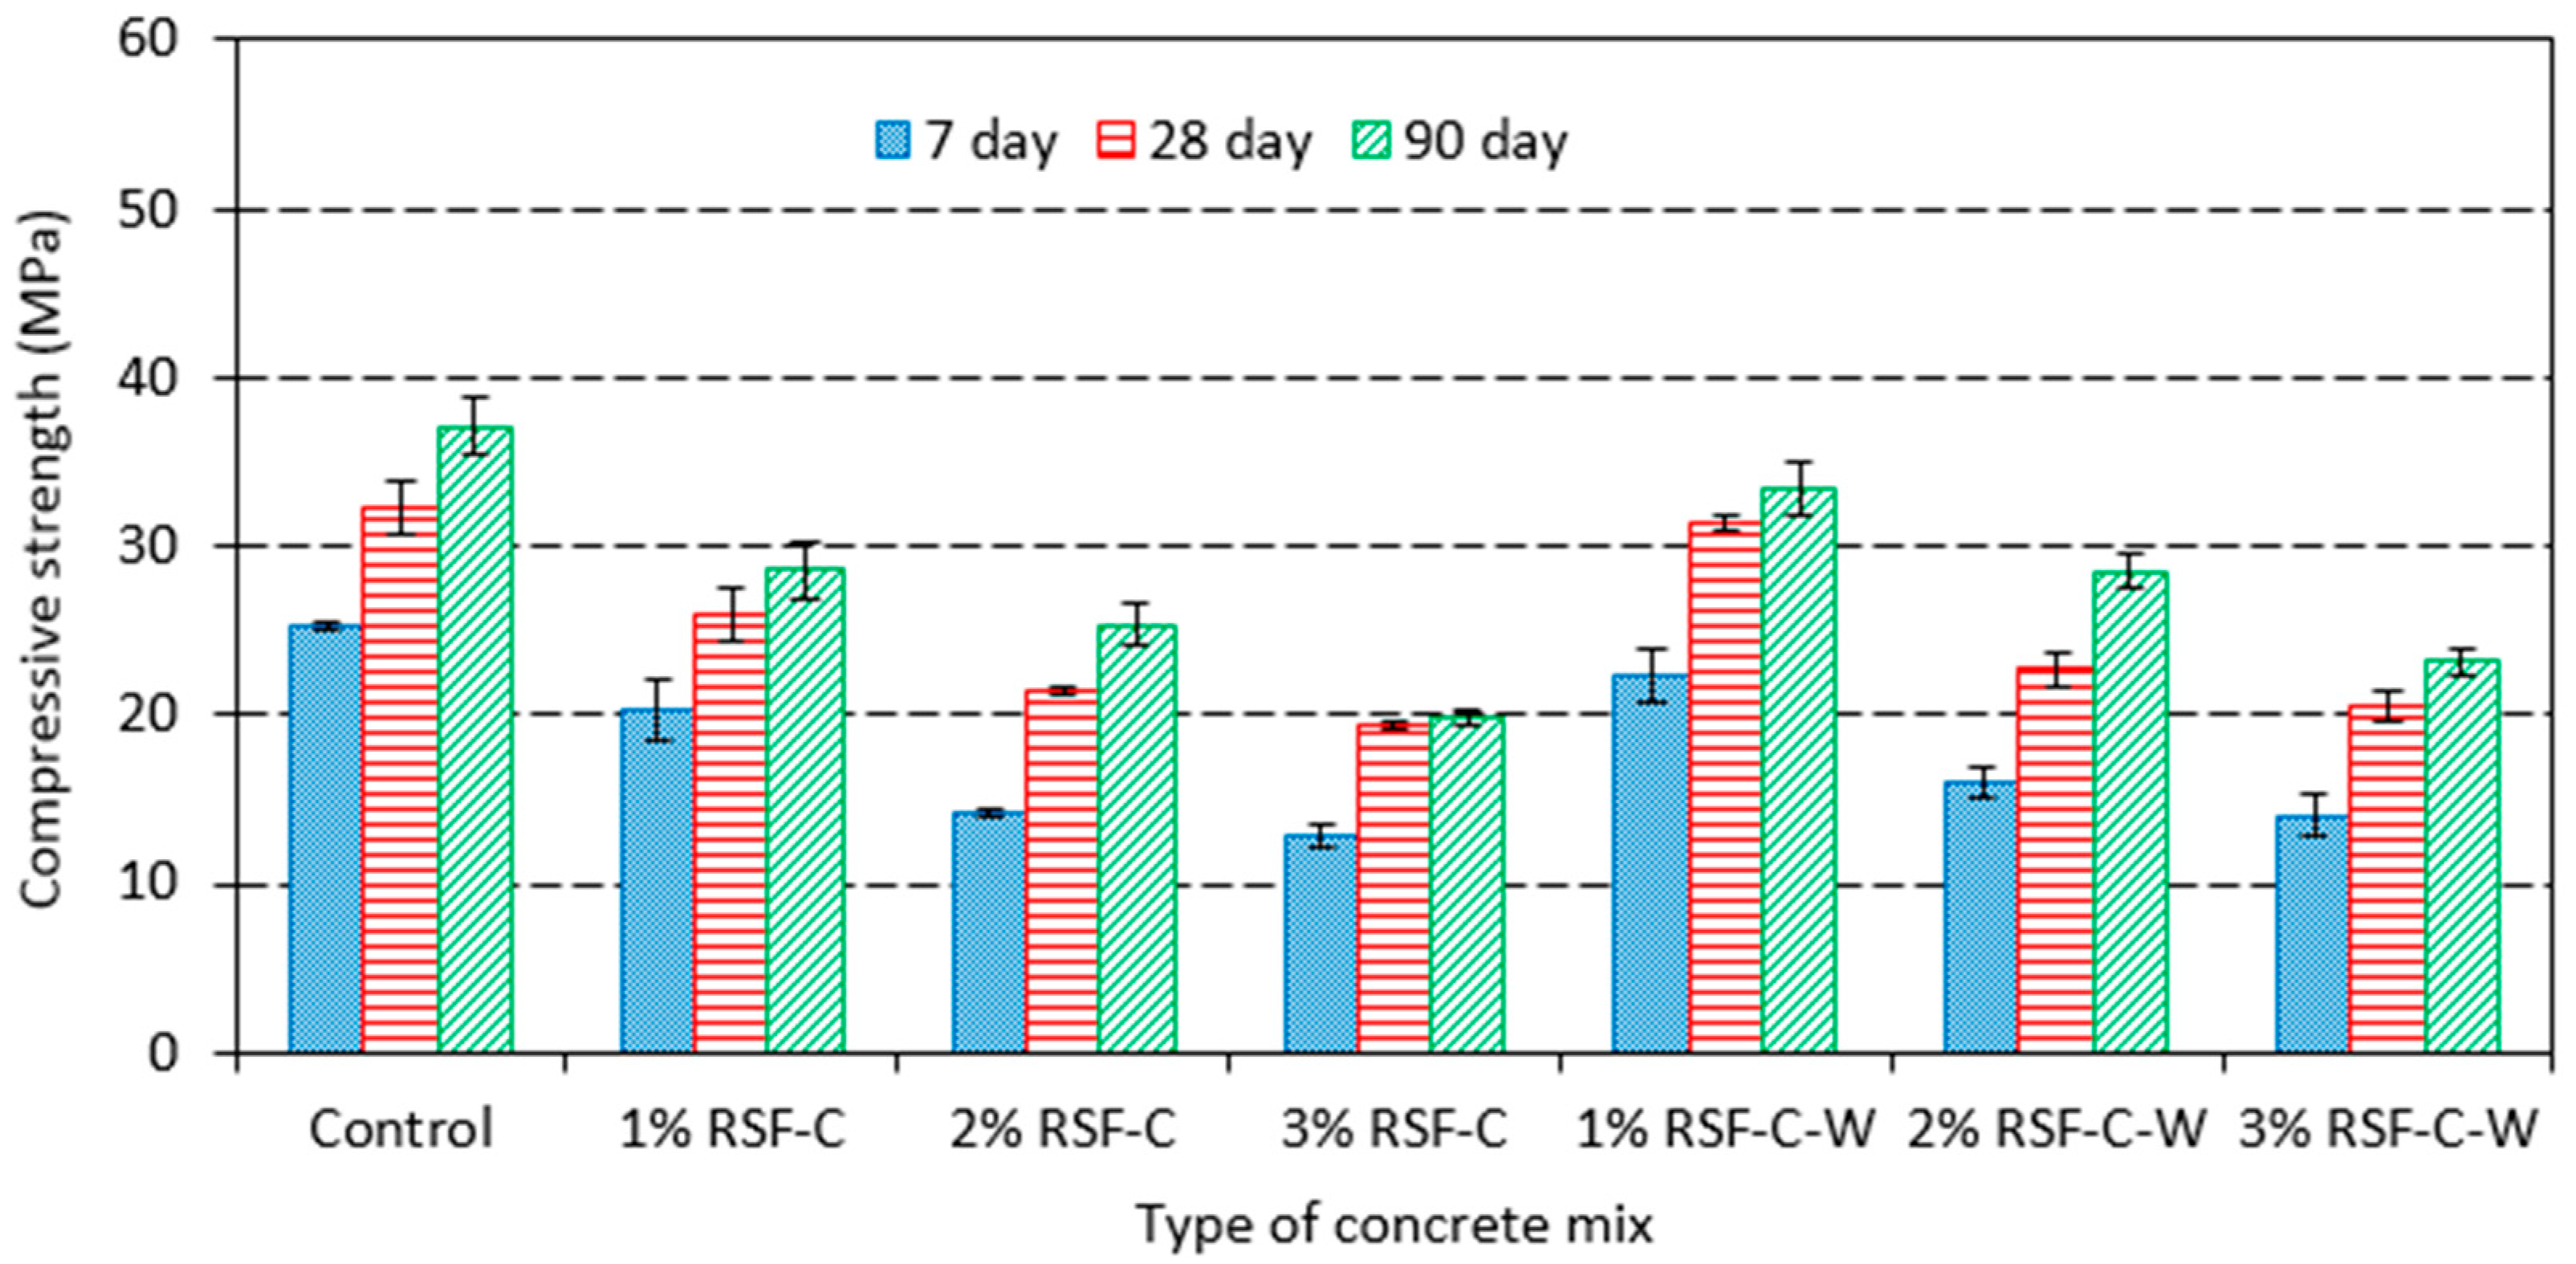
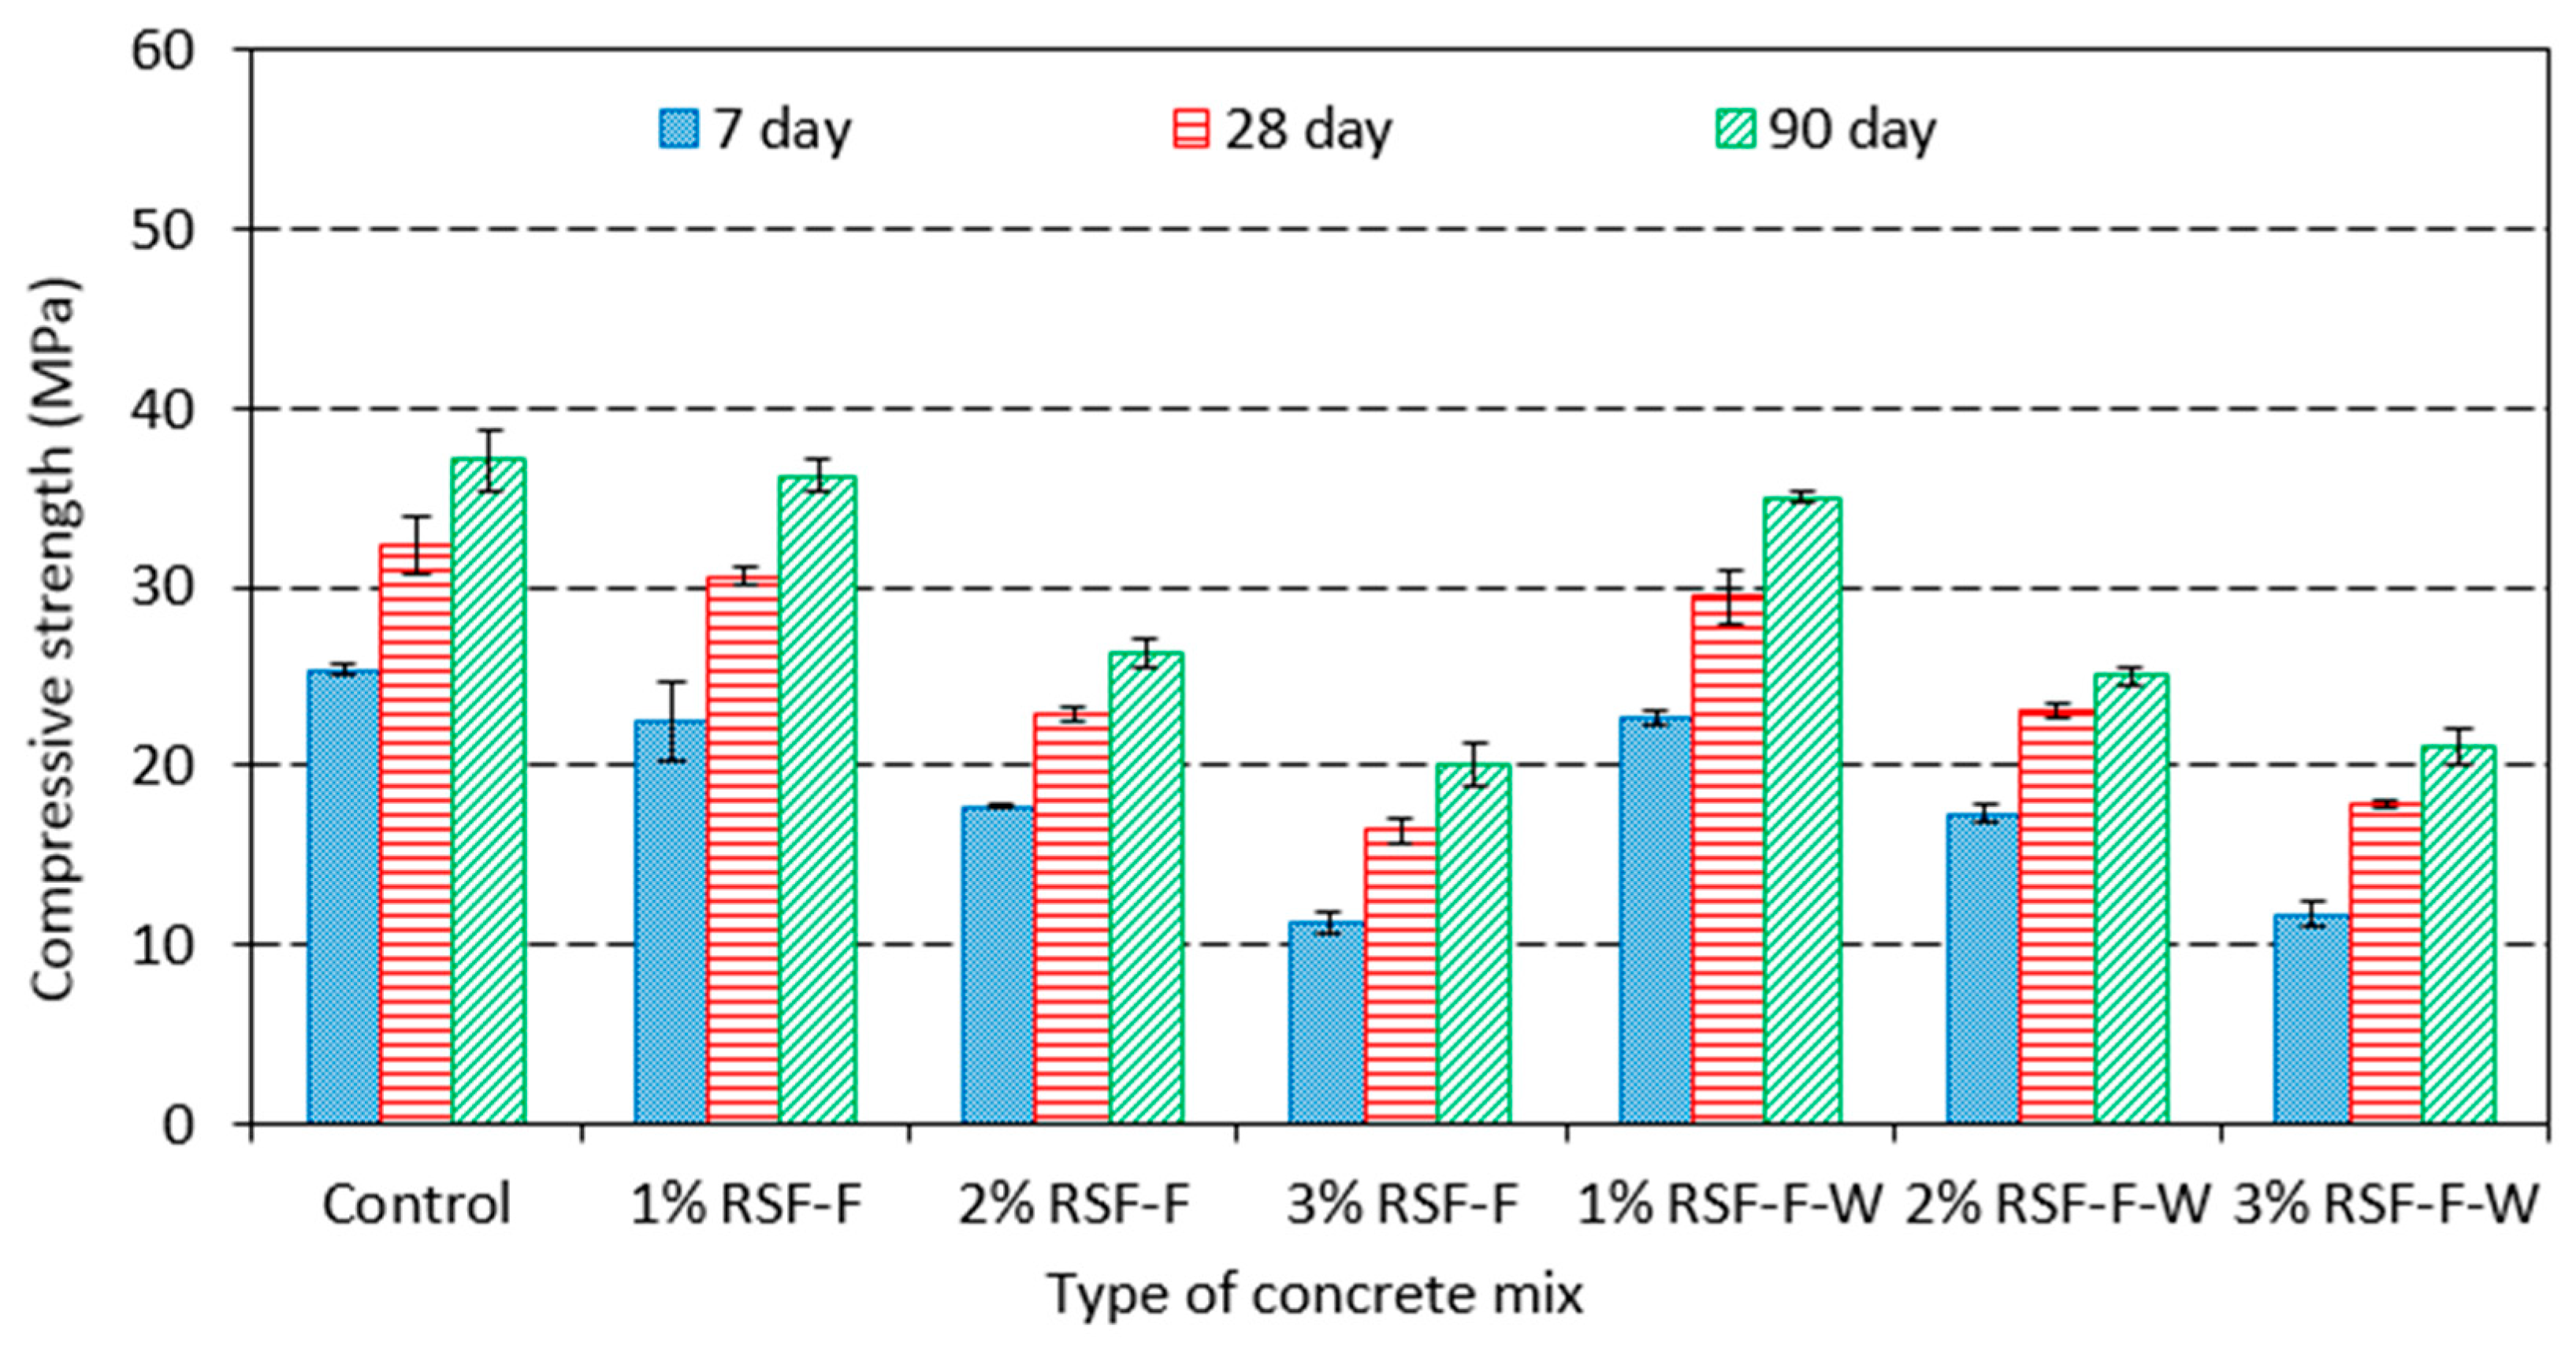
3.2. Impact of RSF Addition on Concrete Strength

Figure 4 presents the compressive strength data for concrete samples containing course rice straw fiber (RSF-C) and fine rice straw fiber (RSF-F) with w/c of 0.42. Figure 5 shows the compressive strength data for concrete samples containing RSF-C and RSF-F with w/c of 0.54. As can be seen from Figure 4 and Figure 5, samples containing RSF-C showed a lower compressive strength compared to control samples (samples without any RSF). This is true regardless of w/c and sample age. The higher the amount of RSF in concrete, the lower the compressive strength. Samples containing 1% RSF-F had similar compressive strength to those without RSF (Figure 4 and Figure 5). However, addition of 2% or 3% RSF-F reduced the concrete strength compared to control samples. Comparing RSF-C with RSF-F one can see that, for a given percentage of RSF addition, samples containing RSF-F have higher compressive strength than those containing RSF-C.
The impact of washing on compressive strength is presented in Figure 6 and Figure 7. As can be seen, for a given age and dosage of RSF, samples containing RSF-C-W had slightly higher compressive strength compared to those containing RSF-C. Considering compressive strength at 7 days, samples with RSF-C-W were 10% stronger than those containing RSF-C. This could be because of removal of some of inorganic impurities and organic compounds from the rice straw during washing procedure. However, samples containing RSF-F-W (washed RSF-F) has similar compressive strength to those containing RSF-F (refer to Figure 7).

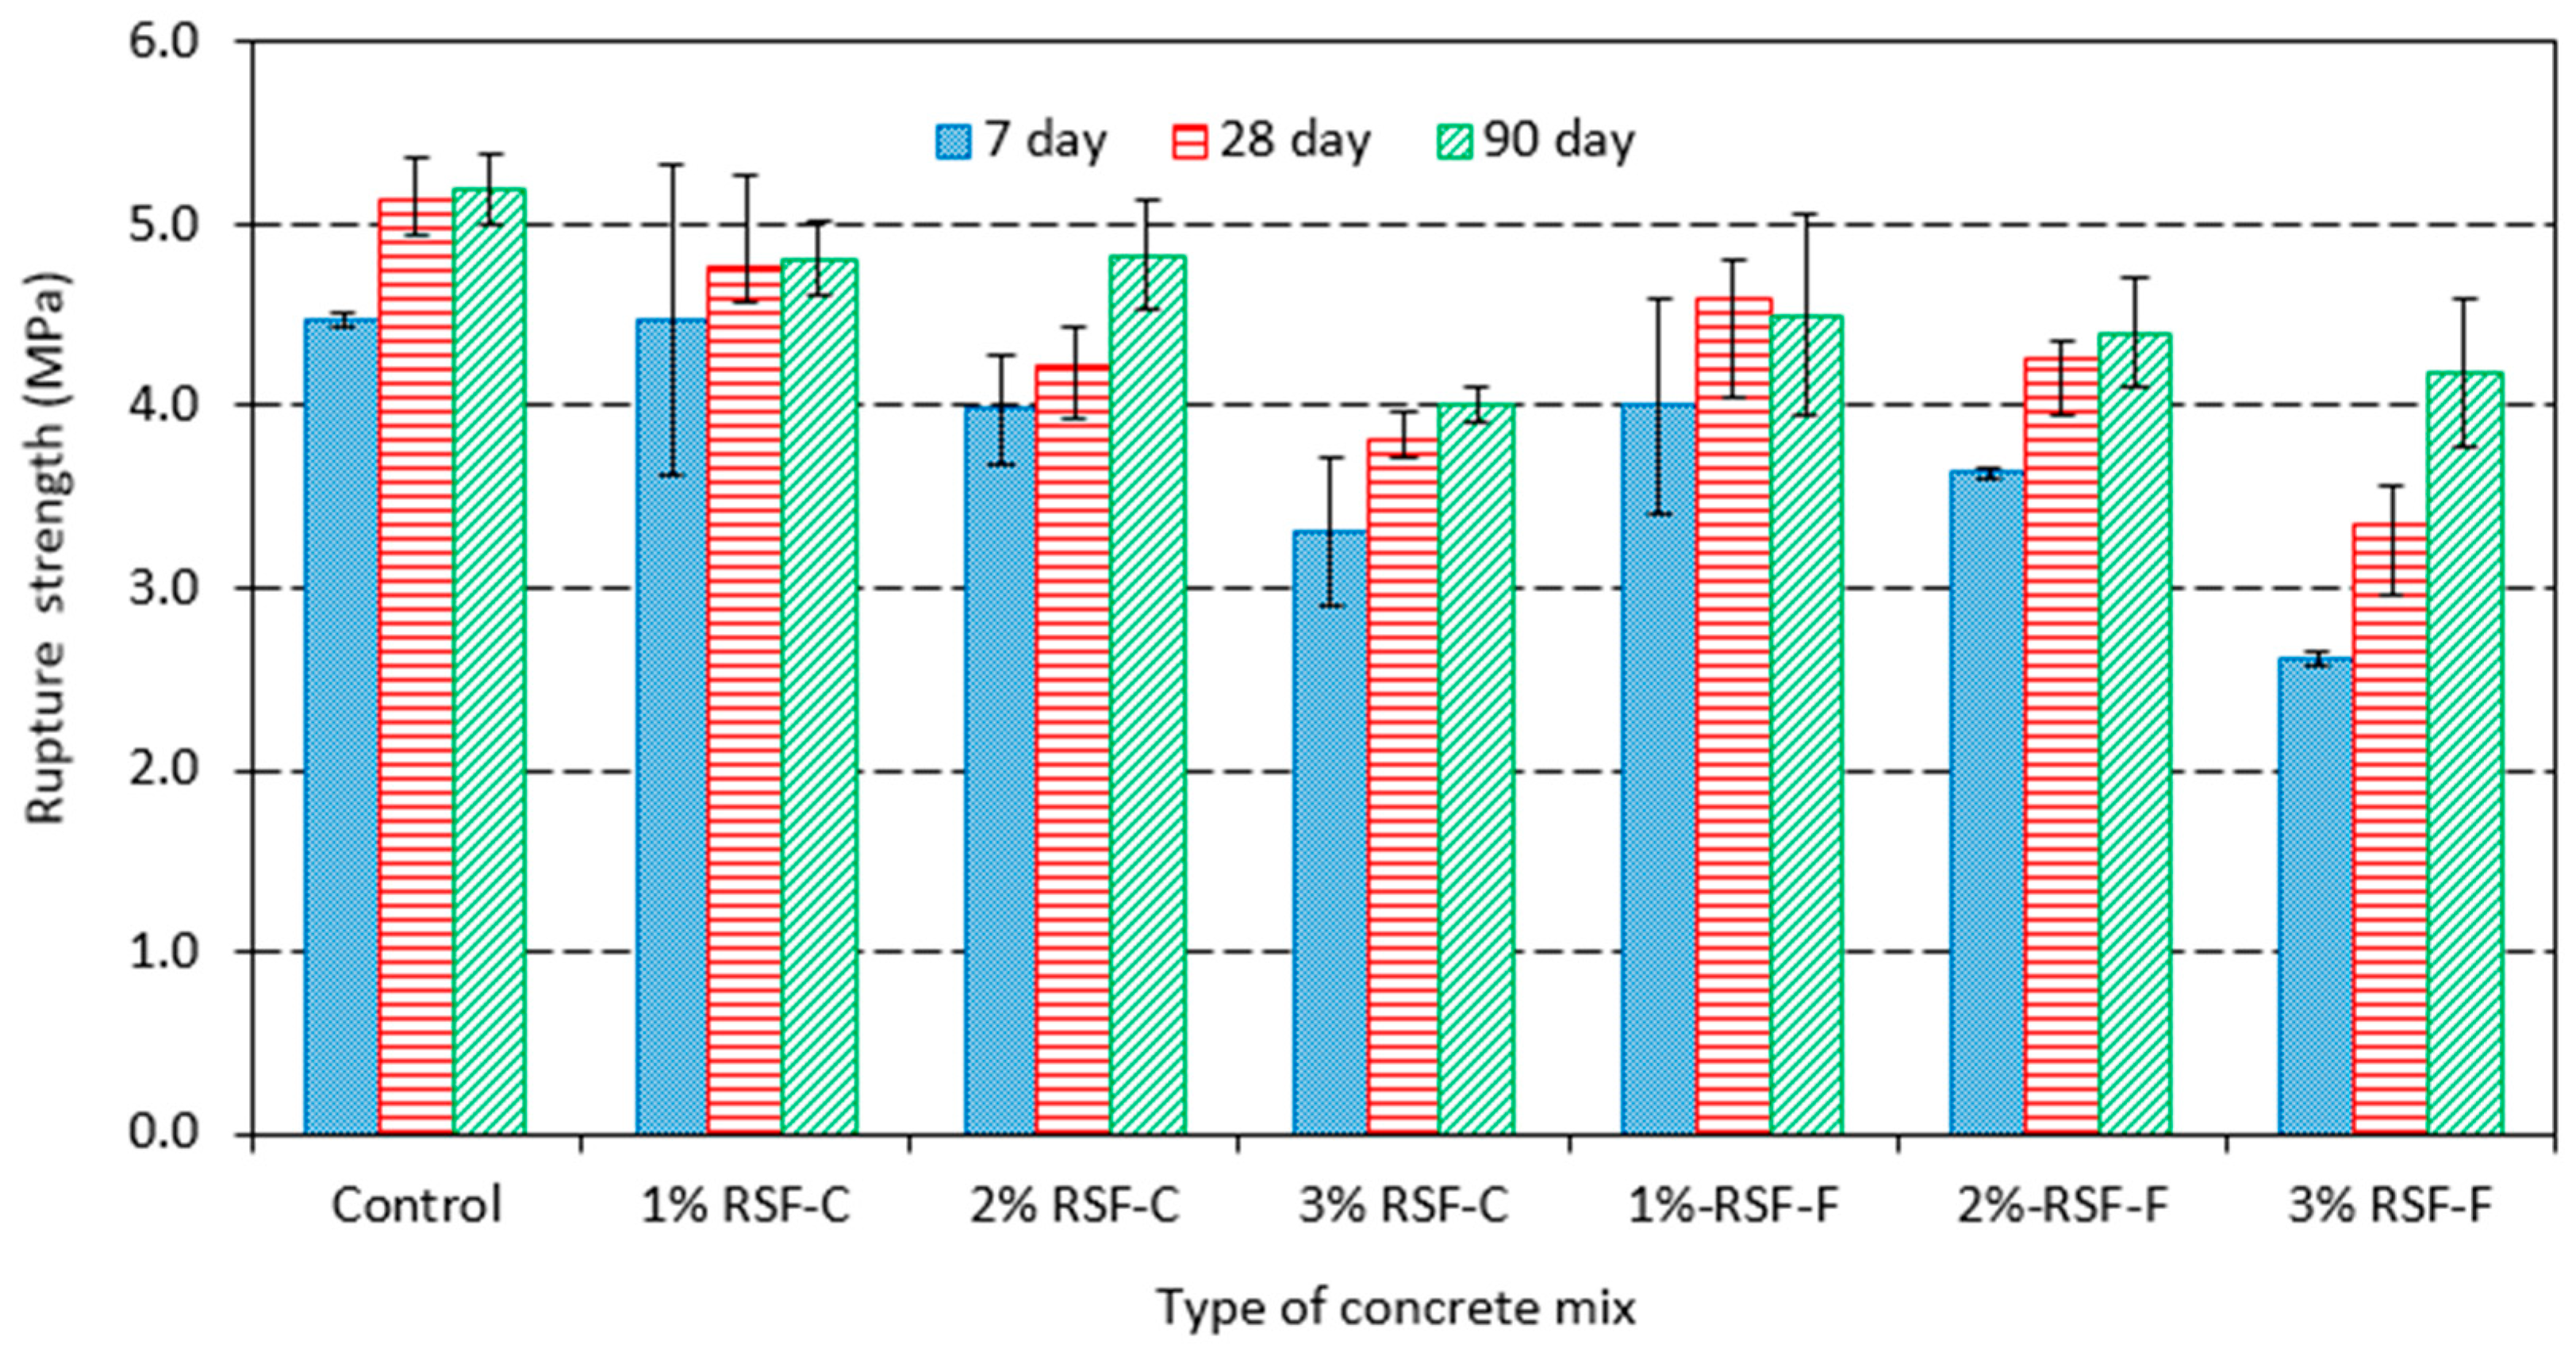
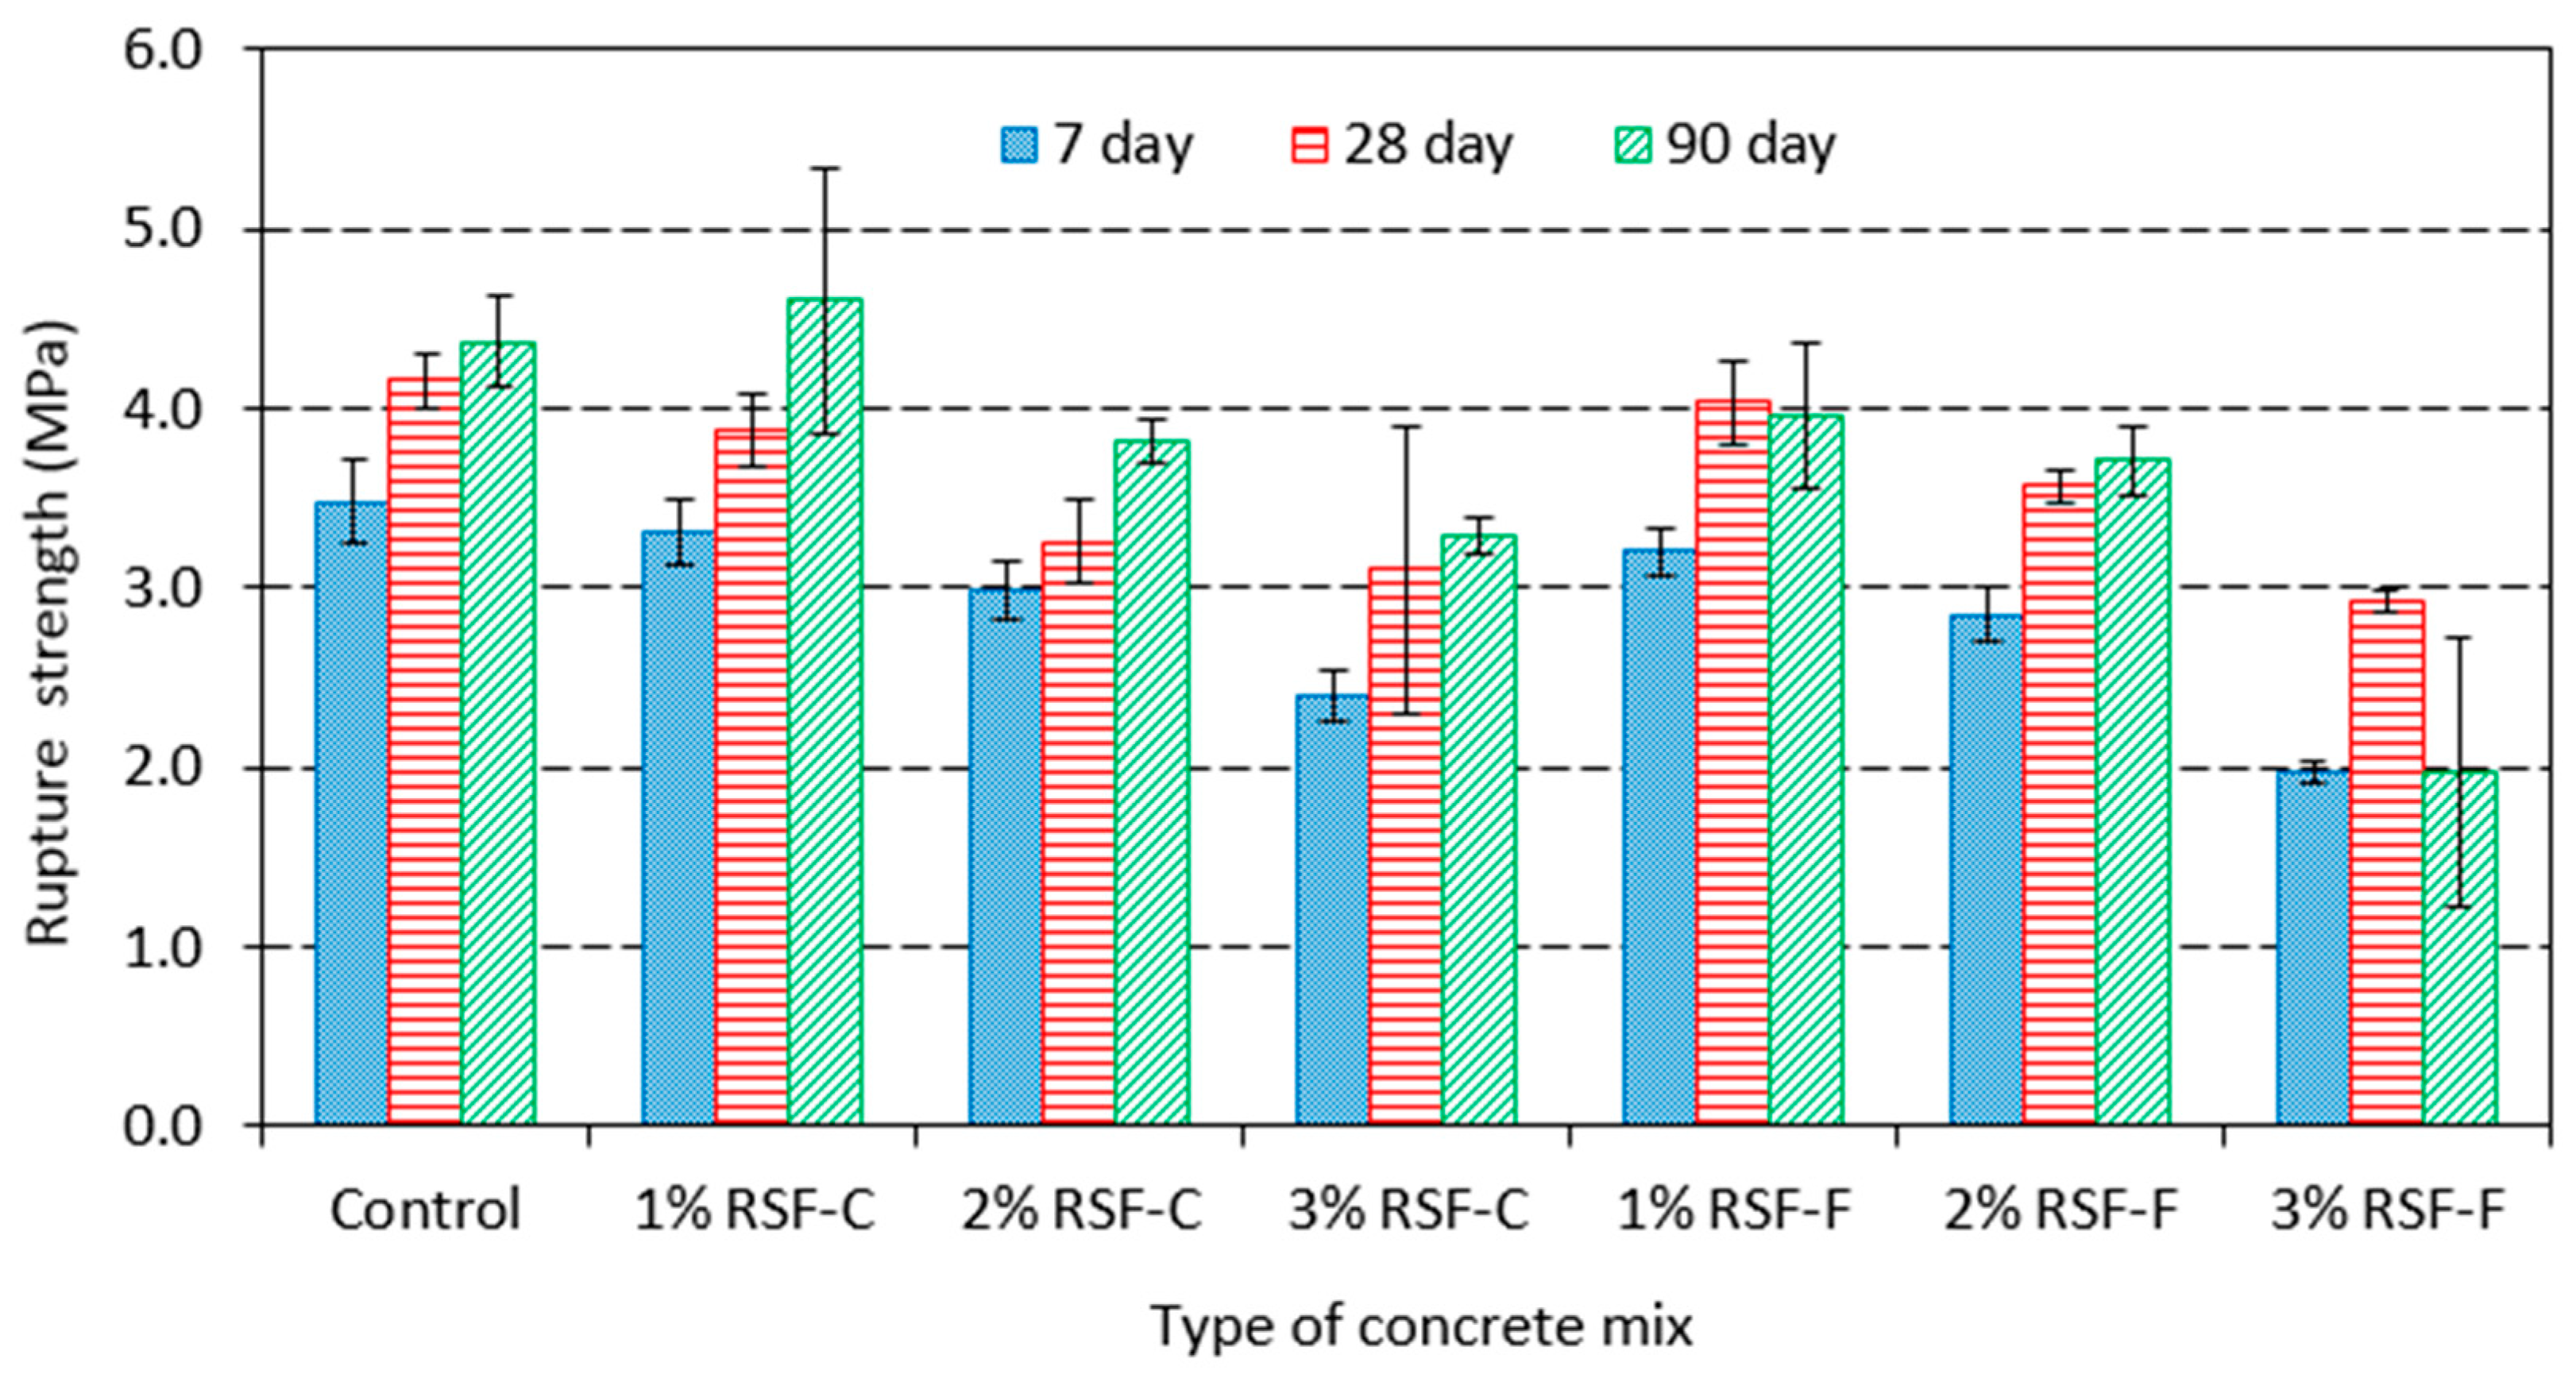
3.3. Impact of RSF Addition on Concrete Flexural Strength

Figure 8 and Figure 9 show rapture strength (flexural strength) of concrete samples with w/c of 0.42 and 0.54, respectively. For a given w/c, samples containing either RSF-C or RSF-F showed lower rupture strength compared to controls samples. Concrete samples containing RSF-F showed a lower flexural strength compared to those containing RSF-C; the opposite was true for compressive strength (see Figure 4 and Figure 5). Figure 8 and Figure 9 also indicate that flexural strength of concrete samples reduced as the percentage of RSF in concrete increased.

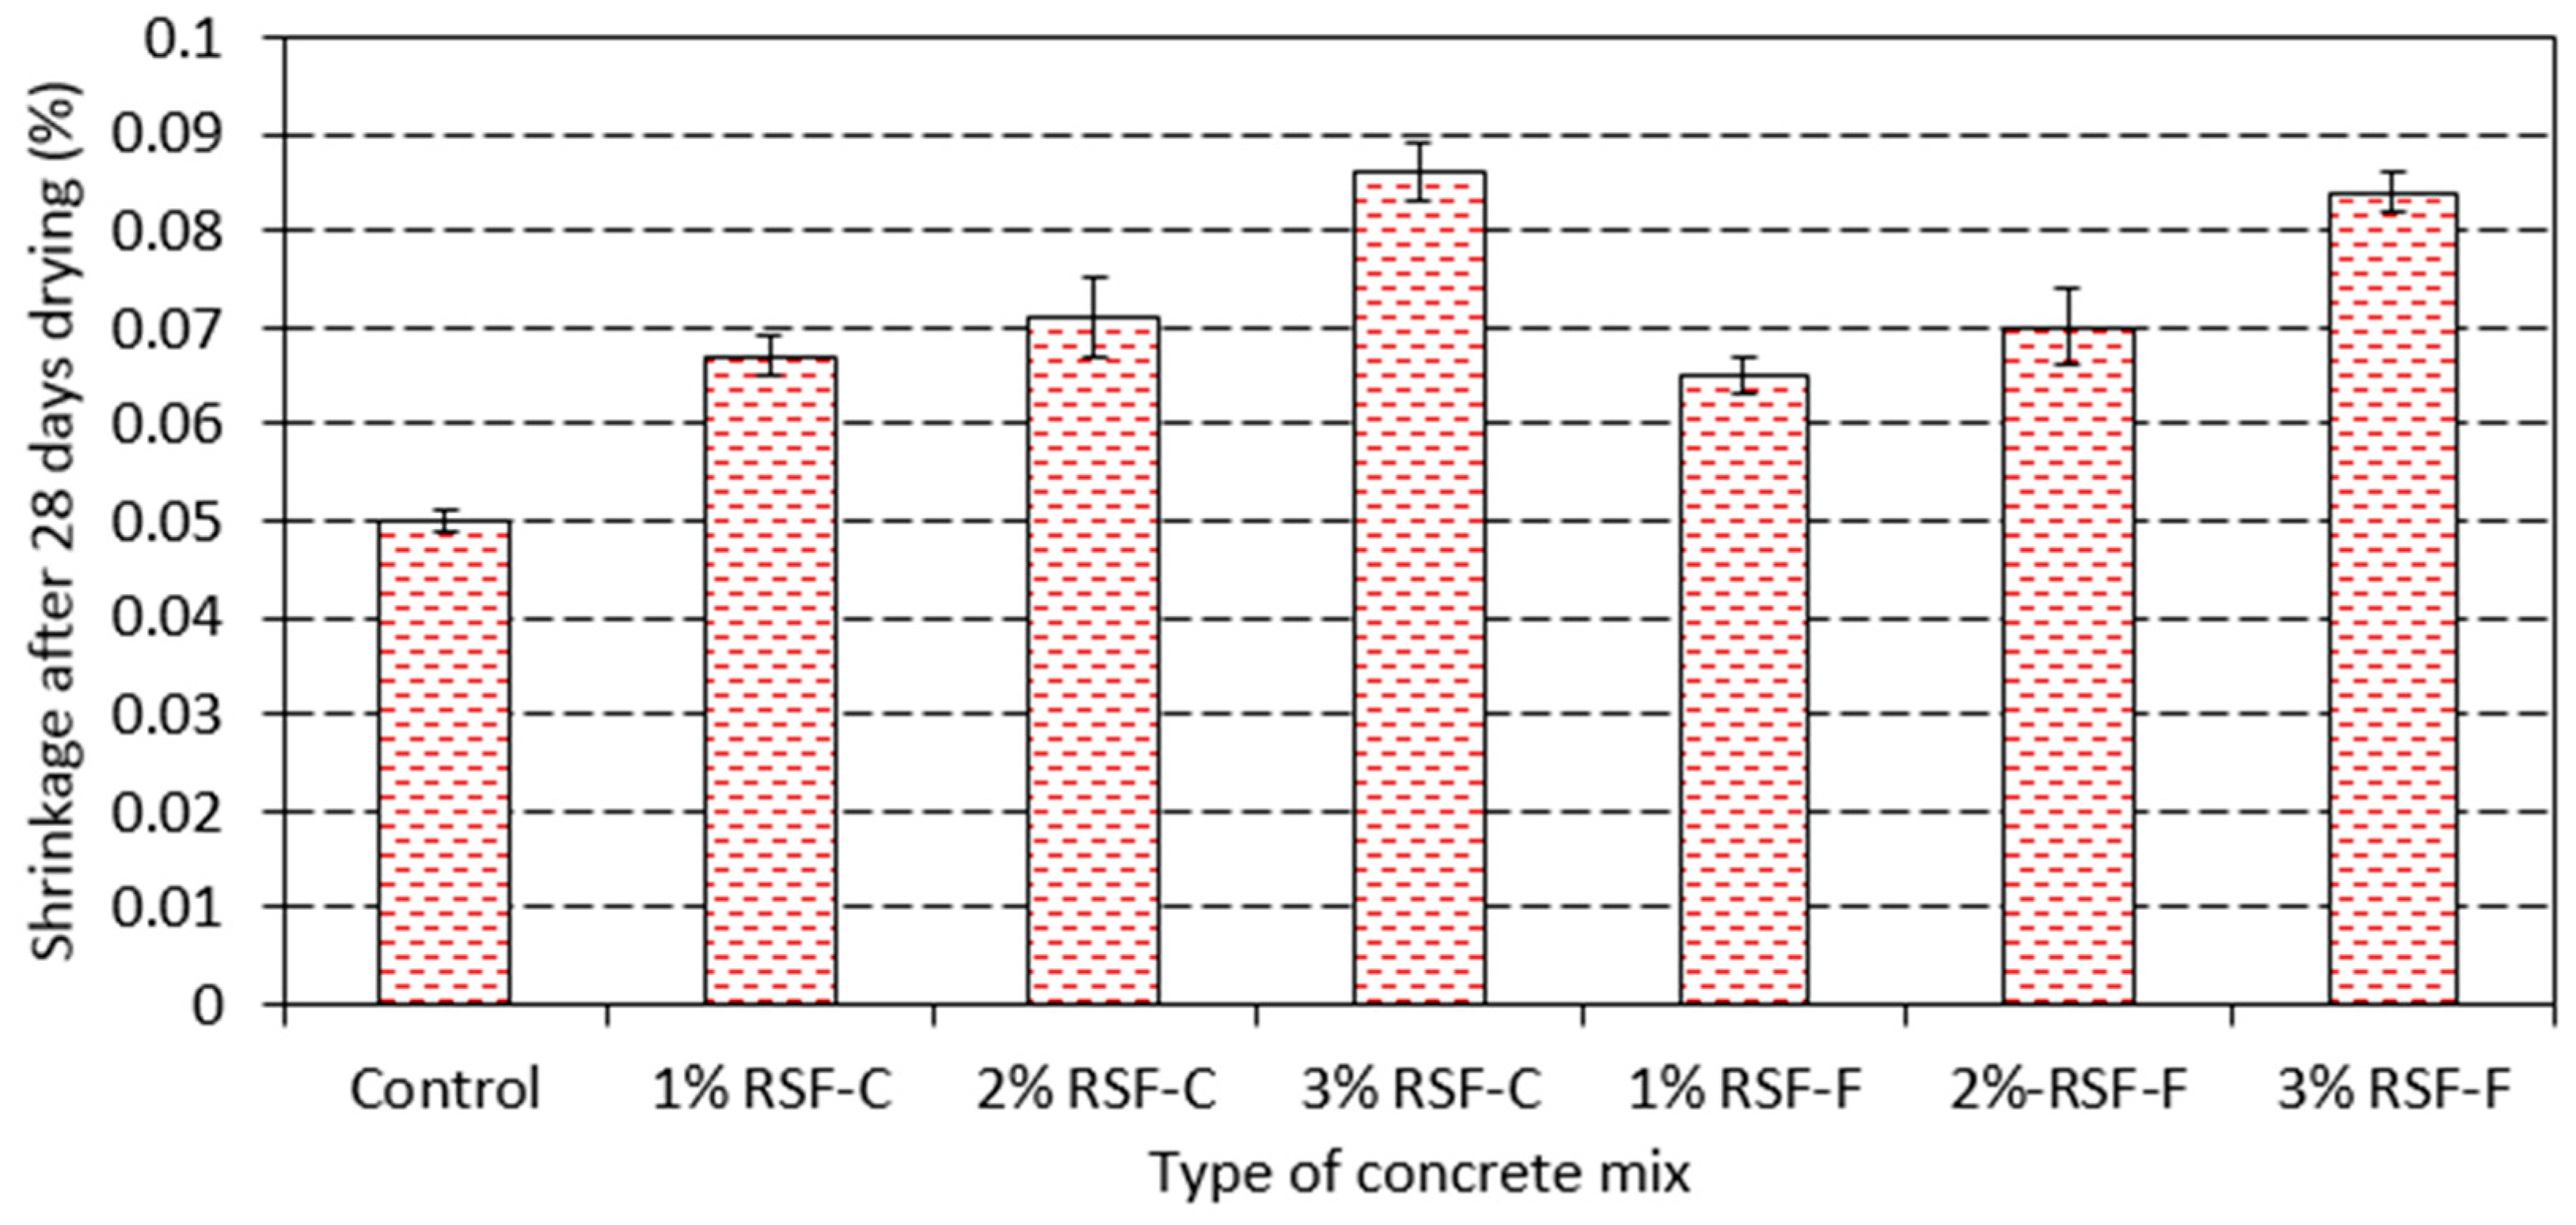
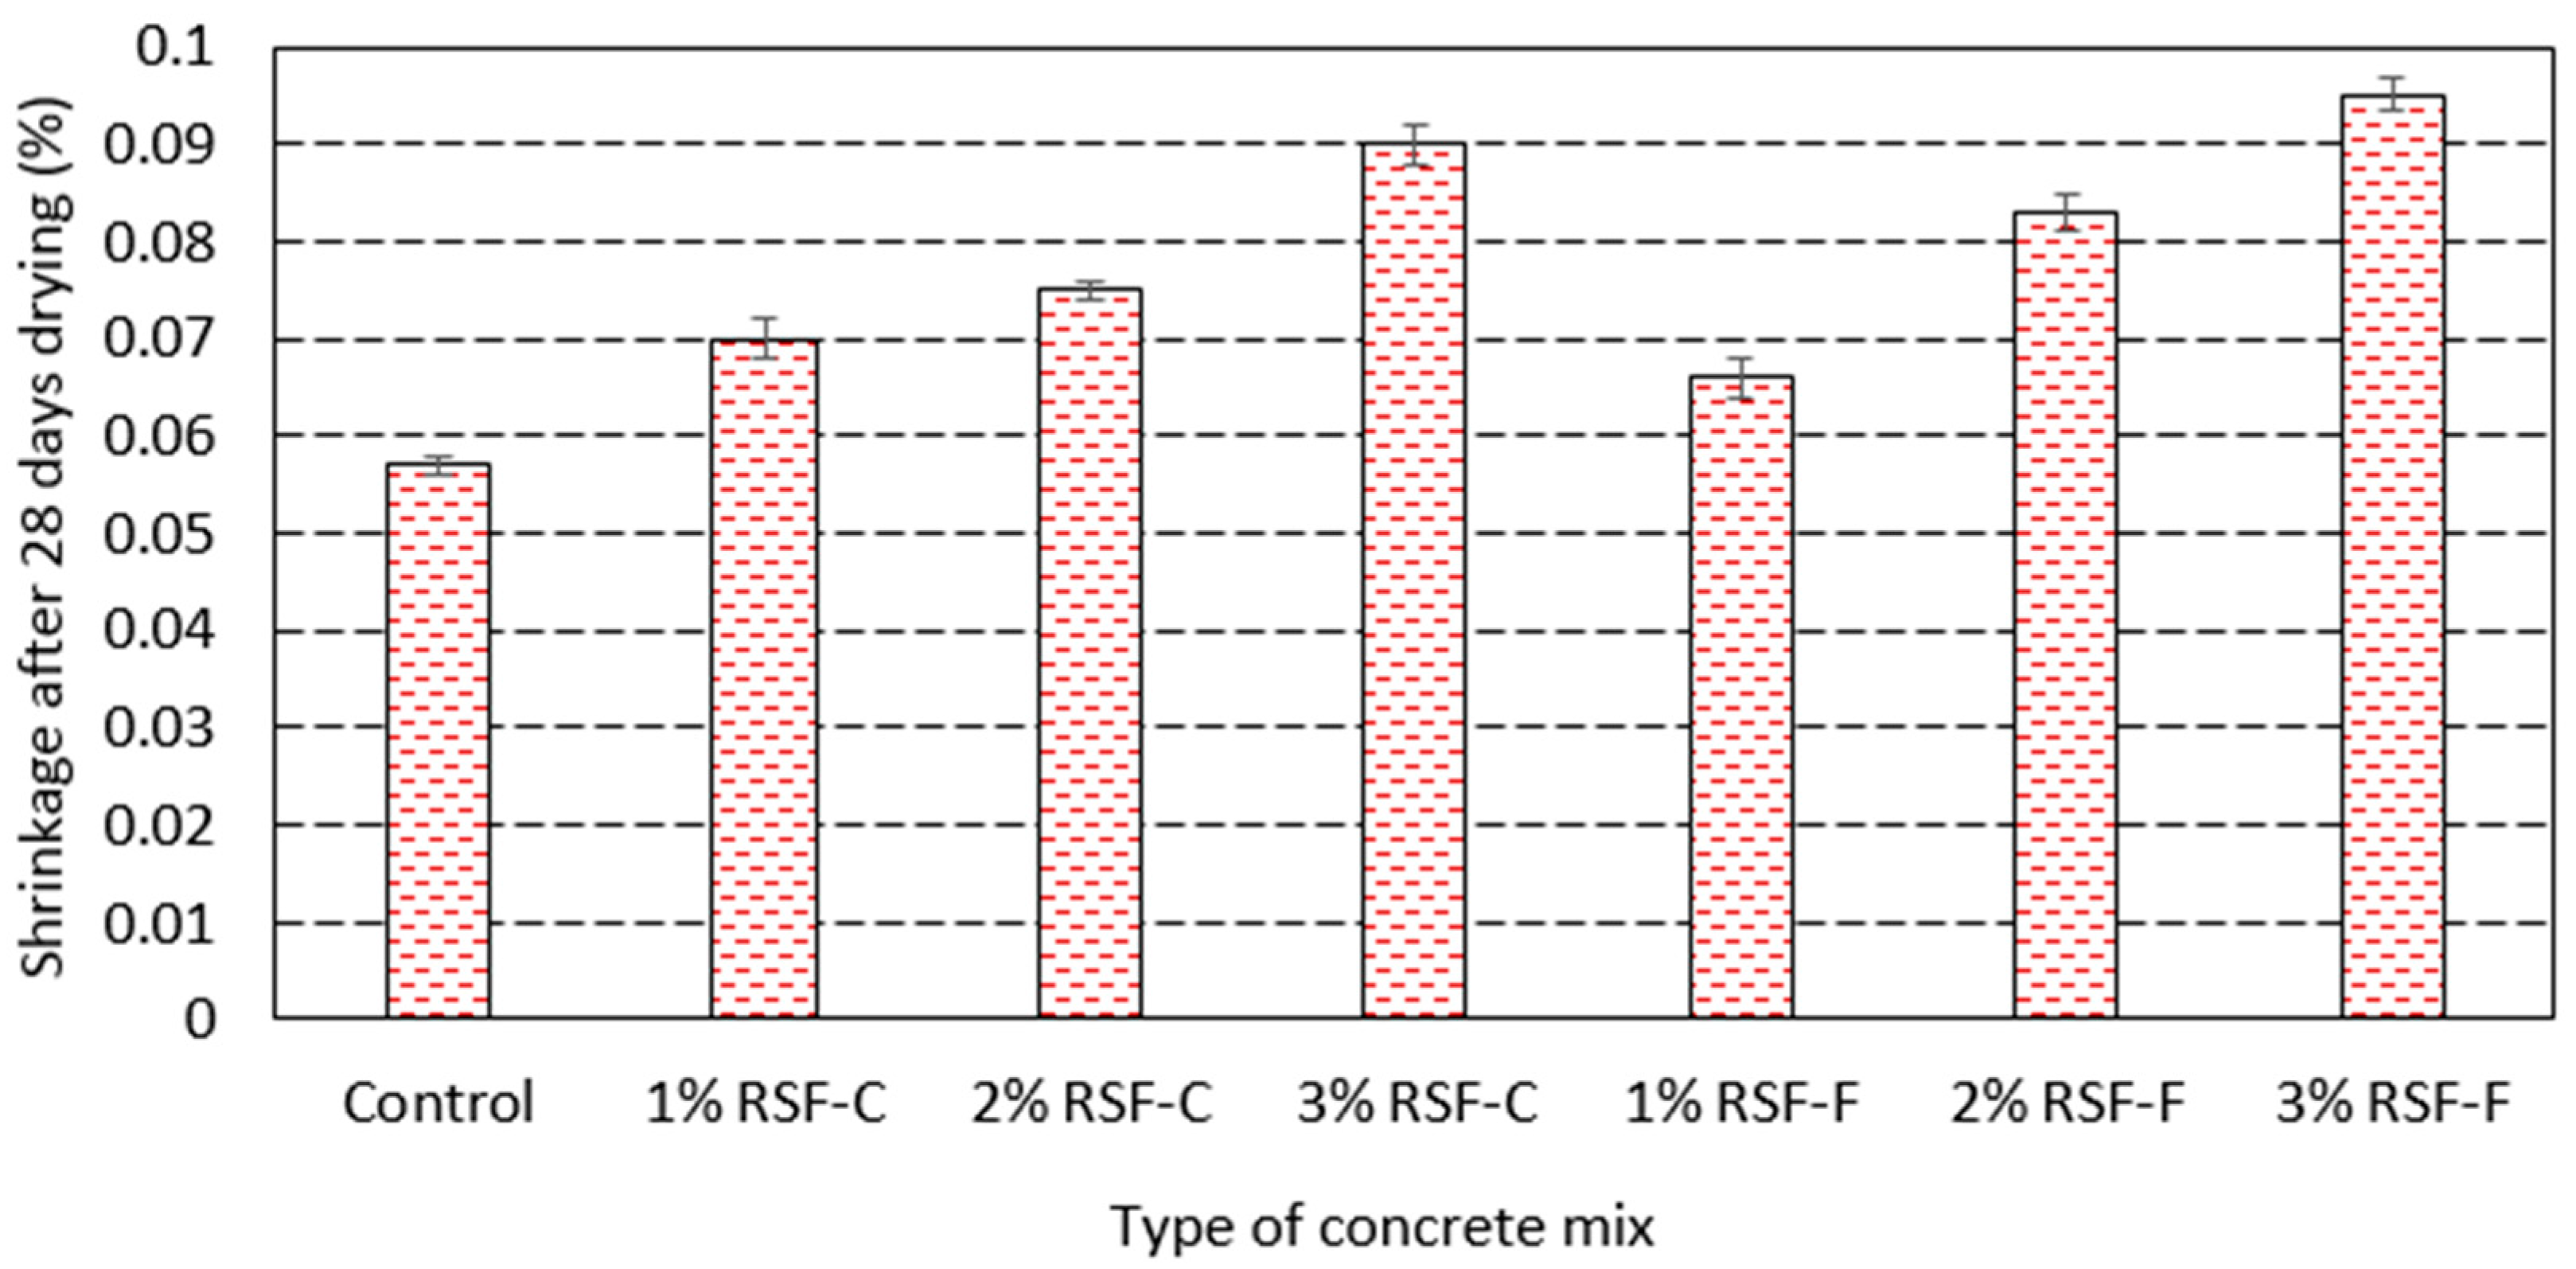
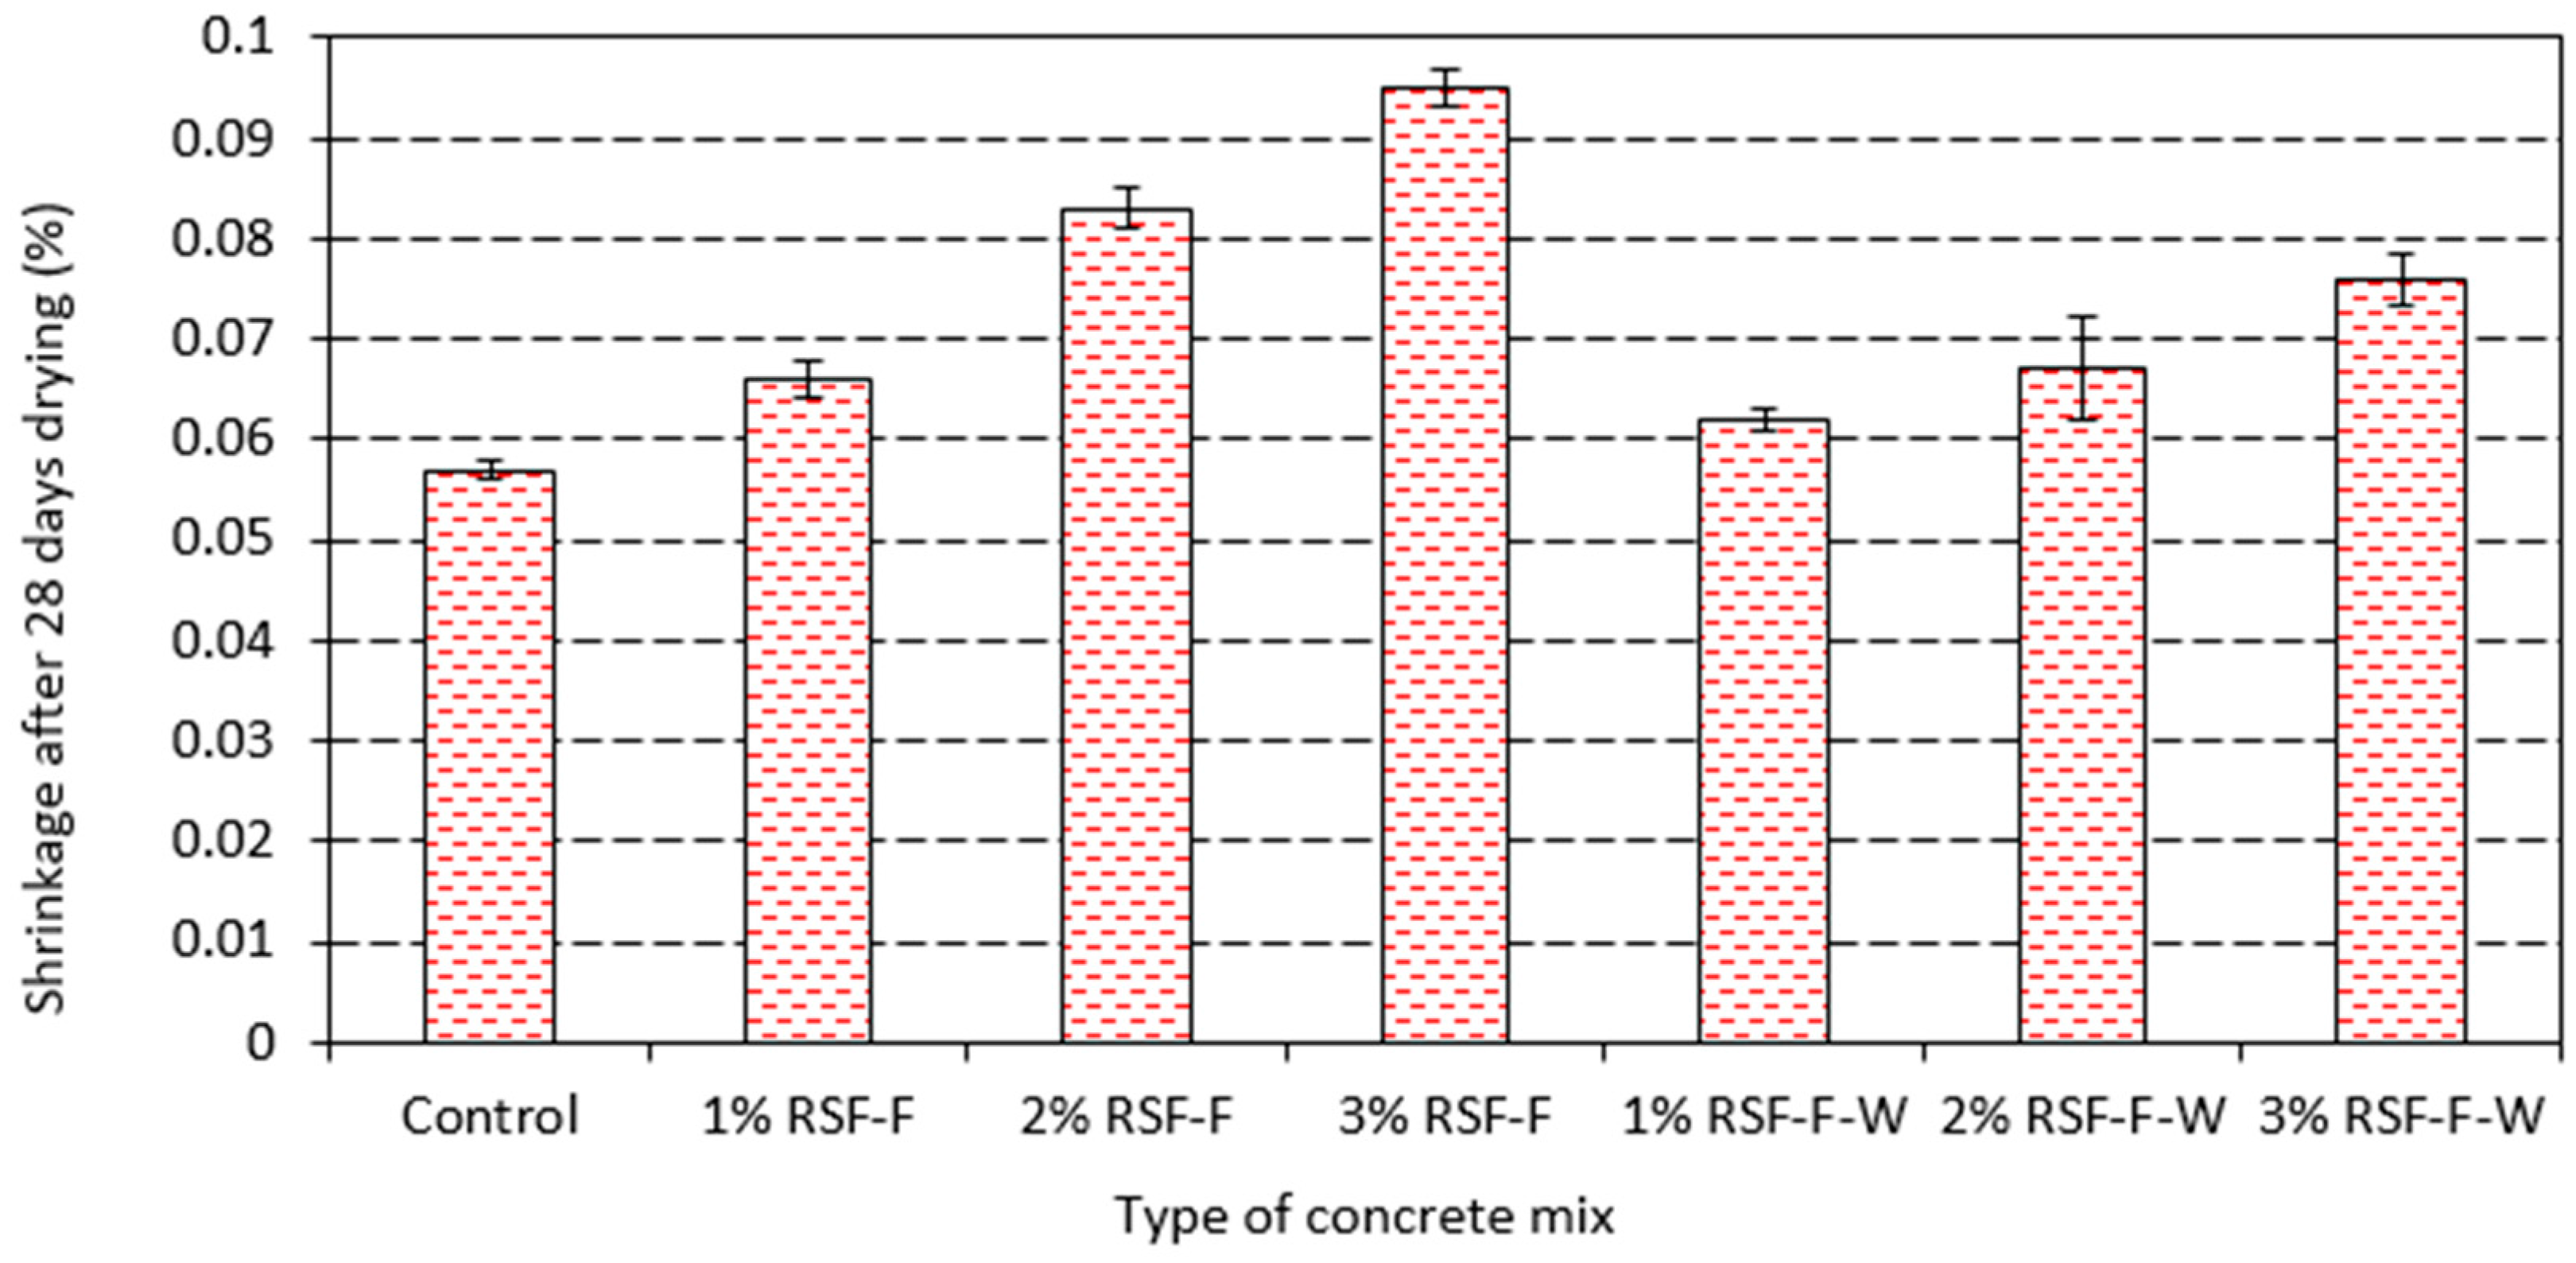
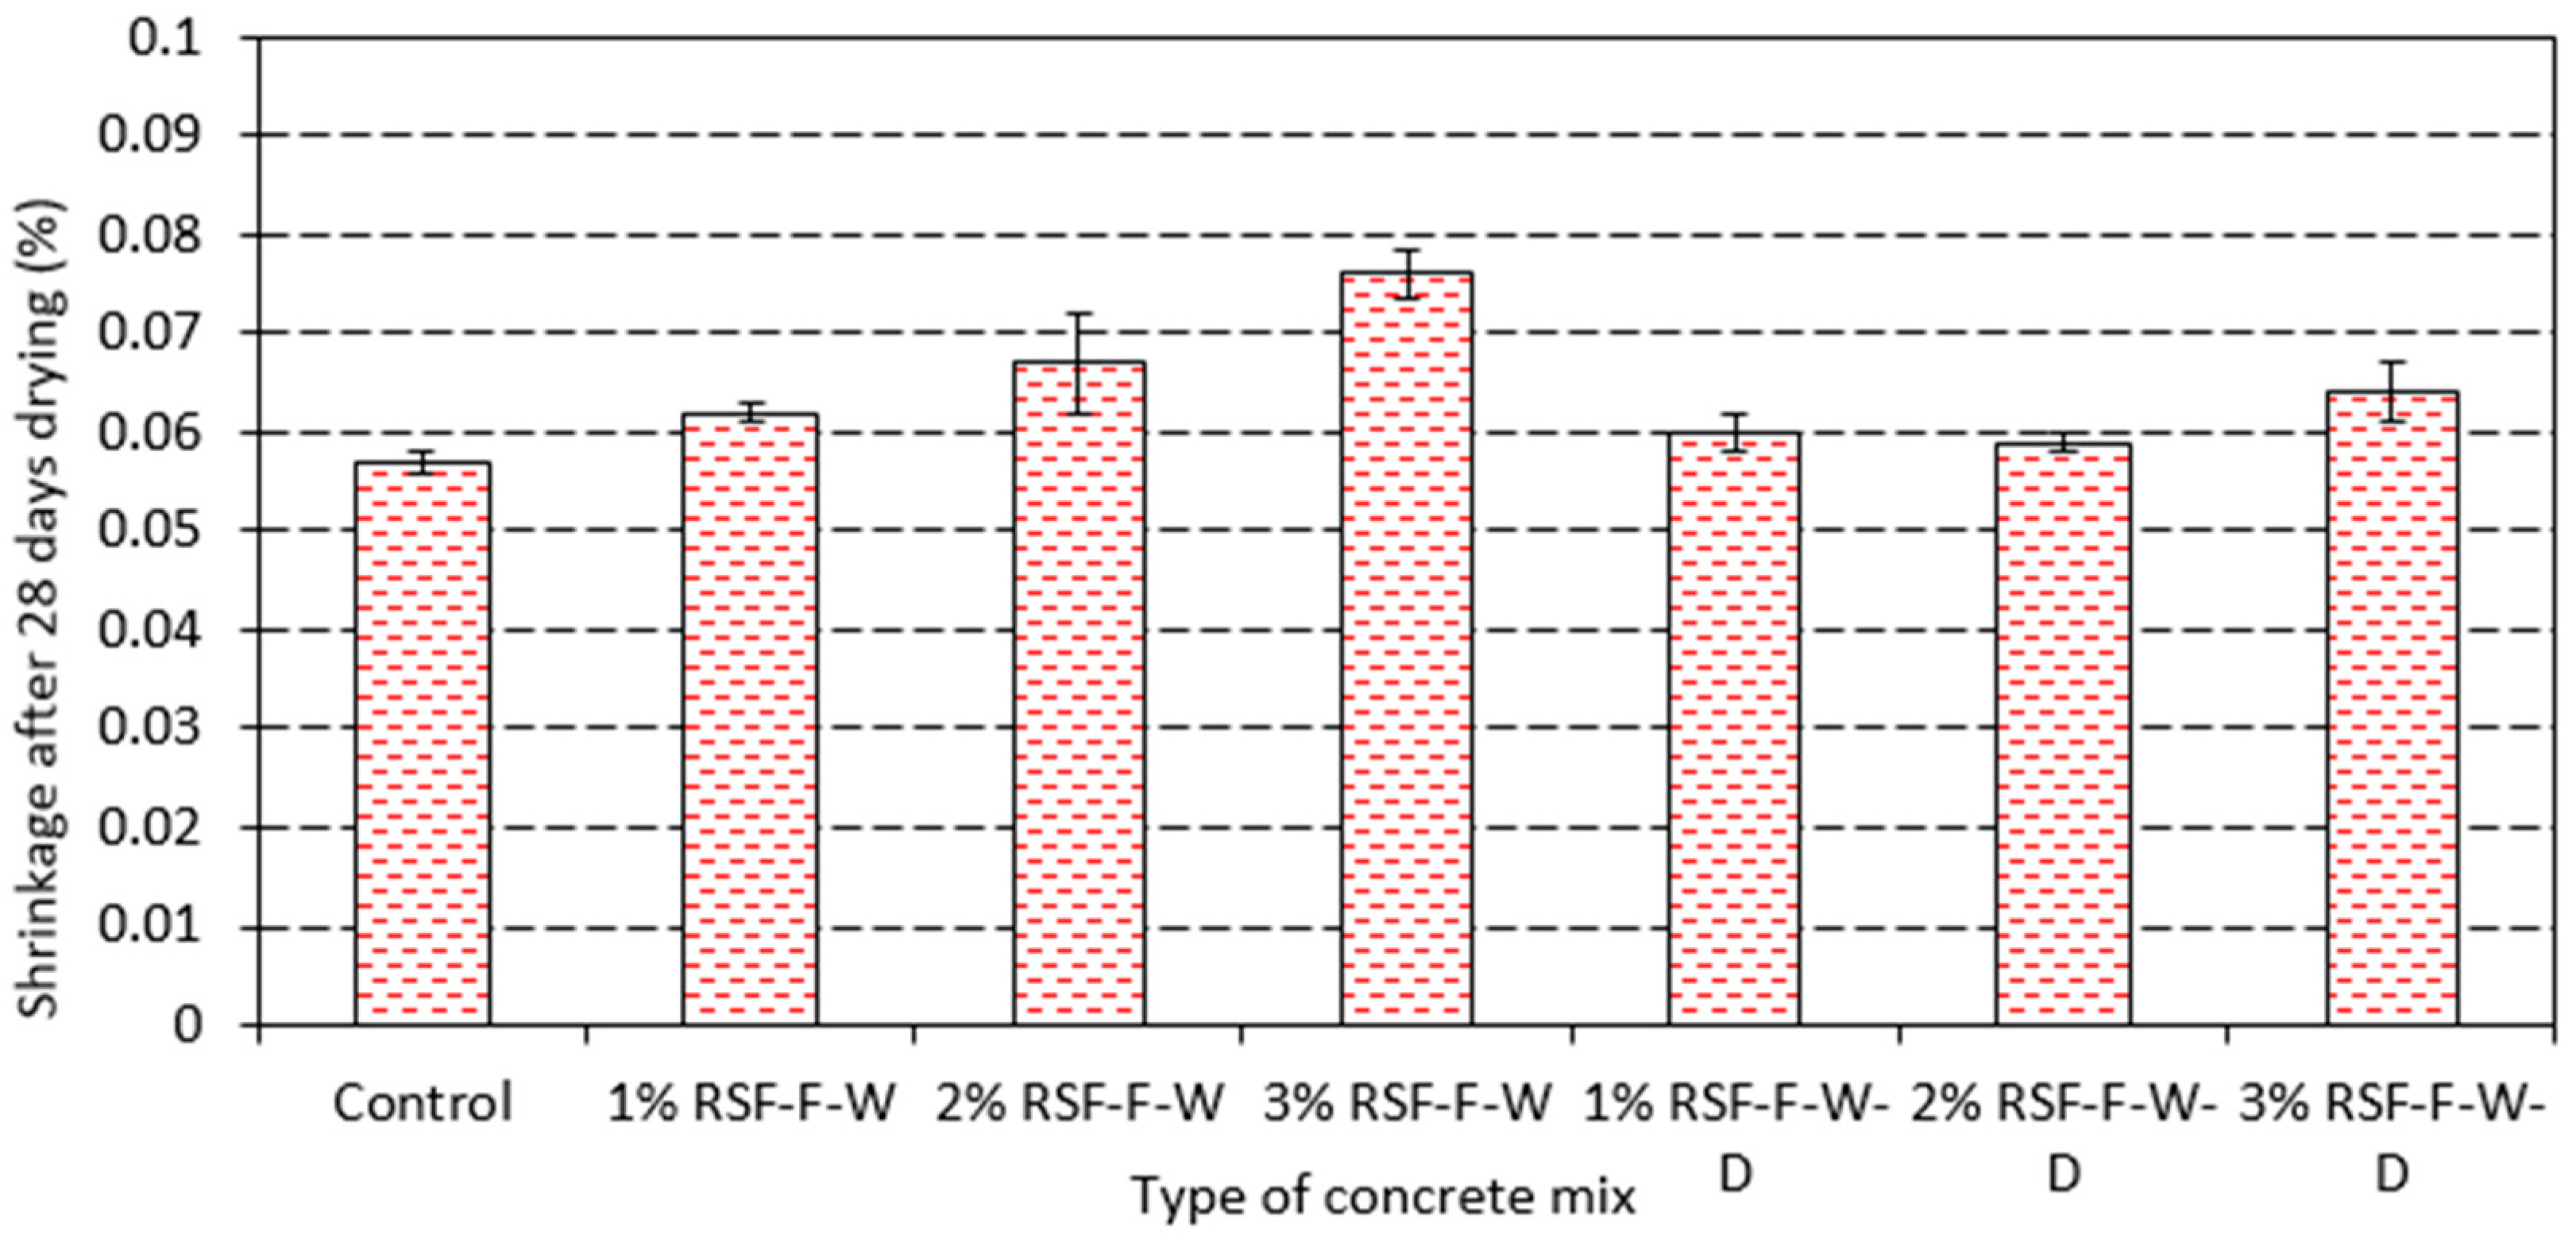
3.4. Impact of RSF Addition on Concrete Drying Shrinkage

Drying shrinkage of concrete prisms for w/c of 0.42 and 0.54 is shown in Figure 10 and Figure 11, respectively. It was shown that, for a given w/c, samples containing RSF had higher drying shrinkage compared to those without RSF, regardless of dosage and type of RSF (RSF-F or RSF-C). Drying shrinkage increased as the amount of RSF in concrete increased. For w/c = 0.42 samples containing RSF-F had lower drying shrinkage than those containing RSF-C (refer to Figure 10). However, for w/c = 0.54, samples containing RSF-F showed higher drying shrinkage compared to those containing RSF-C (Figure 11).
Figure 12 and Figure 13 compare drying shrinkage of samples containing washed and unwashed RSF. As can be seen, for both RSF-F and RSF-C, washing reduced drying shrinkage. Nonetheless, control samples still had the lowest drying shrinkage.

3.5. Discussion on Impact of RSF on Strength and Drying Shrinkage of Concrete

Reduction of concrete compressive and flexural strengths and increase of concrete drying shrinkage caused by addition of RSF (either RSF-C or RSF-F) could be attributed to several factors. Samples containing RSF had higher total water (mix water plus water added to RSF before mixing) content compared to control samples (samples without RSF). For instance, Mix #4 (sample with 2% RSF-C) had 177.7 kg/m3 (0.54 × 329.1) of mix water and 32.8 kg/m3 of water added to RSF before mixing to saturate the RSF; this brings the total water content to 210.5 kg/m3. During the mixing process, it was observed that some of the water added to RSF squeezed out of RSF. An increase to initial slump and bleed water was observed as a result of this. Assuming that all water added to RSF squeezed out of RSF during mixing/consolidation process, the effective w/c (total water/total cement) of Mix #4 becomes 0.64 (210.5/329.1). This w/c is much higher than 0.54 (w/c of control samples). This could be the reason samples containing RSF had lower strength and higher drying shrinkage. It should be noted that all water added to RSF might have not been squeezed out during mixing and/or during consolidation. It was outside the scope of this study to determine exactly how much water was squeezed out of RSF during mixing and samples preparation.
It was also observed that samples containing RSF were more porous compared to control sample (cross sections of beam samples were visually looked at by naked eye to come up with this conclusion). Cross sections of beam samples with and without RSF are shown in Figure 14. As can be seen, Figure 14B (sample with 2% RSF-F) is more porous compared to Figure 14A (control sample); a similar trend was seen for samples containing RSF-C. Higher porosity of samples containing RSF (either RSF-F or RSF-C) could be due to the fact that during consolidation water was squeezed out of RSF causing w/c to increase, which in turn lead to higher porosity.
To validate the assumption of the impact of squeezed water from RSF on concrete strength and drying shrinkage, dry RSF was added to concrete (RSF was washed but it was not saturated before adding to concrete mix). Figure 15 and Figure 16 compare compressive strength and drying shrinkage of concrete samples containing RSF-F-W (saturated or damped) and samples containing dry RSF (labeled as RSF-F-W-D). It can be seen that samples containing dry RSF have higher compressive strength and lower drying shrinkage compare to those containing saturated RSF. This is because no extra water is squeezed out of dry RSF in concrete; hence, the effective w/c of concrete samples consisting dry RSF is lower than that of samples with saturated RSF. This in turn will reduce porosity of concrete which leads to higher strength and lower shrinkage. However, as can be seen in Figure 15 and Figure 16, even concrete samples containing dry RSF (RSF-F-W-D) showed lower compressive strength and higher drying shrinkage compared to control samples. This suggests that there are other factors, besides higher effective w/c, that affect properties of concrete containing RSF.
Further evidence that addition of RSF to concrete could reduce concrete strength is that organic compounds could be leached out of RSF into concrete pore solution which retards cement hydration. Rice straw contains a large quantity of organic compounds such as lignin, cellulose, and hemicellulose that can be leached out by high pH solutions [19,20,21]. Considering the high pH of concrete pore solution, these organic compounds could degrade in concrete, and sugar molecules could leach into the concrete pore solution. These organic molecules having leached into concrete pore solution, the concrete compressive strength would be low because organic compounds act as set retarders [18]. Besides organic matters, rice straw contains inorganic elements, such as phosphorous, that could also be leached into concrete pore solution causing retardation. It has been shown that phosphorous is a cement set-time retarder [22].

4. Conclusions

Isothermal heat of hydration measurements of cement past samples indicated that, for a given dosage of RSF addition, paste samples containing RSF-F had longer induction period compared to those containing RSF-C. It was also found that cement paste samples containing washed RSF had shorter retardation time than those containing unwashed RSF. This was attributable to removal of some organic and inorganic compounds out of RSF by washing. More organic and inorganic compounds were leached out of RSF-F than out of RSF-C.
It was also shown that addition of either saturated or dry RSF in concrete reduces compressive and flexural strengths and increases drying shrinkage of concrete. It was proposed that it was because saturated RSF was used and water from RSF was squeezed during mixing and sample consolidation. This squeezed water increased the effective w/c of concrete which leads to lower strength and higher drying shrinkage. It was also suggested that organic and inorganic matters could be leached from the RSF into concrete pore solution because of high pH of concrete pore solution; this could also negatively affect concrete strength. Results indicated that concrete samples containing RSF-F had higher compressive strength compared to those containing RSF-C. Although washing RSF shortened the induction period of past samples, washing RSF had insignificant influence of compressive and flexural strength. Nevertheless, samples containing washed RSF showed lower drying shrinkage compared to those containing unwashed RSF.

Funding

Funding for this study was provided by California State University Agricultural Research Institute (ARI) and by California Rice Research Board.

Acknowledgments

The author is thankful to Joanne O’Hara, German Fuentes, Aaron Bacon, and Henry Friemuth for their help in conducting experiments for this research. The author is grateful to Lehigh Hanson for donating Portland cement for this study.

Conflicts of Interest

The author declares no conflict of interest.

References

  1. ACI 544.1R. Report on Fiber Reinforced Concrete; American Concrete Institute: Farmington Hills, MI, USA, 2009. [Google Scholar]
  2. Juarez, A.; Fajardoa, G.; Monroy, S.; Duran-Herrera, A.; Valdez, P.; Magniont, C. Comparative study between natural and PVA fibers to reduce plastic shrinkage cracking in cement-based composite. Constr. Build. Mater. 2015, 91, 164–170. [Google Scholar] [CrossRef]
  3. Tschegg, M.E. Fracture energy of natural fibre reinforced concrete. Constr. Build. Mater. 2013, 40, 991–997. [Google Scholar]
  4. Ardanuy, M.; Claramunt, J.; Toledo-Filho, R.-D. Cellulosic fiber reinforced cement-based composites: A review of recent research. Constr. Build. Mater. 2015, 79, 115–128. [Google Scholar] [CrossRef] [Green Version]
  5. Gram, H. Methods for reducing the tendency towards embrittlement in sisal fibre concrete. Nord. Concr. Res. 1983, 2, 62–71. [Google Scholar]
  6. Mezencevova, A.; Garas, V.; Nanko, H.; Kurtis, K.E. Influence of Thermomechanical Pulp Fiber Compositions on Internal Curing of Cementitious Materials. J. Mater. Civ. Eng. 2012, 24, 970–975. [Google Scholar] [CrossRef]
  7. Filho, R.D.T.; Ghavami, K.; Sanjuan, M.A.; England, G.L. Free, restrained and drying shrinkage of cement mortar composites reinforced with vegetable fibres. Cem. Concr. Compos. 2005, 27, 537–546. [Google Scholar] [CrossRef]
  8. Khorami, M.; Ganjian, E. Comparing flexural behaviour of fibre–cement composites reinforced bagasse: Wheat and eucalyptus. Constr. Build. Mater. 2011, 25, 3661–3667. [Google Scholar] [CrossRef]
  9. Mohr, J.; Biernacki, J.J.; Kurtis, K.E. Supplementary cementitious materials for mitigating degradation of kraft pulp fiber-cement composites. Cem. Concr. Res. 2007, 37, 1531–1543. [Google Scholar] [CrossRef]
  10. Mohr, B.J.; Nanko, H.B.; Kurtis, K.E. Durability of thermomechanical fiber-cement composites to wet/dry cycling. Cem. Concr. Res. 2005, 35, 1646–1649. [Google Scholar] [CrossRef]
  11. Filho, R.D.T.; Scrivener, K.; England, G.L.; Ghavami, K. Durability of alkali-sensitive sisal and coconut fibres in cement mortar composites. Cem. Concr. Compos. 2000, 22, 127–143. [Google Scholar] [CrossRef]
  12. Blank, S.; Jetter, K.; Wick, C.; Williams, J. With a ban on burning, incorporating rice straw into soil may become disposal option for growers. Calif. Agric. 1993, 47, 8–12. [Google Scholar]
  13. ASTM C150. Standard Specification for Portalnd Cement; ASTM International: West Conshohocken, PA, USA, 2009. [Google Scholar]
  14. ASTM C39. Standard Test Method for Compressive Strength of Cylindrical Concrete Specimens; ASTM International: West Conshohocken, PA, USA, 2017. [Google Scholar]
  15. ASTM C78/78M. Standard Test Method for Flexural Strength of Concrete (Using Simple Beam with Third-Point Loading); ASTM International: West Conshohocken, PA, USA, 2016. [Google Scholar]
  16. C157/157M. Standard Test Method for Length Change of Hardened Hydraulic-Cement Mortar and Concrete; ASTM International: West Conshohocken, PA, USA, 2014. [Google Scholar]
  17. Riding, K.; Silva, D.; Scrivener, K. Early age strength of blend cement systems by CaCl2 and diethanol-isopropanolmine. Cem. Concr. Res. 2010, 40, 935–946. [Google Scholar] [CrossRef]
  18. Ataie, F.F.; Juenger, M.C.; Taylor-Lange, S.C.; Riding, K.A. Comparison of the retarding mechanisms of zinc oxide and sucrose on cement hydration and interactions with supplementary cementitious materials. Cem. Concr. Res. 2015, 72, 128–136. [Google Scholar] [CrossRef]
  19. Ataie, F.F.; Riding, K.A. Thermochemical Pretreatments for Agricultural Residue Ash Production for Concrete. J. Mater. Civ. Eng. 2012, 25, 1703–1711. [Google Scholar] [CrossRef]
  20. Ataie, F.F.; Riding, K.A. Impact of pretreatments and enzymatic hydrolysis on agricultural residue ash suitability for concrete. Constr. Build. Mater. 2014, 58, 25–30. [Google Scholar] [CrossRef]
  21. Zheng, Y.; Pan, Z.; Zhang, R. Overview of biomass pretreatment for cellulosic ethanol production. Int. J. Agric. Boil. Eng. 2009, 2, 51–68. [Google Scholar]
  22. Ataie, F.; Riding, K. Use of bioethanol byproduct for supplementary cementitious material production. Constr. Build. Mater. 2014, 51, 89–96. [Google Scholar] [CrossRef] [Green Version]
Figure 1. Coarse (left) and fine rice straw fibbers.
Sustainability 10 02445 g001
Figure 2. Heat of hydration of paste samples containing RSF-C.
Sustainability 10 02445 g002
Figure 3. Heat of hydration of paste samples containing RSF-F.
Sustainability 10 02445 g003
Figure 4. Compressive strength data for w/c = 0.42.
Sustainability 10 02445 g004
Figure 5. Compressive strength data for w/c = 0.54.
Sustainability 10 02445 g005
Figure 6. Compressive strength of samples containing washed and unwashed RSF-C (w/c = 0.54).
Sustainability 10 02445 g006
Figure 7. Impact of washing on compressive strength of samples containing RSF-F (w/c = 0.54).
Sustainability 10 02445 g007
Figure 8. Rupture strength of samples with w/c = 0.42.
Sustainability 10 02445 g008
Figure 9. Rupture strength of samples with w/c = 0.54.
Sustainability 10 02445 g009
Figure 10. Drying shrinkage data for w/c = 0.42.
Sustainability 10 02445 g010
Figure 11. Drying shrinkage for samples with w/c = 0.54.
Sustainability 10 02445 g011
Figure 12. Drying shrinkage of samples containing washed and unwashed RSF-C (w/c = 0.54).
Sustainability 10 02445 g012
Figure 13. Drying shrinkage of samples containing unwashed and washed RSF-F (w/c = 0.54).
Sustainability 10 02445 g013
Figure 14. Cross section of concrete beams with w/c = 0.42; (A) control sample; (B) sample with 2% RSF-F.
Sustainability 10 02445 g014
Figure 15. Comparing compressive strength of samples containing dry RSF and saturated RSF.
Sustainability 10 02445 g015
Figure 16. Comparing drying shrinkage of samples containing dry RSF and saturated RSF.
Sustainability 10 02445 g016
Table 1. Chemical composition of cement used.
Silicon Dioxide (SiO2)%21.3
Aluminum Oxide (Al2O3)%3.9
Calcium Oxide (CaO)%63.2
Ferric Oxide (Fe2O3)%3.8
Magnesium Oxide (MgO)%2.2
Sulfur Trioxide (SO3)%2.3
Loss on Ignition (LOI)%2
Total Alkali0.49
Limestone%3.1
Blaine Fineness (m2/kg)380
Table 2. Concrete mixture proportions (per cubic meters).
Mix IDw/cCement (kg)RSF-CRSF-F
RSF%RSF (kg)Water Added to RSF (kg)RSF%RSF (kg)Water Added to RSF (kg)
Mix #10.54329.1000000
Mix #20.42371.7000000
Mix #30.54329.113.416.5000
Mix #40.54329.126.732.8000
Mix #50.54329.139.949.3000
Mix #60.42371.713.718.6000
Mix #70.42371.727.437.2000
Mix #80.42371.7311.255.8000
Mix #90.54329.100013.416.5
Mix #100.54329.100026.732.8
Mix #110.54329.100039.949.3
Mix #120.42371.700013.718.6
Mix #130.42371.700027.437.2
Mix #140.42371.7000311.255.8
Table 3. RSF leachate analysis.
Sample IDNaKPTOC
RSF-CAverage145882932357
St. Div.631340
RSF-FAverage2119861272562
St. Div.106211201
Note: St. Div.= standard deviation.

