Article

Potential of Particle Matter Dry Deposition on Green Roofs and Living Walls Vegetation for Mitigating Urban Atmospheric Pollution in Semiarid Climates

1
Department of Construction Engineering and Management, Pontificia Universidad Católica de Chile, Santiago 7820436, Chile
2
Faculty of Civil Engineering, Universidad Pontificia Bolivariana, Bucaramanga 681007, Colombia
3
Center for Sustainable Urban Development, Pontificia Universidad Católica de Chile, Santiago 7520245, Chile
4
Department of Chemical Engineering and Bioprocesses, Pontificia Universidad Católica de Chile, Santiago 7820436, Chile
5
School of Architecture, Pontificia Universidad Católica de Chile, Santiago 7520245, Chile
6
Department of Hydraulic and Environmental Engineering, Pontificia Universidad Católicade Chile, Santiago 7820436, Chile
7
School of Geography, Universidad de Chile, Santiago 8331051, Chile
8
Department of Inorganic Chemistry, Pontificia Universidad Católica de Chile, Santiago 7820436, Chile
*
Author to whom correspondence should be addressed.
Sustainability 2018, 10(7), 2431; https://doi.org/10.3390/su10072431
Submission received: 27 April 2018 / Revised: 6 July 2018 / Accepted: 9 July 2018 / Published: 12 July 2018
(This article belongs to the Special Issue Vegetated Roofs and Walls)

Abstract

:
In the last two decades, the incorporation of green roofs and living walls in buildings has increased significantly worldwide because of their benefits such as building energy savings, promoting biodiversity, controlling water run-off, mitigating urban heat island effect, improving indoor and urban air quality, and connecting people with nature. However, few studies have quantified the impact of green roofs (GRs) and living walls (LWs) on mitigating air pollution, especially in semiarid climates where airborne particle matter (PM) levels are high. Therefore, the aim of this paper is quantifying the dry deposition of PM10 and PM2.5 by several vegetation species commonly used in GRs and LWs in semiarid climates. Five species (Pitosporum tobira, Lavandula angustifolia, Lampranthus spectabillis, Sedum album, and Sedum reflexum) for GRs and four species (Aptenia cordiflora, Erigeron karvinskianus, Sedum palmeri, and Sedum spurium p.) for LWs were tested in an experimental facility—through washing, filtering, and weighing—to quantify the dry deposition of PM2.5 and PM10 on vegetation leaves as well as PM captured by the leaf wax. The main result is that a significant amount of PM is deposited on the typical vegetation used in GRs and LWs in semiarid climates. However, large differences in PM dry deposition were found among species, ranging from 0.09 μg/cm2∙h−1 to 1.32 μg/cm2∙h−1 for PM2.5, 0.48 μg/cm2∙h−1 to 4.7 μg/cm2∙h−1 for PM10 and 0.41 μg/cm2∙h−1 to 25.6 μg/cm2∙h−1 for leaf wax. The species that showed the highest potential to capture PM were S. album, S. reflexum, S. palmeri, and L. spectabillis. This study shows this green infrastructures can contribute to mitigate air pollution, thus GRs and LWs have the potential for being included in decontamination plans.

1. Introduction

Nowadays, air pollution is considered a major environmental risk for people living in many cities worldwide [1]. Among the air pollutants present in urban areas, respirable particulate matter (PM) is associated to severe health problems such as lung cancer and premature mortality as well as emergency room visits and morbidity [2]. Pope et al. [3] state that long-term exposure to particle matter smaller than 10 μm increases the risk of heart and lung diseases as well as lung cancer, reducing life expectancy.
As a response to that burden of disease, authorities at urban areas have proposed different regulations to improve ambient air quality: tighter emission levels for mobile and stationary sources, cleaner fuels, promoting public transportation versus private cars, etc. More recently, authorities have started encouraging the use of urban vegetation for reducing air pollution [4]. Urban green infrastructures, such as roadside and park trees, vegetation barriers, green roofs (GRs), and living walls (LWs), can reduce the concentrations of different air pollutants through the phytofiltration mechanism [5]. It is known that the leaves’ surface and stems adsorb significant amounts of air pollutants. Specifically, for the case of PM, the particles suspended deposit or accumulate on the leaf surfaces. Although a fraction of deposited or accumulated PM is resuspended by wind, another part of PM remains attached to the plant. Moreover, particles with aerodynamic size less than 0.2 µm can permanently captured after entering through the stomata [6,7]. Rainfall, on the other hand, washes down pollutants so that they come into contact with the roots, where a depuration process occurs [5]. In this paper, the evaluation of capture potential of PM by GRs and LWs is measured by the PM deposited on the leaf surface.
Urban green infrastructure plays an important role in the mitigation of PM contamination in urban areas and several studies have demonstrated the PM mitigation potential of trees, shrubs, grasses, herbaceous plants, climbers, and lianas [6,8,9,10]. Dzierżanowski et al. [11] showed that four species of roadside trees (Acer campestre L., Fraxinus excelsior L., Platanus × hispanica Mill. ex Muenchh. ‘Acerifolia’, Tilia cordata Mill), three species of shrubs (Forsythia × intermedia Zabel, Physocarpus opulifolius L. Maxim., Spiraea japonica L.), and one climber species (Hedera helix L.) were able to purify the urban air through the dry deposition of PM on the leaves. The maximum deposition of PM10 reported in [11] was approximately 25 μg·cm−2 in two growing seasons monitoring. Additionally, this study found that deposited PM varies significantly among the species evaluated, which agrees with the findings of others researches such as [6,8,10]. Moreover, Dzierżanowski et al. [11] found that large trees are less effective than shrubs and climber species in terms of PM dry deposition. On the other hand, Chen et al. [8] quantified the PM deposited by different species of trees, shrubs, and lianas located in an urban green space in Beijing, China. In this case, the maximum dry deposition of PM2.5 for trees, shrubs and lianas was 70 μg·cm−2·day−1, 40 μg·cm−2·day−1, and 25 μg·cm−2·day−1, respectively. In Santiago, Chile, Muñoz et al. [9] concluded that roadside trees are effective in reducing air pollution by capturing PM as they act as passive collectors of PM. Furthermore, they found a positive correlation between the particles deposited on the leaves of Platanus orientalis and the traffic flows, which evidences that dry deposition of PM is significantly influenced by PM concentration close to the vegetation. Similar results were reported by Przybysz et al. [10] and Ottelé et al. [7], who studied other species.
Regarding the impact of the species used in GRs and LWs, Table 1 summarizes the most recent experimental research about the potential of GRs and LWs to mitigate air pollution, which studied that different species of shrubs, grasses, herbaceous plants, climbers, and lianas species. It is observed that few studies on quantifying such potential have been carried out. First, two main approaches to evaluate that effect are reported in the literature: (1) measuring the dry deposition of PM on GRs and LWs vegetation and (2) estimating the reduction of PM concentration due to GRs and LWs vegetation. While dry deposition is mainly measured by the gravimetric method [8,10,11,12], the impact of GRs and LWs on PM concentration is mostly measured in environmental chambers [13,14]. An exception is the study of Tan and Sia [15], who measured the impact of GRs on outdoor PM concentration. In addition, it is difficult to compare the results shown in Table 1 as they report dry deposition of PM during different measurement periods in urban areas with different ambient PM concentrations. For example, the measuring period in Speak et al. [12] was two years while it was just one month in Chen et al. [8]. Nonetheless, the differences in the results reported in Table 1 suggests that some species are more efficient in mitigating PM pollution. Speak et al. [12] explained those differences by the variability in the species’ morphology. Chen et al. [8] pointed out that the difference among the effectiveness as bio-filter of PM of each species could be associated with the layout configuration (relative location among species) in the environment where they develop.
Given the limited space to plant new trees and large shrubs in dense cities, GRs and LWs have been identified as valuable strategies that, in addition of promoting building energy savings [16,17,18], reducing heat island effect [19], controlling water run-off [20,21], and promoting biodiversity, provide room for improving urban air quality [22]. However, most of country/municipality’s public policies that either promote or regulate the incorporation of GRs and LWs in buildings are focused on building energy savings, stormwater run-off management, and biodiversity (Table 2). Since 2010, the City of Copenhagen, Denmark, has incorporated the mandatory implementation of green roofs in local plans for stormwater run-off control. There are also plans to cover the old roofs of the city with vegetation in order to achieve a carbon neutral built environment by 2025. On the other and, the city of Buenos Aires, Argentina, established the Law 4428 of Green Roofs and Terraces that regulates the incorporation of GRs in buildings, but it is not mandatory, yet [23]. Currently, few cities or countries have established policies that promote GRs and LWs to mitigate air pollution such as Chicago [24,25] and France [25]. France has recently instituted a law with the goal of returning nature to the city so that new commercial buildings integrate GRs or photovoltaic panels to reduce atmospheric pollution by PM [25].
To support public policies for implementation of GR and LW to mitigate urban air pollution, it is necessary to: (1) demonstrate the environmental benefits of different local species to encourage their use [22]; (2) identify the species or set of species that maximize dry deposition of PM on their leaves [13,26]; and (3) make comparisons and generate design recommendations [27]. Nevertheless, the quantification of PM dry deposition potential depends on multiple factors such as plant species, structure of the vegetation, exposure level to PM, location and microclimatic conditions, among others [7].
The state-of-the-art shows that, despite the potential impact of GRs and LWs on mitigation of urban air pollution, there is little information on the quantification of PM deposited among species typically used in GRs and LWs. In different urban areas, several species are currently used but very few have been studied from that standpoint. This is crucial information to support design criteria of GRs and LWs to maximize their environmental benefits, the development of public policies and inclusion of GRs and LWs in urban planning. Therefore, the aim of this paper is to quantify the dry deposition of PM10 and PM2.5 of nine vegetation species mostly used in GRs and LWs in semiarid climates of Chile, and to identify the species that would be more efficient in removing urban atmospheric pollution by MP10 and MP2.5.

2. Materials and Methods

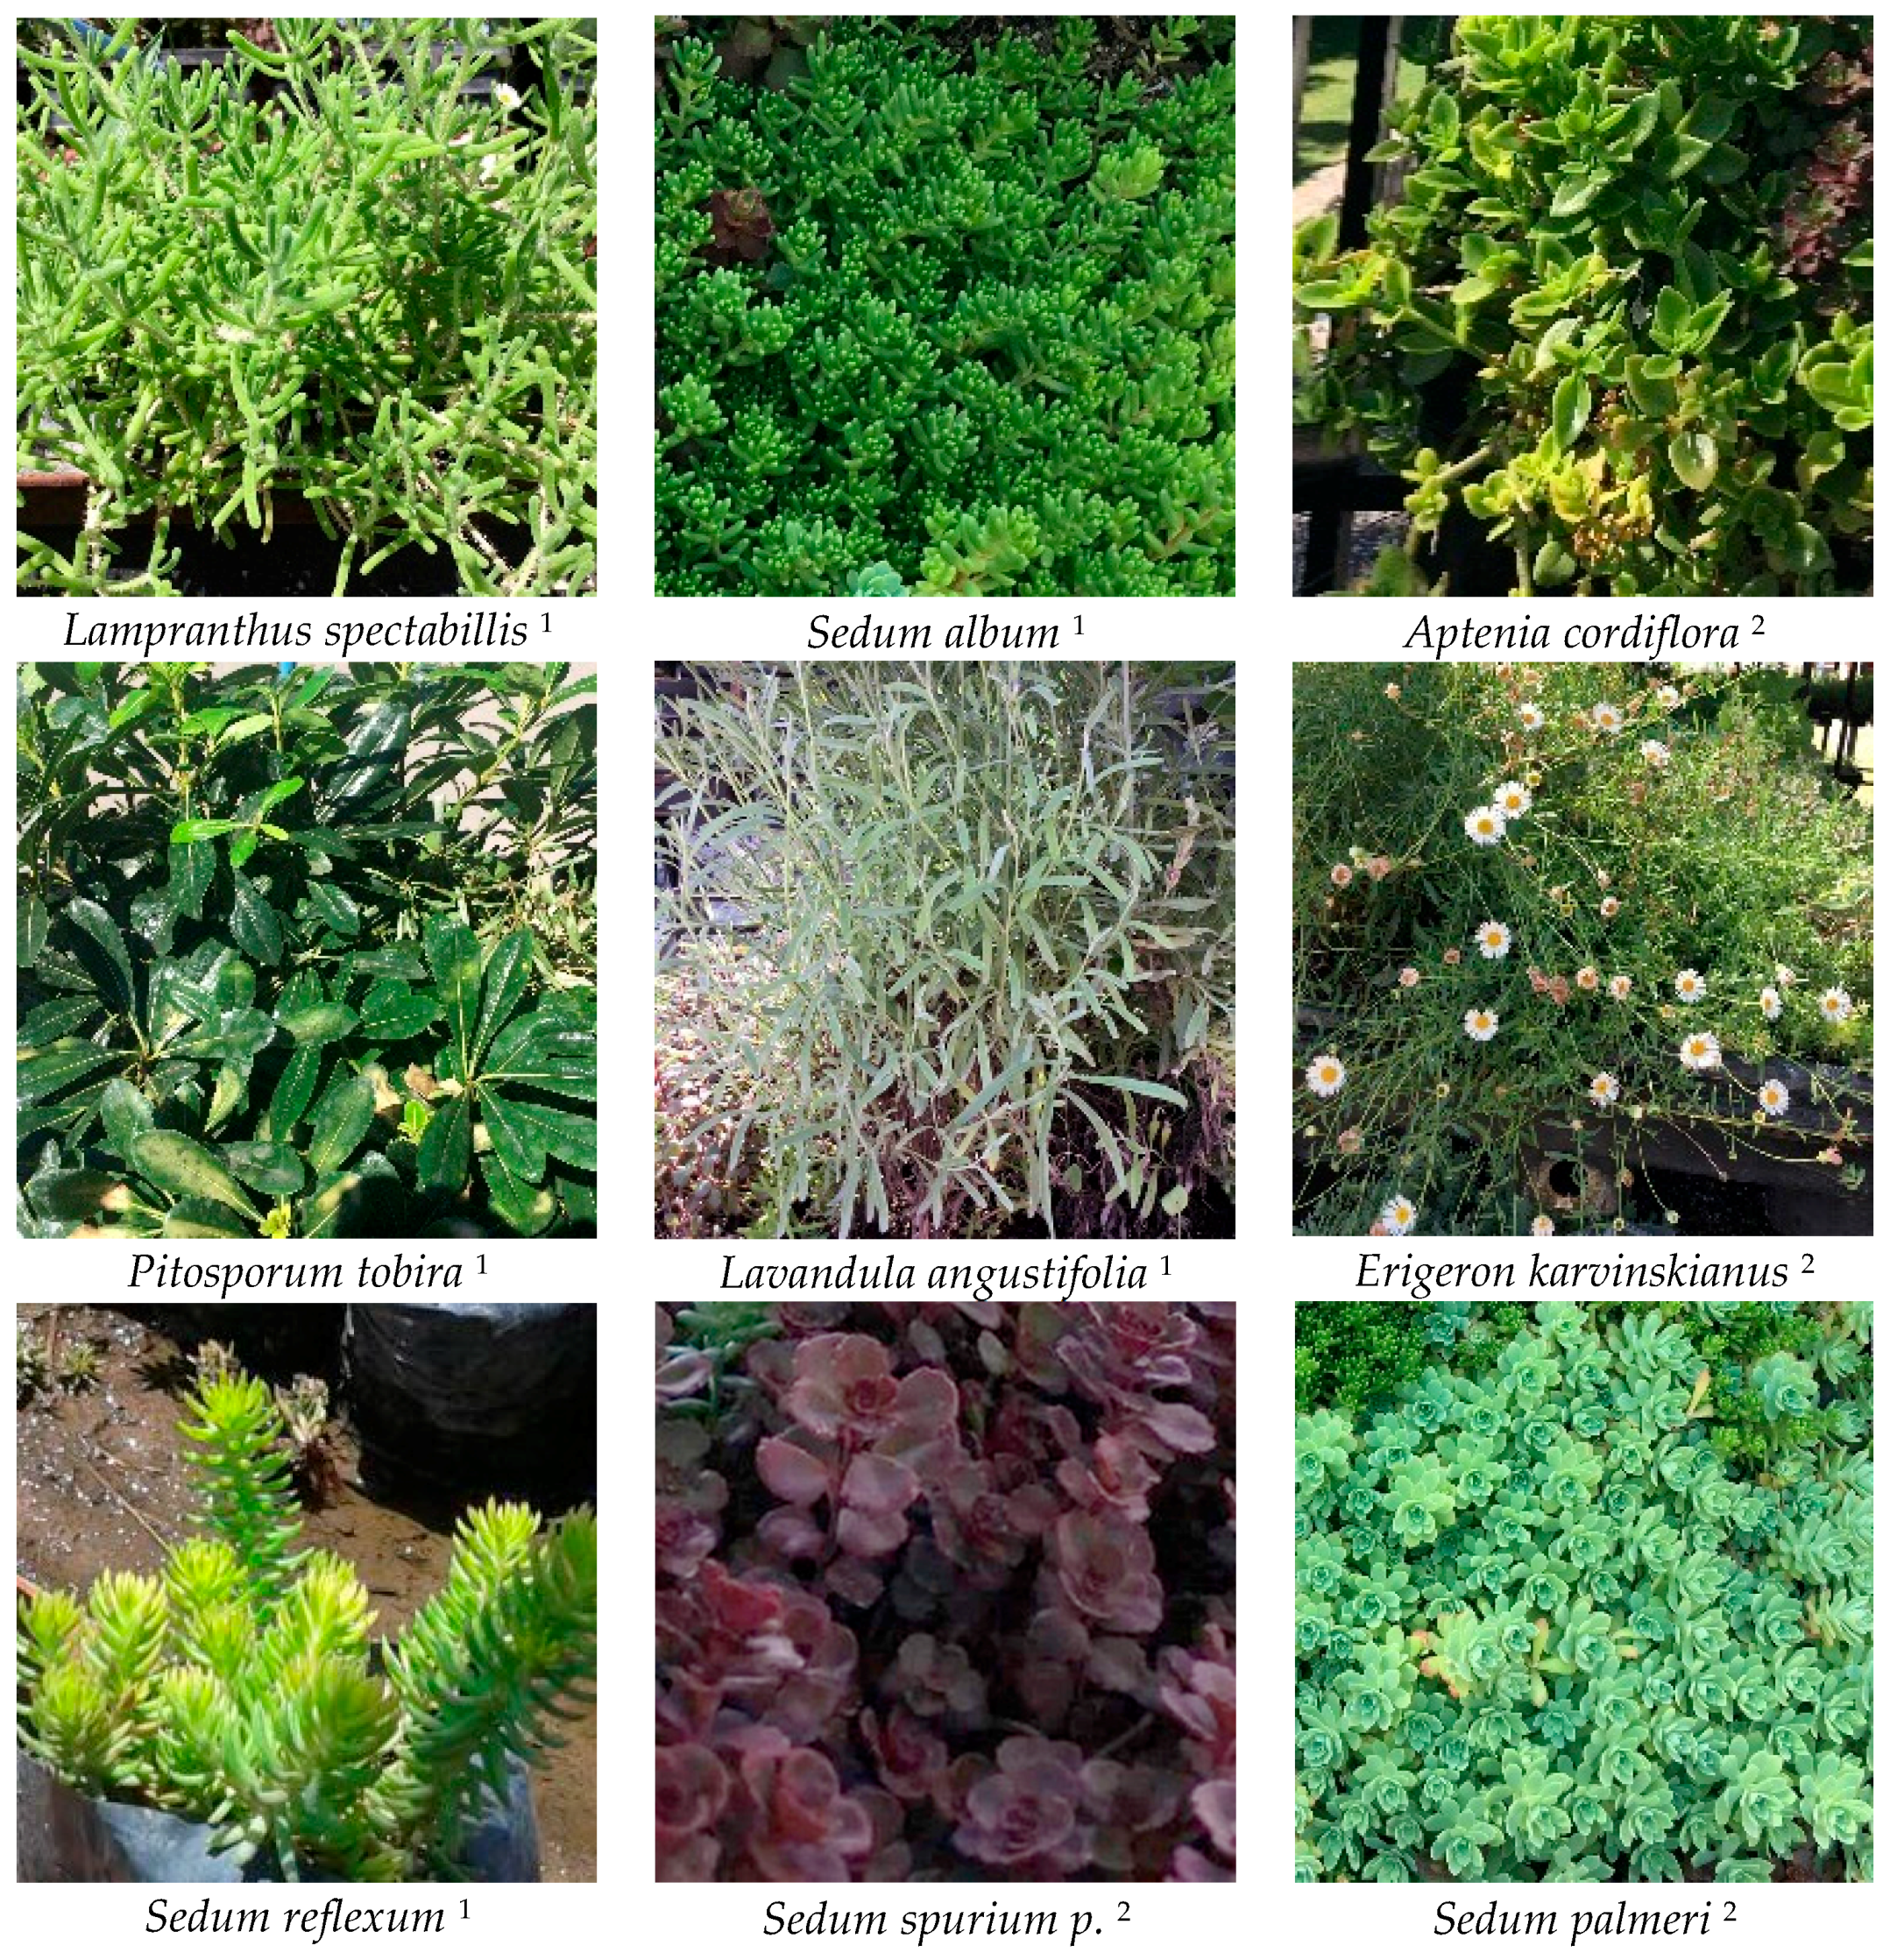
2.1. Selected Plant Species

Five species (Pitosporum tobira, Lavandula angustifolia, Lampranthus spectabillis, Sedum album, and Sedum reflexum) were chosen for GRs and four species (Aptenia cordiflora, Erigeron karvinskianus, Sedum palmeri, and Sedum spurium p.) for LWs. Figure 1 shows all species. P. tobira, L. angustifolia are shrubs, while the rest of species are different alternatives of low growing perennial herbaceous plants. Among them, S. album, S. reflexum, A. cordiflora, S. palmeri, and S. spurium p. are succulent species. All species were evaluated in terms of their dry deposition of PM10 and PM2.5 on the leaves and PM captured by the leaf wax. These species were selected because they are the most used in the Metropolitan Region of Chile [31,32]. This region is characterized by a semiarid climate (Bsk) according to the Köppen-Geiger classification [33]. The selection criteria were type of species, origin, use, potential of PM dry deposition based on published results (if any), and the level of preferences of designers and builders [31,34], which is mainly based on landscaping characteristics, irrigation and maintenance requirement, and tolerance to drought.

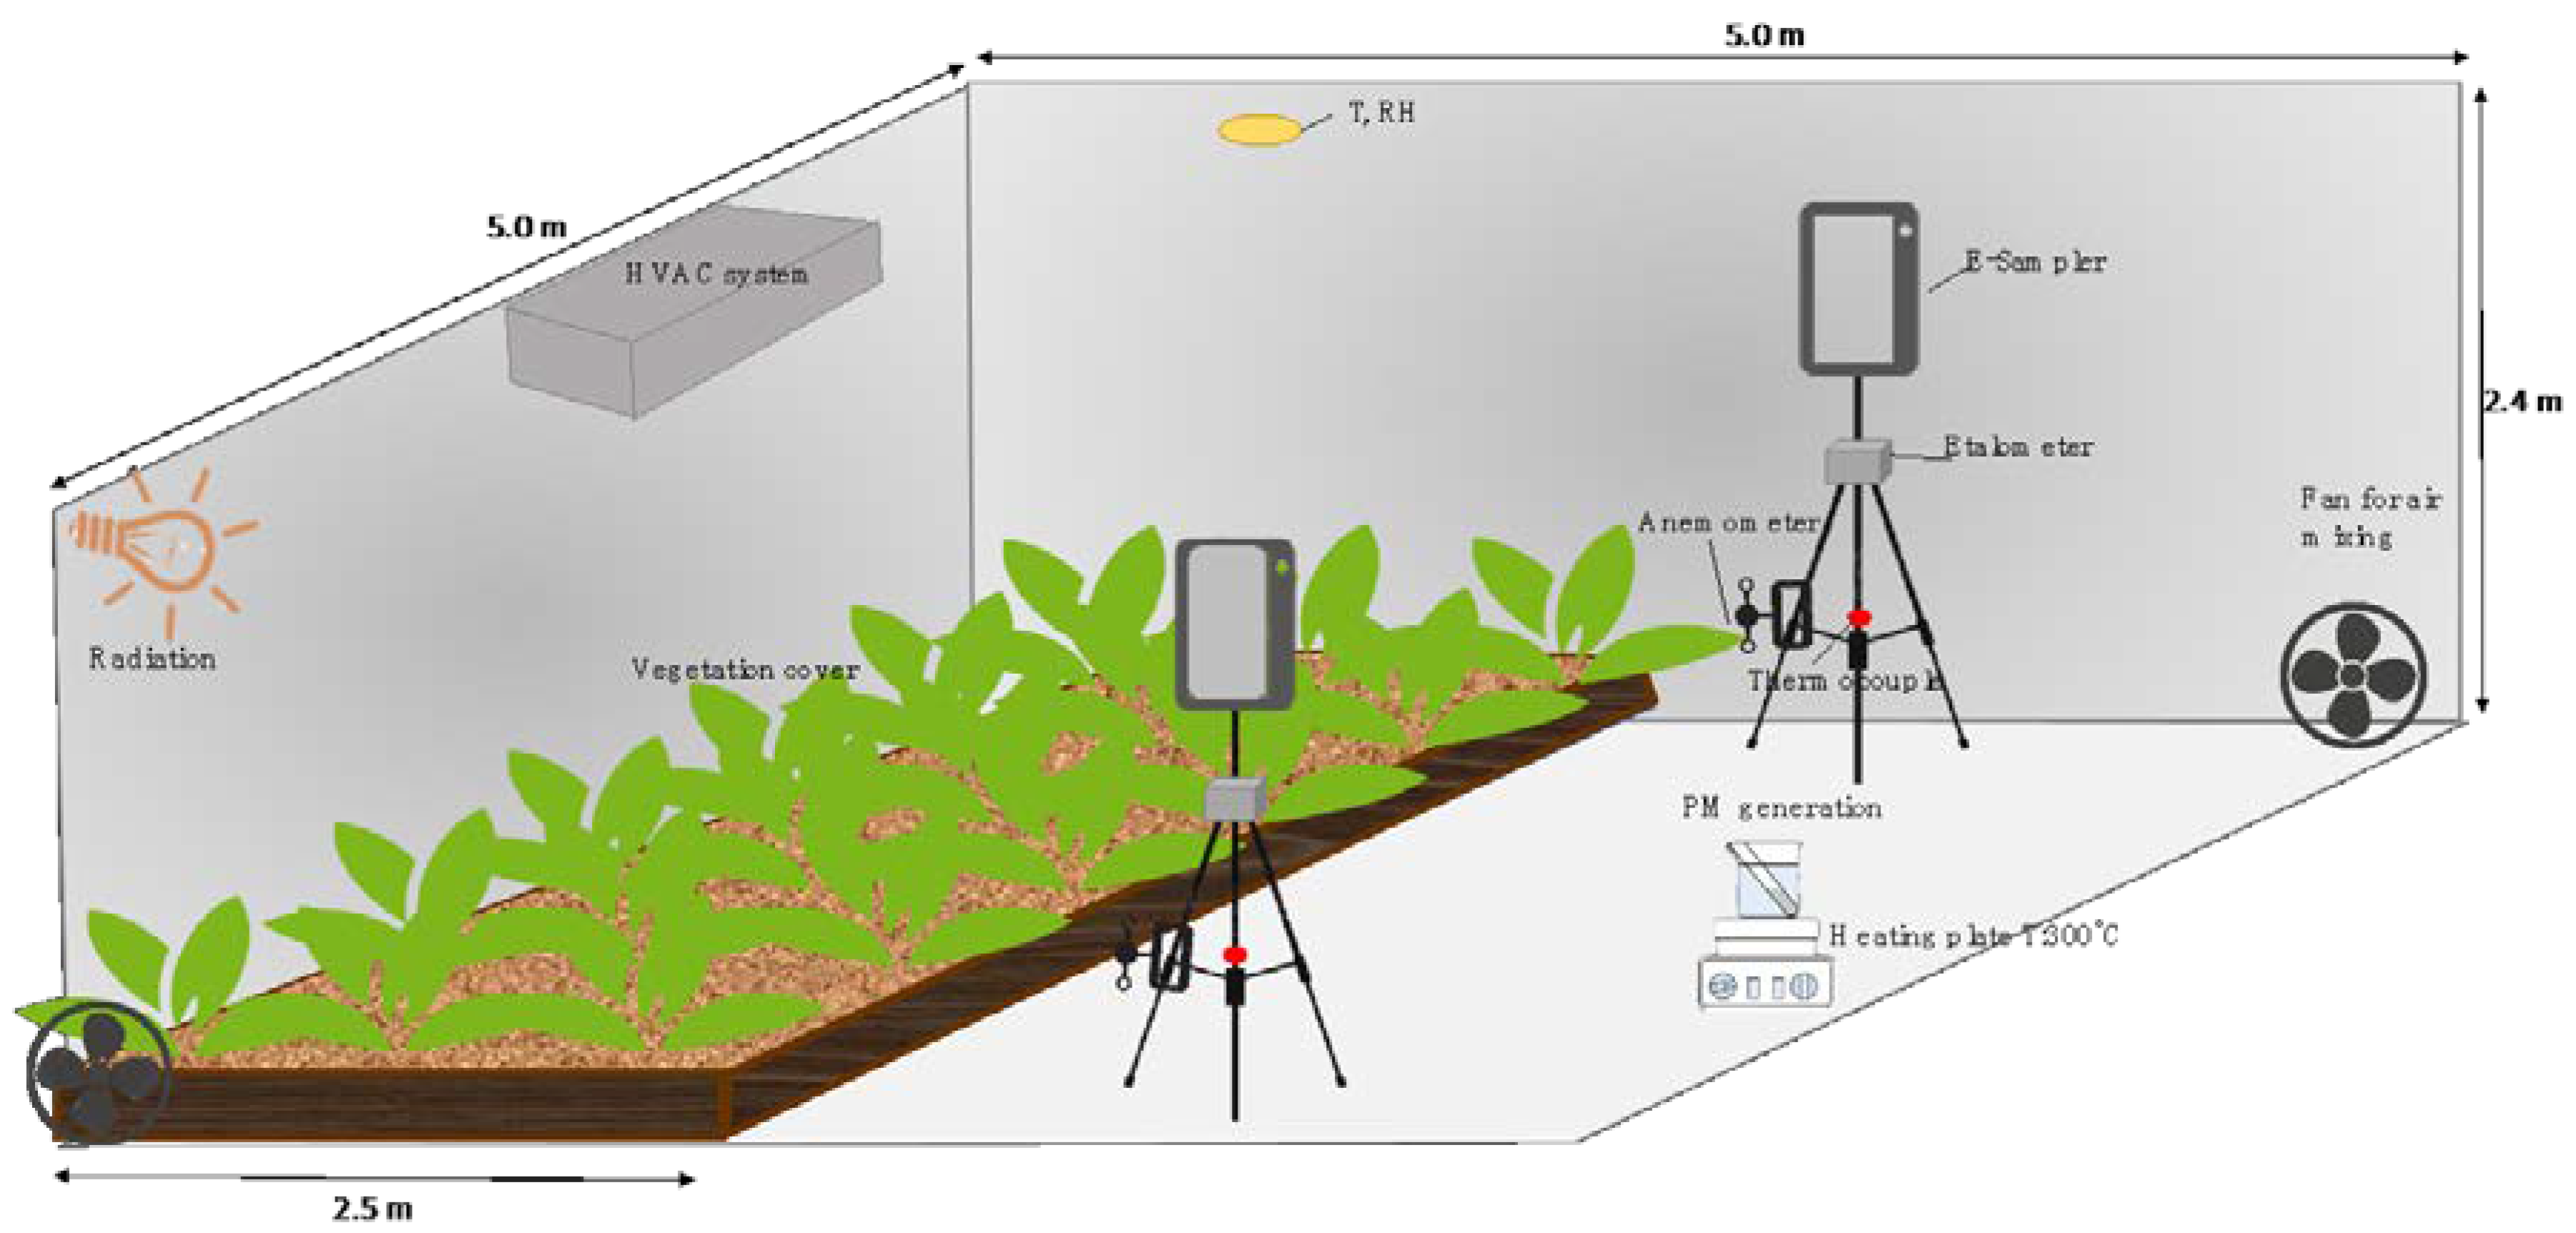
2.2. Experimental Site and Setup

To estimate the dry deposition of PM of each species studied, experiments were performed in a room under controlled environmental conditions. The room is part of the Laboratory of Vegetative Infrastructure of Buildings (LIVE for its acronym in Spanish) at the Pontificia Universidad Católica de Chile. The room has a volume and floor area of 60 m3 and 25 m2, respectively, and a very low infiltration rate (0.3 ach @ 4 Pa). While the room temperature and air humidity were controlled at 20 °C and 50%, respectively, by means of an air heating and cooling system, the air speed was 0.4 m·s−1. The environment was monitored in the presence of each type of vegetation separately. In order to simulate the presence of vegetation cover inside the module, a surface of 5 m2 of mockups was installed on the test room floor. The nine species were analyzed in horizontal position considering that in this condition, the height does not influence the PM deposition according to the findings of Ottelé et al. [7].
The plants were obtained from different nurseries around Santiago of Chile (33.44 S, 70.67 W); they were planted in mockups of 0.5 × 0.5 m2 and 0.2 m of substrate thickness at LIVE under outdoor conditions. Thus, they were maintained at optimum conditions from January through May 2017. The substrate used was composed of humus, vegetal soil and perlite [16,35]. Due to the requirement of Photosynthetically Active Radiation by the vegetation, 2.5 kWh·m−2·day−1 of radiation was generated inside the test room. Before starting each test, the leaves were washed by spraying distilled water to remove the previously adhered PM that could exist.
The room air was subjected to forced convection with the use of two fans to achieve a well-mixed indoor air. Then, indoor PM was generated by clean combustion (without fire) of 0.34 g of incense for 40 min using a heating plate at 300 °C. Once the combustion was finished, the decay curve of the concentration of PM10 and PM2.5 in the room was monitored for 3 h. The maximum concentration levels of PM10 and PM2.5 reached inside the test room were 140.3 μg·m−3 and 139.2 μg·m−3, respectively, similar to those that happen in air pollution episode during the winter season in Santiago of Chile [36].
During the experiment, indoor concentrations of PM10 and PM2.5 were monitored with two Air Quality Particulate Monitors (E-Sampler, Met One, Grants Pass, OR, USA); air temperature and relative humidity were measured with one meter HMP60 (Vaisala, Grants Pass, OR, USA); and air speed above the canopy level was monitored with two Davis cup anemometers. Figure 2 shows the experimental setup of the test room. The concentrations of PM were measured as 30 s averages. To measure the PM deposited, two runs of the test were carried out; for each run, three random leaf samples of 150 cm2 each were taken for each species (n = 6) to be processed later with the washing method described in Section 2.3.
Moreover, an additional test without vegetation in the test room was carried out. Since the experiments with and without vegetation run under the same conditions, comparing the PM concentration decay curve with and without vegetation estimates the impact of vegetation on PM concentration.

2.3. Experimental Method to Quantify the Dry Deposition of PM

The experimental method to quantify the dry deposition of PM of GRs and LWs vegetation species was based on the methodology developed by Dzierżanowski et al. [11], which was adapted and updated in this research. After exposing GRs and LWs species to the laboratory conditions described in Section 2.2, samples were processed for the quantification of PM deposited. Initially, three random leaf samples of 150 cm2 each were obtained for each test. Leaves were packaged in sealed bags and transported to a Laboratory of the Faculty of Chemistry at Pontificia Universidad Católica de Chile, were the leaf samples and filters are processed inside of a laminar flow chamber (Labwit, model Cat. ZHJH-C1112, Melbourne, Australia) to prevent dust contamination. Sampled leaves were washed with 250 mL deionized water for 5 min and shaken for 1 min with a vortex stirrer (3000 rpm). The resulting extract was filtered using a N°200 metal screen, and then vacuum filtered with 10 μm, 2.5 μm, and 0.2 μm pore size filters using Wahtman filter papers grade 91 and grade 42 (Merck, Ñuñoa, Chile) and ester cellulose filters 0.22 μm (Merck, Chile), respectively. Therefore, three particles size fractions were obtained in each case: large (10–74 μm, coarse (2.5–10 μm), and fine (0.2–2.5 μm). Clean filters were pre-weighed in a microbalance of 1 μg resolution (Sartorius, model Cubis-DF LSM011, Gottingen, Germany) after being dried for 60 min at 40 °C and then kept in a desiccator to attain room temperature. The same protocol was used to weigh the mass of each PM size fraction in each filter after the filtration stage.
For the quantification of PM deposited on the leaves’ wax, samples were washed with 150 mL of chloroform, shaken for 40 s with a vortex stirrer (3000 rpm) and filtered using the same filtration procedure as above, but using 0.2 μm PTFE filters (Sartouris, Göttingen, Germany), obtaining particles between 0.2 μm and 74 μm. Finally, PTFE filters were weighed after 60 min of drying at 40 °C. Since dry deposition of PM is usually expressed per surface of the sampled leaves, pictures of the leaf samples were processed with an image processing software (Photoshop®) to determine their surface.

2.4. Quantification of PM Dry Deposition

To estimate PM dry deposition, weights of the filters before and after the filtration process were used, thus the quantity of PM of each sample retained for each PM size fraction, W P M (μg), was determined by difference of weighs in each sample as follows:
W P M = W f W i
where, W f is the final weight after filtering (μg); and W i is the initial weight of filters (μg). Results are reported as PM2.5, PM10, and PM in the leaves’ wax. The first correspond to fine particles, the second is the sum of fine and course particles, and the third stands for all size particles captured in the leaf wax.
To have an indicator of PM dry deposition, the results are expressed as a function of leaf surfaces and time of exposure to PM as follows:
P M d d = W P M × S d d 1 × t 1
where, P M d d is the dry deposition of PM on the leaf surfaces per hour (μg·cm−2·h−1); S d d is the surface of leaves where PM is deposited (cm2); and t is the time during PM dry deposition occurs (h).
To calculate the total PM dry deposition, the sum of coarse, fine, and wax PM was averaged for each species and sample. Data were subjected to one-way analysis of variance ANOVA after the normality testing of data using the Shapiro–Wilk Test, which is appropriate for small samples. The significance of differences between mean values was tested using Tukey’s Test and a value p < 0.05 was considered significant. The tests were carried out using Microsoft Excel (Microsoft Corp., Redmond, DC, USA). To indicate the variability in the measurements, bar charts show means ± the standard error (SE) with n = 6.

3. Results and Analysis

The results presented in this study are relevant for the mitigation of air pollution in cities of central Chile with serious air pollution levels. Although the vegetation considered in this study has shown good biophysical performance under semiarid climate conditions [31], it presents the challenges of balancing maintenance and irrigation requirements and the ability of capturing PM without affecting photosynthesis and transpiration rates [37]. This section shows the results and analysis of PM deposited on the surface of the leaves according to the methodology described above. Also, this section compares the decay curves of the PM concentration with and without vegetation to evidence the impact generated by vegetation on removing PM.

3.1. Dry Deposition of PM of GR and LW Species

Figure 3 and Figure 4 show dry deposition of PM2.5 and PM10, respectively, while Figure 5 displays PM captured in the wax of the leaves. Shown results in these figures correspond to the mean value and the bars show the standard error (SE). Bars marked with different letters (a, ab, b) stand for groups with significantly different results (p < 0.05).
Dry deposited PM2.5 ranged from 0.09 μg·cm−2∙h−1 for S. spurium p. to 1.32 μg·cm−2∙h−1 for S. album. Figure 3 shows three groups of species with high (a), medium (ab), and low capture (b) of PM. The first group (a) is composed only by S. Album; the second group (ab) consists of S. reflexum, L. spectabilis, S. palmeri, and L. angustifolia (ab); and finally, A. cordiflora, P. tobira, E. karvinskianus, and S. Spurium p. conform group (b).
Dry deposition of PM10 varied between 0.48 μg·cm−2∙h−1 and 4.70 μg·cm−2∙h−1 for P. tobira and L. spectabillis, respectively (Figure 4). For PM2.5, three groups of species show significant differences of PM2,5 dry deposition. L. spectabilis and S. Album are part of group (a). The dry deposition values of PM10 are higher than those found in the literature for the same or similar species. For example, Speak et al. [12] reported values of 0.88 and 0.12 μg·cm−2·day−1 for F. rubra and S. album, respectively. Values of this study and our study are not directly comparable because testing conditions and measurement technologies are different. For example, Speak et al. [12] exposed GR vegetation to outdoor conditions in a roof of the city of Manchester (UK), while our study correspond to higher indoor concentrations under very well controlled experimental conditions. On the other hand, Speak et al. [12] estimated the capture of PM using a scanning electron microscopy, whereas our research used the gravimetric method.
Regarding PM dry deposition on the leaves’ wax, values vary between 0.41 μg·cm−2∙h−1 for P. tobira and 25.62 μg·cm−2∙h−1 for S. album (Figure 5). These values are higher than others reported for outdoor conditions (8.7–45.2 μg·cm−2∙month−1 for H. helix [11]). Once again, three species groups have high, medium and low PM capture potential.
It is noteworthy that most species consistently show the same relative level (high, medium, low) of dry deposition for PM2.5. PM10 and PM in wax. S. album shows the highest PM dry deposition (group a), S. reflexum, and S. palmeri show medium level (group ab) and P. tobira, E. karvinskianus, and S. Spurium p. show the lowest potential to capture PM (group b). This fact is crucial to choose the most appropriate GR and LW vegetation species for mitigating air pollution because of their effectiveness to remove different sizes of PM.
Table 3 presents the total amount of PM deposited on the species of GRs and LWs, which corresponds to the average of total PM calculated for each sample. The large variation among the experimental results obtained in this study highlights the need of evaluating PM dry deposition potential across GR and LW species. Our results show 52% of the PM deposited on the leaves were particles fixed in wax. For the case of S. album, this value was 84%, being the most efficient species studied. This percentage is comparable to the PM captured by wax in trees reported by [11,38], which was up to 83%. Leaf wax captures larger amounts of PM than that just deposited on the leaves. Moreover, deposited PM on the leaves can be resuspended [6] by turbulence and stronger winds and might be washed by rain. Nevertheless, PM deposited on wax ends being captured by the leaves.
Figure 5 shows that leaf wax is far more efficient in capturing PM than the PM merely deposited on the leaves’ surface but not attached to wax—quantified by washing leaves with water; the latter is likely the inorganic PM fraction, like suspended soil dust, for instance. In other words, the organic fraction of PM is more efficiently captured by leaves’ wax. However, the methodology used in this research does not allow us to distinguish if the PM captured in the wax is fine or coarse neither its chemical speciation. Similarly, it was not possible to quantify the soluble particulate material in water and in chloroform, which is considered an important fraction of ultrafine particles [10,11]. In this study, the potential of vegetation simulating critical air quality conditions was analyzed in an environmental chamber; therefore, our results could be compared with tests under real environmental conditions in future research.

3.2. Effects of Vegetation on PM Concentration

Figure 6 compares the decay curves of the PM2.5 and PM10 concentrations in the test room with and without vegetation under laboratory conditions for three species. S. Album is the species that shows the highest PM dry deposition by the leaf washing/gravimetric method (Figure 6a,b), L. angustifolia shows the intermedium values (Figure 6c,d) while S. spurium p. presented the lowest levels of PM dry deposition using the same method (Figure 6e,f). The difference between the decay curves with and without vegetation (grey zone) reflects the impact of vegetation on reducing the concentration of PM in the environment.
Comparing the decay curves of PM, the impact of vegetation on the PM concentrations is significant. The tests with vegetation show lower PM peaks and decay curves for all GR and LW vegetation species tested (some are not shown here due to manuscript length limitations). A similar effect was found by Papaioannou [13], who reported a decrease of 27.7% of the total ultrafine particles by monitoring the concentration of PM with vegetation for LWs installed in an environmental chamber. Moreover, the decay curves of PM showed that for all cases, the deposition of particles inside the room increased with the presence of vegetation and indicates that some species perform better than others in terms of PM removed from the environment. In this case, S. Album is more effective in lowering PM2.5 and PM10 than L. angustifolia and S. spurium p.
The difference in the results of deposited PM among species can be caused by variations of environmental factors [7], leaf surface [39,40], and leaf anatomical traits. Considering that the vegetation was subjected to the same environmental conditions (e.g.: air temperature, relative humidity and speed, PM concentrations), these factors do not influence the results. Although some findings in trees relate the differences in PM deposition among species with the leaf surface [39,40], such relationship was not found in this study. However, the state-of-the-art shows that smaller leaves have a greater potential for PM capture [41,42]. This effect is known as edge effect, which is greater in smaller leaves due to their high perimeter/surface area ratio [43]. In our research, species with smaller leaves (e.g.: S. album, L. spectabilis, S. reflexum) were found to have the highest PM dry deposition. Moreover, the differences in deposited PM found among species are also probably related to the differences of leaves anatomical traits among species, such as the presence of trichomes and hair, leaf roughness, and stomata number and size. In fact, the literature review shows that a higher leaf roughness and the presence of hair and trichomes increase the PM capture potential of trees [6,39,40] and GR/LW vegetation [7,12,26,44]. Although this paper is not focused on evaluating the effect of these leaf anatomical characteristics on PM capture potential, some not conclusive evidence about this effect was obtained from scanning electron microscope (SEM) images. S. album has high leaf roughness (Figure 7a), the presence of trichomes and the highest values of PM dry deposition (group a). On the other hand, P. tobira has very smooth leaves (Figure 7b), lack of trichomes, and very low PM dry deposition (group b).

3.3. Other Performance Aspects to Be Considered

Regarding the selection of a species to be installed in a GR or LW, it is necessary to consider other criteria such as irrigation and maintenance requirements, as well as the resistance to drought and lower temperatures, which are performance aspects of GRs and LWs that strongly influences the survival of the vegetation used [32]. For instance, E. karvinskianus and A. cordiflora presented leaf deterioration after the tests and under low temperatures, unlike the other species that were tested under the same environmental conditions. Therefore, it is important to balance the potential of PM capture with other performance parameters to choose the most proper species to mitigate urban air pollution. For instance, fine PM can enter through stomata [6] and affect photosynthesis, which can also deteriorate the plant [37,45].

4. Conclusions

GRs and LWs are claimed to cause several benefits to buildings and urban areas such as building energy efficiency, stormwater runoff management, and biodiversity, among others. As consequence, several countries and cities have developed public policies to regulate and motivate the implementation of these envelope technologies in buildings. However, improving urban air quality has triggered few country/city regulations to promote GRs and LWs. This might be a result of the very few available studies about the impact of GRs and LWs on urban air pollution. Several cities in central Chile suffer severe air pollution problems in winter season, thus GRs and LWs can contribute to mitigate it. Therefore, the main objective of this paper was to quantify the dry deposition of PM (PM2.5, PM10 and wax) of several vegetation species commonly used in LWs and GRs in semiarid climates. To accomplish this objective, an experimental method was implemented to evaluate the dry deposition of PM of nine species (P. tobira, L. angustifolia, L. spectabillis, S. album, and S. reflexum for GR and A. cordiflora, E. karvinskianus, S. palmeri, and S. spurium p. for LW), which are the most used in semiarid climates of Central Chile. The main conclusions of this paper are:
-
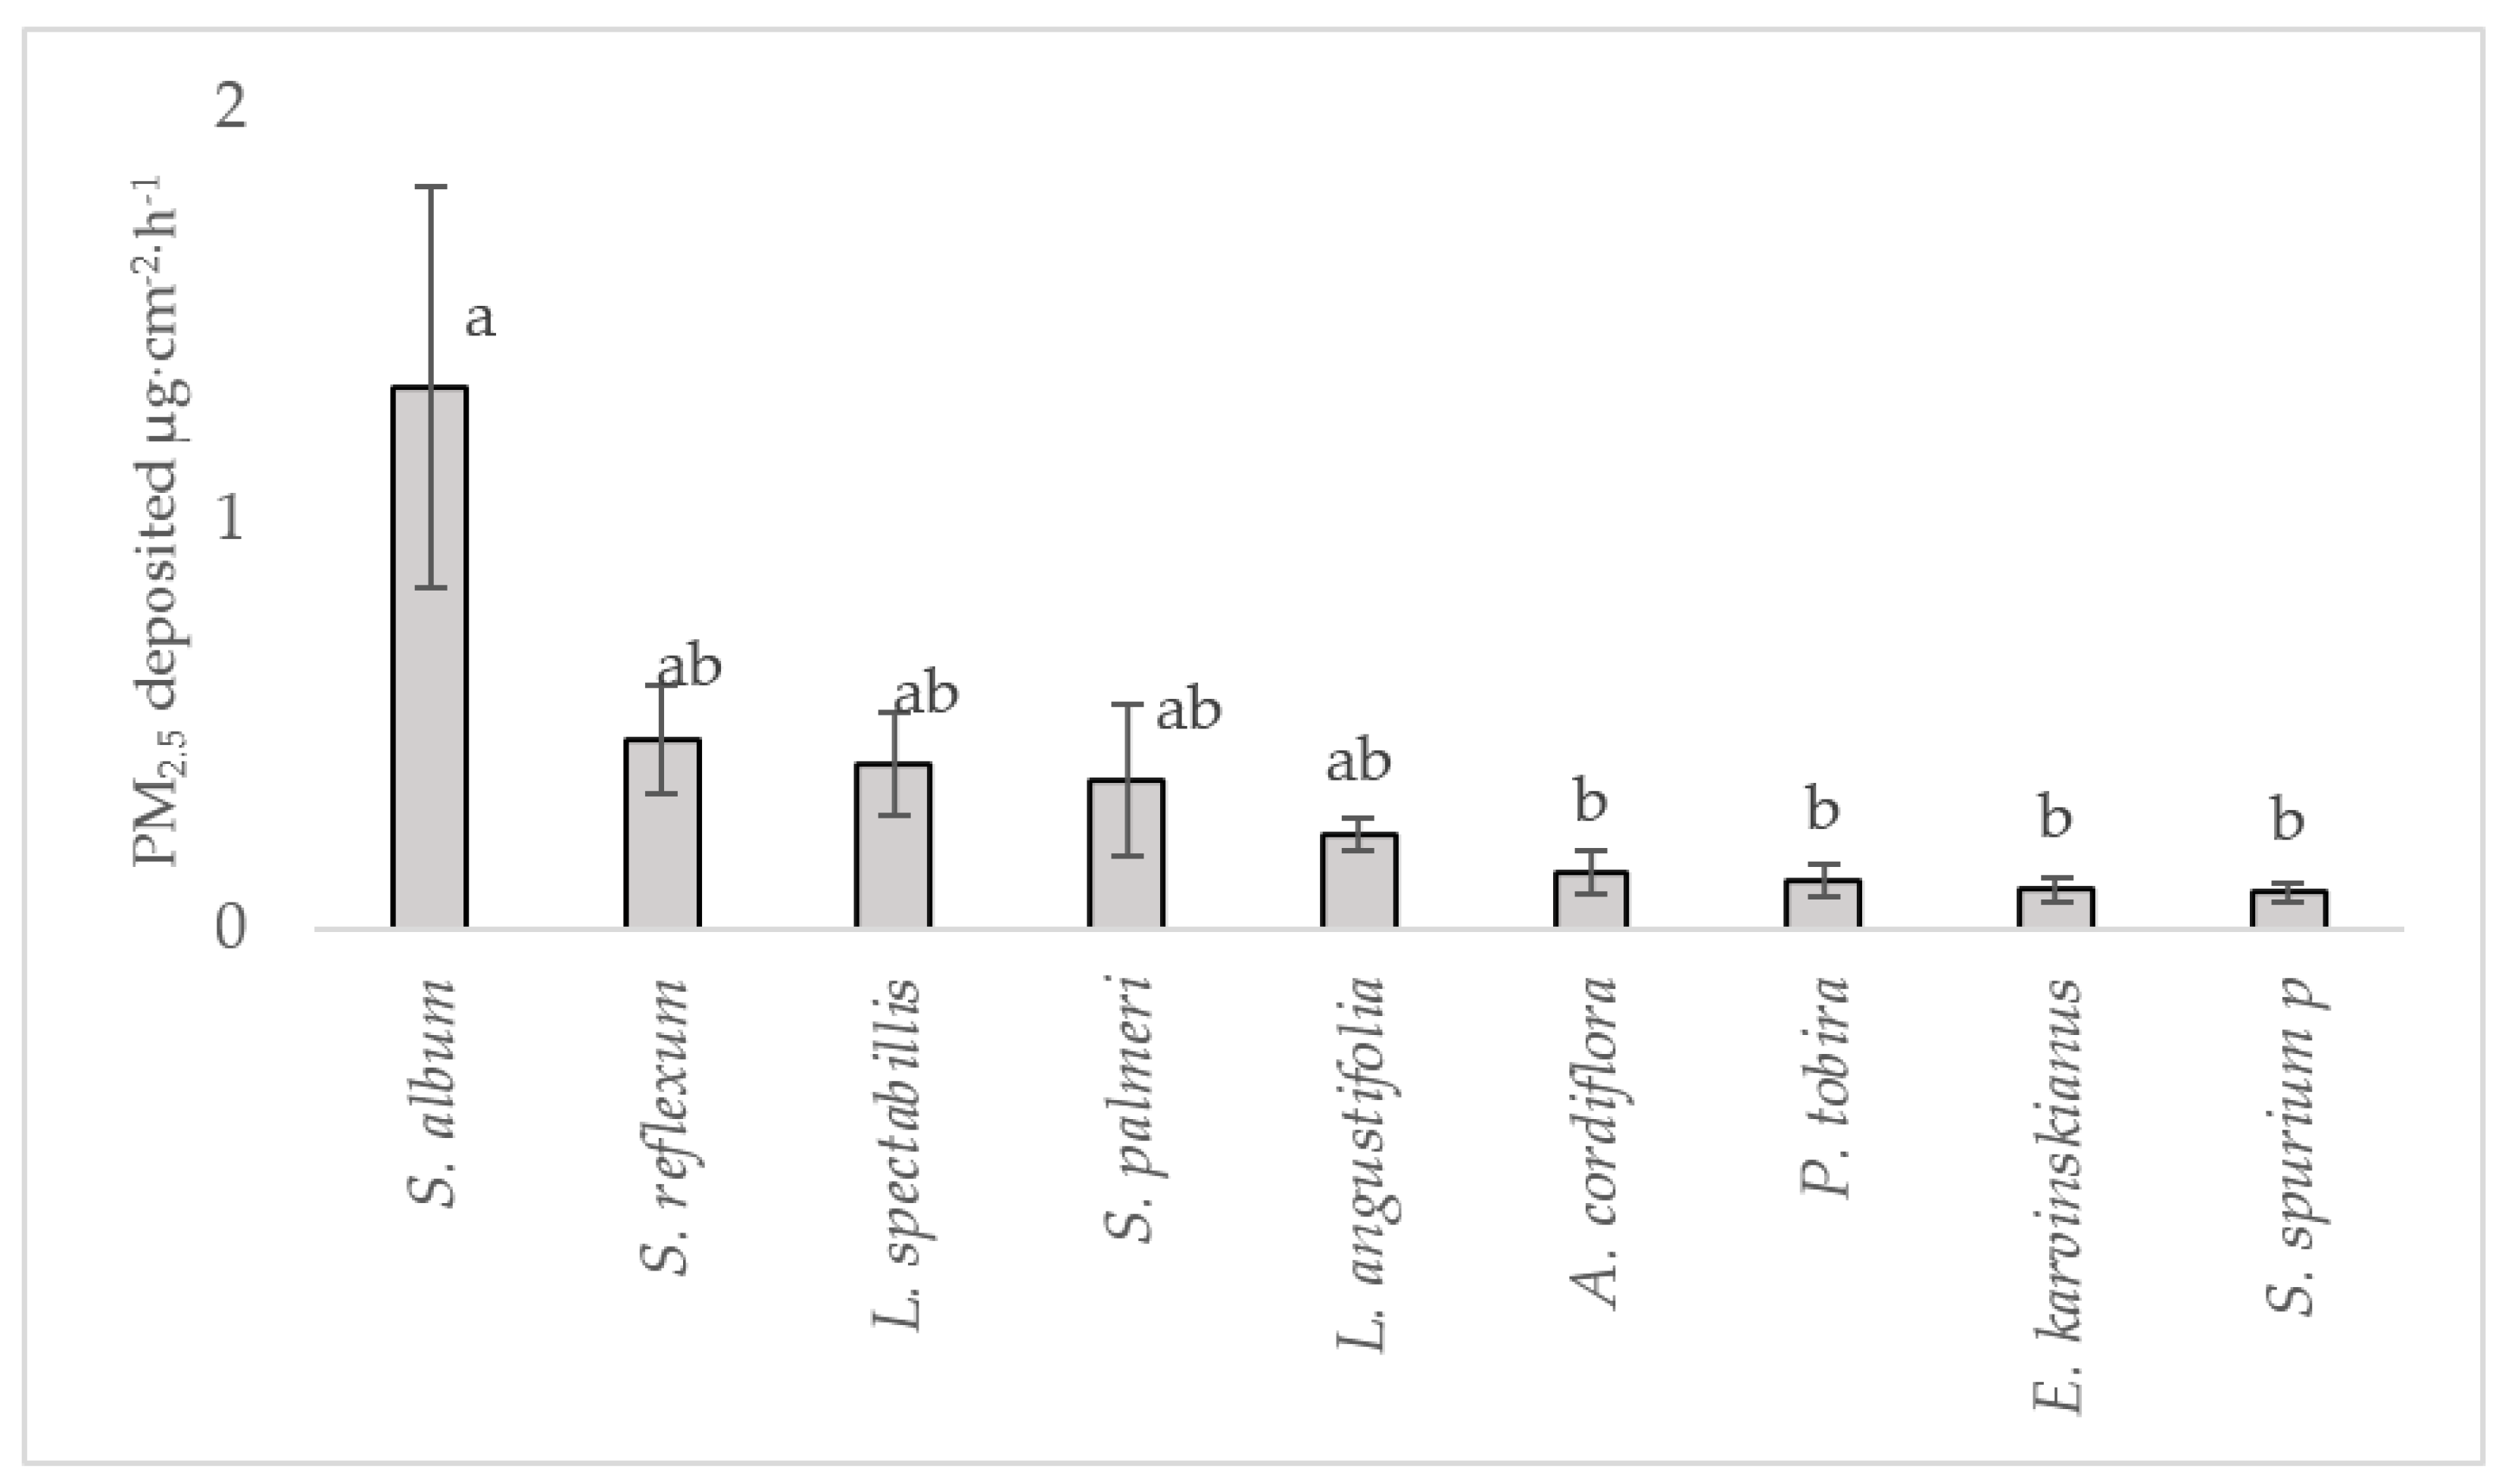
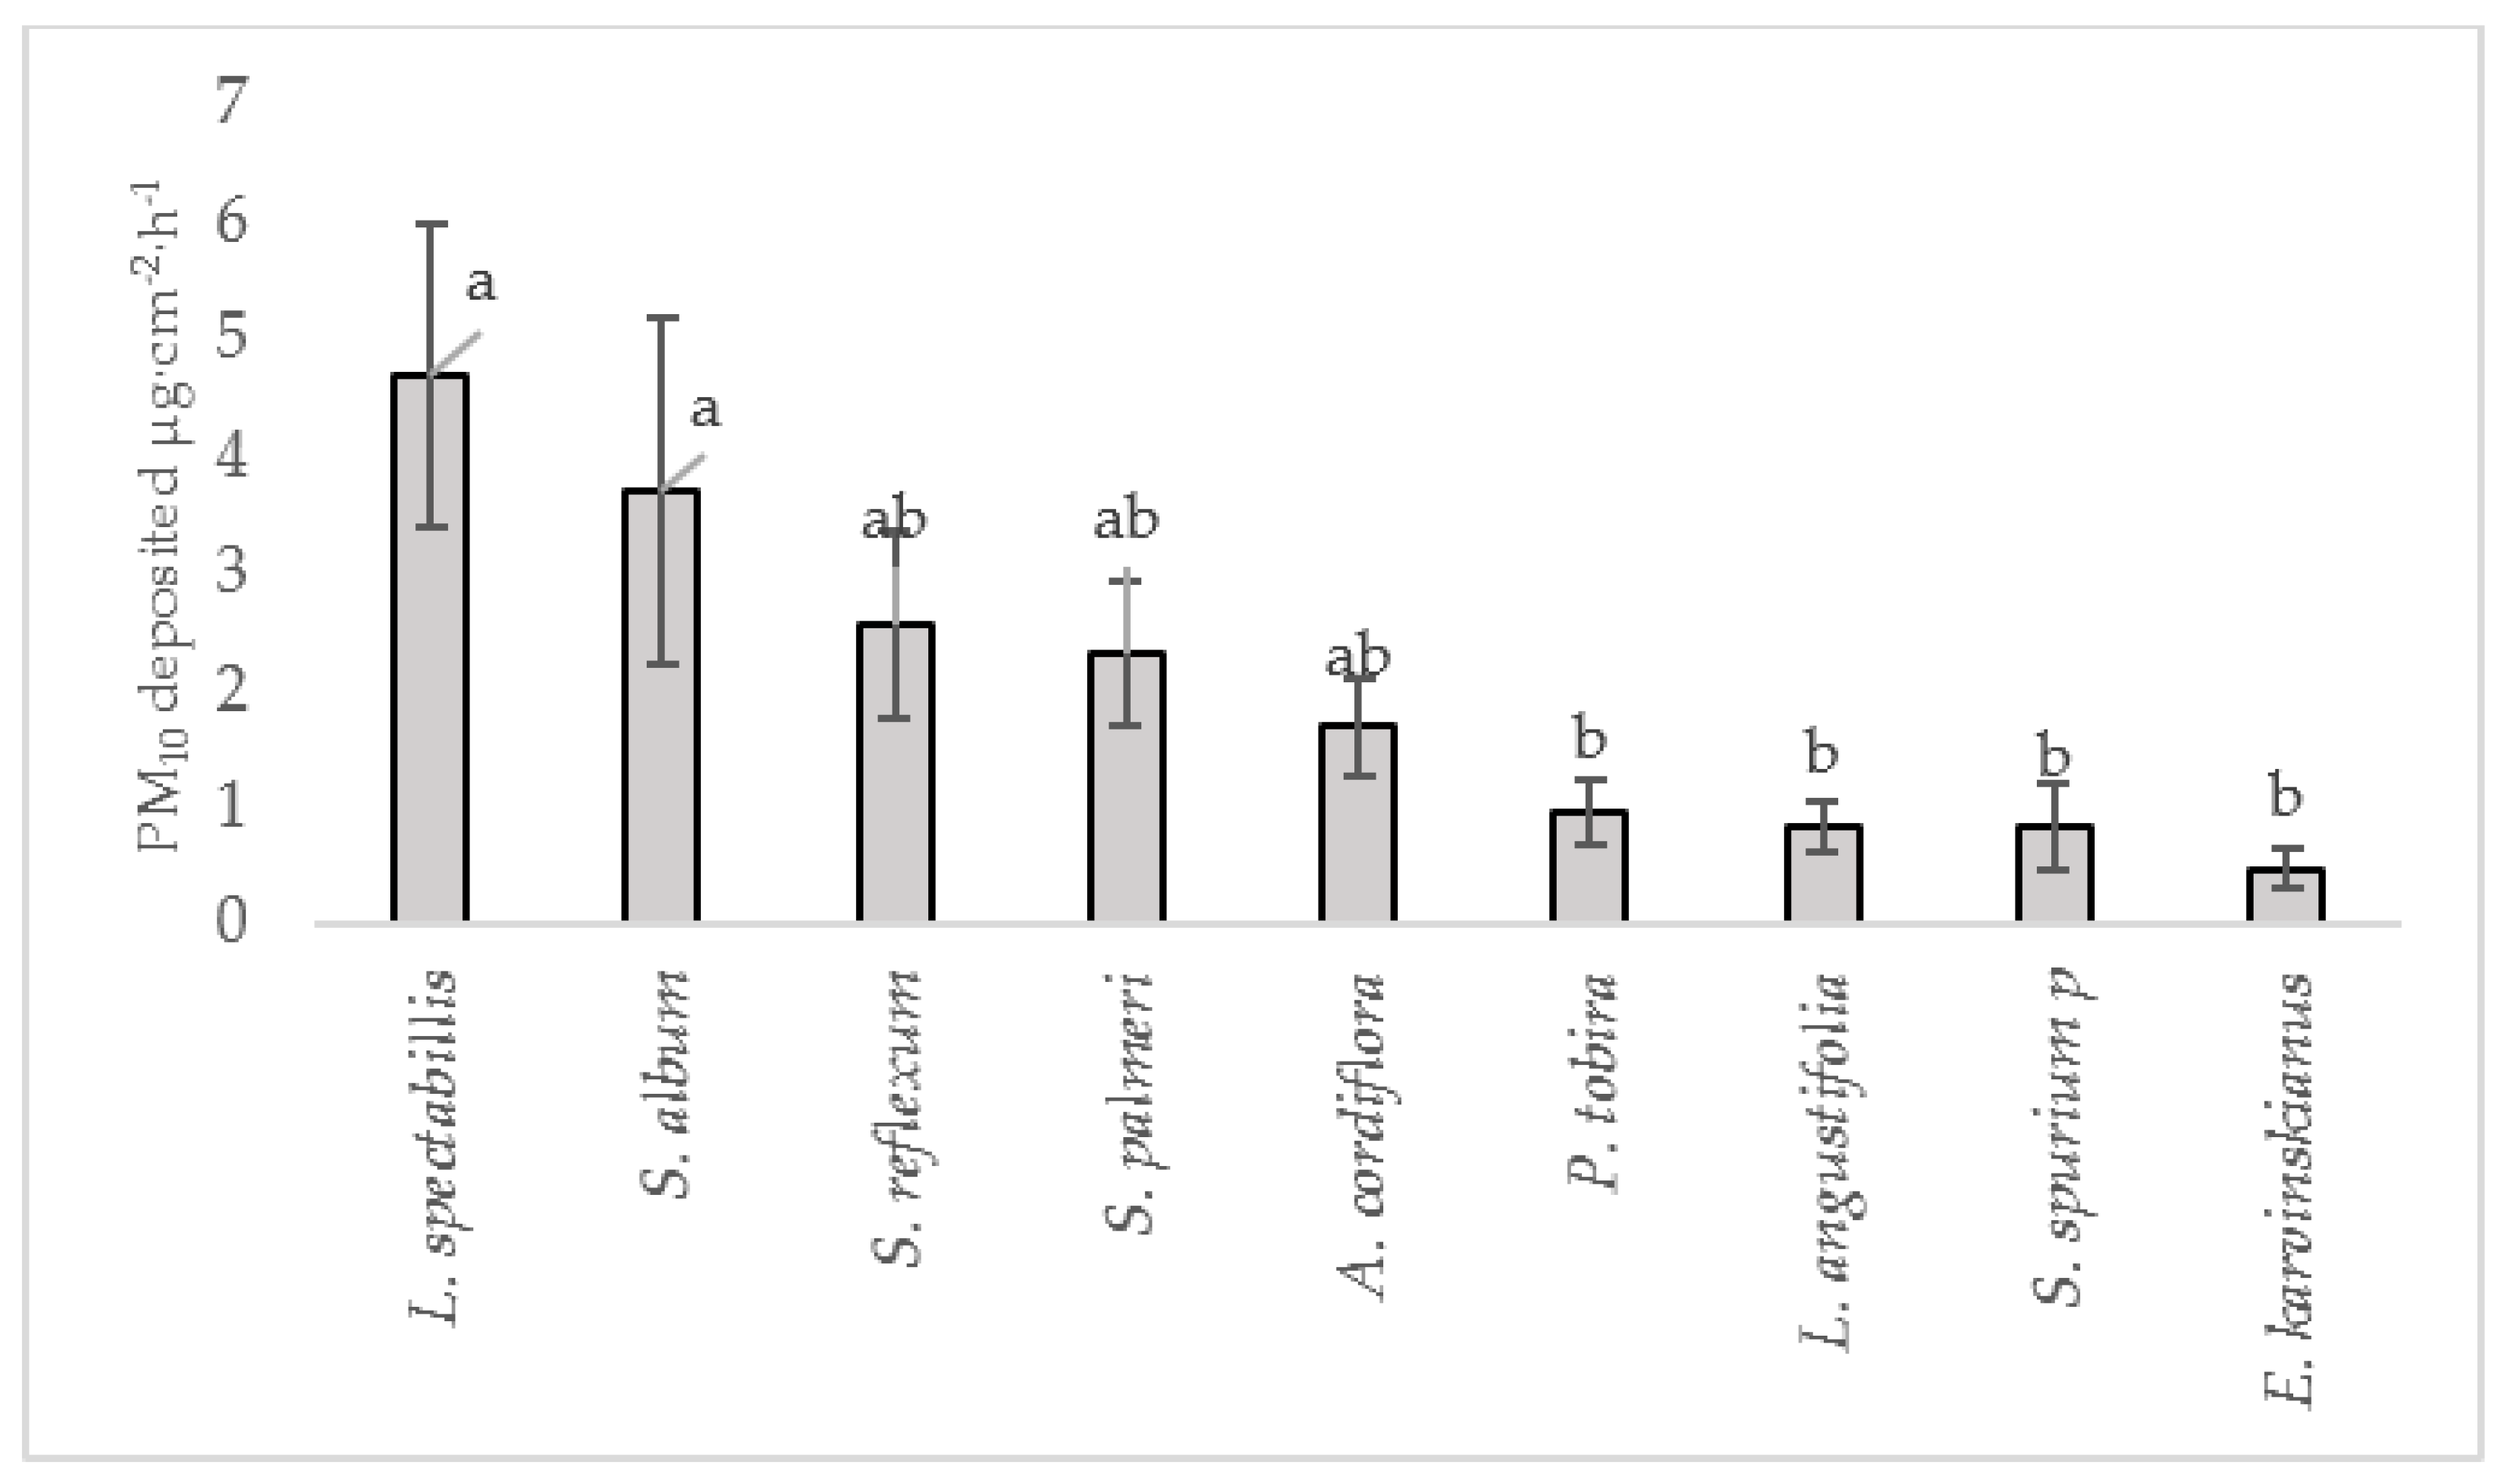
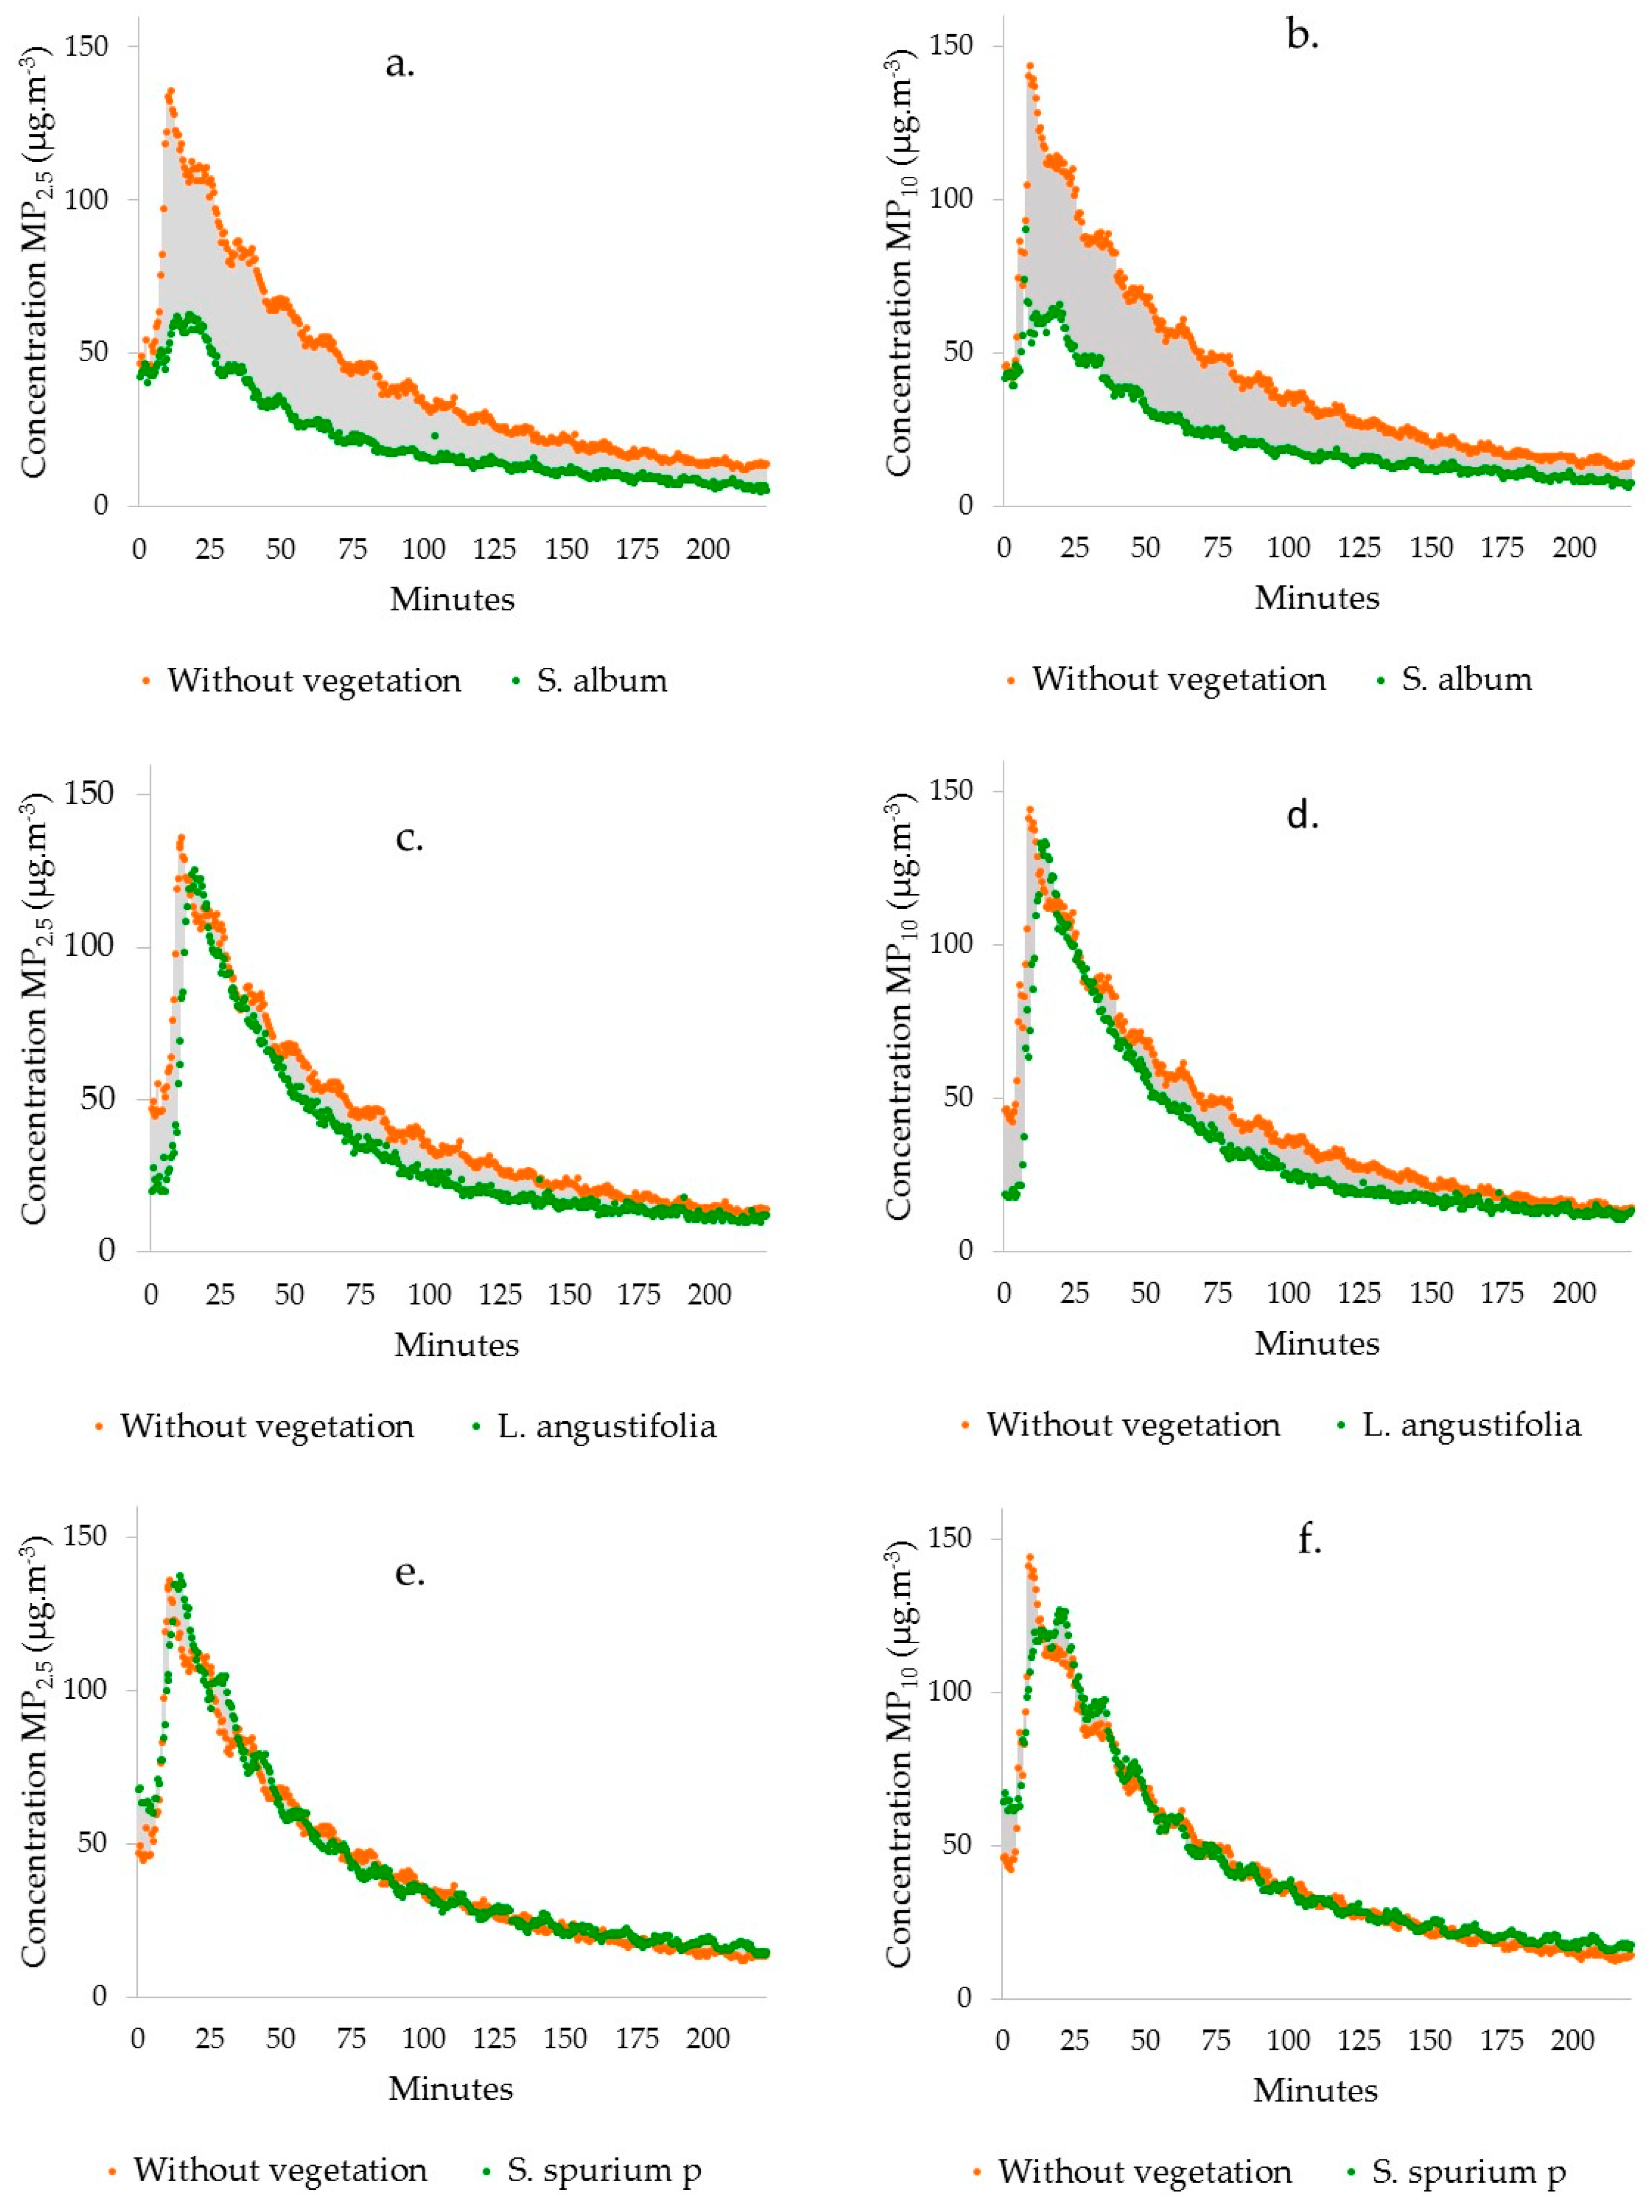
Vegetation of GRs and LWs can significantly reduce the peak and concentrations of PM2.5 and PM10. S. album and S. reflexum reduced PM2.5 peak concentration up to 45.3% and 71.4% of the peak concentrations with no vegetation, respectively. Similar results were found for PM10.
-
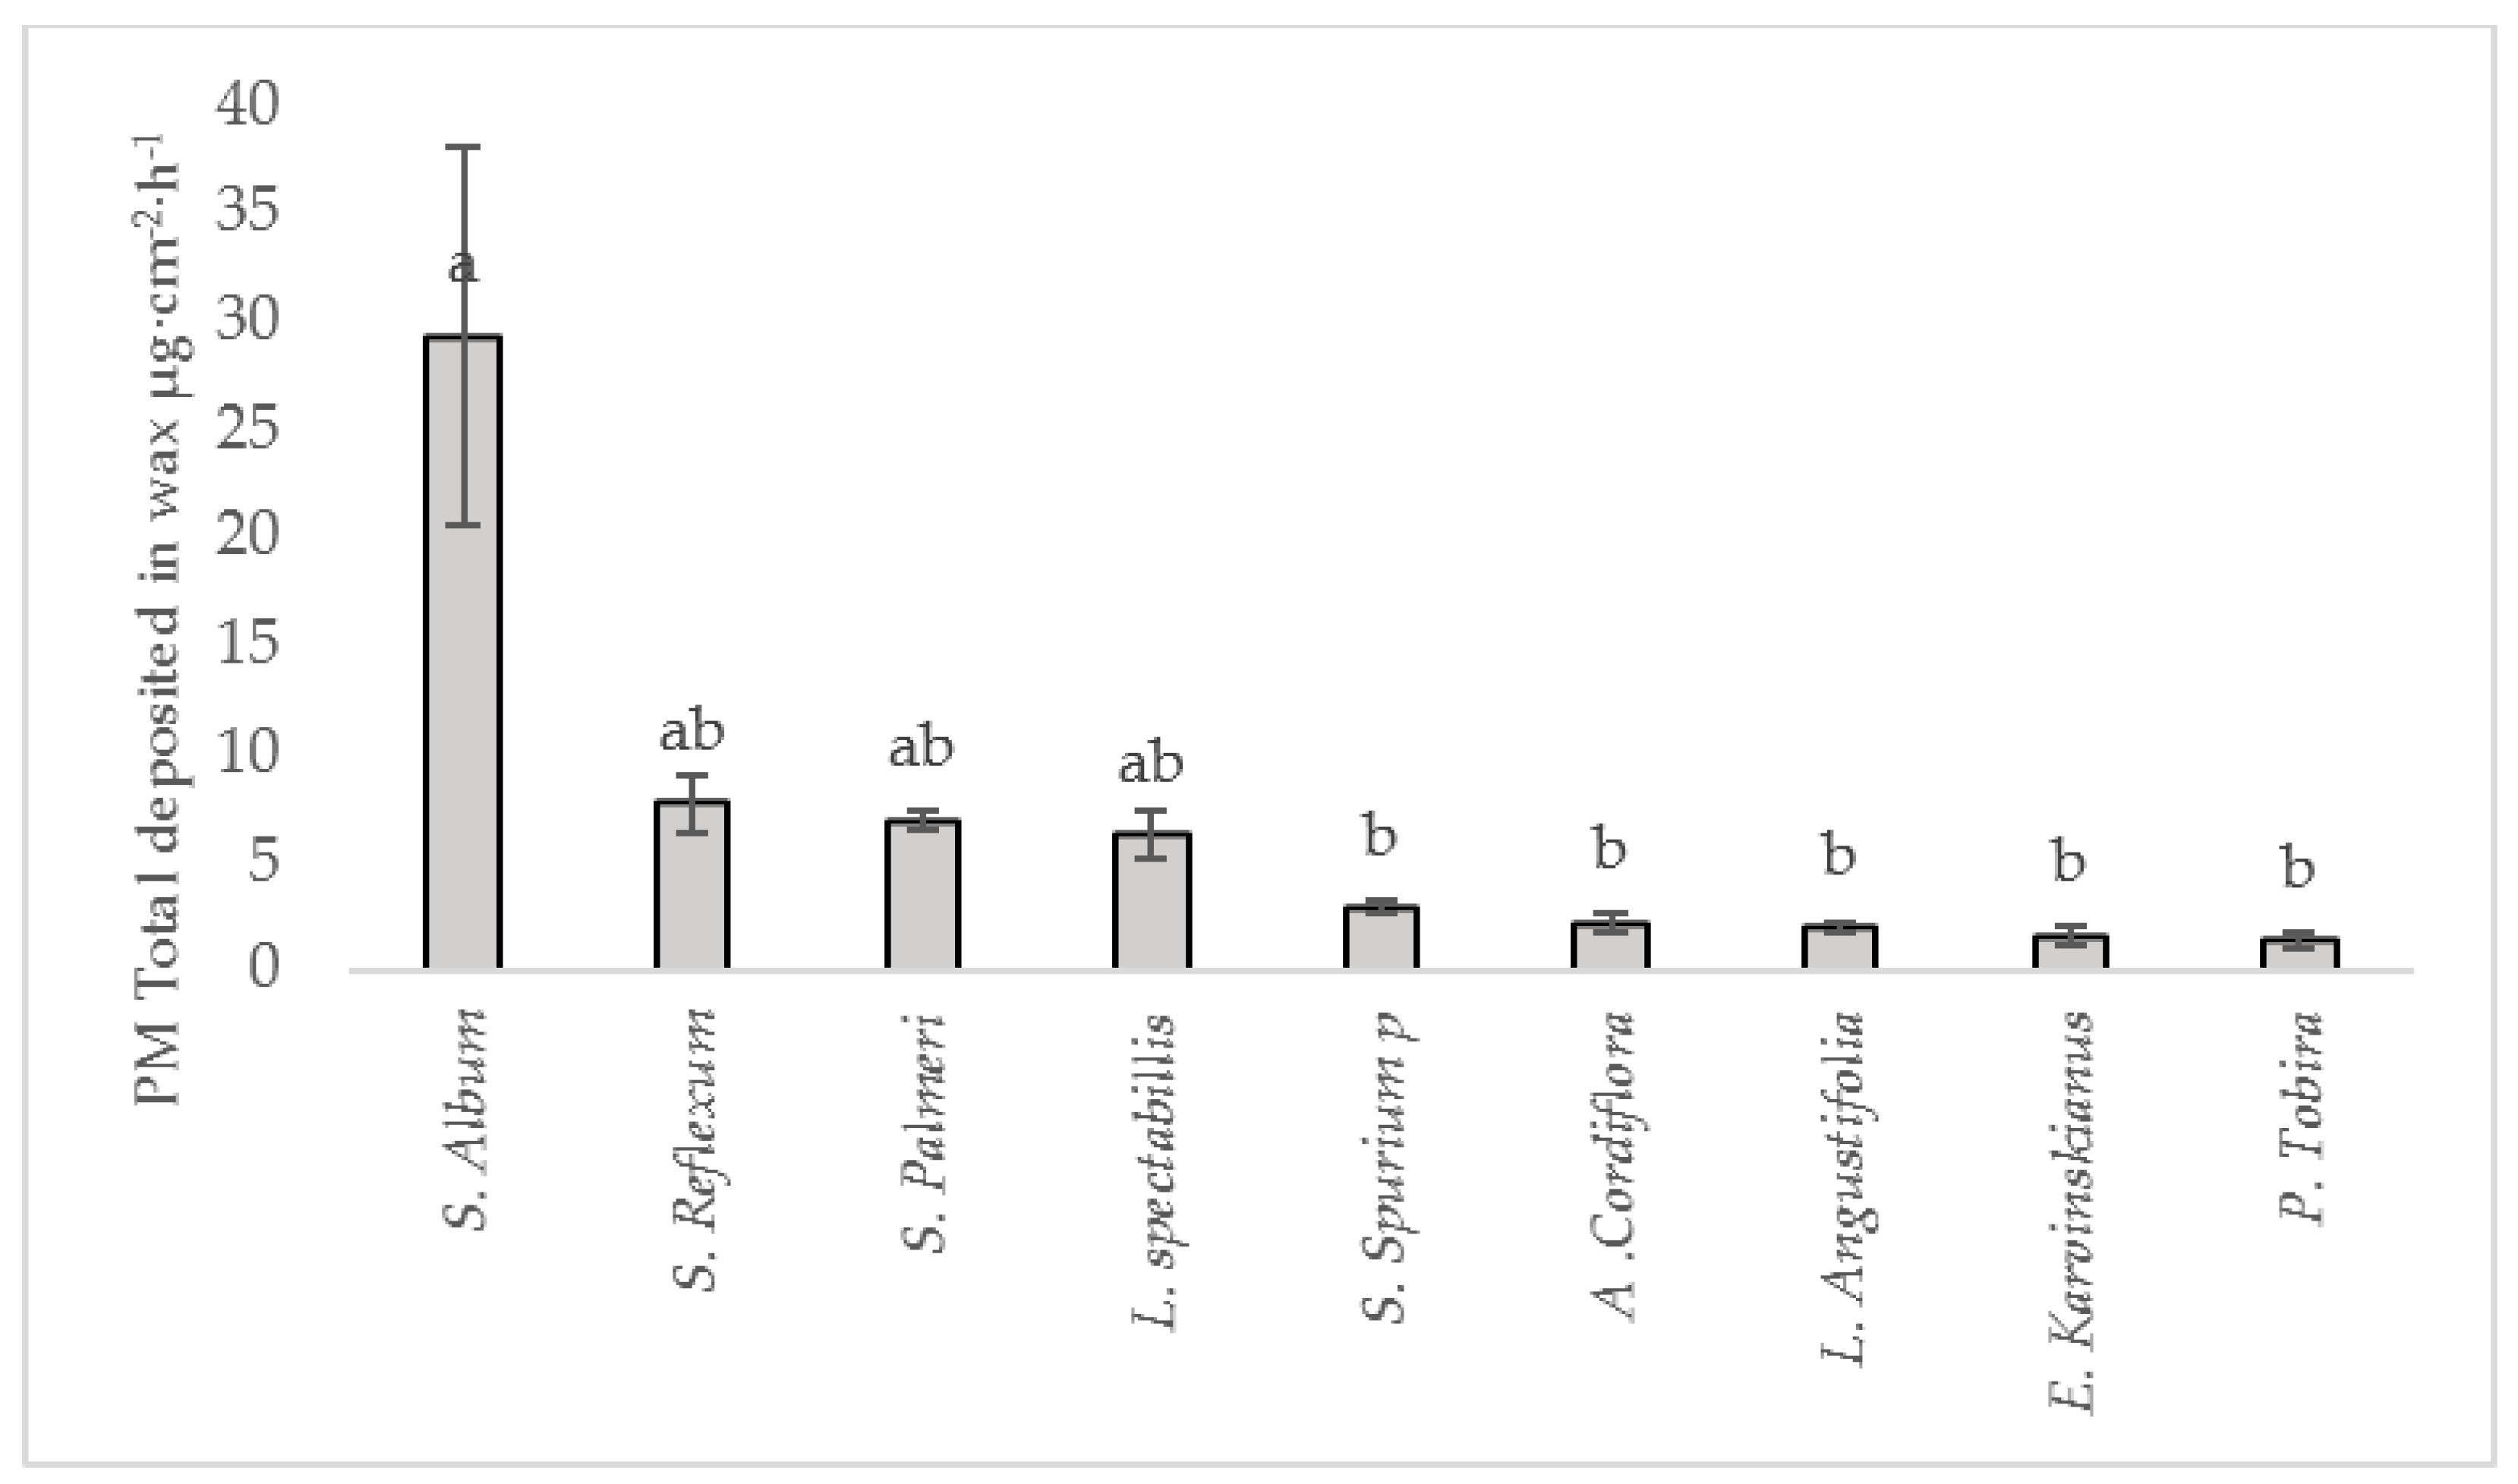
Statistically significant differences of PM dry deposition were found among the GR and LW vegetation species studied. Three distinctive groups of species with high, medium, and low potential to remove PM2.5, PM10, and PM in leaf wax were identified. S. album showed the highest total PM dry deposition (29.3 ± 8.7 µg·cm−2·h−1) while the lowest values were found for L. angustifolia, E. karvinskianus, and P. tobira.
-
It was consistently found that species show high, medium, or low dry deposition values for PM2.5, PM10, and wax. These is important because the ability of species to remove PM is not dependent of the PM size and the way (dry deposition on the leaves vs captured by leaf wax) how PM is removed from the environment. This fact simplifies the decision of policy-makers and designers about the species that can have higher impact on reducing urban air pollution.
The results of this paper demonstrate that vegetation of GRs and LWs can remove a significant amount of PM from polluted air, thus these technologies can contribute to mitigate air pollution in urban environments. Moreover, this paper illustrates that this potential of PM removal varies significantly among different vegetation species commonly used in GRs and LWs in semiarid regions. As a consequence, species of GRs and LWs need to be carefully chosen to maximize the impact of GRs and LWs on mitigating urban air pollution. Moreover, the results shown in this paper can sustain public policies that regulate and promote the implementation of these envelope technologies in buildings.

Author Contributions

M.V., H.J., and S.V. conceived and designed the experiments; M.V. performed the experiments; M.V., S.V., H.J., W.B., J.G., C.D. and E.L. analyzed the data and wrote the paper.

Funding

This research was funded by the National Commission for Science and Technological Research (CONICYT) of Chile grant numbers FONDEF ID15I10104 and CONICYT/FONDAP/15110020.

Acknowledgments

Margareth Viecco thanks the support of the National Doctoral Scholarships CONICYT 21182050 Academic Year 2018.

Conflicts of Interest

The authors declare no conflict of interest.

References

  1. MMA. Informe del Estado del Medio Ambiente 2011; Ministerio del Medio Ambiente: Santiago, Chile, 2012; p. 513.
  2. Diaz-Robles, L.A.; Fu, J.S.; Vergara-Fernandez, A.; Etcharren, P.; Schiappacasse, L.N.; Reed, G.D.; Silva, M.P. Health risks caused by short term exposure to ultrafine particles generated by residential wood combustion: A case study of Temuco, Chile. Environ. Int. 2014, 66, 174–181. [Google Scholar] [CrossRef] [PubMed]
  3. Pope, C.A.; Dockery, D.W.; Chow, J.C.; Watson, J.G.; Mauderly, J.L.; Costa, D.L.; Wyzga, R.E.; Vedal, S.; Hidy, G.M.; Altshuler, S.L.; et al. Health effects of fine particulate air pollution lines that connect. J. Air Waste Manag. Assoc. (1995) 2006, 56, 1368–1380. [Google Scholar] [CrossRef]
  4. Gulsrud, N.M.; Hertzog, K.; Shears, I. Innovative urban forestry governance in Melbourne?: Investigating “green placemaking” as a nature-based solution. Environ. Res. 2018, 161, 158–167. [Google Scholar] [CrossRef] [PubMed]
  5. Weyens, N.; Thijs, S.; Popek, R.; Witters, N.; Przybysz, A.; Espenshade, J.; Gawronska, H.; Vangronsveld, J.; Gawronski, S.W. The Role of Plant-Microbe Interactions and Their Exploitation for Phytoremediation of Air Pollutants. Int. J. Mol. Sci. 2015, 16, 25576–25604. [Google Scholar] [CrossRef] [PubMed]
  6. Song, Y.; Maher, B.A.; Li, F.; Wang, X.; Sun, X.; Zhang, H. Particulate matter deposited on leaf of five evergreen species in Beijing, China: Source identification and size distribution. Atmos. Environ. 2015, 105, 53–60. [Google Scholar] [CrossRef] [Green Version]
  7. Ottelé, M.; van Bohemen, H.D.; Fraaij, A.L.A. Quantifying the deposition of particulate matter on climber vegetation on living walls. Ecol. Eng. 2010, 36, 154–162. [Google Scholar] [CrossRef]
  8. Chen, L.; Liu, C.; Zou, R.; Yang, M.; Zhang, Z. Experimental examination of effectiveness of vegetation as bio-filter of particulate matters in the urban environment. Environ. Pollut. 2016, 208, 198–208. [Google Scholar] [CrossRef] [PubMed]
  9. Muñoz, D.; Aguilar, B.; Fuentealba, R.; Préndez, M. Environmental studies in two communes of Santiago de Chile by the analysis of magnetic properties of particulate matter deposited on leaves of roadside trees. Atmos. Environ. 2017, 152, 617–627. [Google Scholar] [CrossRef]
  10. Przybysz, A.; Saebo, A.; Hanslin, H.M.; Gawronski, S.W. Accumulation of particulate matter and trace elements on vegetation as affected by pollution level, rainfall and the passage of time. Sci. Total Environ. 2014, 481, 360–369. [Google Scholar] [CrossRef] [PubMed]
  11. Dzierzanowski, K.; Popek, R.; Gawronska, H.; Saebo, A.; Gawronski, S.W. Deposition of particulate matter of different size fractions on leaf surfaces and in waxes of urban forest species. Int. J. Phytoremediat. 2011, 13, 1037–1046. [Google Scholar] [CrossRef] [PubMed]
  12. Speak, A.F.; Rothwell, J.J.; Lindley, S.J.; Smith, C.L. Urban particulate pollution reduction by four species of green roof vegetation in a UK city. Atmos. Environ. 2012, 61, 283–293. [Google Scholar] [CrossRef]
  13. Papaioannou, I. Vegetated Facades as Environmental Control Systems Filtering Fine Particulate Matter (PM2.5) for Improving Indoor Air Quality; University of Southern California: Los Angeles, CA, USA, 2013. [Google Scholar]
  14. Stapleton, E.; Ruiz-Rudolph, P. The potential for indoor ultrafine particle reduction using vegetation under laboratory conditions. Indoor Built Environ. 2016, 27, 70–83. [Google Scholar] [CrossRef]
  15. Tan, P.T.; Sia, A. A Pilot Green Roof Research Project in Singapore. In Third Annual Greening Rooftops for Sustainable Communities Conference; Green Roofs for Healthy Cities: Toronto, ON, Canada, 2005; p. 9. [Google Scholar]
  16. Vera, S.; Pinto, C.; Tabares-Velasco, P.C.; Bustamante, W.; Victorero, F.; Gironás, J.; Bonilla, C.A. Influence of vegetation, substrate, and thermal insulation of an extensive vegetated roof on the thermal performance of retail stores in semiarid and marine climates. Energy Build. 2017, 146, 312–321. [Google Scholar] [CrossRef]
  17. Sandoval, V.; Suárez, F.; Vera, S.; Pinto, C.; Victorero, F.; Bonilla, C.; Gironás, J.; Bustamante, W.; Rojas, V.; Pastén, P. Impact of the Properties of a Green Roof Substrate on its Hydraulic and Thermal Behavior. Energy Procedia 2015, 78, 1177–1182. [Google Scholar] [CrossRef]
  18. Vera, S.; Pinto, C.; Victorero, F.; Bustamante, W.; Bonilla, C.; Gironás, J.; Rojas, V. Influence of Plant and Substrate Characteristics of Vegetated Roofs on a Supermarket Energy Performance Located in a Semiarid Climate. Energy Procedia 2015, 78, 1171–1176. [Google Scholar] [CrossRef]
  19. Victorero, F.; Vera, S.; Bustamante, W.; Tori, F.; Bonilla, C.; Gironás, J.; Rojas, V. Experimental Study of the Thermal Performance of Living Walls Under Semiarid Climatic Conditions. Energy Procedia 2015, 78, 3416–3421. [Google Scholar] [CrossRef]
  20. Herrera, J.; Bonilla, C.A.; Castro, L.; Vera, S.; Reyes, R.; Gironás, J. A model for simulating the performance and irrigation of green stormwater facilities at residential scales in semiarid and Mediterranean regions. Environ. Model. Softw. 2017, 95, 246–257. [Google Scholar] [CrossRef]
  21. Herrera, J.; Flamant, G.; Gironás, J.; Vera, S.; Bonilla, C.; Bustamante, W.; Suárez, F. Using a Hydrological Model to Simulate the Performance and Estimate the Runoff Coefficient of Green Roofs in Semiarid Climates. Water 2018, 10, 198. [Google Scholar] [CrossRef]
  22. Berardi, U.; GhaffarianHoseini, A.; GhaffarianHoseini, A. State-of-the-art analysis of the environmental benefits of green roofs. Appl. Energy 2014, 115, 411–428. [Google Scholar] [CrossRef]
  23. López, R. Energía Limpia XXI. Available online: https://energialimpiaparatodos.com/2016/08/16/19247/ (accessed on 25 July 2017).
  24. Gonzalez, C. Construirtv. Available online: http://construirtv.com/por-ley-francia-obligara-a-construir-techos-verdes/ (accessed on 15 August 2017).
  25. Frith, M.; Gedg, D. The UK’s Leading Independent Green Roof Website. Available online: www.livingroofs.org (accessed on 15 July 2017).
  26. Perini, K.; Ottelé, M.; Giulini, S.; Magliocco, A.; Roccotiello, E. Quantification of fine dust deposition on different plant species in a vertical greening system. Ecol. Eng. 2017, 100, 268–276. [Google Scholar] [CrossRef]
  27. Zhang, X.; Shen, L.; Tam, V.W.Y.; Lee, W.W.Y. Barriers to implement extensive green roof systems: A Hong Kong study. Renew. Sustain. Energy Rev. 2012, 16, 314–319. [Google Scholar] [CrossRef]
  28. Pettit, T.; Irga, P.J.; Abdo, P.; Torpy, F.R. Do the plants in functional green walls contribute to their ability to filter particulate matter? Build. Environ. 2017, 125, 299–307. [Google Scholar] [CrossRef]
  29. Baykal, A. Green Roofs Copenhagen; The Technical and Environmental Administration: Copenhagen, Denmark, 2016. [Google Scholar]
  30. Gail, L.; Beth, A.C.; Hitesh, D.; Ireen, W. Green Roofs: A Resource Manual for Municipal Policy Makers; Canada Mortgage and Housing Corporation: Ottawa, ON, Canada, 2006.
  31. Vera, S.; Gironás, J.; Bonilla, C.A.; Bustamante, W.; Rojas, M.V.; Victorero, F.; Schöll, M. Informe Catastro INNOVAChile 12IDL2-13630; Pontificia Universidad Católica de Chile: Santiago, Chile, 2014. [Google Scholar]
  32. Reyes, R.; Bustamante, W.; Gironás, J.; Pastén, P.A.; Rojas, V.; Suárez, F.; Vera, S.; Victorero, F.; Bonilla, C.A. Effect of substrate depth and roof layers on green roof temperature and water requirements in a semi-arid climate. Ecol. Eng. 2016, 97, 624–632. [Google Scholar] [CrossRef]
  33. Kottek, M.; Grieser, J.; Beck, C.; Rudolf, B.; Rubel, F. World Map of the Köppen-Geiger climate classification updated. Meteorol. Z. 2006, 15, 259–263. [Google Scholar] [CrossRef]
  34. Besir, A.B.; Cuce, E. Green roofs and facades: A comprehensive review. Renew. Sustain. Energy Rev. 2018, 82, 915–939. [Google Scholar] [CrossRef]
  35. Sandoval, V.; Bonilla, C.A.; Gironás, J.; Vera, S.; Victorero, F.; Bustamante, W.; Rojas, V.; Leiva, E.; Pastén, P.; Suárez, F. Porous Media Characterization to Simulate Water and Heat Transport through Green Roof Substrates. Vadose Zone J. 2017, 16. [Google Scholar] [CrossRef] [Green Version]
  36. MMA Sistema de Información Nacional de Calidad del Aire. Available online: http://sinca.mma.gob.cl/ (accessed on 1 July 2017).
  37. Przybysz, A.; Robert, P.; Helena, G.; Katarzyna, G.; Karolina, A.; Mariola, W.; Stanisáaw, W.G. Efficiency of photosynthetic apparatus of plants grown in sites differing in level of particulate matter. Acta Sci. Pol. Hortorum Cultus 2014, 54, 414–419. [Google Scholar]
  38. Saebo, A.; Popek, R.; Nawrot, B.; Hanslin, H.M.; Gawronska, H.; Gawronski, S.W. Plant species differences in particulate matter accumulation on leaf surfaces. Sci. Total Environ. 2012, 427–428, 347–354. [Google Scholar] [CrossRef] [PubMed]
  39. Beckett, P.; Freer-Smith, P.H.; Taylor, G. Effective Tree Species For Local Air-Quality Management. J. Arboric. 2000, 26, 12–19. [Google Scholar]
  40. Hwang, H.-J.; Yook, S.-J.; Ahn, K.-H. Experimental investigation of submicron and ultra fi ne soot particle removal by tree leaves. Atmos. Environ. 2011, 45, 6987–6994. [Google Scholar] [CrossRef]
  41. Freer-Smith, P.H.; Beckett, K.P.; Taylor, G. Deposition velocities to Sorbus aria, Acer campestre, Populus deltoides × trichocarpa Beaupré, Pinus nigra and × cupressocyparis leylandii for coarse, fine and ultra-fine particles in the urban environment. Environ. Pollut. 2005, 133, 157–167. [Google Scholar] [CrossRef] [PubMed]
  42. Leonard, R.J.; McArthur, C.; Hochuli, D.F. Particulate matter deposition on roadside plants and the importance of leaf trait combinations. Urban For. Urban Green. 2016, 20, 249–253. [Google Scholar] [CrossRef]
  43. Weerakkody, U.; Dover, J.W.; Mitchell, P.; Reiling, K. Evaluating the impact of individual leaf traits on atmospheric particulate matter accumulation using natural and synthetic leaves. Urban For. Urban Green. 2918, 30, 98–107. [Google Scholar] [CrossRef]
  44. Burkhardt, J. Hygroscopic particles on leaves: Nutrients or desiccants. Ecol. Monogr. 2010, 80, 369–399. [Google Scholar] [CrossRef]
  45. Beckett, K.P.; Freer-Smith, P.H.; Taylor, G. Urban woodlands: Their role in reducing the effects of particulate pollution. Environ. Pollut. 1998, 99, 347–360. [Google Scholar] [CrossRef]
Figure 1. Nine species of GR and LW studied in this research. 1 indicates species used in GRs; 2 indicates the species used in LWs.
Sustainability 10 02431 g001
Figure 2. Schematic drawing of the test room to evaluate the PM deposition of GR and LW species.
Sustainability 10 02431 g002
Figure 3. PM2.5 deposited on the leaves of five species used for GR and four species used for LW. Values shown on bar charts are means ± SE, n = 6.
Sustainability 10 02431 g003
Figure 4. PM10 deposited on the leaves of five species used for GR and four species used for LW. Values shown on bar charts are means ± SE, n = 6.
Sustainability 10 02431 g004
Figure 5. PM deposited in the wax of the leaves of five species used for GR and four species used for LW. Values shown on bar charts are means ± SE, n = 6.
Sustainability 10 02431 g005
Figure 6. PM2.5 and PM10 concentrations with and without vegetation for S. album (a,b), L. angustifolia (c,d), and S. spurium p (e,f).
Sustainability 10 02431 g006
Figure 7. SEM images showing roughness of: (a) S. album (650×), (b) P. tobira (500×).
Sustainability 10 02431 g007
Table 1. Summary of the most recent experimental research on the potential of green roofs (GR) and living walls (LW) to capture particle matter (PM).
Ref.Type of InfrastructureMethodType of VegetationLocationSpecies StudiedMain FindingsPotential for Air Remediation
[12]GRScanning Electron Microscopy (SEM)Grasses and herbaceous plantsManchester, UKAgrostis stolonifera, Festuca rubra, Plantago lanceolata and Sedum albumOverall, GRs were not as efficient as trees. However, Festuca rubra showed a potential for air pollution mitigation closes to trees.Dry deposition of PM10 between 0.42 g·m−2·year−1 and 1.81 g·m−2·year−1.
[13]LWPM concentration monitoring in an environmental chamberGrassesCalifornia, USAFestuca festinaLW must function as air PM filters in indoor spacesPM10 concentration is reduced between 20% and 40%
[15]GROutdoor PM concentration monitoringShrubs, grasses and herbaceous plantsSingaporeFurcraea foetida ‘Mediopicta’, Aloe vera Aptenia cordifolia, Carpobrutus edulis, Delosperma lineare, Zephyranthes candida, Zephyranthes rosea, Lonicera japonica, Callisia repens, Tradescantia pallida ‘Purpurea’, Sanseveria trifasciata ‘Hahnii’, Sanseveria trifasciata ‘Golden Hahnii’, Sanseveria trifasciata ‘Laurentii‘, Liriope muscari, Kelanchoe tomentosa, Sedum acre, Sedum mexicanum, Sedum nussbaumerianum, Sedum sarmentosum, Sedum sexangulare, Ophiopogon intermedius, Aglaia odorata, Pandanus amaryllifolius, Portulaca grandiflora cultivars, Ixora coccinea and Murraya paniculataThe GR reduces the level of PM caused by traffic emissionsUp to 6% of PM10 is removed in the study area
[11]Trees, GR, and LWGravimetric methodTrees, shrubs and climbersNowoursynowska, PolandTrees: A. campestre, F. excelsior, P. hispanica and T. cordata
GR: Forsythia × intermedia Zabel, Physocarpus opulifolius (L.) Maxim. and Spiraea japonica L.
LW: Hedera helix L.
There are significant differences between species. Shrub and climber species were more efficient than treesDry deposition of total PM between 18 µg·cm−2 and 25 µg·cm−2 for two growing seasons
[10]Trees and LWGravimetric methodTrees and climberWarsaw, PolandTrees: T. baccata and P. sylvestris
LW: Hedera helix L.
The species studied accumulated large quantities of PM. H. helix L. was less efficient. The evergreen plants are efficient in collecting PM on their foliage.Dry deposition of total PM between 8 µg·cm−2 and 140.6 µg·cm−2 for month
[14]Indoor speciesPM concentration monitoring in an environmental chamberShrubsSantiago, ChileChamaedorea elegans, Peperomia jayde, Chlorophytum comosum ‘variegatum’ (spider plant), Dracaena deremensis Janet Craig’ compacta, Ficus benjamina, Dracaena marginata, Schefflera arboricola ‘Variegata’, Juniperus chinensis ‘San Jose’, Sansevieria trifasciata, Sophora macrocarpa ‘mayo’ and Quercus suberShrubs can reduce the environmental pollution of ultrafine particles in indoor environments, and some species are more effective than others.Reduce up to 5.9% of indoor PM2.5 concentration
[8]Trees, GR, and LWGravimetric methodTrees, shrubs and lianasBeijing, ChinaTrees: 28 species: Ulmus pumila, Catalpa speciosa, Magnolia denudate, etc.
GR: Syringa microphilla, Iles chinesis, Lonicera maackii and Sobaria sorbifolia,
LW: Parthenoccisus tricuspidata, Campsis grandiflora and Parthenoccisus quinquefolia
There are significant differences on PM2.5 dry deposition among species. The layout of species significantly impacts the dry deposition.Dry deposition of PM2.5 between 6 µg·cm−2·day−1 and 70 µg·cm−2·day−1
[26]LWScanning Electron Microscopy (SEM)Shrubs and climberGenoa, IatlyTrachelospermum jasminoides, Hedera hélix, Cistus ‘Jessamy Beauty’ and Phlomis fruticosaThere are significant differences between species. Sampling season and timing have no influence on the results.T. jasminoides collects a higher number of particles
[28]LWBiofilter an environmental chamberShrubs and climberSydney, AustraliaChlorophytum orchidastrum, Ficus lyrata, Nematanthus glabra, Nephrolepis cordifolia duffii, Nephropelis exaltata bostoniensis, Schefflera amate and Schefflera arboricolaThere are significant differences between species associated principally to botanical component.N. exaltata b. outperformed the other species by a significant margin across all PM fractions.
Table 2. Green Roof policies and incentives in the world [(a) Control stormwater run-off, (b) Promote biodiversity, (c) Save building energy, (d) Promote urban agriculture, (e) Reduce urban heat island effect, (f) Promote urban aesthetics (skyrise greening), (g) Generate public amenity spaces, (h) Improve air quality.
City or CountryKey Motivation
Copenhagen [29]a, b
Montreal, Canada [30]c, d
Toronto, Canada [30]a, e, h
Vancouver, Canada [30]a, e, g
Waterloo, Canada [30]a, h
Chicago, USA [30]e, h
New York, USA [30]a, e
Portland, USA [30]a
Basel-City, Switzerlandb, c
Münster, Germany [30]a
Singapore [30]f
Stuttgart, Germany [25]h
Tokyo, Japan [30]e
France [25]b, c
Buenos Aires, Argentina [23]b
Table 3. The total amount of PM deposited for five species used in GR and four in LW.
SpeciePM Total Deposited (µg·cm−2·h−1)
MeanSE
S. album29.338.74
S. reflexum7.771.34
S. palmeri6.930.42
L. spectabillis6.281.16
S. spurium p.2.930.32
A. cordiflora2.200.44
L. angustifolia1.980.16
E. karvinskianus1.620.42
P. tobira1.380.32

