Article

Selling Remanufactured Products under One Roof or Two? A Sustainability Analysis on Channel Structures for New and Remanufactured Products

1
School of Management and Economics, University of Electronic Science and Technology of China, Chengdu 611731, China
2
Department of Logistics, School of Business Administration, Jiangxi University of Finance and Economics, Nanchang 330013, China
3
Sichuan Province Cyclic Economy Research Center, Mianyang 621010, China
*
Authors to whom correspondence should be addressed.
These authors contributed equally to this work.
Sustainability 2018, 10(7), 2427; https://doi.org/10.3390/su10072427
Submission received: 13 June 2018 / Revised: 5 July 2018 / Accepted: 9 July 2018 / Published: 11 July 2018
(This article belongs to the Special Issue How Retailers Could Contribute to Sustainable Development)

Abstract

:
Even though many manufacturers integrate remanufacturing into existing business models, it should be noted that such efforts are usually accompanied by a major concern for cannibalization of new product sales from remanufactured products. To deal with this problem, many manufacturers, such as Dell, adopt a “two-roof policy” where the sale of new products takes place in a store and their remanufactured products in another. However, in contrast, some manufacturers, including Apple and HP, adopt a “one-roof policy”, by which all new and remanufactured products are sold through one store/chain. Although the literature on remanufacturing has extensively addressed sustainability issues within operations management, little attention has been paid to how “differentiated roof policy” for the marketing of remanufactured products affects sustainability issues. To fill this gap, in this paper, the authors develop two theoretical models in which manufacturers have the flexibility to distribute new and remanufactured products (1) through a one-roof policy (Model O) or (2) through a two-roof policy (Model T), respectively, and strive to address the question of how differentiated roof policies impact sustainability issues related to remanufacturing operations. Among other results, the central result suggests that, if the manufacturers care about economic performance, distributing both products through a two-roof policy is an advantageous strategy. Conversely, if they care about environmental sustainability, one roof is the preferred strategy.

1. Introduction

Recently, the global business community has experienced significant momentum regarding interest in the sustainable movement [1]. Legislations, including the Waste Electrical and Electronic Equipment (European Union), Home Appliance Recycling Law (Japan), and Regulation on the Administration of the Recovery and Disposal of Waste Electrical and Electronic Products (China), have introduced this awareness and make take-back, recycling, and remanufacturing a necessity for original equipment manufacturers (OEMs). Aside from the pressure from governments and environmental groups, consumers have also begun to realize the impact of unsustainable environmental practices on their living standards, and force OEMs to accept responsibility for their commercial practices. The proportion of Europeans “ready to buy environmentally friendly products even if they cost a little bit more”, for example, has increased to 75% in 2008 compared to 31% in 2005 [2].
One of the lasting effects of this movement is the fact that numerous brand name manufacturers have created business models in which remanufacturing is an integral part [3]. Xerox Corporation, for example, has engaged in remanufacturing with its copiers and has successfully remanufactured over 230,000 equipment parts, which has saved about $6 million in manufacturing costs in 2008 to 2009 in Australia [4]. Similar activities are undertaken by Apple Corporation for its notebook computers, TVs and IPhones: The Apple GiveBack Program enables consumers to return to Apple Corporation any Apple device in any condition without any cost. All remanufactured products, once given replacement parts for any defective modules identified with Apples’ high standard testing process, are sold with Apple’s standard one-year limited warranty [5]. Similar cases also appear in IBM [6], Canon [7], Hewlett-Packard [8], and more.
Although remanufacturing can be given a green environment and resource preservation reputation, incorporating remanufacturing into existing business processes poses several questions for operation decisions. A great number of manufacturers are in a difficult position when incorporating the remanufacturing into traditional manufacturing operations, with a major concern for cannibalization from remanufactured products [9]. Cisco, a brand-name manufacturer in the IT industry, has an advanced technical equipment and management team that could remanufacture all returned products and sell them. Yet, Cisco has only experimented with marketing remanufactured units through a limited pilot program because the sales division of Cisco firmly believes a remanufactured product can create a cannibalization threat to the sales of new units [10]. “You are ruining us—remanufactured product sales are stealing new products sales” is a phrase that almost every manager of remanufacturing operations at original equipment manufacturers (OEMs) has heard from sales and marketing managers at their firm [9].
Cannibalization becomes a concern when the sales division distributes products that can be discernably different to consumers in their quality valuations. This is particularly the case when a firm offers a remanufactured version of a product at a lower price than the new version of that same product [9]. Such operational decisions also have a noticeable impact on distribution channels. More specifically, some manufacturers adopt a “one-roof policy”, by which all new and remanufactured products are sold through one store/chain. In contrast, many other manufacturers adopt a “two-roof policy”, selling their new products in one store and their remanufactured products in a different location. To avoid the cannibalization of new product sales by remanufactured products, many brand name manufacturers in the PC industry, for example, have a separate channel (Dell’s “www.delloutlet.com”) for distributing their remanufactured computers and accessories [11]. Particularly, the Administrative Measures for Pilot Remanufacturing of Automobile Parts and Accessories has prohibited all retailers in China in the forward distribution partners to engage in the sale of remanufactured automobile parts and all remanufactured automobile parts are only provided by those distributors in the after-sales service system. Conversely, just like Apple CEO, Tim Cook, reiterated that Apple “never fear[s] cannibalization”, all remanufactured Apple devices, such as remanufactured iPhones, iPads, Macs, and so on, are available from its Web channel of “https://www.apple.com”, the same Web channel for distributing new Apple devices. Similarly, HP sells both new and remanufactured products through Hong Hengchang [12].
From a research perspective, the discussion above raises the most fundamental question addressed in this paper—how do differentiated roof policies impact sustainability issues of the manufacturers’ remanufacturing operations? More specifically, in this paper, the authors strive to address the following questions, confronting the cannibalization problem of remanufactured products: Should manufacturers sell new and remanufactured products through a one-roof policy or a two-roof policy? Which is more beneficial for economic and environmental sustainability?
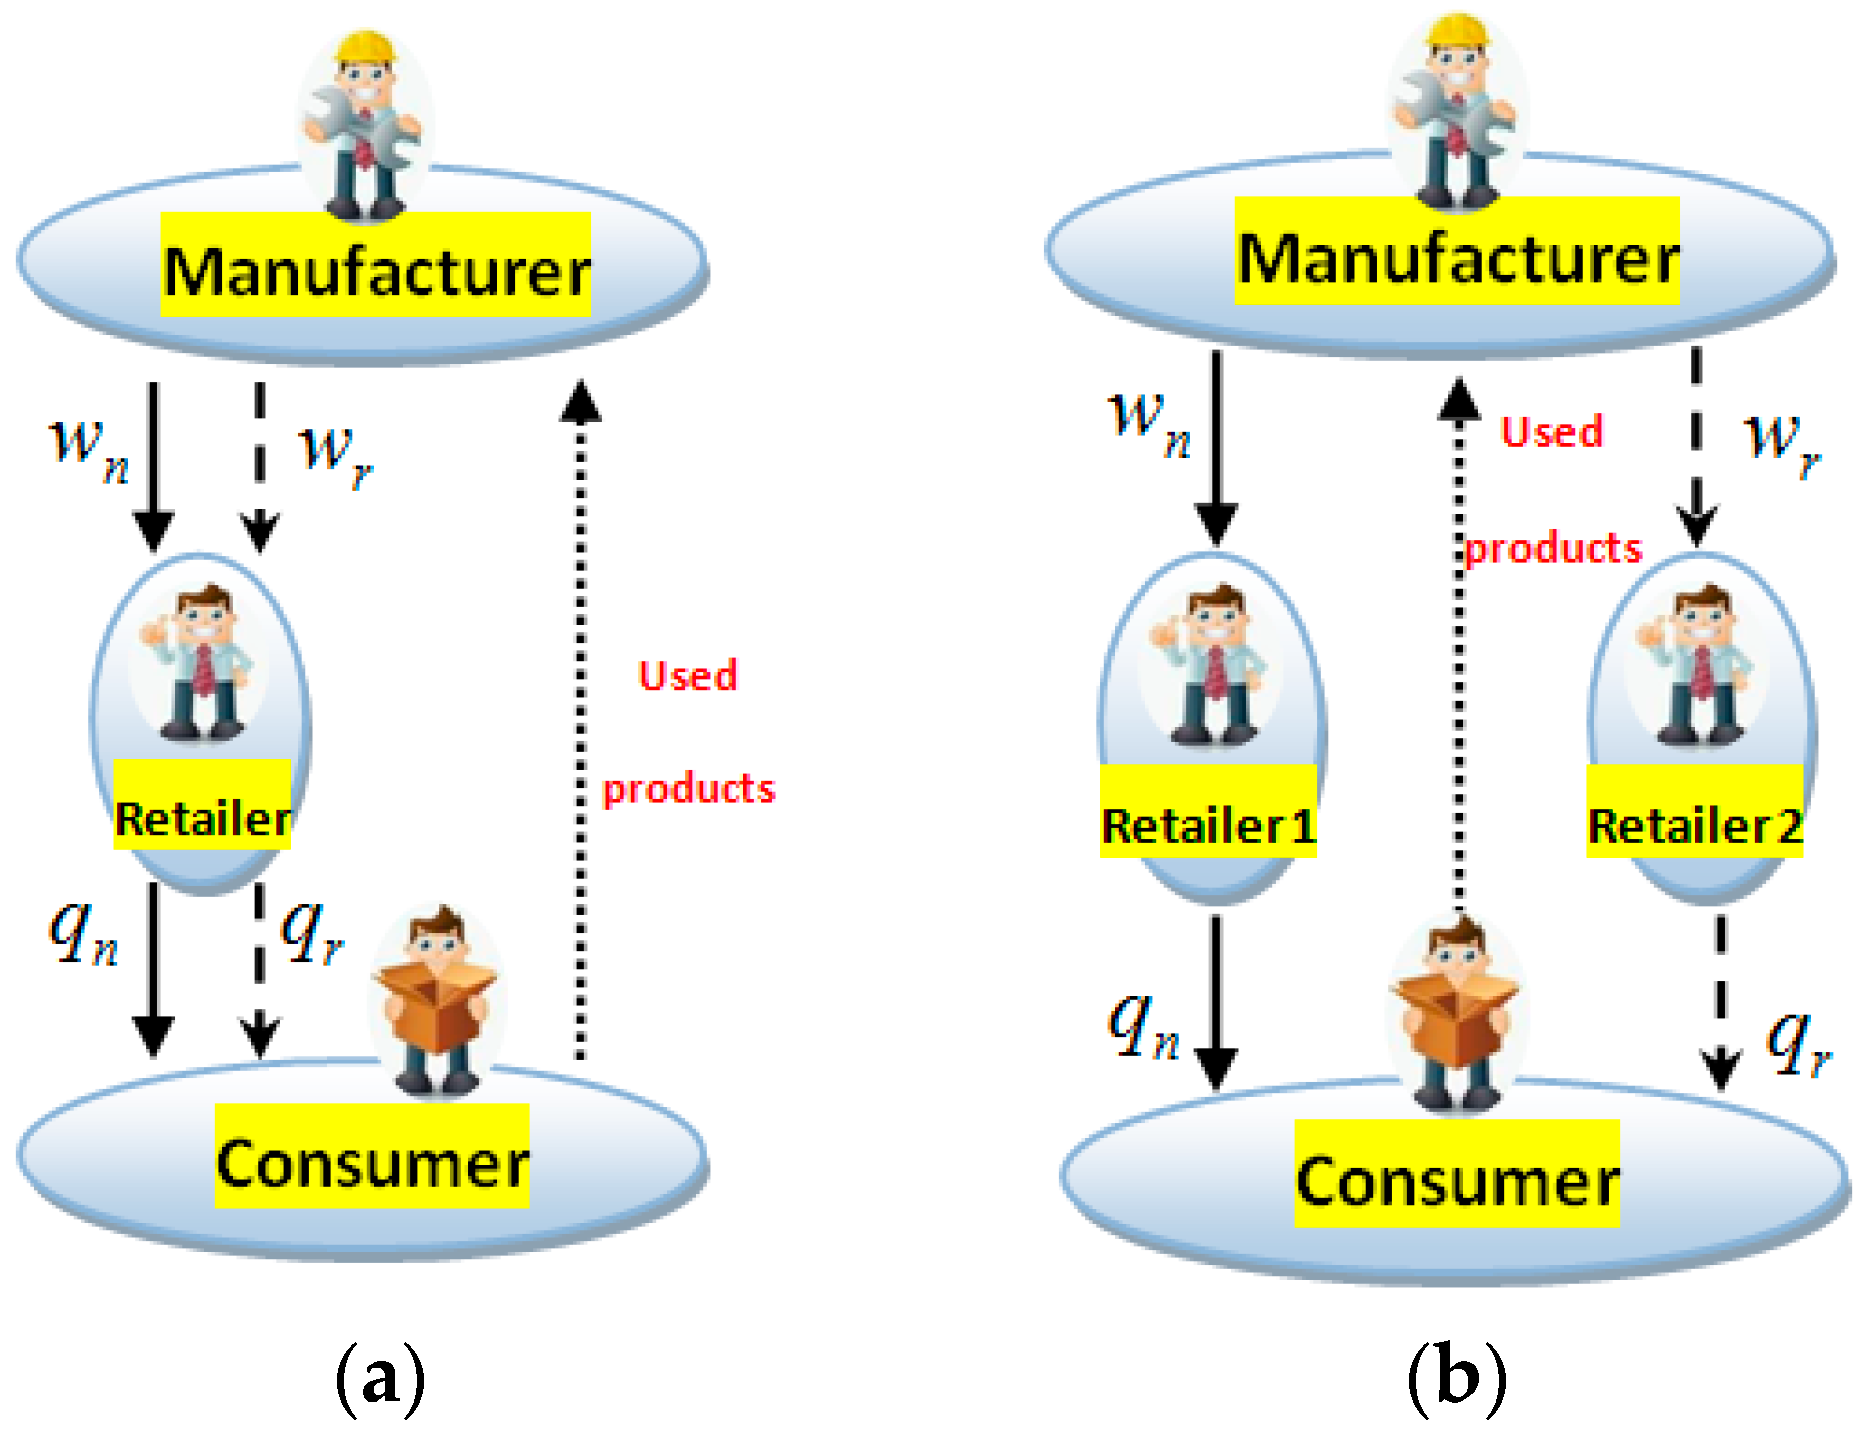
The authors develop two theoretical models in which OEMs with the potential flexibility to distribute new and remanufactured units: (1) Through a one-roof policy, in which all new and remanufactured products are sold through one store/chain (Model O); or (2) through a two-roof policy, where new products are sold in a store, while the remanufactured products are offered in another location (Model T). The two theoretical models are depicted in Figure 1.
A central result the authors obtain is that, although Model O creates more benefits for the environment, OEMs have less incentives to adopt it because it leads to a lower profitability for manufacturers. This analysis also indicates that both the consumer value and the remanufacturing cost play important roles in shaping the optimal roof strategy choice in the context of remanufactured product marketing.
This study’s overall contribution is, therefore, twofold. Although the literature on remanufacturing has extensively addressed sustainability issues in operations management (as in [3] and the references therein), little attention has been paid to how differentiated roof policies for marketing remanufactured products affects sustainability issues. Conversely, although there are numerous research interests in roof policies in the marketing literature on segment heterogeneous consumers (as in [13] and the references therein), little is known about how differentiated roof policies impact sustainability issues related to remanufacturing operations. To summarize, the authors provide an alternative, and somewhat complementary, approach to investigate how differentiated roof policies impact sustainability issues related to remanufactured product marketing and extend them to address the implications of roof policy for marketing remanufactured products.
The remainder of this paper is organized as follows: Section 2 reviews the literature related to this research; Section 3 describes the key elements of the basic model and introduces notations; Section 4 outlines two models—Model O and Model T; Section 5 reports the main findings; Section 6 illustrates all results with a numerical example; and Section 7 concludes the paper.

2. Literature Review

Sustainable operations management has increasingly attracted more researchers, as well as practitioners, to study the relationship between sustainability and the supply chain [14]. Srivastava [15], for example, defined Green Supply Chain Management as integrating environmental thinking into supply-chain management. Chaabane [16] then developed a mixed-integer linear programming-based framework for a sustainable supply chain. Recently, Wilhelm [17] employed agency and institutional theory arguments to explore the conditions. Subsequently, Rajeev [18] proposed a conceptual framework to classify various factors along the triple bottom line pillars of sustainability issues in the context of supply chains. Meanwhile, Reefke and Sundaram [19] confirmed, questioned, and extended the knowledge on sustainable supply chain management. This paper enriches this line of literature by addressing sustainability issues related to remanufacturing operations.
In recent decades, the literature on remanufacturing has extensively addressed sustainability issues in operations management. Ovchinnikov [20], for example, revealed that, from an eco-efficiency optimization perspective, remanufacturing is usually a highly beneficial activity; it increases the firm’s profits and, in most cases, decreases its total environmental impact. Zhang [21] examined the impacts of retail services and the degree of customer loyalty to the retail channel on the pricing of players in a centralized and a decentralized dual-channel supply chain, and showed that retail services have a great impact on the manufacturer and the retailer’s pricing strategies. Golinska [22] provided a new tool for remanufacturing operations and for identifying and prioritizing operations in companies needing improvement. Yan [23] highlighted the question of whether OEMs should also outsource their reverse channels to third-party remanufacturers when outsourcing remanufacturing. Although the relationship between remanufacturing and sustainability has been well studied, little attention has been paid to how differentiated roof policies for marketing remanufactured products affects sustainability issues.
The third related area of the literature on market competition related to roof policy in the marketing literature is on segment heterogeneous consumers. Desai [24], for example, developed a model made up of two segments demonstrating that, as the taste preferences of the low-valuation segment becomes weaker, more intense competition in the low-valuation segment makes it more attractive for high-valuation consumers. Matsubayashi [25] studied an instance of price and quality competition between firms, as seen in the recent internet market, and showed an interesting result not seen in the well-known Bertrand price competition: Not only does differentiation always increase firms’ profits, but it also can increase consumer welfare in a quality-sensitive market. Ailawadi [26] developed an econometric model of the relationship between a household’s private-label share and its behavioral store loyalty, and found that the private-label share significantly affects all three measures of behavioral loyalty in the study: Share of wallet, share of items purchased, and share of shopping trips. Zhang and Cao [13] highlighted a multi-product retail firm and explore the implications of roof policy for its quality signaling strategies, and demonstrated that when product quality is readily observable to consumers, a two-roof policy yields a greater profit than a one-roof policy if the benefit from segmentation outweighs the cost of an additional roof. Joshi [27] studied product line scope and pricing decisions in a horizontally differentiated duopoly and showed that the traditional wisdom of a firm might offer a broader product line to attract higher demand, or charge a higher price (or both), especially when consumers have a relatively high valuation and low heterogeneity in their preferences for the line extension. As mentioned earlier, although there is much research interest in roof policies in the marketing literature regarding segment heterogeneous consumers, little is known about how differentiated roof policies impact sustainability issues related to remanufacturing operations. The related studies of this paper are provided in Table 1.

3. Model Description and Assumption

The elementary goal of this paper is to understand how differentiated roof policies impact the sustainability issues related to remanufacturing operations. Hence, the authors consider two models where a manufacturer, who produces two different product categories (new and remanufactured products), has the flexibility to distribute two product categories through one and/or two roof policies: (1) Selling both new and remanufactured products through an independent retailer (Model O, Figure 1a); or (2) selling new products through Retailer 1, while all remanufactured products are available from Retailer 2 (Model T, Figure 1b). Given the above framework, the authors first introduce the key assumptions as follows.
As per Savaskan [28], the authors assume the previous existence of the product in the market, which can then be returned to the manufacturer for reuse. The authors emphasize that all decisions are considered in a single-period setting: The manufacturer sets the wholesale price for both products (wn/wr) and then the retailer(s) responds with the optimal units of qn/qr. Note that all decisions being made in a single-period enables the authors to focus on steady-state profits, facilitating analytical tractability in this model and contributing to the solution of the problems [28,29,30,31].
The authors assume for both models that the mass of consumers is constant every period and is normalized to 1. Conversely, following the common assumptions in the remanufacturing literature [29,31,32], the authors assume the consumer “willingness to pay” for a new product is heterogeneous and uniformly distributed over a range from 0 to 1. To reflect the fact that all the consumer “willingness to pay” for the remanufactured products is lower than that for the new products, the authors assume that the consumer tolerance for the remanufactured product is γ (0 ≤ γ ≤ 1), a fraction of the “willingness to pay” for the new product. Note that this assumption implies a vertical differentiation model, which allows for heterogeneity in the individual consumer’s “willingness to pay” for quality [29,31,33]. Thus, the inverse demand functions for new and remanufactured products can be derived as follows:
p n = 1 q n γ q r p r = γ ( 1 q n q r )
It should be noted that the consumer value discount for the remanufactured product, γ, leads to the cannibalization problem for new product sales by remanufactured products [30]. More specifically, if γ = 0, there is no cannibalization problem between new and remanufactured products; all consumers view the remanufactured product as a low quality product without any substitution for new units. However, if γ = 1, meaning the consumers would not object to paying the same amount for the remanufactured product at the valuation of new units, it would lead to a cannibalization problem between the new and remanufactured products.
Like Ferguson [34], Xiong, and Yan [35], the authors assume the unit cost of remanufacturing is less than that of producing a new product (thus, c r < c n ). This implies that remanufacturing is a natural low-cost alternative to production. This is consistent with the fact that companies can save 40 to 65% in manufacturing costs through remanufacturing [36] because it can reduce procurement costs effectively by reusing some used components and parts [31]. The collection cost is a quadratic function of the used product units, 1 2 k q e 2 , with the scaling parameter of k ; for simplification, the authors assume that all used product units can be remanufactured, that is q e = q r . This assumption indicates that additional effort is needed to achieve larger recovery volumes than required since the cost of collecting used products is convexly increasing with the collected quantity [31,34].
The information regarding all related parameters are listed in Table 2.

4. Model Formulation and Solution

The authors analyze two differentiated roof models—Model O, in which all new and remanufactured products are sold through one store/chain and, Model T, where new products are sold in a store while the remanufactured products are offered in a separate location. Π x i represents the profit for the player, x ( m , r 1 , r 2 , t ) , and the manufacturer, the retailer, and total supply chain are represented by Model i ( O , T ) , or Model O and Model T, respectively.

4.1. One-Roof Policy (Model O)

Using Model O, both new and remanufactured products are distributed through one retailer. The sequence of events is as follows: First, the manufacturer maximizes its profits by determining the wholesale prices of new and remanufactured products as w n O , w r O . The retailer then responds with a value determined by the optimal quantities of both products, that is, q n O , q r O . The manufacturer’s problem and the retailer’s problem are as follows, respectively:
max w r , w n Π m O = ( w n c n ) q n + ( w r c r ) q r 1 2 k q r 2 max q r , q n Π r O = ( p n w n ) q n + ( p r w r ) q r
The problem is solved using backward induction to determine the subgame perfect equilibrium. The following Lemma summarizes the equilibrium decisions (to clarify, proofs are provided in Appendix A.1).
Lemma 1.
The equilibrium quantities, wholesale prices, and profits in Model O can be summarized as follows:
w r O * = γ ( 4 c r + k + 4 γ + k c n 4 γ c r 4 γ 2 ) ( 8 γ 2 + 8 γ + 2 k ) w n O * = c n + 1 2 q n O * = k + 4 γ k c n 4 γ c n + 4 γ c r 4 γ 2 4 γ 4 γ 2 + k q r O * = c n γ c r 4 γ + k 4 γ 2 Π r O * = [ k 2 c n 2 8 k 2 c n 2 + 8 k γ c n 2 16 γ 3 c n 2 + 16 k 2 c n 2 + 32 k 3 c r c n 32 γ 2 c n c r 2 k 2 c n + 16 k γ 2 c n 16 k γ c n 32 γ 4 c n + 64 γ 3 c n 32 γ 2 c n + 8 k γ 16 γ 2 c r 2 + 16 γ c r 2 + k 2 8 k γ 2 + 16 γ 4 32 γ 3 + 16 γ 2 ] 16 ( 4 γ + k 4 γ 2 ) 2
Π m O * = ( 4 γ c n 2 + k c n 2 8 γ c n c r + 8 γ 2 c n 8 γ c n + 4 c r 2 4 γ 2 + 4 γ + k ) 8 ( 4 γ + k 4 γ 2 ) Π t O * = [ 3 k 2 c n 2 163 k 2 γ 2 c n 2 + 24 k γ c n 2 48 γ 3 c n 2 16 k γ c n c r + 96 γ 3 c n c r 96 γ 2 c n c r 6 k 2 c n + 48 k γ 2 c n 48 k γ c n 96 γ 4 c n + 192 γ 3 c n 96 γ 2 c n + 8 k c r 2 + 48 γ c r 2 48 γ 2 c r 2 + 3 k 2 24 k γ 2 + 24 k γ + 48 γ 4 93 γ 3 + 48 γ 2 ] 16 ( 4 γ + k 4 γ 2 ) 2

4.2. Two-Roof Policy (Model T)

Regarding Model T, all new products are sold through a retailer (without loss of generality, referred to as Retailer 1), while all remanufactured units are available from another source (without loss of generality, referred to as Retailer 2). Like Model O, the sequence of events is as follows: First, the manufacturer maximizes its profitability by setting the wholesale prices of w n T and w r T , respectively. The two downstream agents separately seek to maximize their own profit by choosing the optimal quantities of the new and remanufactured products, that is, q n T , q r T , respectively. Therefore, the manufacturer’s problem and both retailers’ problems can be written as follows:
max w r , w n Π m T = ( w n c n ) q n + ( w r c r ) q r 1 2 k q r 2 max q n Π r 1 T = ( p n w n ) q n max q r Π r 2 T = ( p r w r ) q r
Using backward induction again, one can summarize all equilibrium decisions in the following proposition (Proofs are listed in Appendix A.2):
Lemma 2.
Regarding Model T, the equilibrium quantities, wholesale prices, and profits can be summarized as follows:
w r T * = γ ( 8 c r + 3 k + 8 γ + k c n 2 γ c r 2 γ 2 ) ( 4 γ 2 + 16 γ + 4 k ) w n T * = c n + 1 2 q n T * = k + 4 γ k c n 4 γ c n + 2 γ c r 2 γ 2 16 γ 4 γ 2 + 4 k q r T * = c n γ 2 c r + γ 8 γ + 2 k 2 γ 2 Π r 1 T * = ( k + 4 γ k c n 4 γ c n + 2 γ c r 2 γ 2 ) 2 16 ( 4 γ γ 2 + k ) 2 Π r 2 T * = γ ( γ 2 c r + γ c n ) 2 4 ( 4 γ γ 2 + k ) 2
Π m T * = ( 4 γ c n 2 + k c n 2 4 γ c n c r + 4 γ 2 c n 8 γ c n 2 k c n + 4 c r 2 4 γ c r + 4 γ + k ) 8 ( 4 γ + k γ 2 ) Π t T * = [ 3 k 2 c n 2 2 k γ 2 c n 2 + 24 k γ c n 2 4 γ 3 c n 2 + 48 γ 2 c n 2 12 k γ c n c r + 8 γ 3 c n c r 6 k 2 c n 64 γ 2 c n c r 6 γ 2 c n + 16 k γ 2 48 k γ c n 8 γ 4 c n + 72 γ 3 c n 96 γ 2 c n + 48 γ 2 4 γ 2 c r 2 + 48 k c r 2 4 k γ c r 32 γ c r + 3 k 2 6 k γ 3 + 24 k γ + 4 γ 4 20 γ 3 + 8 k c r 2 ] 16 ( 4 γ + k γ 2 ) 2
To ensure 0 < q r < q n , like Savaskan [28], Xiong [29], and Yan [3], the authors impose the following condition:
Lemma 3.
Concerning both scenarios, the cost of remanufacturing should lie in the interval of 4 γ 2 4 γ + 8 γ c n + k c n k 4 ( γ + 1 ) < c r < γ c n .
Lemma 3 indicates that, if the remanufacturing cost is not too pronounced, c r < γ c n , the manufacturer is willing to engage in remanufacturing, that is, q r > 0 . Conversely, the manufacturer will produce a sufficient quantity of new products, which can be taken as the remanufacturing core, if the cannibalization problem between new and remanufactured products is not too high, that is: 4 γ 2 4 γ + 8 γ c n + k c n k 4 ( γ + 1 ) < c r .

5. Model Analysis

The authors strive to analyze the most fundamental question addressed in this paper—how do differentiated roof policies impact sustainability issues related to remanufacturing operations? To do so, based on Propositions 1 and 2, the authors first compare the equilibrium decisions of both models and then enrich the analysis to address the sustainability issues from an economic, social, and environmental perspective.

5.1. Analysis on Optimal Outcomes

The difference in the wholesale prices charged by the manufacturer under Model O and Model T is the first issue. Based on Lemmas 1 and 2, the authors summarize the findings in the following propositions (the proofs for all propositions are offered in Appendix B for clarity).
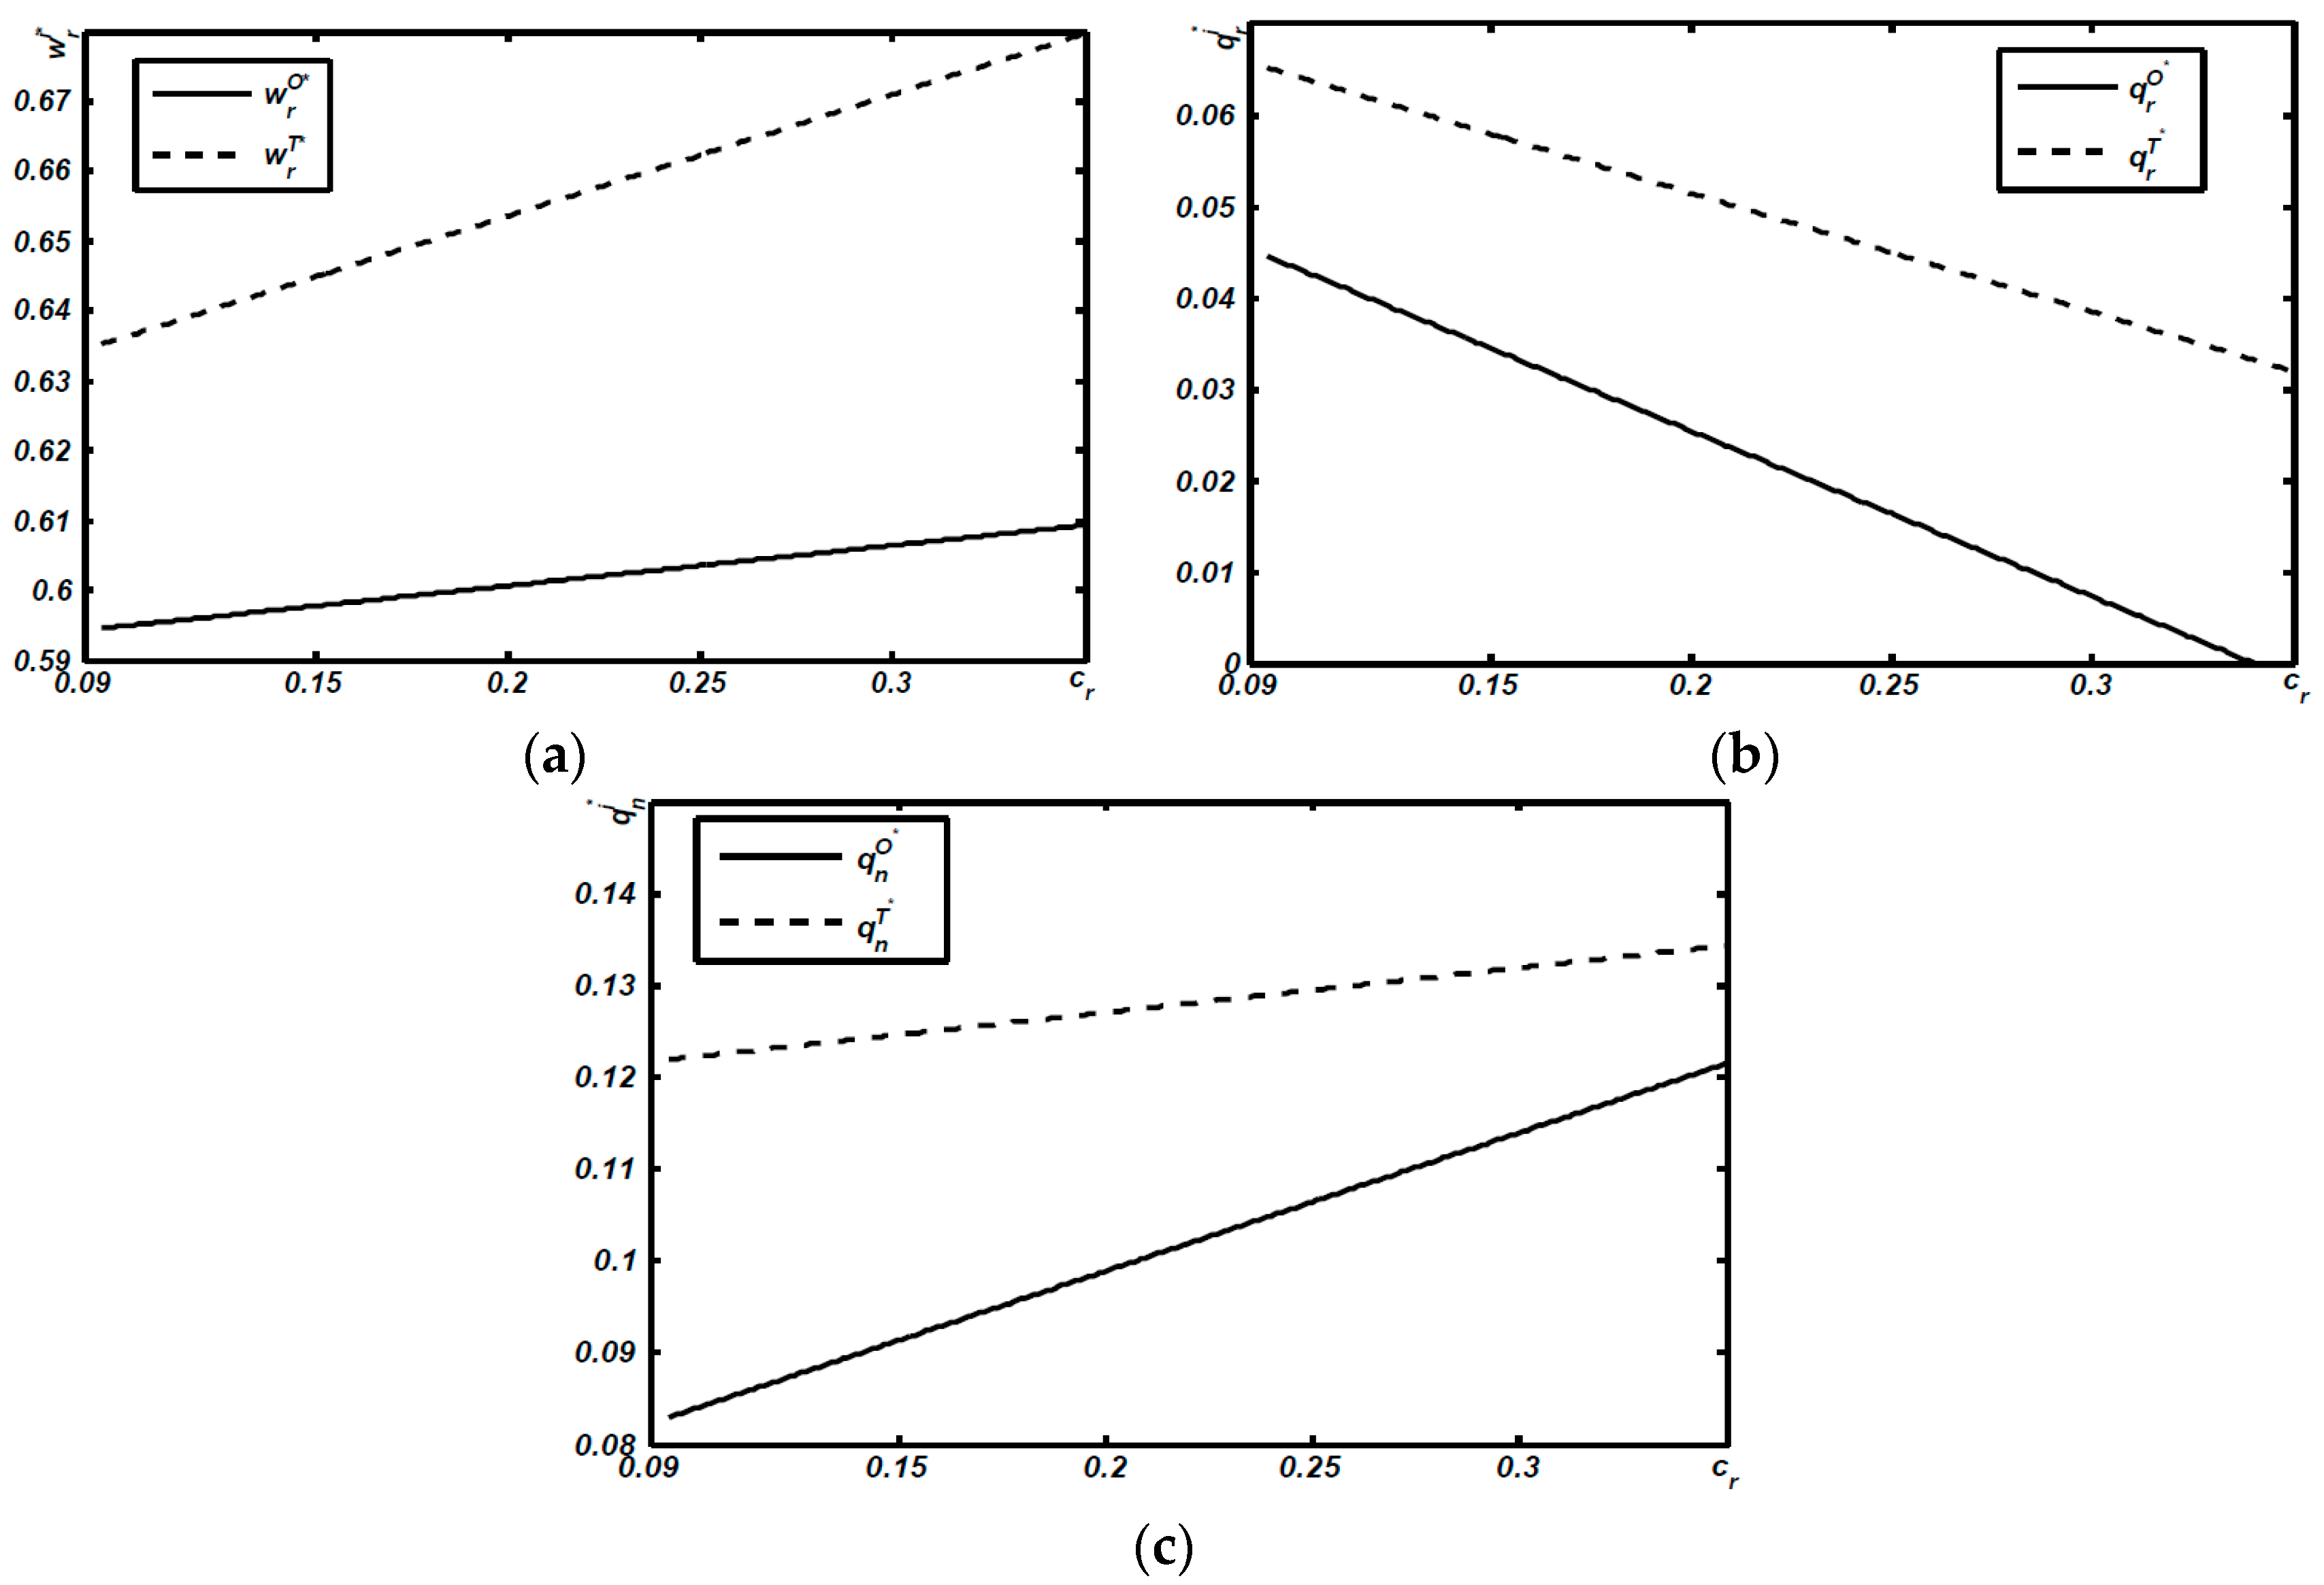
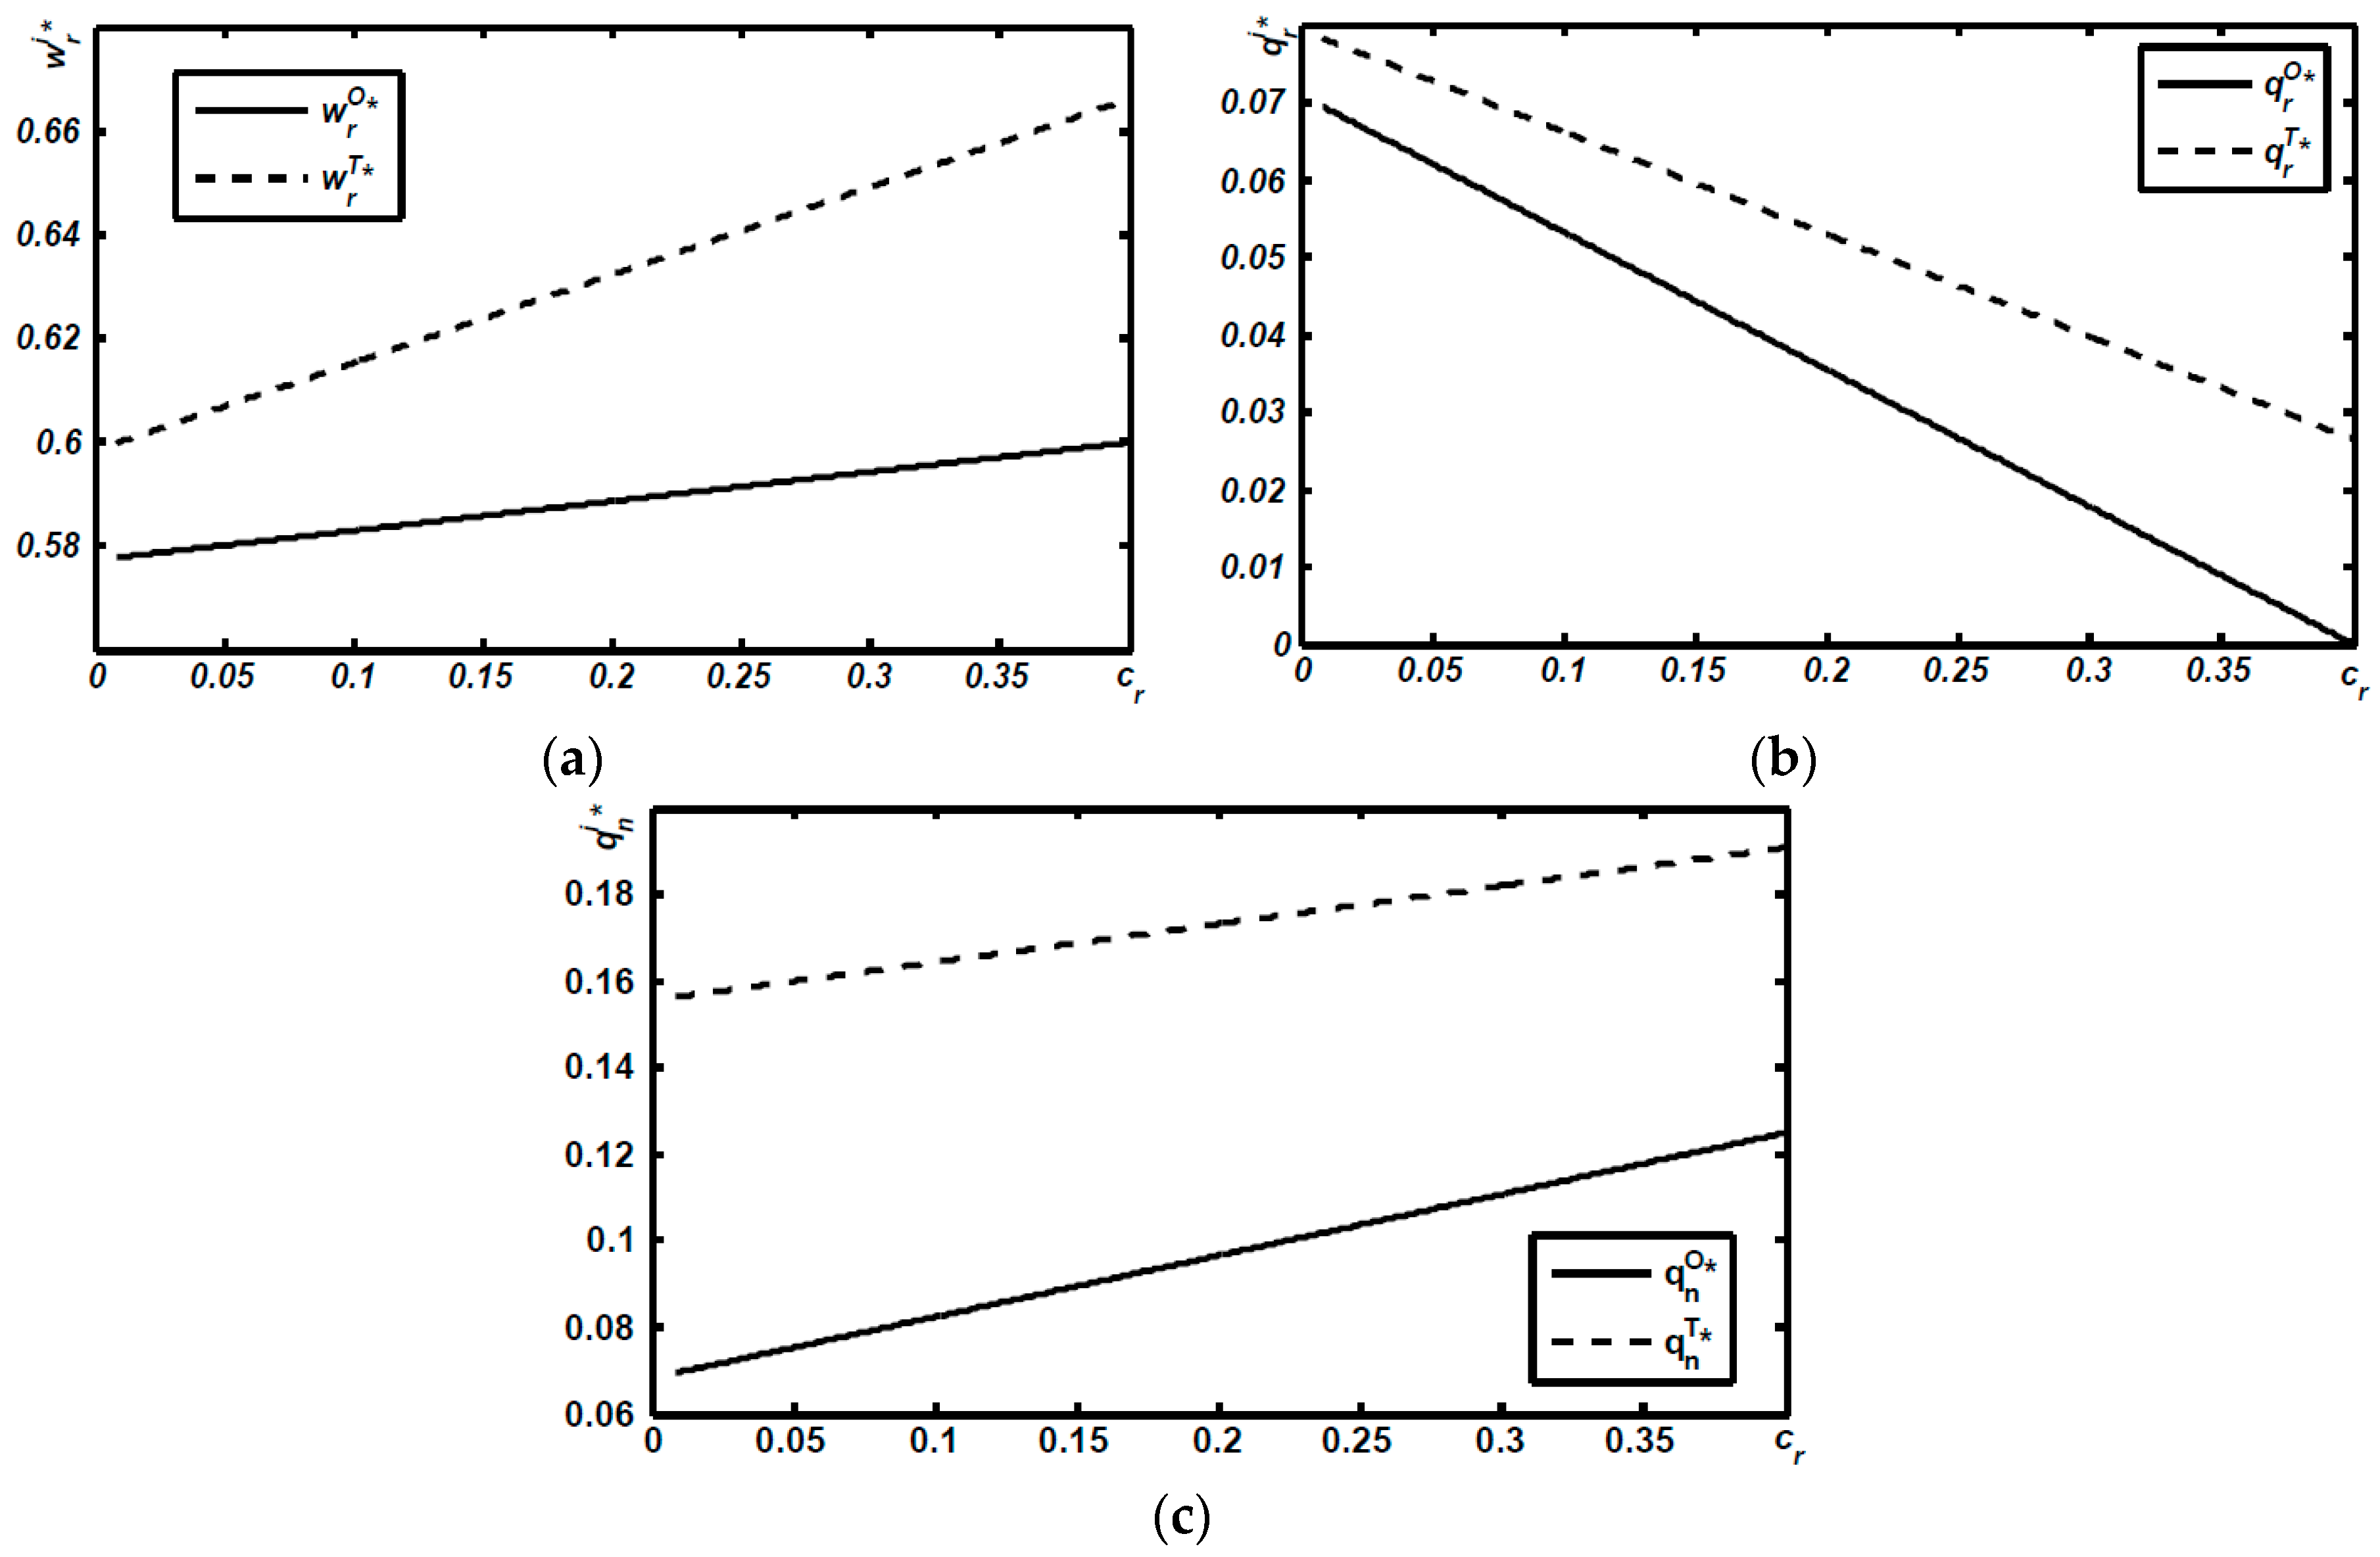
Proposition 1.
Compared to Model O, the manufacturer is more likely to upwardly distort the wholesale price of remanufactured products (thus, w r O * < w r T * ) in Model T; while the wholesale price of new products is immune to distortion (thus, w n O * = w n T * ).
Prior to explaining Proposition 1, the authors briefly examine the retailer’s position in both models. Both products are distributed through one retailer in Model O, while in Model T the new products are offered by Retailer 1, but all remanufactured units are available from Retailer 2. The underlying intuition behind Proposition 1 is as follows: When comparing Model O to Model T any wholesale price distortion is associated with the level of competition between both products in both cases. Since Retailer 1 is the monopoly distributor in Model O, the competition is higher in the latter scenario. Thus, when confronting the competition between the downstream agents, the manufacturer can charge a higher wholesale price for the remanufactured products. However, since Retailer 1 competes with remanufactured products from Retailer 2 in Model T, the manufacturer would be unlikely to upwardly distort the wholesale price for new products to not diminish unduly Retailer 1’s demand for the new products.
The authors now highlight the differences in the optimal quantities of remanufactured products between Model O and Model T. Based on Lemmas 1 and 2, the authors provide the following proposition:
Proposition 2.
Compared to Model O, although confronted with a higher wholesale price, Retailer 2 always sells larger quantities of remanufactured products in Model T, that is, q r O * < q r T * .
The conventional wisdom suggests that the increased wholesale price is accompanied by a decrease in demand from downstream agents (retailers). However, this logic is not best applied to the scenarios considered here because it misses a key perspective—the level of cannibalization between remanufactured and new products varies with the marketing setting.
It was mentioned earlier that in Model O both products are distributed through one retailer, while in Model T, the new products are offered by Retailer 1, but all remanufactured units are available from Retailer 2. There are two ways to explain the insight behind Proposition 2. The first is from the Model O perspective, where it can be concluded that the retailer in Model O has a more strategic choice in response to the manufacturer’s decision because both products are distributed through it. Such a strategic choice allows the retailer the flexibility to lower quantities for remanufactured products to limit the potential cannibalization from remanufactured products. Alternatively, one can interpret Proposition 2 from the Model T perspective, where, unlike in Model O in which both new and remanufactured products are distributed through one retailer, Retailer 2 has a higher tolerance for the manufacturer’s high wholesale price. Anticipating the fact that Retailer 2 has fewer strategic responses for the higher charge, the manufacturer chooses a higher wholesale price for it.
The difference in the optimal quantities of new products between Model O and Model T is the next area of discussion, summarized by the following Proposition based on Lemmas 1 and 2:
Proposition 3.
Compared to Model O, there is a larger quantity of new products in Model, thus, q n O * < q n T * .
Proposition 3 indicates that a two-roof policy stimulates the retailer to distribute greater quantities of the new products. This can be seen in Model O, where the retailer’s profit comes from two sources: The selling of new products and the sale of remanufactured products. However, in Model T, selling new products or remanufactured products is the only source of profitability of the retailer. Thus, the retailer would offer greater quantities of new products in Model T for two reasons: (1) To obtain more profit from selling new products; and (2) to limit the number of units of remanufactured products marketed through another roof to reduce competition from the other roof.

5.2. Analysis on Economic Sustainability

This section strives to address sustainability issues from an economic perspective. More specifically, the authors try to answer the question posed at the beginning of this paper: Should manufacturers sell new and remanufactured products through one or two roofs? Which is more beneficial for economic sustainability? The answer to the first question follows:
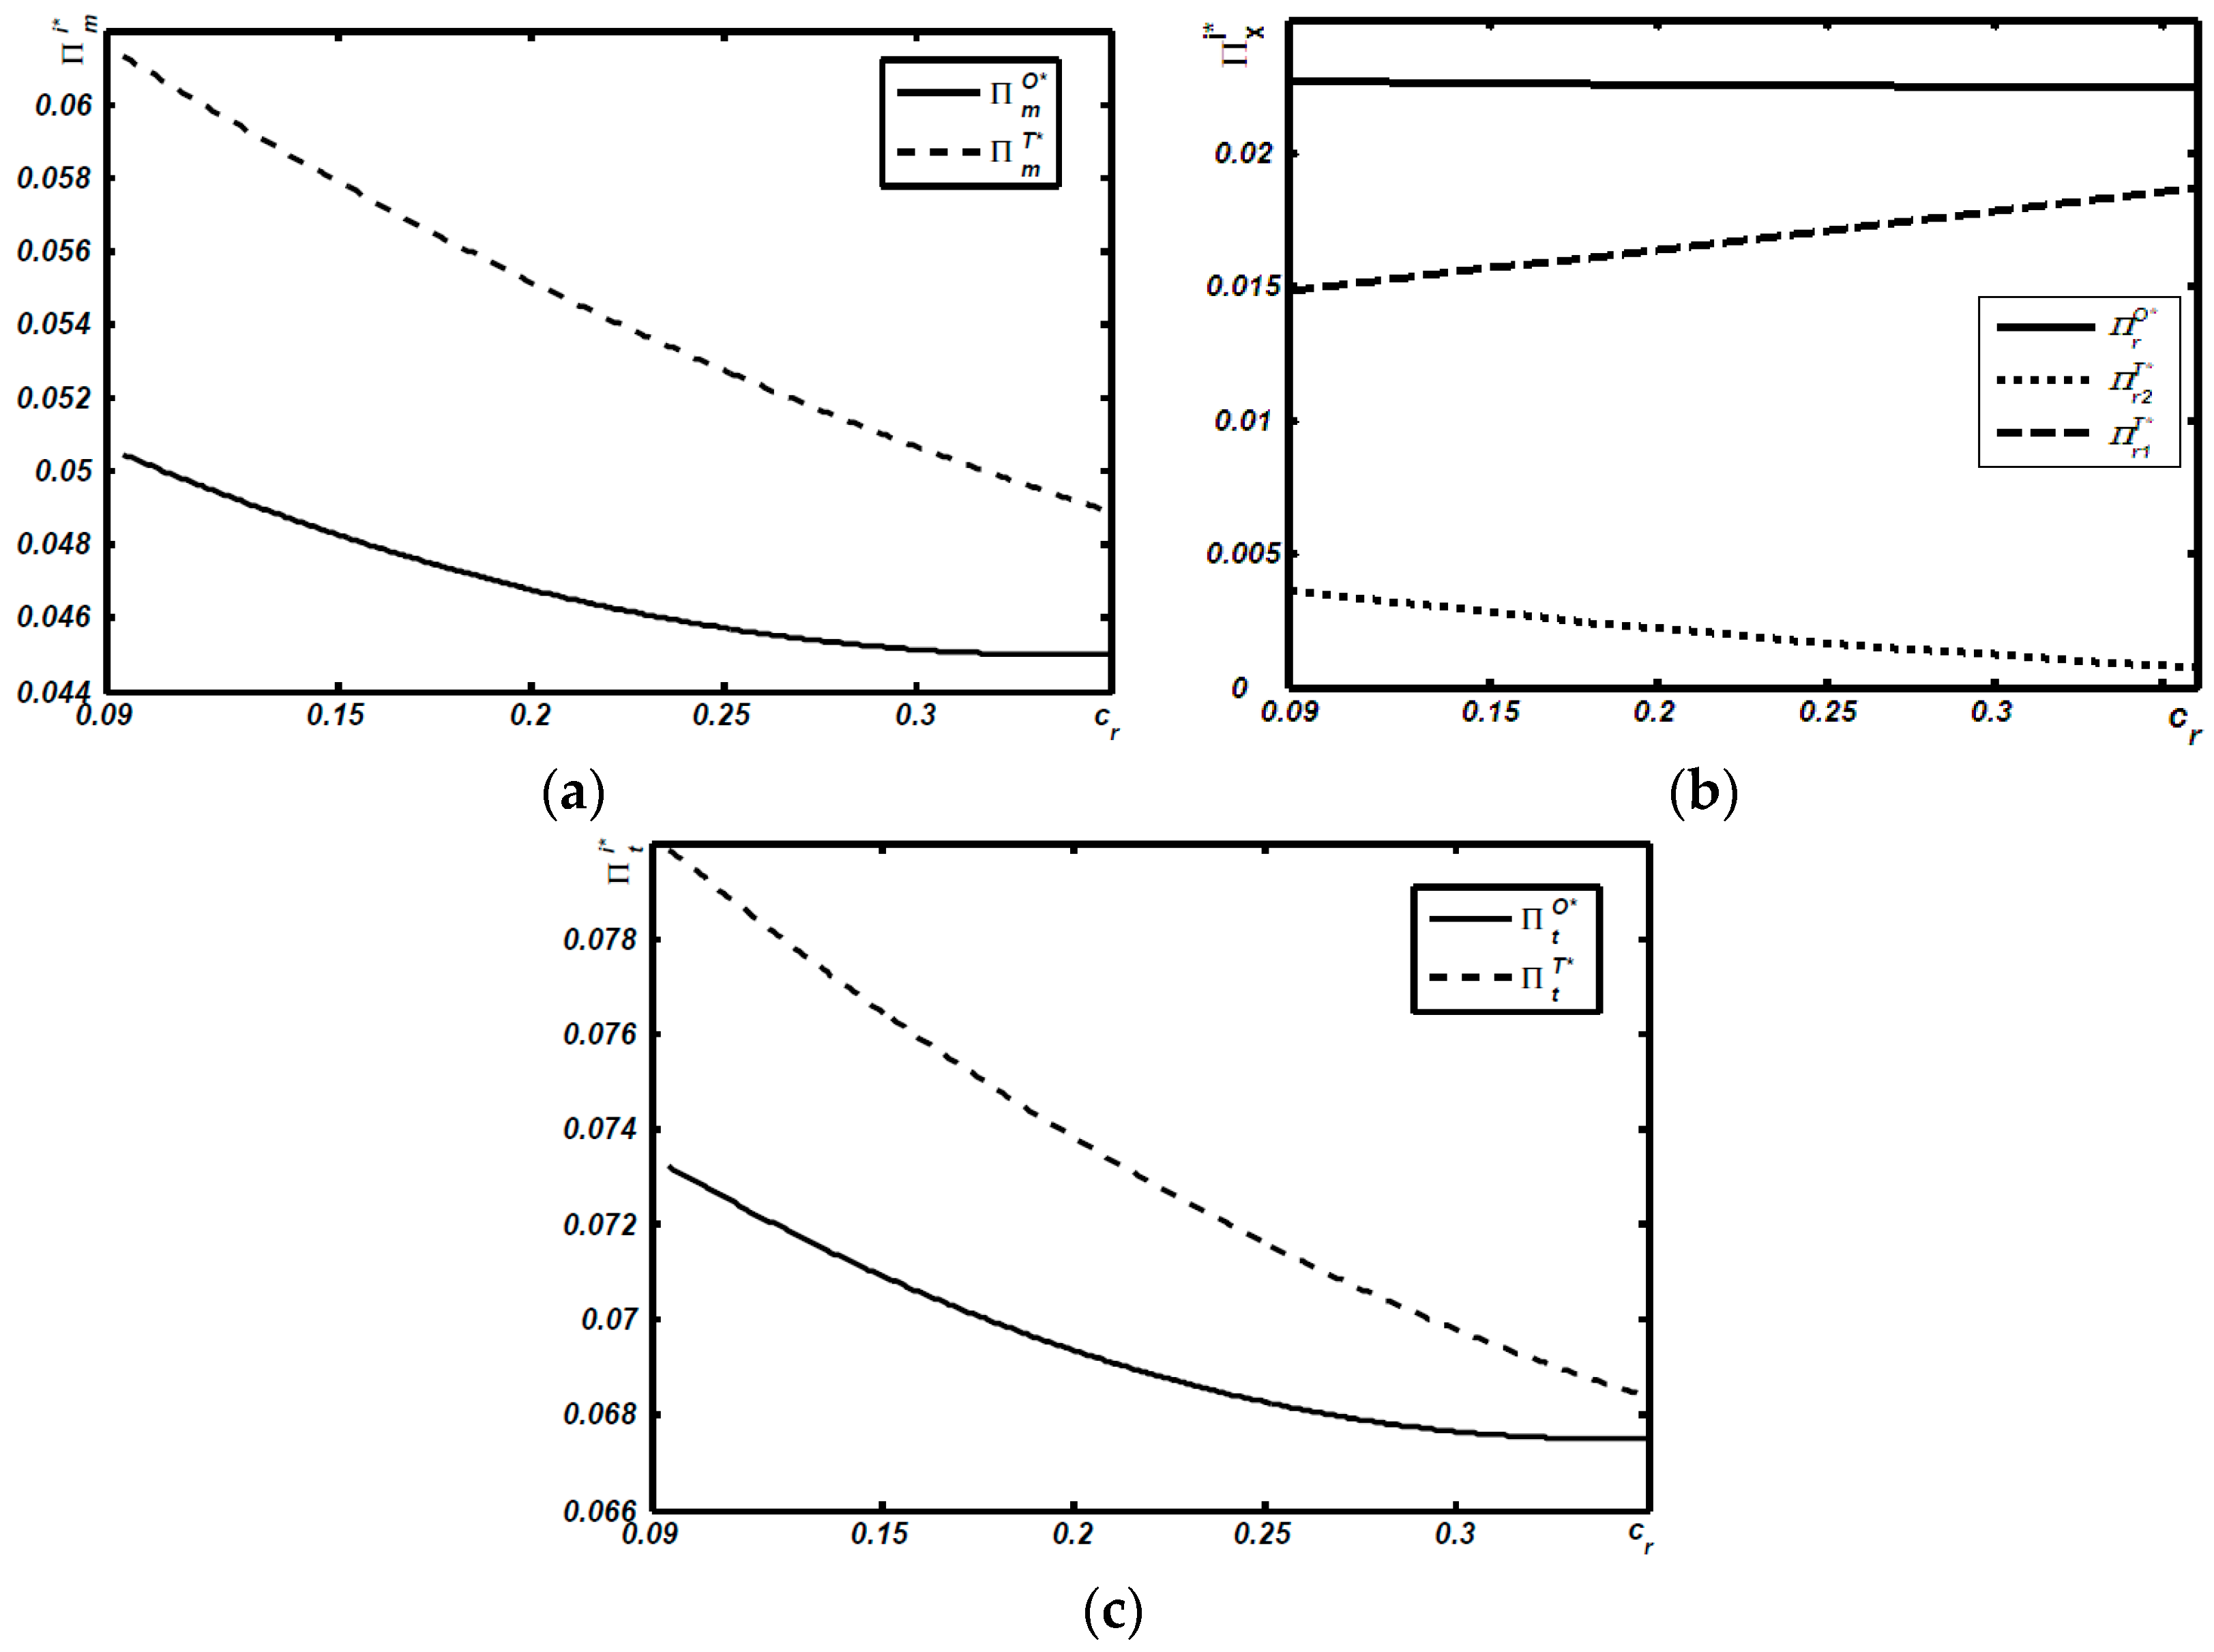
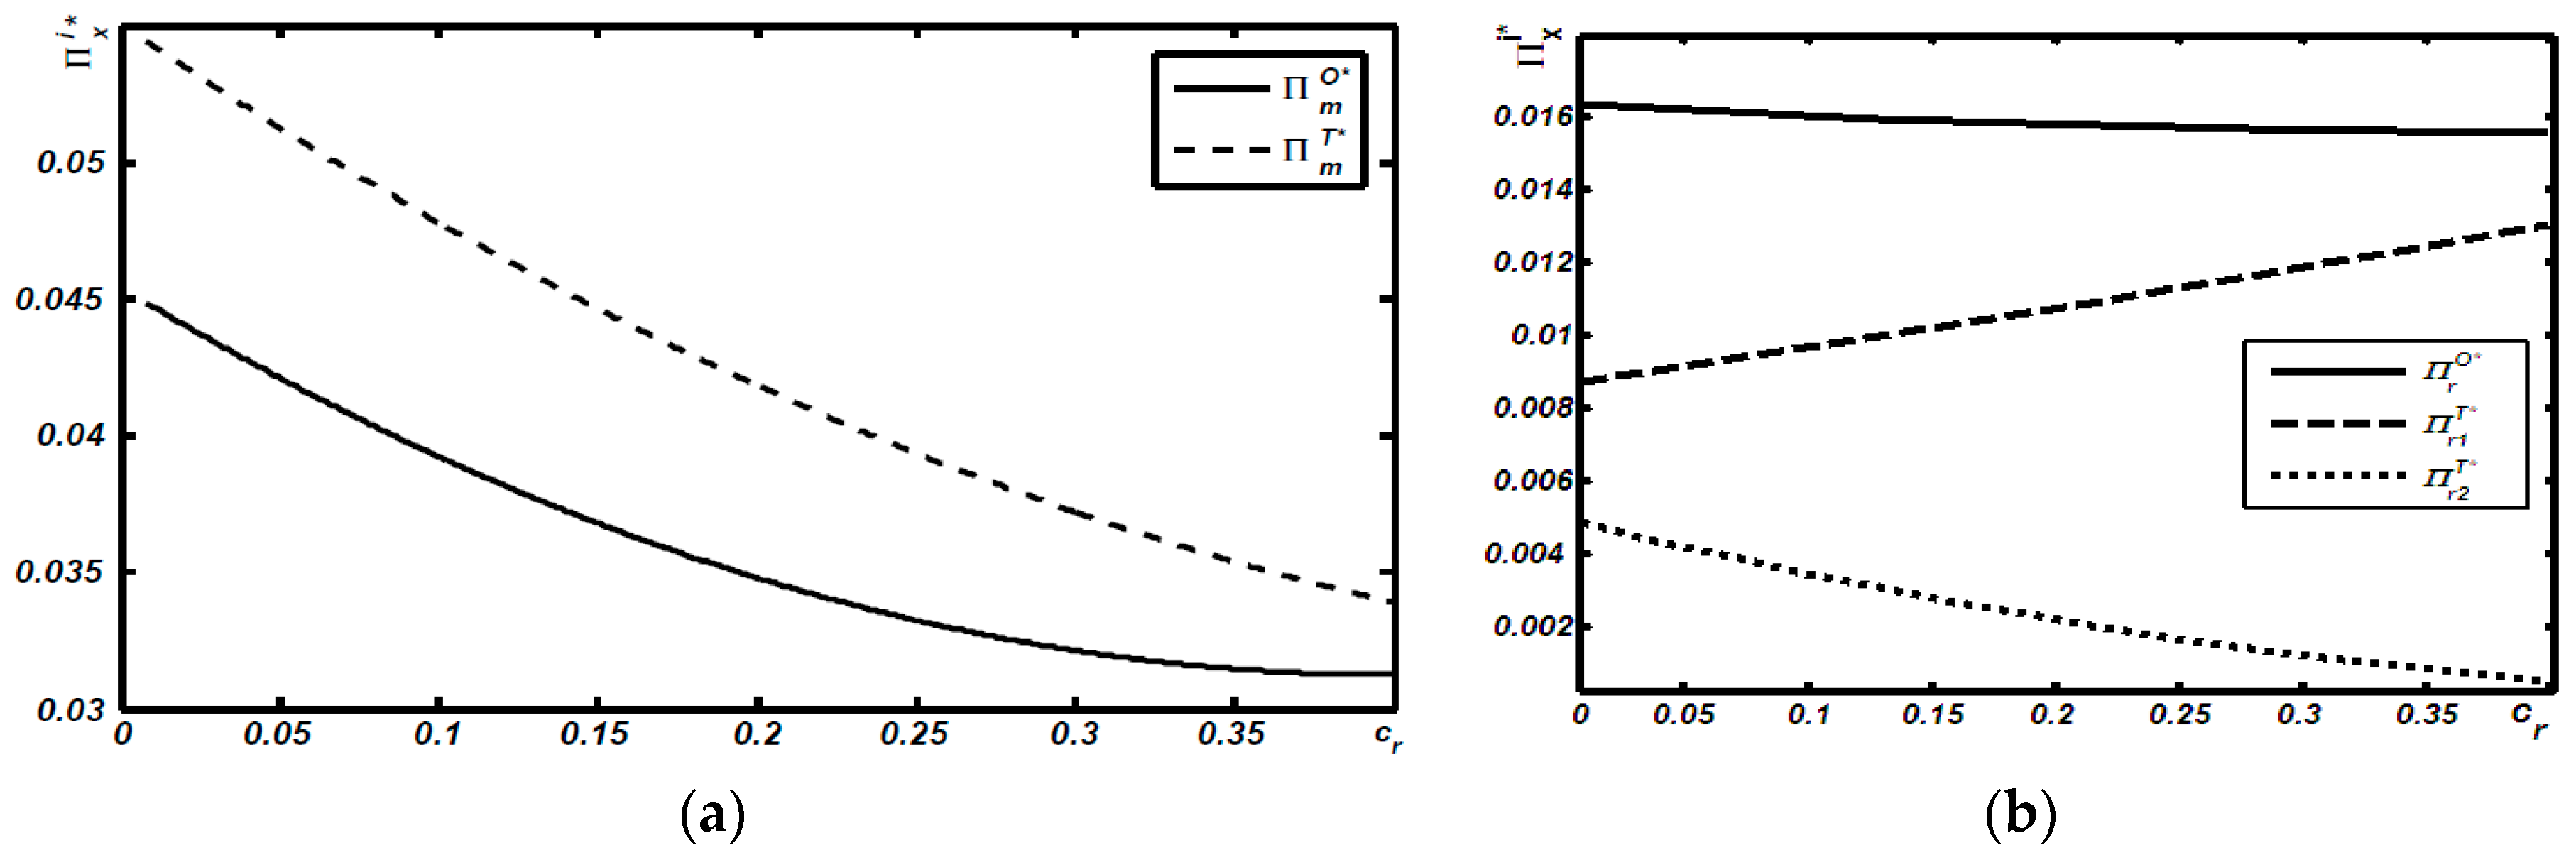
Proposition 4.
The equilibrium profit of the manufacturer in Model T is always higher than that in Model O (thus, Π m O * < Π m T * ).
Not surprisingly, the two-roof policy, creating greater profitability for the manufacturer, is quite consistent with traditional wisdom: As the number of retailers increases, (two retailers in Model T, but one retailer in Model O), the competition between the downstream agents becomes fiercer; consequently, both retailers are more likely to offer a lower price, but larger quantities than those in Model O. The competition between downstream agents places the manufacturer in an advantage position to distort the wholesale prices for both products (as demonstrated in Proposition 1), thus, increasing the manufacturer’s profitability.
Proposition 5.
The equilibrium profit of the retailer in Model T is always lower than that in Model O (thus, Π r O * > Π r 1 T * / Π r 2 T * ).
The two roof policy increases retail competition, compared to one roof policy, and the equilibrium profit of the retailer under the one roof policy is always higher than that under the scenario of the two roof policy [13]. In addition, the cannibalization problem becomes a concern when the sales division distributes products that can be discernably different to consumers in their quality valuations. Proposition 5, which follows directly from Lemmas 1 and 2, confirms this conventional wisdom.
Maximizing the total industry performance is still a key component of the economic sustainability of a supply chain [23,37]. Thus, based on Lemmas 1 and 2, the authors address the question of which scenario creates more benefits for economic sustainability in the following Proposition:
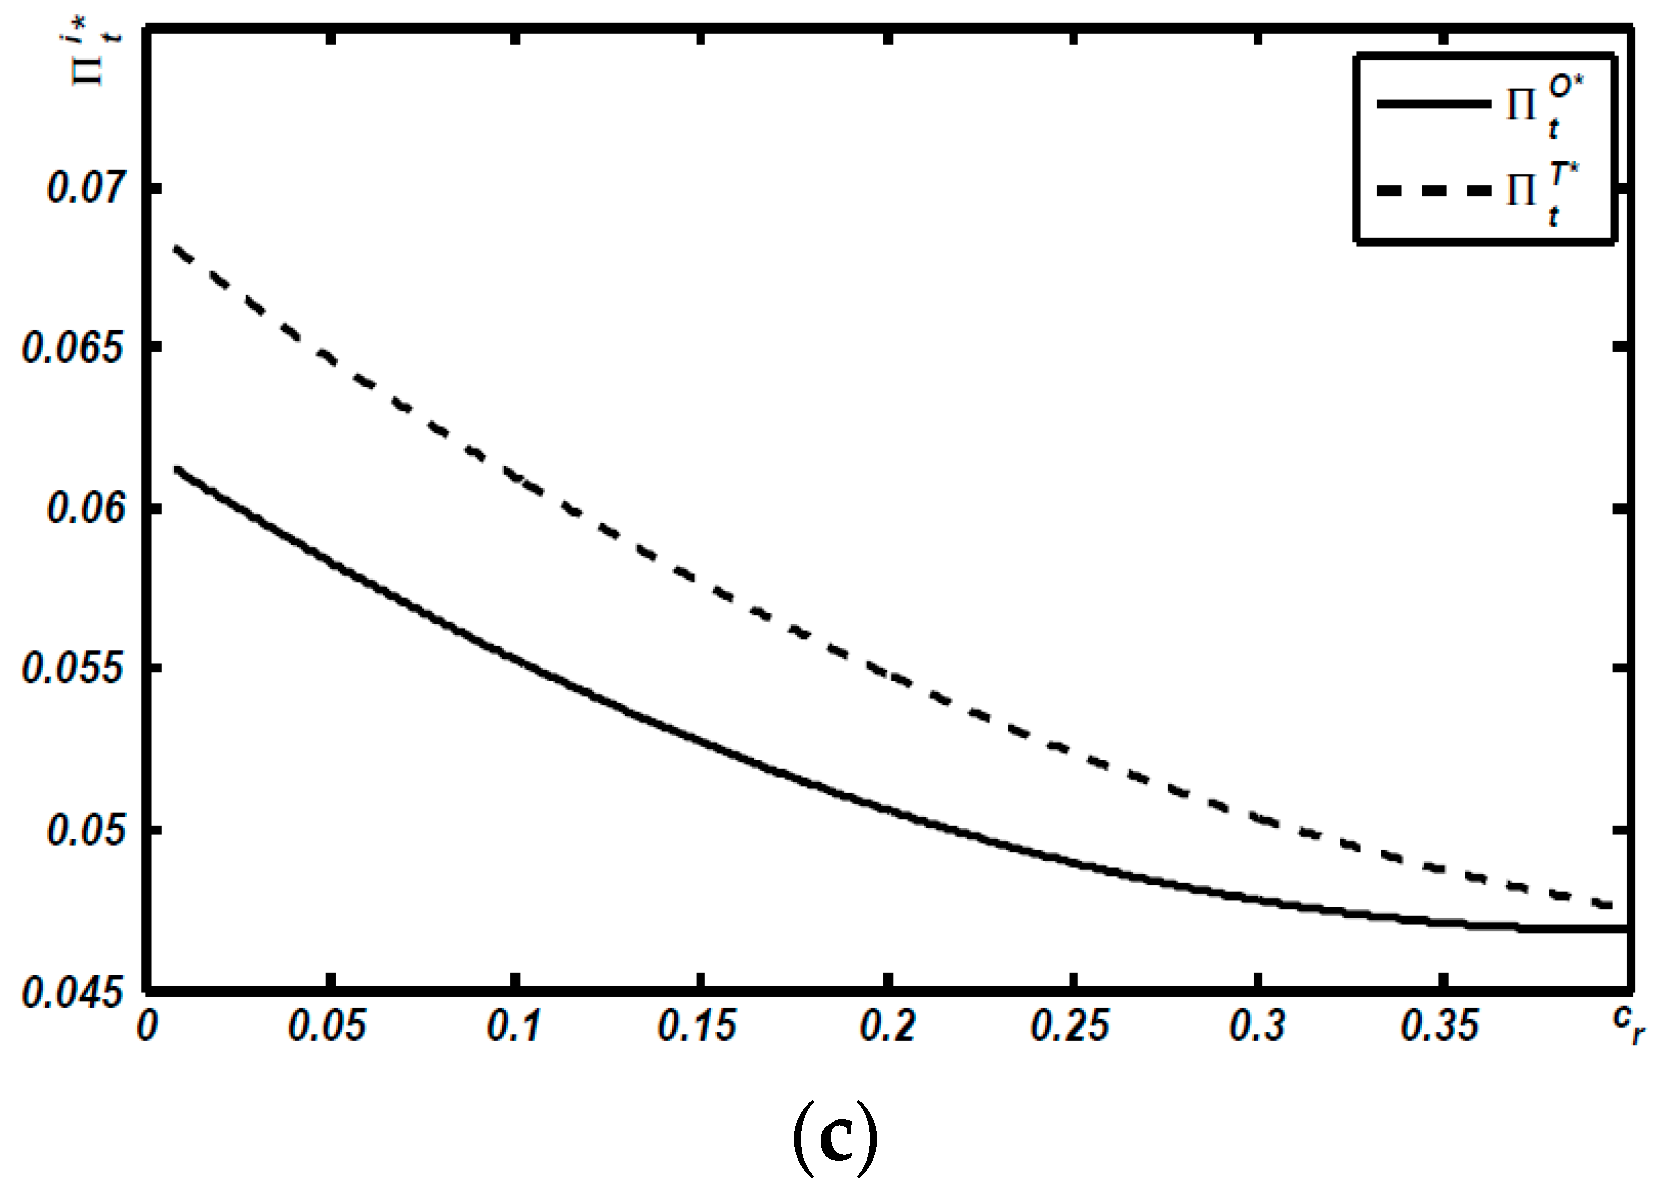
Proposition 6.
The equilibrium profit of the total supply chain in Model T is always higher than that in Model O (thus, Π t O * < Π t T * ).
Proposition 6 further reveals that a two-roof policy is also beneficial for the total industry. As described in Proposition 4, as the competition between downstream agents (retailers) increases, the profitability of the upstream agent (manufacturer) increases. Conversely, the competition between both retailers can enhance the supply chain profit, even when it reduces both retailers’ profits, due to its ability to mitigate the traditional double marginalization problem in the supply chain when both retailers compete with each other.

5.3. Analysis on Environmental Sustainability

The authors address the last question posed at the beginning of this paper: From an environmental sustainability perspective, should manufacturers sell new and remanufactured products through a one-roof policy or a two-roof policy, and which is more beneficial for environmental sustainability?
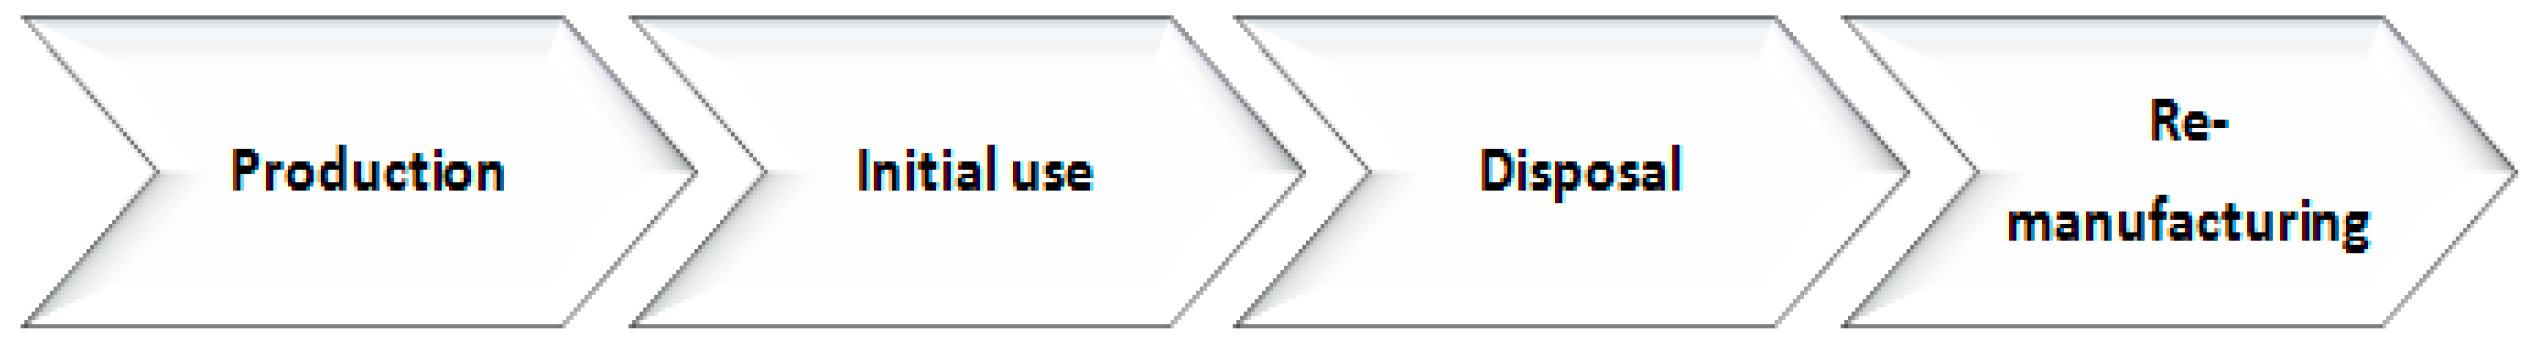
The authors measure the total environmental impacts per product by considering four life-cycle phases: Production, initial use, disposal, and remanufacturing (Figure 2). Accordingly, the authors use i n , i u , i r , and i d to represent the per unit impact per phase of production, use, remanufacturing, and disposal, respectively. It should be noted that remanufacturing operations can extend the life cycle of new products, resulting in the total environmental impact of use by consumers, shown as e u = i u ( q n + q r ) . Additionally, since all products are disposed in landfills whether after usage without remanufacturing or after usage with remanufacturing, then the total environmental impact of disposal should be e d = i d q n . Thus, consistent with Atasu and Souza [38], one can obtain the total environmental impact through e = i n q n + i u ( q n + q r ) + i r q r + i d q n .
Let E T / E O represent the environmental impact of Model T and Model O, respectively. Then, one can summarize the main environmental outcomes with the following proposition:
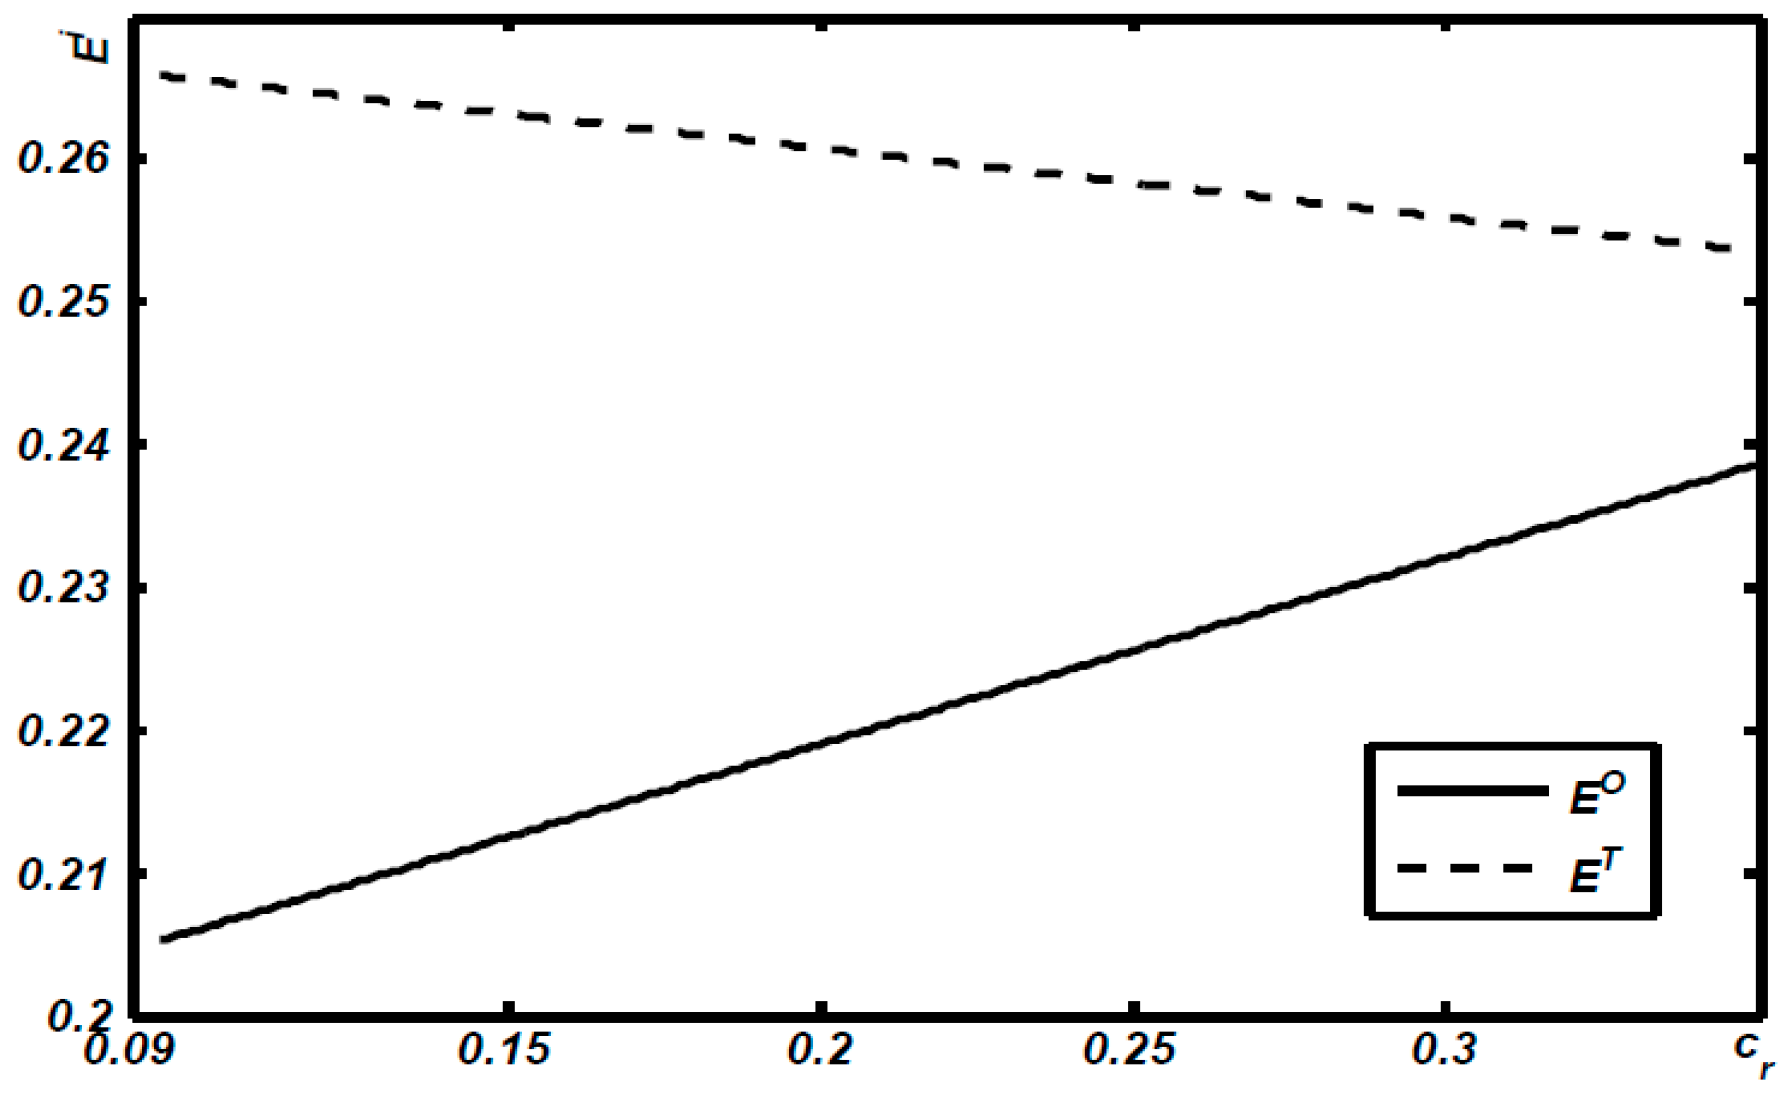
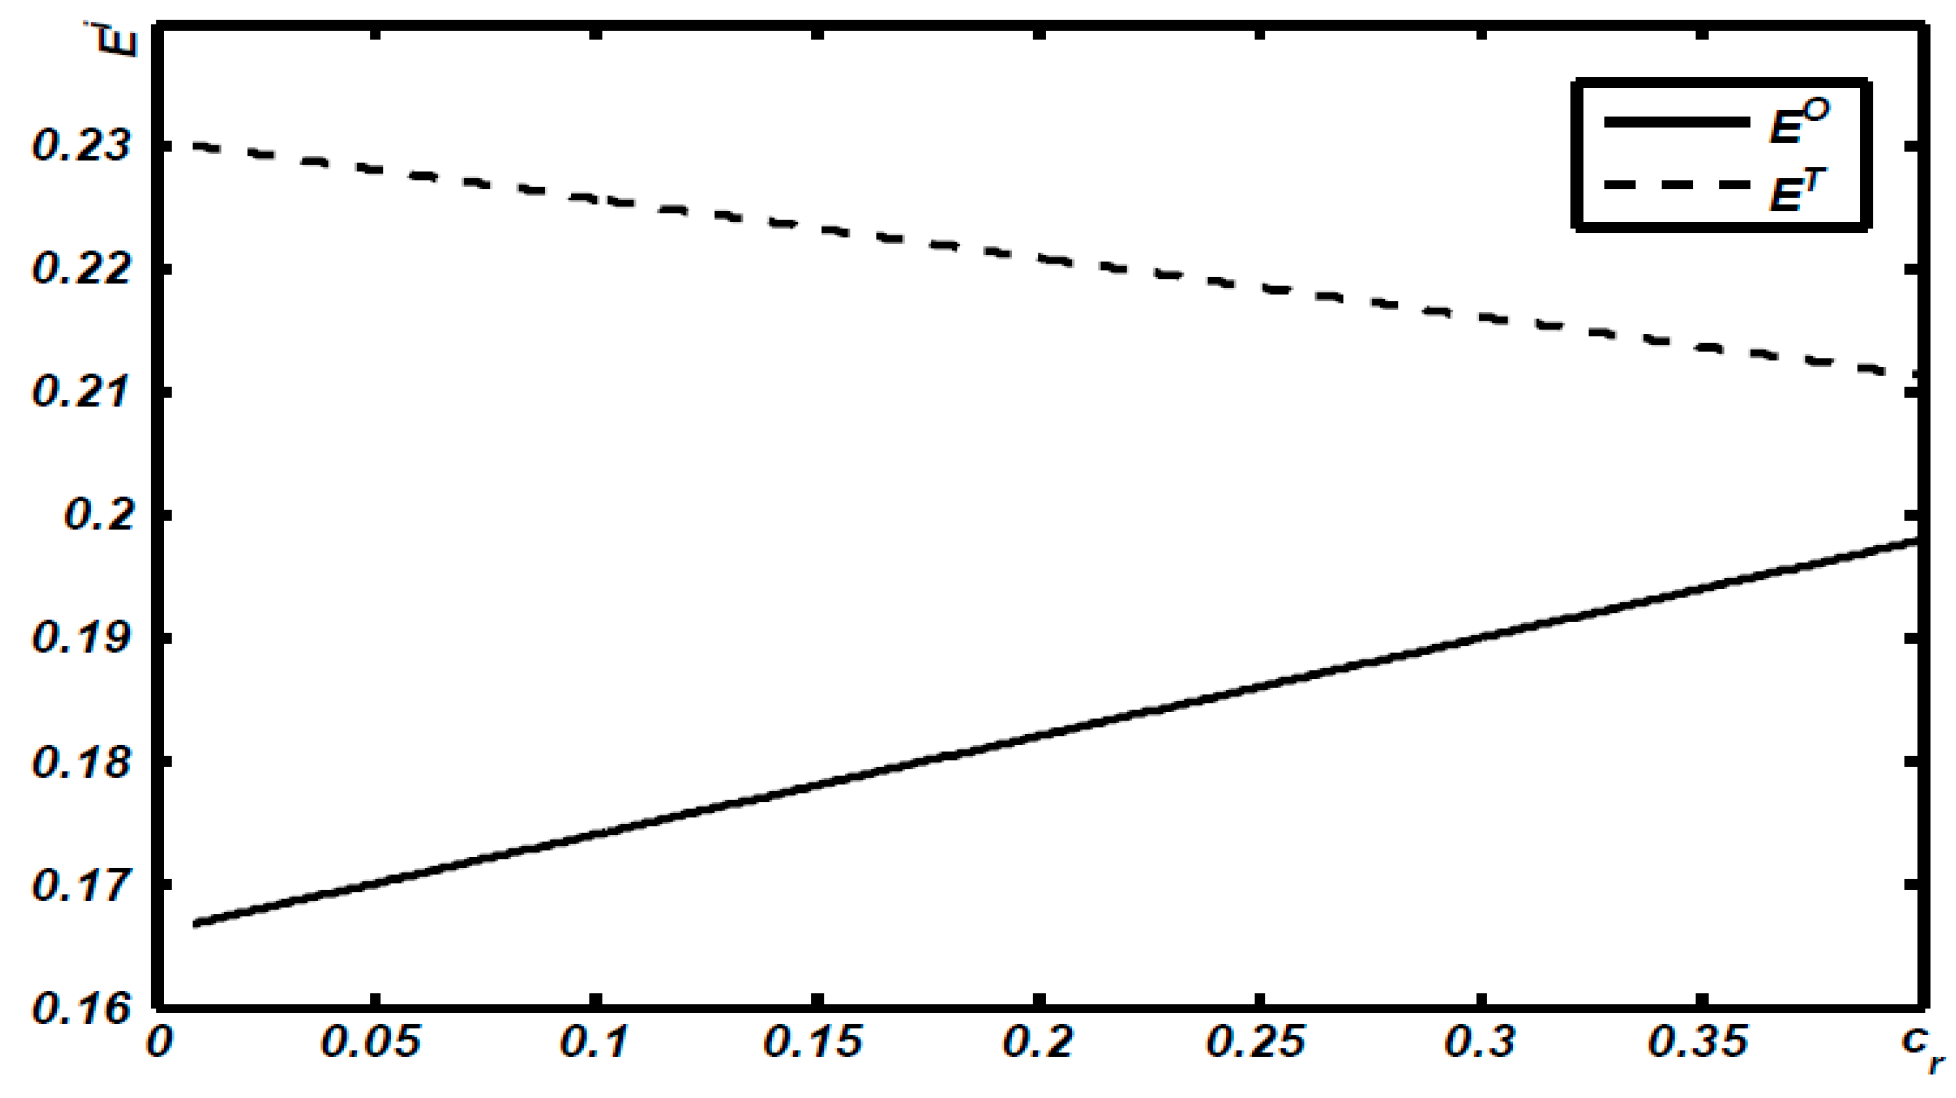
Proposition 7.
Model O is greener than Model T (thus, E O < E T ).
Note that there are two components behind Proposition 7. There is a larger quantity of remanufactured products in Model T, that is, q r O * < q r T * (Proposition 2), meaning that the level of remanufacturing in Model T is higher than that in Model O. This means the environmental impact of the life cycle phases of use (of remanufactured products) and remanufacturing in Model T is higher than that in Model O. Conversely, compared to Model O, there is a larger quantity of remanufactured products in Model T; that is, q r O * < q r T * , meaning that the environmental impact of the life cycle phases of production (of new products), use (of new products), and disposal (of end of life products) in Model T is larger than that in Model O. Table 3 summarizes the difference between Model O and Model T.

6. Numerical Example

The authors have addressed, so far, how differentiated roof policies impact the sustainability issues of the manufacturer’s remanufacturing operations from a theoretical perspective. Now, a numerical study to investigate the above question again is provided. We pick two representative products: Liquid Crystal Display (LCD) monitors and mobile phones, which Life Cycle Assessment (LCA) data are available from the LCA studies in the literature and industry, to represent high and low energy use respectively.

6.1. Parameters Design and Results

6.1.1. LCD Parameters Design

Allowing that γ = 0.85 is the consumer value discount for remanufactured products, this can vary from 45 to 90% [39,40,41]. Esenduran states that the cost of manufacturing new products is c n [ 50 , 150 ] [41]. Consistent with that concept, the authors choose c n = 150 since prior literature on remanufacturing [41] had the ratio of manufacturing cost to market size at values between 0.1 and 0.5. The authors let Q = 375 to be consistent with these past studies. According to Esenduran [42], the authors let the environmental impact of a new product (a remanufactured product) be 2073 (853), thus, i n = 2073 and i u = 853 . Esenduran argued that remanufacturing costs will be caused by remanufacturing capability, thus, denoting the values of remanufacturing cost as 25% and 75% of the manufacturing cost. Thus, it was assumed that i r = 600 . Furthermore, Esenduran [41] showed that the energy consumption for processing a 17-inch screen LCD is i d = 0.226 [41,43], therefore, this study used i d = 0.226 .
Note that potential market size is normalized to 1 in this study, thus, like Esenduran [44] and Yan [23], all parameter values need to be normalized accordingly, such as c n = 0.4 . The consumer value discount for remanufactured products is represented by k = 5 . To ensure 0 < q r < q n , the authors set ( 4 γ 2 4 γ + 8 γ c n + k c n k ) / 4 ( γ + 1 ) < c r < γ c n in Lemma 3, for the numerical examples, 0.094 < c r < 0.36 . We conduct the numerical simulation using Matlab 2014 to obtain all figures, which describes how c r impacts the difference in equilibrium decisions, such as optimal quantities and wholesale prices (see Figure 3), and highlights the results of economic (see Figure 4) and environmental outcomes (see Figure 5).

6.1.2. Mobile Phones Parameters Design

Allowing that γ = 0.8 is the consumer value discount for remanufactured products, this can vary from 45 to 85% [39,40,41]. Ovchinnikov states that the cost of manufacturing new products is c n [ 150 , 300 ] . Consistent with that concept, the authors choose c n = 200 , since prior literature on remanufacturing [20,41,44] had the ratio of manufacturing cost to market size at values between 0.1 and 0.5. The authors let Q = 400 to be consistent with these past studies. According to Esenduran [41], the authors let the environmental impact of a new product (a remanufactured product) be 200 (115), thus, i n = 200 and i u = 115 . Esenduran [41] argued that remanufacturing costs will be caused by remanufacturing capability, thus, denoting the values of the remanufacturing cost as 25% and 75% of the manufacturing cost. Thus, assuming i r = 120 , the values of the remanufacturing cost will be 60% of the manufacturing cost. Furthermore, Nokia and Esenduran found the environmental impact of disposal can vary from 0.005 MJ to 0.007 MJ for its cell phones [41,43], therefore, this study used i d = 0.006 .
Note that the potential market size is normalized to 1 in this study, thus, like Esenduran [44] and Yan [23], all parameter values need to be normalized, such as c n = 0.5 . The consumer value discount for remanufactured products is represented by k = 5 . To ensure 0 < q r < q n , the authors set ( 4 γ 2 4 γ + 8 γ c n + k c n k ) / 4 ( γ + 1 ) < c r < γ c n in Lemma 3, for the numerical examples, 0.0083 < cr < 0.4. We conduct the numerical simulation using Matlab 2014 to obtain all figures, which describes how cr impacts the difference in equilibrium decisions, such as optimal quantities and wholesale prices (see Figure 6), and highlights the results of economic (see Figure 7) and environmental outcomes (see Figure 8).

6.2. Results Analysis of Two Cases

In this section, we compare and analyze the two cases for the economic and environmental impacts.
First, the difference in equilibrium decisions, such as optimal quantities and wholesale prices, are the focus of this sub-section. Based on Figure 3a and Figure 6a, one can find that, consistent with Proposition 1, regarding Model O, the manufacturer is more likely to upwardly distort the wholesale price of remanufactured products (thus, w r O * < w r T * ). Additionally, Figure 3a and Figure 6a further reveal that, as the remanufacturing cost, c r , increases, both wholesale prices increase. Conversely, as illustrated in Figure 3b and Figure 6b, (Figure 3c and Figure 6c), concerning Model O, there is a larger quantity of remanufactured (new) products in Model T, i.e., q r O * < q r T * ( q n O * < q n T * ), an argument that is supported by Propositions 2 and 3.
The authors then show the outcomes of the numerical examples related to the economic sustainability issues.
Figure 4a and Figure 7a allow one to conclude that, when both products are distributed by one retailer (Retailer 1), the manufacturer’s profitability is always lower than that under the scenario of new products sold by Retailer 1, while all remanufactured products are available from Retailer 2. That is, this phenomenon is quite consistent with the theoretical argument discussed in Proposition 4. Additionally, based on Figure 4a and Figure 7b, it is found that, as the remanufacturing cost ( c r ) increases, the manufacturer’s profits in both models decrease. Hence, it can be further derived that the manufacturer’s profits decrease with the remanufacturing cost, c r .
Figure 4b and Figure 7b show that, as the remanufacturing cost increases, both the retailer’s profits under Model O and Retailer 2’s profits in Model T decrease, while, Retailer 1’s profitability in Model T increases. Furthermore, as Proposition 5 indicates, the equilibrium profit of the retailer in Model T is always lower than that in Model O. In addition, Figure 4c and Figure 7c illustrate that, although the total industries’ profits under both models decrease with the remanufacturing cost ( c r = 0 ), as Proposition 6 shows, the industries’ profit in Model T is always lower than that in Model O.
Based on Figure 4 and Figure 7, the authors have reanalyzed sustainability issues related to economic performance. More specifically, the outcomes of the numerical examples are consistent with the theoretical prediction in Propositions 4–6, stating that the equilibrium profit of the manufacturer and industry in Model T is always higher than that in Model O, however, for the retailer, the opposite is true.
Finally, Figure 5 and Figure 8 show the environmental impacts for both models. The environmental impact in Model T is always higher than that in Model O, meaning that Model T will cause a stronger environmental disruption than Model O. As Proposition 6 shows, Model O is always greener than Model T. Furthermore, it can be found that, in Model T, the level of environmental impact decreases with the remanufacturing cost, c r . Quite the opposite, in Model O, the level of environmental impact increases with the remanufacturing cost, c r .

7. Conclusions

Recently, there is significant momentum in the interest for the sustainable movement that requires manufacturers to accept their responsibility in their commercial practice. Accordingly, many brand name manufacturers have created business models of which remanufacturing is an integral part. Although remanufacturing can be considered as having a green environment and resource preservation reputation, a great number of manufacturers are in a difficult position. When incorporating remanufacturing into traditional manufacturing operations, such an operational decision is usually accompanied by a major concern for cannibalization from remanufactured products. Therefore, some manufacturers, including Apple and HP, adopt a “one-roof policy”, by which all new and remanufactured products are sold through one store/chain. Conversely, many manufacturers, such as Dell, adopt a “two-roof policy” where their new products are sold in a store and their remanufactured products in another venue. This raises the question of how differentiated roof policies impact sustainability issues related to remanufacturing operations.
To answer the above strategic question, the authors developed two theoretical models in which OEMs with the potential flexibility to distribute new and remanufactured units (1) through one roof, in which all new and remanufactured products were sold through one store/chain (Model O); or (2) through two roofs, where new products were sold in a store, while the remanufactured products were offered in another locale (Model T). The central result obtained was that, although Model O created more benefits for the environment, OEMs had less incentive to adopt that model because it led to a lower profitability for them. Based on the above results, the authors conclude that, if the OEMs care about economic performance, distributing both products through a two-roof policy is an advantageous strategy. Conversely, if an OEM cares about environmental sustainability, selling both products under one roof is a preferred strategy.
Our model also has some limitations and can be extended in several directions; in fact, these two products may face competition from other manufacturers, such as third-party remanufacturers. Second, our model assumes that all players can make decisions under the condition of complete information, however, in reality, information can be incomplete. Third, we assume that all consumers have a preference for different product qualities, whereas consumers might exhibit different preferences except for product quality.

Author Contributions

Y.L. (Yan Liu) and Y.C. contributed to model development and writing; H.C., S.G., and Y.L. (Yujia Lu) provided motivation cases and strengthened all results’ interpretation. All authors read and approved the final manuscript.

Funding

This research was funded by The National Natural Science Foundation of China (71531003, 71472026, 71672020, 71272127, 71572028 and 71272130), The National Social Science Fund of China (17ZDA051), the Humanities and Social Sciences Foundation for Young Scholars of China’s Ministry of Education (15YJC630154), the funding from Sichuan Province Cyclic Economy Research Center (XHJJ-1801, XHJJ-1803, XHJJ-1805).

Conflicts of Interest

The authors declare no conflict of interest.

Appendix A. Technical Analysis for Both Models

Appendix A.1. Analysis of Model O

Plugging (1) into the retailer’s profit and solving the first-order condition yields q r O * = ( γ w n w r ) 2 ( γ γ 2 ) , q n O * = ( γ 1 w r + w n ) 2 ( γ 1 ) .
After plugging q r O * and q n O * into the manufacturer’s profit and we can obtain the wholesale price of new and remanufactured products w n O * = c n + 1 2 , w r O * = γ ( 4 c r + k + 4 γ + k c n 4 γ c r 4 γ 2 ) 2 ( 4 γ + k 4 γ 2 ) .
Substituting w r O * , w n O * into q r O * , q n O * , (2) and the total profit of the supply chain provides the equilibrium outcome in Model O.

Appendix A.2. Analysis of Model T

Plugging (1) into two retailers’ profit and solving the first-order condition yields q r T * = ( γ 2 w r γ w n ) ( 4 γ γ 2 ) , q n T * = ( γ 2 w r + 2 w n ) ( γ 4 ) .
After plugging q r T * and q n T * into the manufacturer’s profit and we can obtain the wholesale price of new and remanufactured products w n T * = c n + 1 2 , w r T * = γ ( 8 c r + 3 k + 8 γ + k c n 2 γ c r 2 γ 2 ) 4 ( 4 γ + k γ 2 ) .
Substituting w r T * , w n T * into q r T * , q n T * , (3) and the total profit of the supply chain provides the equilibrium outcome in Model T.

Appendix A.3. Analysis of Lemma 3

Solving 0 < q r O * < q n O * , gives k c n k 4 γ + 8 γ c n + 4 γ 2 4 γ + 4 < c r < γ c n .
Solving 0 < q r T * < q n T * , gives k c n k 2 γ + 6 γ c n + 2 γ 2 2 γ + 4 < c r < γ c n .
Comparing above inequalities, we find that, when k c n k 4 γ + 8 γ c n + 4 γ 2 4 γ + 4 < c r < γ c n , both 0 < q r O * < q n O * and 0 < q r T * < q n T * are satisfied.
To further facilitate our analysis of following proofs, we let a = k c n k 4 γ + 8 γ c n + 4 γ 2 4 γ + 4 and b = γ c n .

Appendix B. All Proofs for Propositions

Proof of Proposition 1.
To prove w r T * > w r O * , we have to show that:
γ ( 8 c r + 3 k + 8 γ + k c n 2 γ c r 2 γ 2 ) ( 4 γ 2 + 16 γ + 4 k ) γ ( 4 c r + k + 4 γ + k c n 4 γ c r 4 γ 2 ) ( 8 γ 2 + 8 γ + 2 k ) > 0
After simplification, we have that ( k γ ( k c n k + 4 γ c n 6 γ c r + 2 γ 2 c n + 4 γ 2 4 γ ) ) 4 ( 4 γ + k 4 γ 2 ) ( 4 γ + k γ 2 ) > 0 , which is true by Lemma 3. That is to say, for any c r ( a , b ) , w r T * > w r O * is always holds.
We show that w n O * = w n T * = c n + 1 2 , which is true by Lemma 3. That is to say, for any c r ( a , b ) , w n O * = w n T * is always holds. □
Proof of Proposition 2.
To prove q r T * > q r O * , we have to show that: c n γ 2 c r + γ 8 γ + 2 k 2 γ 2 c n γ c r 4 γ + k 4 γ 2 > 0 .
After simplification, we have that γ ( k c n 4 γ k + 4 γ c n 6 γ c r + 2 γ 2 c n + 4 γ 2 ) 2 ( 4 γ + k γ 2 ) ( 4 γ + k 4 γ 2 ) > 0 , which is true by Lemma 3. That is to say, for any c r ( a , b ) , q r T * > q r O * is always holds. □
Proof of Proposition 3.
To prove q n T * > q n O * , we have to show that: k + 4 γ k c n 4 γ c n + 2 γ c r 2 γ 2 16 γ 4 γ 2 + 4 k k + 4 γ k c n 4 γ c n + 4 γ c r 4 γ 2 4 γ 4 γ 2 + k > 0 .
After simplification, we have that γ ( 12 γ 2 c n 8 γ c r k γ 2 k c r 4 γ 2 c r 4 γ 2 + 4 γ 3 + 3 k γ c n ) 4 ( 4 γ + k 4 γ 2 ) ( 4 γ + k γ 2 ) > 0 , which is true by Lemma 3. That is to say, for any c r ( a , b ) , q n T * > q n O * is always holds. □
Proof of Proposition 4.
To prove Proposition 4, after simplification, we show that:
Π m T * Π m O * = γ [ 12 γ 2 c n 2 + 3 k γ c n 2 8 γ 2 c n c r 16 γ c n c r 4 k c n c r + 8 γ 3 c n k γ 8 γ 2 c n 2 k γ c n + 12 γ c r 2 16 γ 2 c r + 16 γ c r + 4 k c r + 4 γ 3 4 γ 2 ] 8 ( 4 γ + k 4 γ 2 ) ( 4 γ + k γ 2 )
For estimating size of Π m T * Π m O * , we have to determine the sign of Q = [ 12 γ 2 c n 2 + 3 k γ c n 2 8 γ 2 c n c r 16 γ c n c r 4 k c n c r + 8 γ 3 c n k γ 8 γ 2 c n 2 k γ c n + 12 γ c r 2 16 γ 2 c r + 16 γ c r + 4 k c r + 4 γ 3 4 γ 2 ] . After Calculation, we gain that Q < 0 when c r ( a , b ) .
That is to say, for any c r ( a , b ) , Π m T * > Π m O * is always holds. □
Proof of Proposition 5.
To prove Π r O * > Π r 1 T * , we have to show that
Π r O * Π r 1 T * = [ r ( ( 32 c n + 48 ) γ 7 + ( 32 c n c r + 16 c n 2 128 c r 64 c n 224 ) γ 6 + ( 16 c n k + 80 c r 2 + 32 c n c r + 304 + 8 c n 2 k + 112 c n 2 + 512 c r 56 k + 32 c n ) γ 5 + ( 256 c n c r + 16 c n k 128 c n 2 272 c r 2 + 24 c n 2 k + 152 k + 128 c r k 128 640 c r ) γ 4 + ( 256 c n c r 96 k + 256 c r 64 c r 2 k + 19 k 2 32 c n 2 k c n 2 k 2 64 c n c r k + 2 c n k 2 320 c r k + 448 c r 2 ) γ 3 + ( 192 c r k + 64 c n c r k 256 c r 2 + 192 c r 2 k + 8 c n 2 k 2 40 c r k 2 24 k 2 ) γ 2 + ( 2 c n 2 k 3 128 c r 2 k + 20 c r 2 k 2 + 48 c r k 2 16 c n c r k 2 2 k 3 ) γ 16 c r 2 k 2 4 c n k 3 c r + 4 k 3 c r ) ] 16 ( 4 γ 2 4 γ k ) 2 ( γ 2 4 γ k ) 2 > 0 ,
which is true by Lemma 3. That is to say, for any c r ( a , b ) , Π r O * > Π r 1 T * is always holds.
To prove Π r O * > Π r 2 T * , we have to show that
Π r O * Π r 2 T * = [ ( ( 1 2 c n ) γ 8 + ( 5 c n 2 + 12 c n + 2 c n c r 14 ) γ 7 + ( 5 / 2 k + 41 50 c n + 17 c n 2 c r 2 + 5 c n k 2 c n c r + 16 c r 1 / 2 c n 2 k ) γ 6 + ( 7 c r 2 + 37 / 2 k + 72 c n 44 28 c n 2 + 17 / 2 c n 2 k 29 c n k 4 c n c r k + 16 c n c r 32 c r ) γ 5 + ( 33 / 16 k 2 + 16 c n 2 16 c n c r + 2 c r 2 k + 12 c n c r k + 17 / 16 c n 2 k 2 33 / 8 c n k 2 + 56 c n k 8 c r k + 8 c r 2 32 k 24 c n 2 k + 16 c r 32 c n + 16 ) γ 4 + ( 2 c r 2 k 32 c n k + 29 / 2 c n k 2 + 2 c n c r k 2 27 / 4 c n 2 k 2 + 8 c r k 8 c n c r k + 16 k + 16 c n 2 k 31 / 4 k 2 ) γ 3 + ( 5 / 8 k 3 12 c n k 2 + 6 k 2 c r 2 k 2 + 5 / 4 c n k 3 c n c r k 2 5 / 8 c n 2 k 3 + c r k 2 + 6 c n 2 k 2 ) γ 2 + ( 2 c n k 3 + c n 2 k 3 + k 3 ) γ + 1 / 16 c n 2 k 4 + 1 / 16 k 4 1 / 8 c n k 4 ) ] ( 4 γ 2 4 γ k ) 2 ( γ 2 4 γ k ) 2 > 0 ,
which is true by Lemma 3. That is to say, for any c r ( a , b ) , Π r O * > Π r 2 T * is always holds. □
Proof of Proposition 6.
To prove Π t T * > Π t O * , we have to show that S = ( Π m T * + Π r 1 T * + Π r 2 T * ) ( Π m O * + Π r O * ) > 0 . After simplification, we have that:
S = γ [ 4 γ k 3 c n 2 29 k 2 γ 3 c n 2 + 60 k 2 γ 2 c n 2 + 16 k γ 5 c n 2 232 k γ 4 c n 2 + 288 k γ 3 c n 2 464 γ 5 c n 2 + 448 γ 4 c n 2 + 24 k 2 γ 2 c n c r 64 k 2 γ c n c r + 48 k γ 4 c n c r + 128 k γ 3 c n c r 320 k γ 2 c n c r 32 γ 6 c n c r + 416 γ 5 c n c r + 128 γ 4 c n c r 512 γ 3 c n c r 4 k 3 γ c n + 34 k 2 γ 3 c n 56 k 2 γ 2 c n 80 k γ 5 c n + 336 k γ 4 c n 256 k γ 3 c n 448 γ 6 c n + 800 γ 5 c n 384 γ 4 c n + 4 k 2 γ c r 2 56 k γ 3 c r 2 + 128 k γ 2 c r 2 + 16 γ 5 c r 2 464 γ 4 c r 2 + 16 γ 6 c n 2 32 k 2 γ 2 c r + 64 γ k 2 c r + 64 γ 4 k c r 384 γ 3 k c r + 320 γ 2 k c r + 512 γ 5 c r 1024 γ 4 c r + 512 γ 3 c r γ 3 c r 2 + 8 k γ 5 + 24 k γ 4 32 k γ 3 16 γ 7 32 γ 6 + 112 γ 5 64 γ 4 4 k 2 γ 2 + 4 k 3 c r + 32 γ 7 c n + 448 γ 3 c r 2 4 k 3 c r c n ] 16 ( 4 γ + k 4 γ 2 ) 2 ( 4 γ + k γ 2 ) 2
For estimating size of S, we have to determine the sign of U = [ 4 γ k 3 c n 2 29 k 2 γ 3 c n 2 + 60 k 2 γ 2 c n 2 + 16 k γ 5 c n 2 232 k γ 4 c n 2 + 288 k γ 3 c n 2 464 γ 5 c n 2 + 448 γ 4 c n 2 + 24 k 2 γ 2 c n c r 64 k 2 γ c n c r + 48 k γ 4 c n c r + 128 k γ 3 c n c r 320 k γ 2 c n c r 32 γ 6 c n c r + 416 γ 5 c n c r + 128 γ 4 c n c r 512 γ 3 c n c r 4 k 3 γ c n + 34 k 2 γ 3 c n 56 k 2 γ 2 c n 80 k γ 5 c n + 336 k γ 4 c n 256 k γ 3 c n 448 γ 6 c n + 800 γ 5 c n 384 γ 4 c n + 4 k 2 γ c r 2 56 k γ 3 c r 2 + 128 k γ 2 c r 2 + 16 γ 5 c r 2 464 γ 4 c r 2 + 16 γ 6 c n 2 32 k 2 γ 2 c r + 64 γ k 2 c r + 64 γ 4 k c r 384 γ 3 k c r + 320 γ 2 k c r + 512 γ 5 c r 1024 γ 4 c r + 512 γ 3 c r γ 3 c r 2 + 8 k γ 5 + 24 k γ 4 32 k γ 3 16 γ 7 32 γ 6 + 112 γ 5 64 γ 4 4 k 2 γ 2 + 4 k 3 c r + 32 γ 7 c n + 448 γ 3 c r 2 4 k 3 c r c n ] . After Calculation, we gain that U < 0 when c r ( a , b ) .
That is to say, for any c r ( a , b ) , Π t T * > Π t O * is always holds. □
Proof of Proposition 7.
Since the returned core’s disposal impact can be eliminated by remanufacturing, the total disposal impact of new products is e n = I n ( q n q r ) ; meanwhile, the total disposal impact of remanufactured products is e r = I r q r . Thus the total environmental impact in Model O and Model T are as follows respectively,
E O = I n q n O * + I r q r O * + I u ( q n O * + q r O * ) + I d q n O * = q n O * ( I n + I u + I d ) + ( I u + I r ) q r O *
E T = I n q n T * + I r q r T * + I u ( q n T * + q r T * ) + I d q n T * = q n T * ( I n + I u + I d ) + ( I u + I r ) q r T *
We can easily show that E T E O > 0 , because q n T * > q n O * , q r T * > q r O * . Thus E T > E O which means that Model O is greener than Model T. □

References

  1. Toffel, M.W. The Growing Strategic Importance of End-of-Life Product Management. Calif. Manag. Rev. 2003, 45, 102–129. [Google Scholar] [CrossRef]
  2. European Commission. Attitudes of Europeans Citizens towards the Environment. 2008. Available online: http://www.ec.europa.eu/public_opinion/archives/ebs/ebs_295_en.pdf (accessed on 18 October 2017).
  3. Yan, W.; Chai, J.; Qian, Z.; Tsai, S.B.; Chen, H.; Xiong, Y. Operational Decisions on Remanufacturing Outsourcing Involved with Corporate Environmental and Social Responsibility—A Sustainable Perspective. Sustainability 2018, 10, 1132. [Google Scholar] [CrossRef]
  4. Bulmus, S.C.; Zhu, S.X.; Teunter, R. Competition for cores in remanufacturing. Eur. J. Oper. Res. 2014, 233, 105–113. [Google Scholar] [CrossRef]
  5. Apple. Apple Certified Refurbished. 2018. Available online: https://www.apple.com/shop/browse/home/specialdeals (accessed on 10 July 2018).
  6. IBM. Refurbished Equipment and Asset Buyback. 2018. Available online: https://www-356.ibm.com/partnerworld/wps/servlet/ContentHandler/igf_com_fin_gars/lc=en_US (accessed on 10 July 2018).
  7. Cannon. Remanufacturing, Recycling of Used Products. Available online: http://global.canon/en/environment/circulation/recycle.html (accessed on 10 July 2018).
  8. HP. HPE Renew: Affordable, Remanufactured Products That Are as Good as New. Available online: https://h20195.www2.hpe.com/v2/getpdf.aspx/4AA3-1821EEE.pdf (accessed on 10 July 2018).
  9. Atasu, A.; Guide, V.D.R., Jr.; Van Wassenhove, L.N. So what if remanufacturing cannibalizes my new product sales? Calif. Manag. Rev. 2010, 52, 56–76. [Google Scholar] [CrossRef]
  10. Agrawal, V.V.; Ferguson, M.; Souza, G.C. Trade-In Rebates for Price Discrimination and Product Recovery. IEEE Trans. Eng. Manag. 2016, 63, 326–339. [Google Scholar] [CrossRef]
  11. Ovchinnikov, A. Revenue and Cost Management for Remanufactured Products. Prod. Oper. Manag. 2011, 20, 824–840. [Google Scholar] [CrossRef]
  12. Wang, Z.B.; Wang, Y.Y.; Wang, J.C. Optimal distribution channel strategy for new and remanufactured products. Electron. Commer. Res. 2016, 16, 269–295. [Google Scholar] [CrossRef]
  13. Zhang, X.; Cao, Y. Selling Vertically Differentiated Products under One Roof or Two? A Signaling Model of a Retailer’s Roof Policies. J. Retail. 2014, 90, 538–551. [Google Scholar] [CrossRef]
  14. Seuring, S.; Müller, M. From a literature review to a conceptual framework for sustainable supply chain management. J. Clean. Prod. 2008, 16, 1699–1710. [Google Scholar] [CrossRef]
  15. Srivastava, S.K. Green supply-chain management: A state-of-the-art literature review. Int. J. Manag. Rev. 2007, 9, 53–80. [Google Scholar] [CrossRef]
  16. Chaabane, A.; Ramudhin, A.; Paquet, M. Design of sustainable supply chains under the emission trading scheme. Int. J. Prod. Econ. 2012, 135, 37–49. [Google Scholar] [CrossRef]
  17. Wilhelm, M.M.; Blome, C.; Bhakoo, V.; Paulraj, A. Sustainability in multi-tier supply chains: Understanding the double agency role of the first-tier supplier. J. Oper. Manag. 2016, 41, 42–60. [Google Scholar] [CrossRef]
  18. Rajeev, A.; Pati, R.K.; Padhi, S.S.; Govindan, K. Evolution of sustainability in supply chain management: A literature review. J. Clean. Prod. 2017, 162, 299–314. [Google Scholar] [CrossRef]
  19. Reefke, H.; Sundaram, D. Key themes and research opportunities in sustainable supply chain management—Identification and evaluation. Omega 2017, 66, 195–211. [Google Scholar] [CrossRef]
  20. Ovchinnikov, A.; Blass, V.; Raz, G. Economic and Environmental Assessment of Remanufacturing Strategies for Product+Service Firms. Prod. Oper. Manag. 2014, 23, 744–761. [Google Scholar] [CrossRef]
  21. Zhang, Z.Z.; Wang, Z.J.; Liu, L.W. Retail Services and Pricing Decisions in a Closed-Loop Supply Chain with Remanufacturing. Sustainability 2015, 7, 2373–2396. [Google Scholar] [CrossRef] [Green Version]
  22. Golinska, P.; Kosacka, M.; Mierzwiak, R.; Werner-Lewandowska, K. Grey Decision Making as a tool for the classification of the sustainability level of remanufacturing companies. J. Clean. Prod. 2015, 105, 28–40. [Google Scholar] [CrossRef]
  23. Yan, W.; Li, H.; Chai, J.; Qian, Z.; Chen, H. Owning or Outsourcing? Strategic Choice on Take-Back Operations for Third-Party Remanufacturing. Sustainability 2018, 10, 151. [Google Scholar] [CrossRef]
  24. Desai, P.S. Quality Segmentation in Spatial Markets: When Does Cannibalization Affect Product Line Design? Mark. Sci. 2001, 20, 265–283. [Google Scholar] [CrossRef]
  25. Matsubayashi, N. Price and quality competition: The effect of differentiation and vertical integration. Eur. J. Oper. Res. 2007, 180, 907–921. [Google Scholar] [CrossRef]
  26. Ailawadi, K.L.; Pauwels, K.; Steenkamp, J.B.E.M. Private-Label Use and Store Loyalty. J. Mark. 2008, 72, 19–30. [Google Scholar] [CrossRef] [Green Version]
  27. Joshi, Y.V.; Reibstein, D.J.; Zhang, Z.J. Turf wars: Product line strategies in competitive markets. Mark. Sci. 2016, 35, 1–14. [Google Scholar] [CrossRef]
  28. Savaskan, R.C.; Bhattacharya, S.; Van Wassenhove, L.N. Closed-Loop Supply Chain Models with Product Remanufacturing. Manag. Sci. 2004, 50, 239–252. [Google Scholar] [CrossRef]
  29. Xiong, Y.; Zhou, Y.; Li, G.; Chan, H.K.; Xiong, Z. Don’t forget your supplier when remanufacturing. Eur. J. Oper. Res. 2013, 230, 15–25. [Google Scholar] [CrossRef]
  30. Yan, W.; Xiong, Y.; Xiong, Z.; Guo, N. Bricks vs. clicks: Which is better for marketing remanufactured products? Eur. J. Oper. Res. 2015, 242, 434–444. [Google Scholar] [CrossRef]
  31. Zou, Z.B.; Wang, J.J.; Deng, G.S.; Chen, H. Third-party remanufacturing mode selection: Outsourcing or authorization? Transp. Res. Part. E Logist. Transp. Rev. 2016, 87, 1–19. [Google Scholar] [CrossRef]
  32. Johnson, J.P.; Myatt, D.P. Multiproduct Cournot Oligopoly. Rand J. Econ. 2006, 37, 583–601. [Google Scholar] [CrossRef]
  33. Debo, L.G.; Toktay, L.B.; Wassenhove, L.N.V. Joint Life-Cycle Dynamics of New and Remanufactured Products. Prod. Oper. Manag. 2010, 15, 498–513. [Google Scholar] [CrossRef]
  34. Ferguson, M.E.; Toktay, L.B. The effect of competition on recovery strategies. Prod. Oper. Manag. 2006, 15, 351–368. [Google Scholar] [CrossRef]
  35. Xiong, Y.; Yan, W. Implications of channel structure for marketing remanufactured products. Eur. J. Ind. Eng. 2016, 10, 126. [Google Scholar] [CrossRef]
  36. Giutini, R.; Gaudette, K. Remanufacturing: The next great opportunity for boosting US productivity. Bus. Horiz. 2003, 46, 41–48. [Google Scholar] [CrossRef]
  37. Taticchi, P.; Tonelli, F.; Pasqualino, R. Performance measurement of sustainable supply chains: A literature review and a research agenda. Int. J. Prod. Perform. Manag. 2013, 62, 782–804. [Google Scholar] [CrossRef]
  38. Atasu, A.; Souza, G.C. How Does Product Recovery Affect Quality Choice? Prod. Oper. Manag. 2013, 22, 991–1010. [Google Scholar] [CrossRef]
  39. Subramanian, R.; Subramanyam, R. Key Factors in the Market for Remanufactured Products. Manuf. Serv. Oper. Manag. 2012, 14, 315–326. [Google Scholar] [CrossRef]
  40. Hauser, W.; Lund, R.T. Remanufacturing: An American Resource. Available online: http://www.bu.edu/reman/RemanSlides.pdf (accessed on 10 July 2018).
  41. Esenduran, G.; Kemahlu-Ziya, E.; Swaminathan, J.M. Take-Back Legislation: Consequences for Remanufacturing and Environment. Decis. Sci. 2016, 47, 219–256. [Google Scholar] [CrossRef]
  42. Environmental Protection Agency (EPA). Desktop Computer Displays a Life-Cycle Assessment. 2013. Available online: http://www.epa.gov/dfe/pubs/comp-dic/lca/ (accessed on 10 July 2018).
  43. Nokia. Integrated Product Policy Pilot Project. Stage I Final Report: Options for Improving Life-Cycle Environmental. Performance of Mobile Phones; Nokia Corporation: Espoo, Finland, 2005. [Google Scholar]
  44. Esenduran, G.; Kemahlıoğlu-Ziya, E.; Swaminathan, J.M. Impact of Take-Back Regulation on the Remanufacturing Industry. Prod. Oper. Manag. 2017, 26, 924–944. [Google Scholar] [CrossRef]
Figure 1. Two basic models. (a) Model O and (b) Model T.
Sustainability 10 02427 g001
Figure 2. Life-cycle flow: A product with remanufacturing.
Sustainability 10 02427 g002
Figure 3. Effects of c r on related parameters. (a) Effects of c r on w r i * ; (b) effects of c r on q r i * ; and (c) effects of c r on q n i * .
Sustainability 10 02427 g003
Figure 4. Effects of c r on the economic outcomes. (a) Effects of c r on Π m i * ; (b) effects of c r on Π r i * ; and (c) effects of c r on Π t i * .
Sustainability 10 02427 g004
Figure 5. Effects of c r on environmental outcomes.
Sustainability 10 02427 g005
Figure 6. Effects of c r on related parameters. (a) Effects of c r on w r i * ; (b) effects of c r on q r i * ; and (c) effects of c r on q n i * .
Sustainability 10 02427 g006
Figure 7. Effects of c r on the economic outcomes. (a) Effects of c r on Π m i * ; (b) effects of c r on Π r i * ; and (c) effects of c r on Π t i * .
Sustainability 10 02427 g007aSustainability 10 02427 g007b
Figure 8. Effects of c r on environmental outcomes.
Sustainability 10 02427 g008
Table 1. The conclusion of all related literature.
Related LiteratureRef Source’ No.Issue StudiedInsights
Relationship between sustainability and the supply chain1 Srivastava [15]Green Supply ChainIntegrated environmental thinking into supply chain management.
2 Chaabane [16]Sustainable Supply ChainDeveloped mixed-integer linear programming based framework for a sustainable supply chain.
3 Wilhelm [17]Sustainable Supply ChainEmployed agency and institutional theory arguments to explore the conditions
4 Rajeev [18]SustainabilityProposed a conceptual framework to classify various factors along the triple bottom line pillars of sustainability issues in the context of supply chains.
5 Reefke [19]Sustainability; Supply ChainConfirmed, questioned, and extended the knowledge on sustainable supply chain management.
Sustainability issues in operations management6 Ovchinnikov [20]RemanufacturingRevealed that remanufacturing is usually a highly beneficial activity.
7 Zhang et al. [19]Channel DistributionShowed that retail services have a great impact on the manufacturer’s and the retailer’s pricing strategies.
8 Golinska [19]Remanufacturing ProcessProvided a new tool for remanufacturing operations and for identifying and prioritizing operations in companies needing improvement.
9 Yan [19]RemanufacturingHighlighted the question of whether OEMs should also outsource their reverse channels to third-party remanufacturers when outsourcing remanufacturing.
The market competition related to roof policy10 Desai [24]SegmentationDemonstrated that, as the taste preferences of the low-valuation segment become weaker, it is more attractive for high-valuation consumers.
11 Matsubayashi [19]Product DifferentiationStudied an instance of price and quality competition between firms.
12 Ailawadi [19]Share of walletDeveloped a model of the relationship between a household’s private-label share and its store loyalty.
13 Zhang [13]Roof PolicyExplored the implications of roof policy for its quality signaling strategies.
14 Joshi [27]SegmentationShowed that a firm might offer a broader product line to attract a higher demand or charge a higher price.
Table 2. Notations used in both models.
NotationDefinition
γ The consumer value discount for remanufactured products
c n / c r The unit production cost of the new/remanufactured component
k The scaling parameter
p n i / p r i The new/remanufactured product price in Model i, i ( O , T )
q n i / q r i The quantity of new/remanufactured products in Model i, i ( O , T )
w n i / w r i The wholesale price of new/remanufactured component in Model i, i ( O , T )
Π x i The player x’s profit in Model i, x ( m , r 1 , r 2 , t ) , i ( O , T )
I n The environmental impact of a new product
I r The environmental impact of a remanufactured product
I u The environmental impact of usage
I d The environmental impact of disposal
E i The environmental impacts in Model i, i ( O , T )
Table 3. Summarization of the difference between Models O and T.
Model O Model TPropositions
w r O * < w r T * 1. The manufacturer upwardly distorts the wholesale price of remanufactured products
w n O * = w n T * The wholesale price of new products is immune to distortion
q r O * < q r T * 2. There is a larger quantity of remanufactured products in Model T
q n O * < q n T * 3. There is a larger quantity of new products in Model T
Π m O * < Π m T * 4. The manufacturer benefits more in Model T
Π r O * > Π r 1 T * / Π r 2 T * 5. The retailer benefits more in Model O
Π t O * < Π t T * 6. The industry benefits more in Model T
E O < E T 7. Model O is greener than Model T

