1. Introduction
Efficient functioning of transportation systems in cities depends on a proper implementation of measures that enable effective management of the processes taking place in the subsystems, as well as on their correlation with the whole urban system. The complexity of structural interdependencies and considerable heterogeneity implies the need to focus on efficient methods that help identify appropriate measures that take into account the expectations of different stakeholders engaged in functioning of urban freight transport (UFT) systems (e.g., transport system users, local or regional administration, business entities, logistics operators, etc.).
According to the author of [
1], a city, being a system of economic entities, operates and develops as a result of a variety of activities performed by each of these entities to fulfil specific functions, striving to achieve their objectives. It is important to underline that the objectives of individual entities are generally diverse, often leading to a conflict of interest [
1]. This is particularly important for appropriate management of urban freight transport systems and implementation of city logistics measures. Lack of consensus between the expectations of different groups of stakeholders is a major barrier for proper functioning of these processes.
In recent years, several international projects and activities have focused on proper implementation of measures in urban freight transport; for example, BestUFS [
2], TRAILBLAZER [
3], SUGAR [
4], C-LIEGE [
5], STRAIGHTSOL [
6], COFRET [
7], GRASS [
8], and the new NOVELOG project that is currently underway [
9]. These projects developed different methodological approaches that could help in the decision -making process. This paper is focused on the application of the multi-criteria decision analysis (MCDA) to support the choice of measures to be implemented in the UFT system, including the point of view of different stakeholders.
Diverse expectations of stakeholders and complexity of the system affect the structure of the decision-making process in the UFT area. The approach, where different and usually conflicting with objectives of various stakeholder groups, are called the multi-actor multi-criteria analysis (MAMCA) [
10]. The major difference of this methodology compared to other typical multi-criteria decision analyses is the introduction of different stakeholder groups at a very early stage in the decision-making process [
11].
The major objective of this paper is to introduce the Analytic Hierarchy Process (AHP) as well as the Decision Making Trial and Evaluation Laboratory Method (DEMATEL) as efficient analyses and decision-making methods to choose UFT measures in the context of sustainable development. The presented approach was successfully applied in the Szczecin Municipality (Poland) during the implementation of a sustainable UFT system in the city area. Based on the results, the most appropriate solutions were chosen.
The approach presented in this paper could support decision-makers in cities. A critically important part of the multi-criteria decision process is a proper analysis of the correlations between the criteria. The results of the comparative analysis of the criteria introduced in this paper could help simplify the decision process. The research value and novelty of the paper is the simultaneous utilization of AHP and DEMATEL methods for the assessment of chosen sustainable city logistics measures.
According to Saaty [
12], the four main advantages of the AHP method are:
Integrates statistic data and people’s opinions about various factors
Combines different assessments and resolves disagreements between them
Quantitatively handles different types of relations in a network
Offers powerful forecast planning that includes assessments of all crucial elements
The DEMATEL method helps decision-makers prioritize improvement processes.
The above-mentioned methods have the advantage of quantifying the subjective judgments of the respondents in a way that can be measured and evaluated [
13]. These methods should be implemented together; a single method is not efficient to enable a complete and correct analysis of the problem. AHP focuses only on the hierarchy structure and leads to linear actions. Based on this method, stakeholders will make a decision without considering the interdependencies between the factors. It does not care about the influences and effects that each of them has on other factors. On the other hand, using only the DEMATEL method can lead to a passive attitude. It focuses more on interdependencies. It is not always clear which coefficients are the most important. Without this kind of prioritization, this kind of analysis is useless for stakeholders. It is difficult to determine the best measures for the distribution of goods in Szczecin region and the best strategy for sustainable development. As a result, a bad decision could be made and resources could be wrongly allocated.
2. Decision-Making Process in Urban Freight Transport Systems as Multi-Criteria Decision Analysis (MCDA)
A growing number of users (residents, visitors or companies operating in it) leads to an increase in the demand for transport of goods—raw materials, semi-finished products, finished products, as well as industrial and municipal waste [
14]. The largest part of this transport is generated by industrial, commercial, and service entities. The distribution initiated by these companies increases the logistics flows in a limited area. Urban areas are important centres of economic activity and innovation. Transportation of goods is essential for the proper functioning of a modern urban society. No urban area can function without an adequate freight transport system, due to the need for replenishment of food and other goods in retail stores, delivery of documents and parcels, and other accessories necessary for everyday functioning of offices.
2.1. Urban Freight Transport as a City Sub-System
The city can be defined as a dynamically changing open system [
15]. It includes two key subsystems: Physical (buildings connected by streets, roads and infrastructure), and human (traffic, interactions and activities of its residents) [
16].
The purpose of any urban system is to serve its residents and visitors. Its implementation, however, depends on proper cooperation between urban subsystems, in line with the principle of synergy. Bearing in mind that relationships between elements are constantly changing the system as a whole and include many interrelated and interdependent elements, we can say that the logistics and transport functions performed by the city form a system, which may include transport of material goods and media transmission, transport and storage of municipal waste, collective and individual transport, storage of goods in the industrial and commercial districts and trade chains of the city, and control of the flow of goods and persons [
17].
It should be emphasized that differentiation between the city’s subsystems depends on the adopted interpretation. In the above example, the adopted criterion includes logistic functions performed by the individual subsystems. From a spatial perspective, a logistics system of the city can be divided into: Subsystem of the city centre, subsystem of suburban areas or industrial areas, subsystem of residential zones and others depending on the urban structure, delimitation of individual areas, the nature and specifics of the city, and so on. With regard to the implementation of transport processes, two major subsystems should be emphasized: Passenger transport, and freight transport.
Locating urban freight transport in the logistics system of the city requires its extraction from the goods transport subsystem, while stressing on strong correlation with goods and persons flow control subsystem. It can be assumed that urban freight transport is a set of the following components (
Figure 1) [
15]:
Transportation
Storage and selling points, goods processing, and types of movements executed
Handling, and types and requisites of handling along the physical flows
Location and management of the basic infrastructure for physical flow processing, including warehouse activities of inbound and outbound goods
Logistics information systems activities
System complexity is determined by four key elements [
18]: Purpose and function, size and configuration, structure (including the composition and layout), and type of growth (dynamics). By emphasizing on components included in the urban freight transport system, it can be described as follows:
where:
SUFT urban freight transport system;
U set of stakeholders (the system users), being U = {UR, US, UC, UA, UM}, where:
UR residents,
US shippers,
UC freight carriers,
UA administration;
UM manufacturers;
Gm,n volume of the demand for goods, declared by m-th purchaser from n-th supplier, where ;
V set of transport means (delivery vehicles);
P storage and selling points, goods processing and types of movements executed;
W location and management of the basic infrastructure for the physical flows processing;
Im,n information between stakeholder m and n, where ;
Zm,v transport tasks carried out by supplier m, by transport means v;
Rp,q set of relations within the system, where
R’e,p set of relations with element e of environment E, where and .
This formula highlights the complexity of the structure of urban freight transport and the relationships that exist therein. This is the basis for the analysis of management processes in the system studied.
Freight transport in cities depends on sites where economic activity takes place, goods that require transportation to and from the sites, vehicles that provide transportation services, and city infrastructure [
19]. These elements interact with four functional aspects: accessibility, land use, transport, and traffic. Transport system capacity is determined by the interaction between the above-mentioned elements, which should be taken into account during comprehensive planning, organizing, and controlling of the movement of goods in the city. This subsystem primarily affects residents’ health, noise and environmental pollution, safety, and congestion [
20]. Delivery vehicles compete with public and individual transport for access to the limited road infrastructure (nodal and linear infrastructure). This leads to transport congestion, as a result of which locals perceive freight transport negatively.
2.2. Different Expectations of UFT Stakeholder Groups
The first factor determining the efficiency of the implementation of UFT measures is proper identification of key stakeholder groups that directly influence UFT management processes, and ensuring consensus between their expectations [
1].
Classification of urban freight transport stakeholders must primarily involve identifying individuals, institutions, and organizations representing the private sector (chambers of commerce, wholesalers, retailers, manufacturers, logistics providers, residents and users of cities, shop owners, and developers, among others), as well as public sector institutions and organizations (in particular, local government; local, regional and national authorities; road authorities; police; etc.). In general, these stakeholders can be divided into five basic groups, which determine functioning of the system to a various degree and in different contexts [
21,
22]:
Shippers—this is a group that includes both senders and recipients of goods; usually retailers, wholesalers and manufacturers
Freight carriers—this group includes external professional transport operators, logistics service providers, courier services, private providers, urban managers of supply centres, and dispatchers
Residents—this group includes both city residents as well as other city users, like commuters and visitors, people who come to the city to shop; and other road traffic participants such as store owners, developers, associations and organizations of citizens and consumers
City administrators—this group can be divided into administrators of urban system for goods distribution; like regional authorities, municipalities, municipal managers of supply centres and other administrators providing inputs to the system (planners, policy makers, infrastructure managers and supporting institutions, such as chambers of commerce, associations of cities, etc.)
Truck and vehicle manufacturers as well as manufacturers of non-conventional delivering technologies
These groups can perform four basic roles in the urban freight transport system [
22]:
Want it—these are transport market participants who want the system to limit the problems associated with the movement of vehicles and its impact on the environment; to provide information services on routes, provide facilities for freight operators and to create better living conditions for the residents and users of the city. This group mainly includes local authorities, residents, groups, and associations representing the interests of the city; as well as retailers, shop owners and developers
Make it—these mostly include suppliers of equipment and software for the creation of a system, vehicle manufacturers, system integrators, providers of innovative solutions for loading and unloading or loading units, city developers, etc.
Use it—this class of users includes two categories: Primary and secondary. Primary users use the results of the system, e.g., retailers, carriers, freight forwarders, drivers; while secondary users control the system, and introduce, inter alia, a substantial portion of the input data e.g., traffic control operators, freight dispatchers, distribution centre managers
Rule it—these are usually local authorities responsible for issuing regulations (e.g., in the field of environmental zoning, traffic restrictions, time windows, using dedicated lanes, parking spaces, or infrastructure)
The factor that has a direct impact on the heterogeneity of urban freight transport is diversity of needs (goals) and expectations of stakeholders representing these groups. In general, these goals relate primarily to profit growth for shippers and contractors, and well-being of city residents (safety, quality of life, freedom of movement around the city). From a public administration perspective, the enhancement of economic efficiency of cities and reduction in the negative impact of transport on the urban environment is of crucial importance.
From the viewpoint of efficient management of a freight transport system, three main categories of stakeholders, who have a direct influence on decisions made within this system, are noted [
1]:
Local authorities, who make decisions regulating and conditioning the transport processes in the city
Transport system monitoring and security entities, which supervise the organization and functioning of transport within the city and react in emergencies in order to reduce the negative impact of any event occurring in the urban space on the functioning of the entire transport system
Shippers and freight carriers, who are directly responsible for rendering their services and making key decisions affecting their performance and effectiveness
3. Methodological Background
The basis of the analysis introduced in this paper is multi-criteria decision analysis (MCDA). This approach is well known in the area of transport. In recent years, it was applied several times for the analyses of support for material flow management in a whole supply chain [
23], location of logistics centres [
24], and evaluation of transport policies to reduce climate change impacts [
25,
26].
Due to the facts emphasized in the previous section, urban freight transport lends itself to application of MCDA. General assumptions for the same and the analysis of different methods in the context of utilizing them in city logistics were introduced in [
14]. In addition, some interesting examples are presented in [
27,
28,
29]. The purchase and distribution of goods in the city faces difficulties resulting from infrastructure overload, external costs, and disputes between stakeholders. Urban distribution of goods is organized by private entities (manufacturers, carriers, retailers, end-consumers), working or living in an urban space that is managed by a public authority. The public sector plays an important role in the planning of infrastructure, initiating implementation of new solutions, and undertaking activities to acquire knowledge of problems that exist or may arise in the supply of goods in the city. The complexity of decisions taken to implement measures to improve the flow of goods in the city requires tools to streamline the decision-making process, keeping in mind the need to balance the goals represented by the various stakeholders. An interesting approach is multi-actor multi-criteria analysis (MAMCA), proposed by C. Macharis [
10]. This approach is based on engagement of all UFT stakeholder groups in the analysis, which is performed in 7 steps [
11]:
Define alternatives
Stakeholder analysis
Define criteria and weights
Criteria, indicators and measurement methods
Overall analysis and ranking
Results
Implementation
Examples of applying this approach are introduced in [
30,
31,
32,
33,
34]. The multi-stakeholders’ multi-criteria analysis is also the basis of the approach, proposed under the NOVELOG project.
The most important aspect for MCDA efficiency is to choose a proper analytical method. There are many of them, e.g., ELECTRE (ELimination and Choice Expressing REality) I, II, III and IV, PROMETHEE I and II, MAPPACC, PRAGMA, Analytic Network Process (ANP), Analytic Hierarchy Process (AHP) and the Decision Making Trial and Evaluation Laboratory Method (DEMATEL). These methods are focused on many attributes of problems, like the analysis of chosen methods introduced in [
35,
36]. In addition, the analysis of more than 40 MCDA methods to solve MCDA problems was discussed in [
37,
38]. A comparison of the chosen methods is presented in
Table 1. Due to the specificity of the problems discussed in this paper and according to guidelines presented in [
39,
40], the single-criterion-preference-aggregation was taken into account.
The analysis presented in this paper is based on the Analytic Hierarchy Process (AHP) and the Decision Making Trial and Evaluation Laboratory Method (DEMATEL).
The DEMATEL methodology is often used in the case of numerical support for the decision-making process [
40,
41,
42,
43,
44,
45,
46]. In this paper, DEMATEL is applied to evaluate the parameters used to create a system of monitoring of urban freight, which allows effective analysis of relations between the indicators. In effect, as a result of the implementation of the chain of methods and measures, which contain the determination of parameters, the creation of the perspectives, and the performance of analysis with the use of AHP and DEMATEL technologies, the Szczecin Municipality obtained a powerful support mechanism in their strategic decision-making process. It is also worthwhile to mention that the approach of using both methods is increasingly being used for various problems in logistics [
47,
48,
49,
50] as well as in other fields [
51,
52,
53,
54].
3.1. AHP Method
The AHP method developed by T. L. Saaty belongs to a group of methods that apply the multi-functional model of hierarchical analysis [
55,
56]. It is applied specially to support multilevel decisions involving several criteria (this refers to problems such as selection of projects, suppliers or technology, etc.) [
57,
58,
59,
60]. Since its formulation in the mid-seventies, the AHP method has been successfully applied to solving various social problems. Its first application was by the US Department of Defence to fight terrorism. It was then applied to determine the policy of exploitation of resources, energy policy, and to forecast the results of presidential elections in the United States, among others [
57]. AHP is easy to use and scalable; its hierarchical structure can be easily adjusted to fit multidimensional problems and could be used for performance-type problems, resource management, corporate policy and strategy, public policy, political strategy, and planning [
36].
The decision criterion determines the allocation of all possible decisions, and the quantitative or qualitative assessment of the benefits resulting from taking a particular stance. It should therefore enable the assessment of preferences in connection with its choice. In the case of multi-criteria models, each decision alternative is evaluated with respect to each criterion. The application of AHP provides a set of alternatives ordered according to their suitability in terms of various criteria. It should be emphasized that to a greater or lesser extent, each of them depends on the same set of criteria. The decision-making process based on this method is carried out by the following steps:
Developing a hierarchical model
Creating a matrix of pairwise comparison of individual criteria
Determining the Consistency Ratio (CR) and the possible adjustment of assessments
Ranking decision alternatives
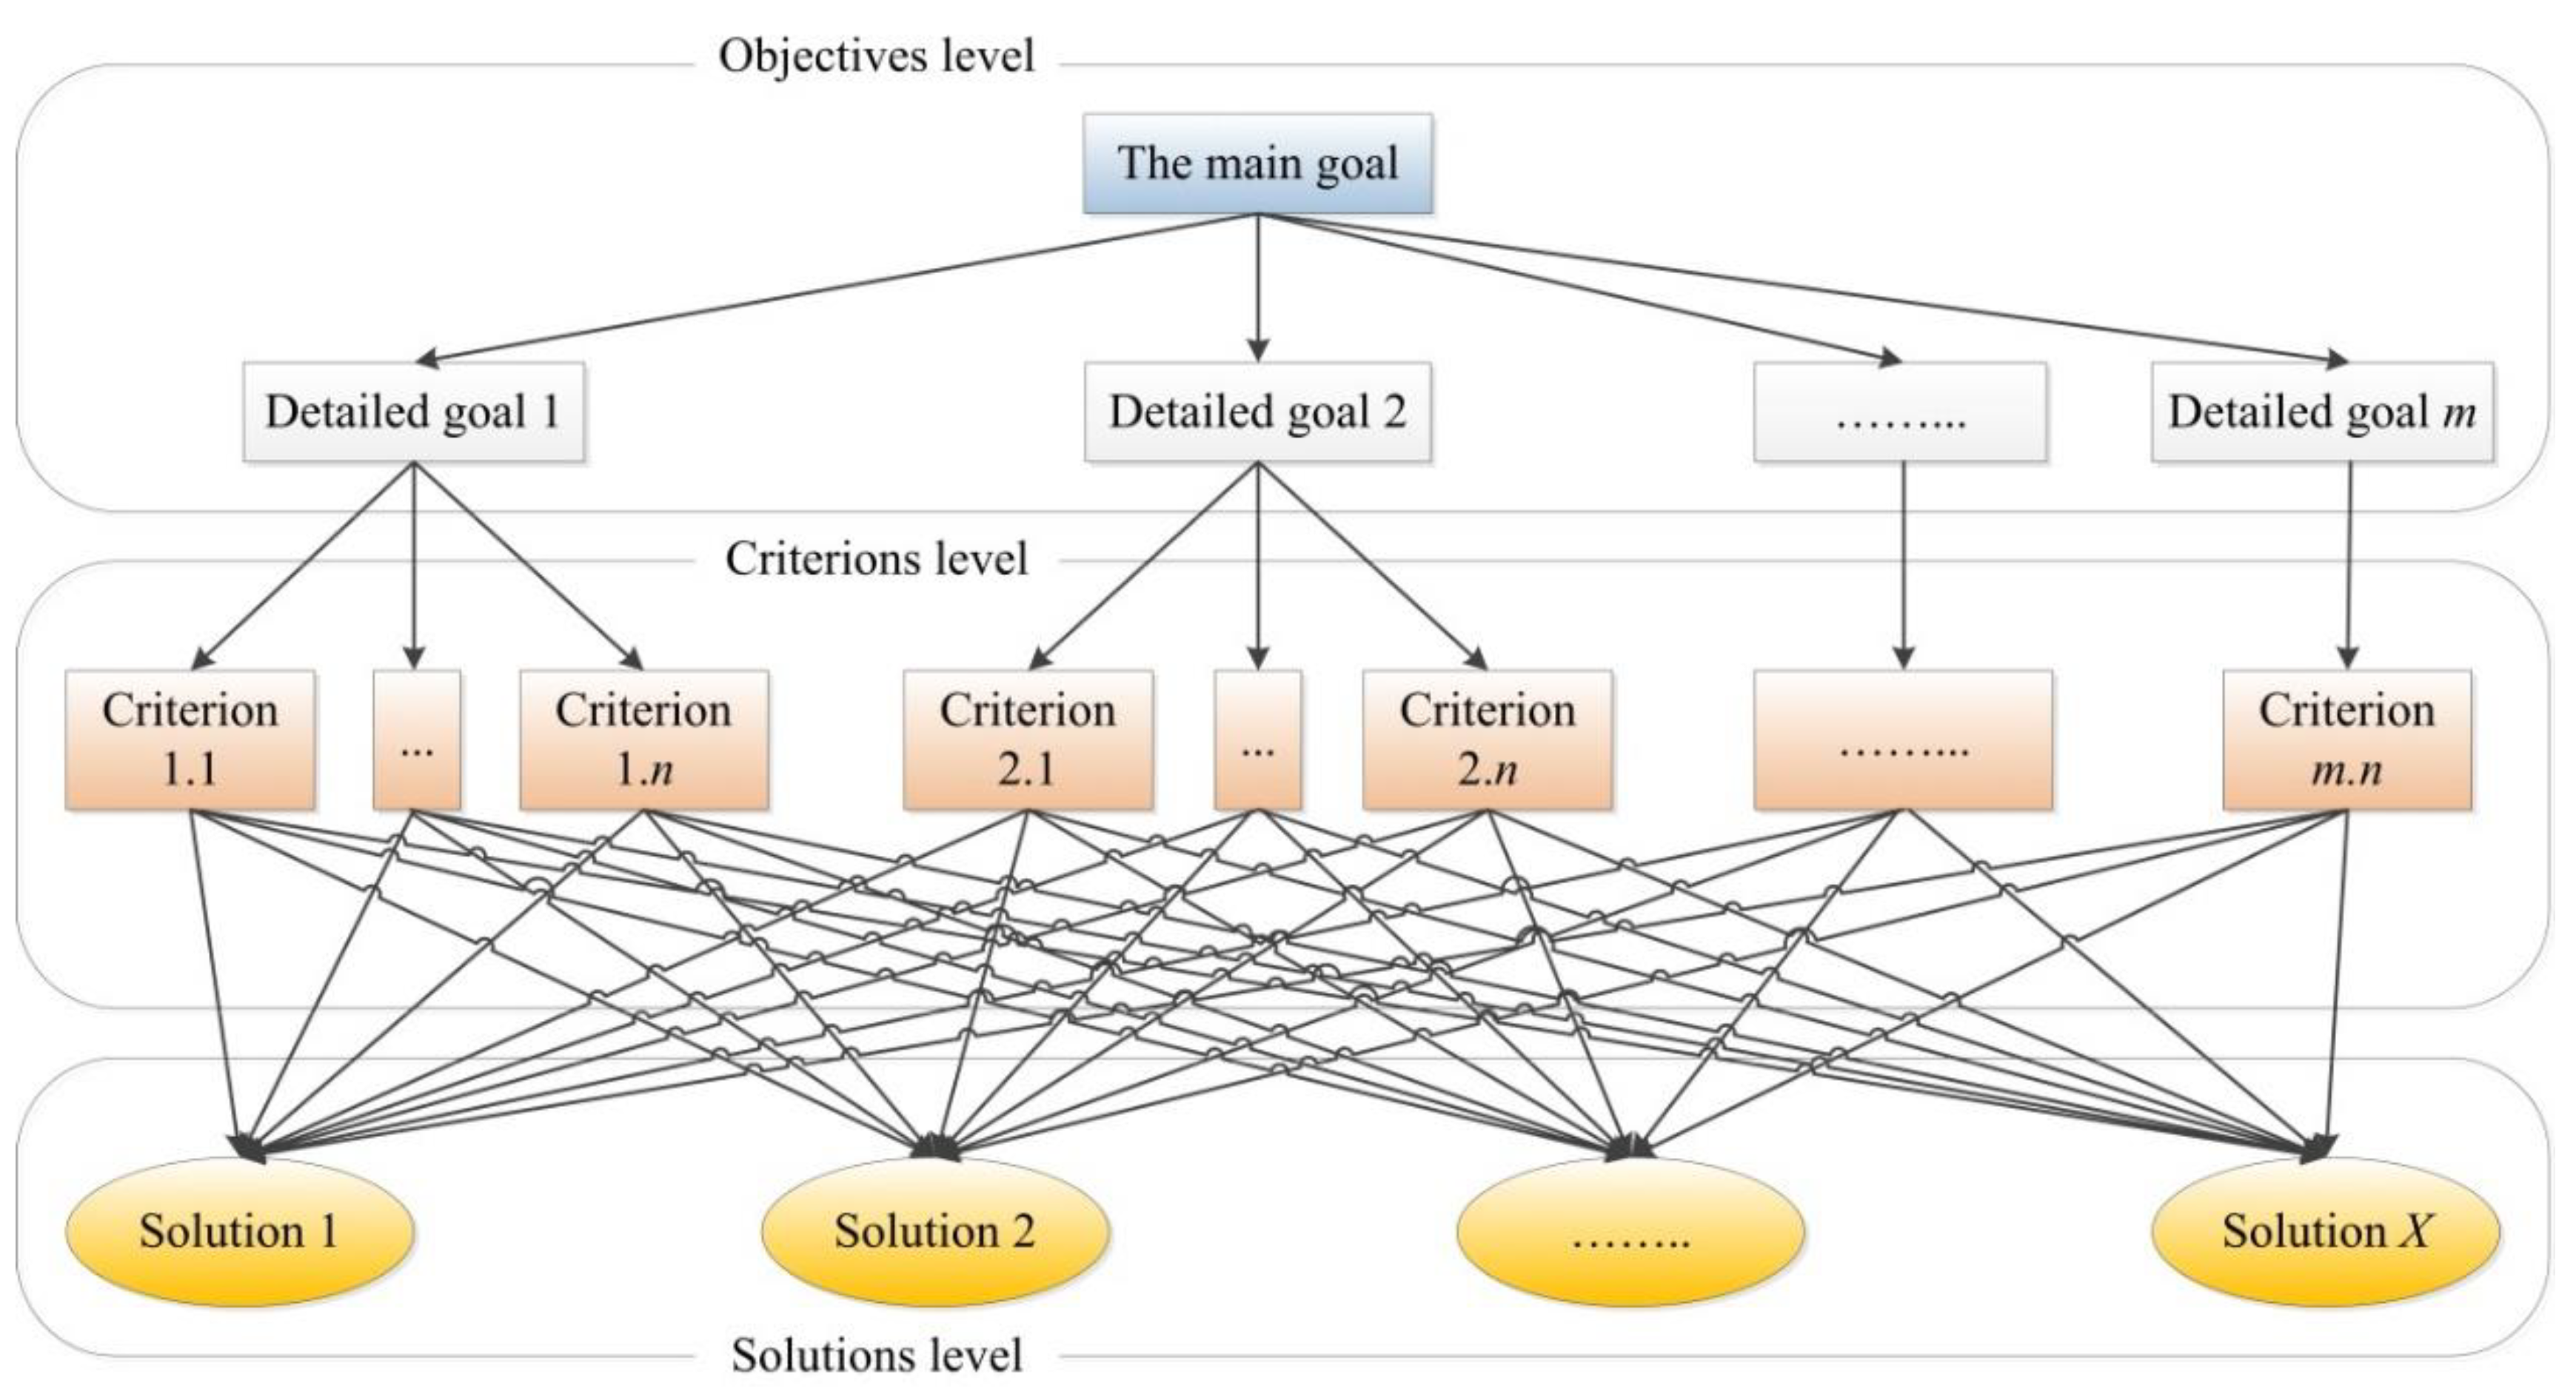
This model includes a graphical representation of the hierarchy of goals and the criteria affecting their implementation (
Figure 2). It is a tree structure consisting of three-level categories: goal, criterion and alternative. The main goal may consist of intermediate goals, and the criteria may depend on sub-criteria.
Alternative or criterion comparisons are conducted with the use of a pairwise comparison matrix. Each matrix should be reciprocal and positive. The proportion means that every matrix element fulfils the characteristics defined by Equation (2):
The interpretation of the Equation (2) is as follows: If an element
ai,j contains a value a, then an element
aji should contain a reverse value, i.e., 1/a. Moreover, elements on the main diagonal
ai,i should include unitary values [
61]. When specifying the positivity of matrices, one needs to point out that it should contain Saaty’s ratio scale, i.e., from the range of 1 to 9 and their opposite values, where 1 indicates equality of compared alternatives or criteria and 9 indicates an extreme advantage of an alternative or criterion
i over
j [
62]. Therefore, each matrix is completed with one of 17 values: 1/9, 1/8, …, 1/2, 1, 2, …, 8, 9 [
63]. The meanings of individual values of the Saaty’s ratio scale are presented in
Table 2.
For every pairwise comparison matrix, a preference vector
w = [
w1,
w2 … wn]
T is defined, which demonstrates the force of alternatives or criteria compared in matrices. Components of the vector are included in the pairwise comparison matrix, which is presented in Equation (3) [
55].
The advantage of the AHP method over non-linguistic methods is the possibility of selecting criteria that do not meet the measurability condition, which means that there is no need for direct measurement of the value of the particular criterion. For subsequent evaluation, it is sufficient to demonstrate how one of the criteria exceeds the other in achieving the goal.
3.2. DEMATEL Method
The main stages of the DEMATEL [
64,
65] methodology are described below. At the start, a list of parameters that will undergo the analysis must be made. Indicators in the form of analytical formulas are preferred over descriptive forms. The analytical form of an indicator allows direct use of data collected from various sources. In the next step, with the use of any method, the level of mutual influence of all criteria pairs must be determined and the initial direct influence matrix
D must be created. It is assumed that each of the criteria may directly influence other criteria, but it cannot influence itself. In practice, based on expert suggestions, expert systems or numerical methods, a cluster of partial direct influence matrices is derived. Matrices aggregation, in effect, provides a direct influence matrix
D. The direct influence matrix
D is derived according to the following formula:
In the next step, a normalized direct influence matrix
N is determined, in which, all parameters assume a value within range [0,1].
where
In the next step, a matrix of total relations
E is derived:
where
I is the identity matrix. In
E = [
eij] matrix, sums of individual rows are calculated (
ri)—which mirror the sum of indirect and direct
i influences criteria on other criteria (Equation (8)) and sums of all (
cj) columns—which show the sum of direct and indirect influences the
j criterion receives from other criteria (Equation (9)).
and
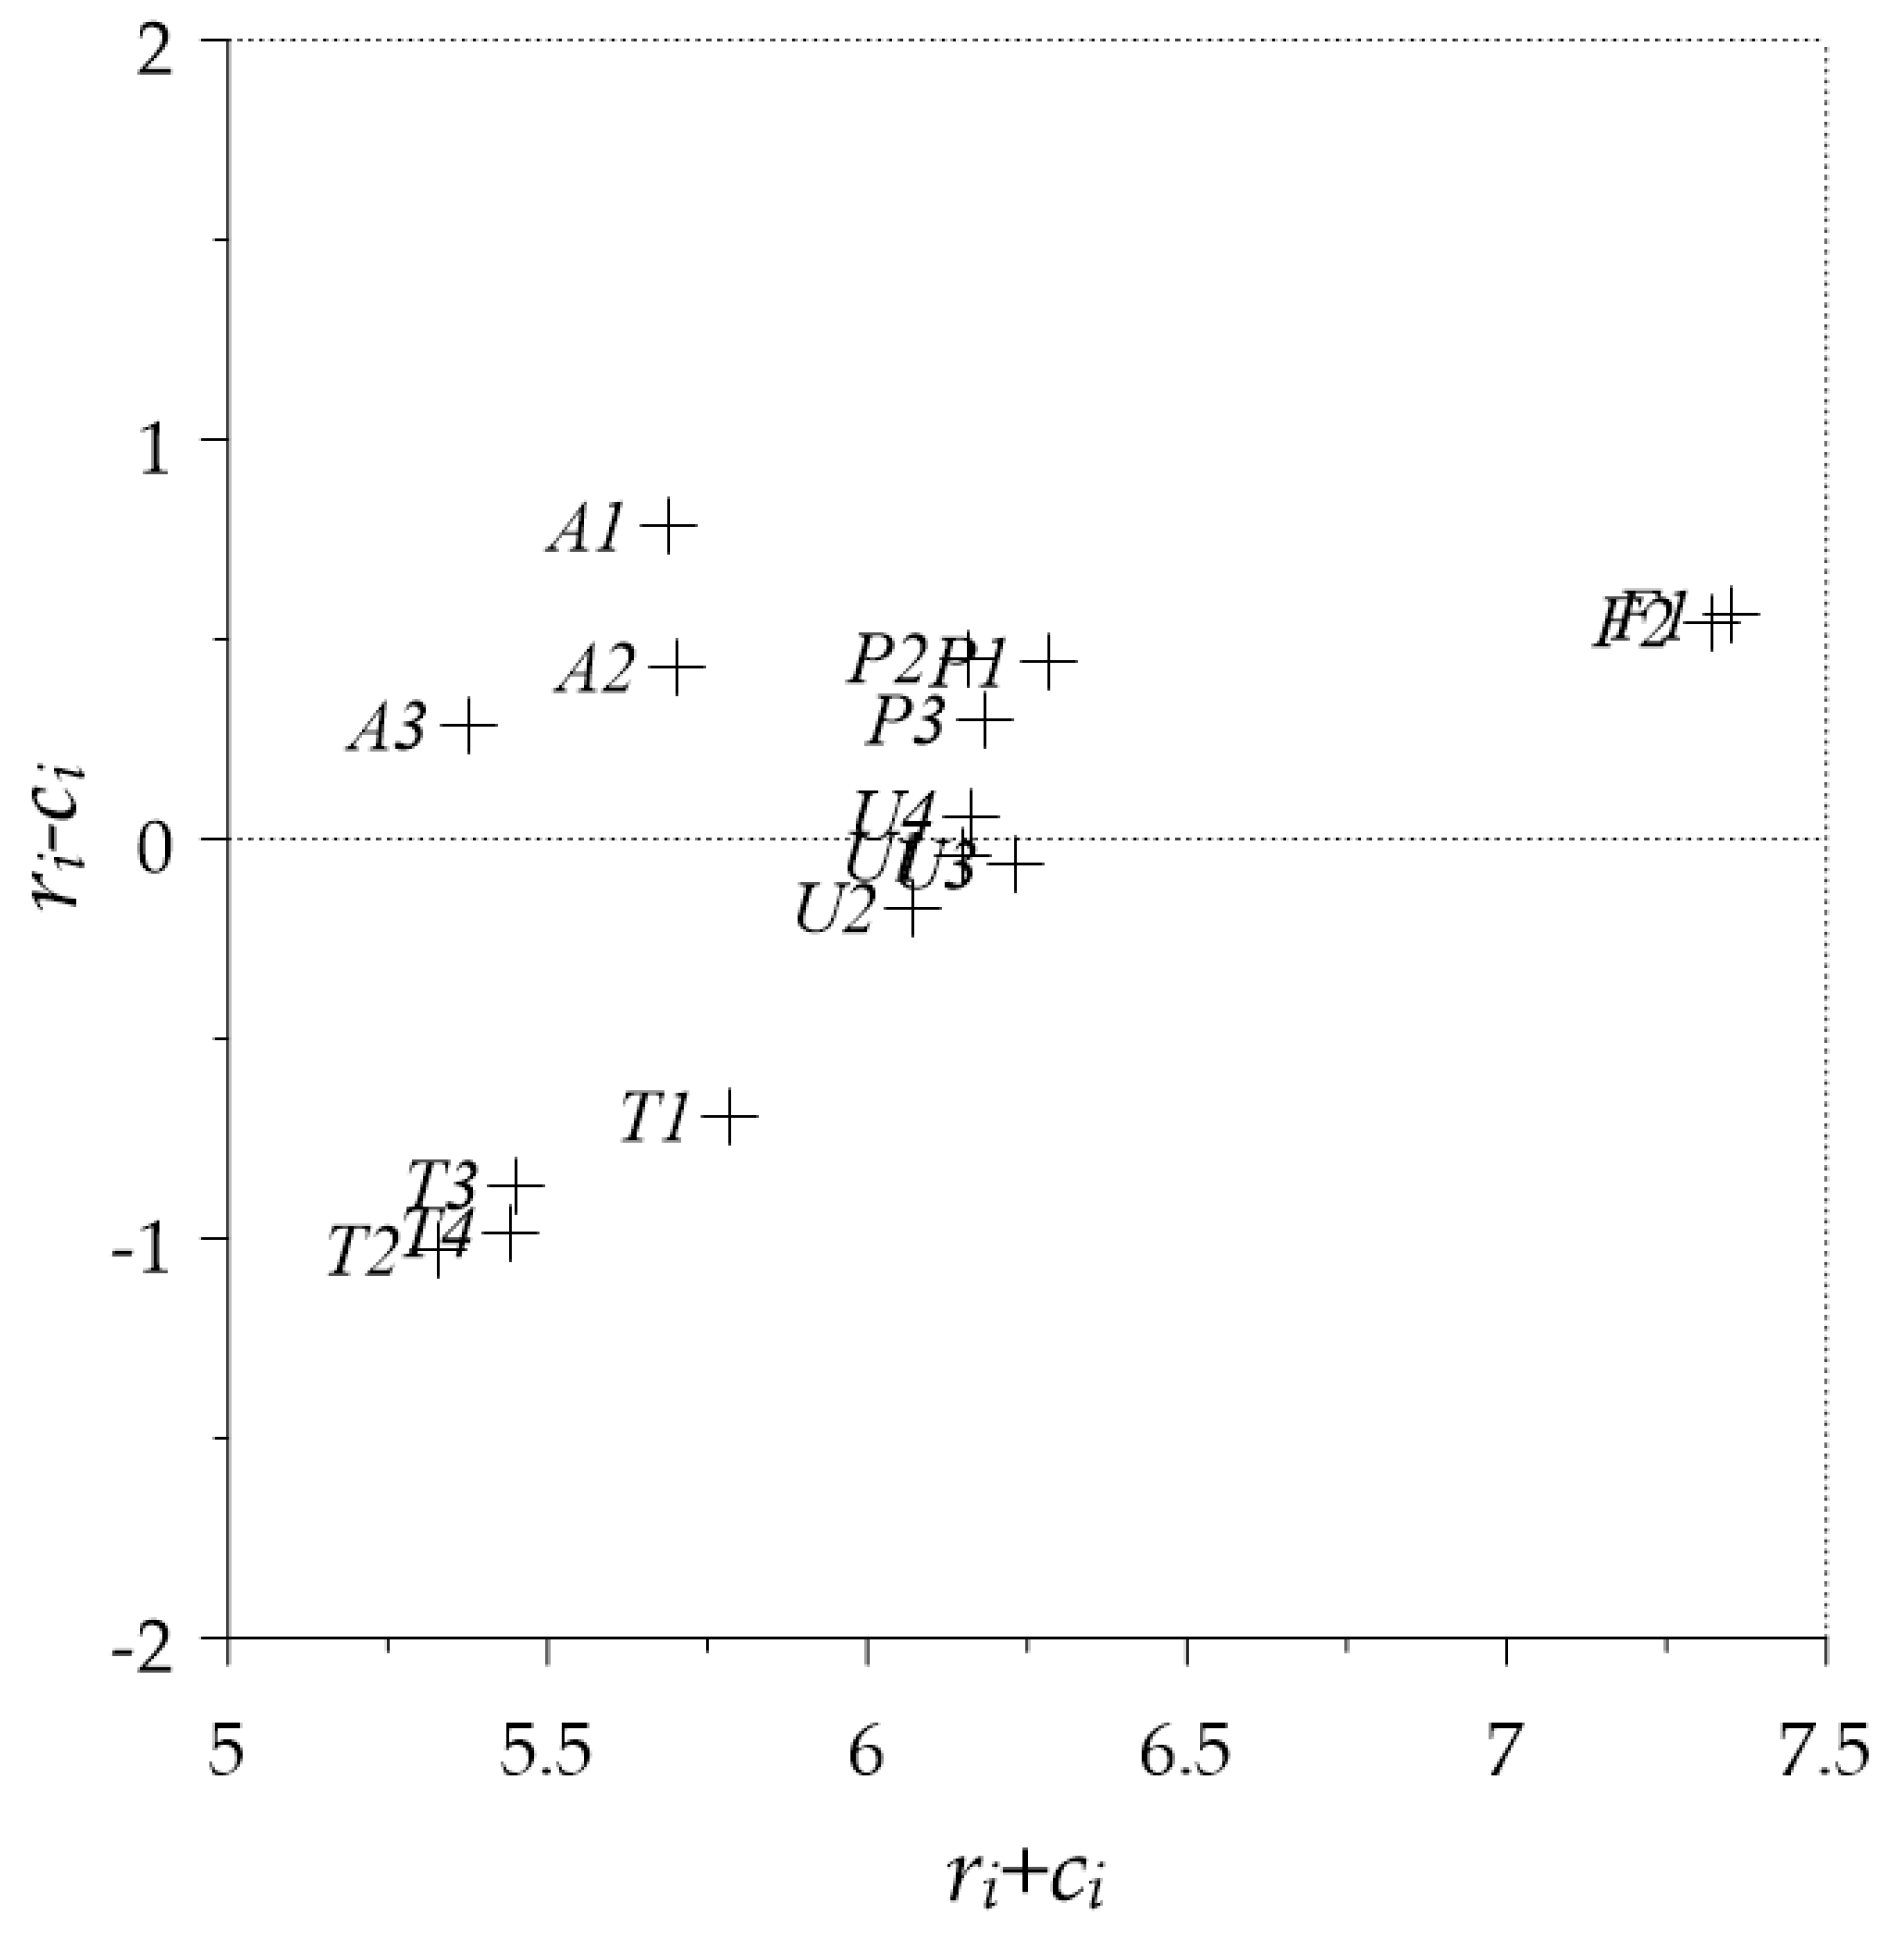
Next, a ri − ci—relation indicator is determined, which is also called a net influence and a ri + ci—position indicator, which is also called an overall influence. If i = j, then the value ri + ci indicates the sum of criteria values, which both, influence the other criteria, and are under the influence of other criteria. Value ri − ci > 0 means, that the i criterion, influences other criteria, and influences the entire system as well. Value ri − ci < 0 means that other criteria influence the i criterion, hence the i criterion, is not a source of influence on remaining criteria in the system. Taking into consideration the above position and relation indicators, a casual diagram can be created in a (ri + ci, ri − ci) layout. When analysing the values of ri + ci and ri − ci indicators, the DEMATEL technique identifies the degree of interdependence of criteria on one hand. It also determines criteria that influence others, criteria that depend more on others, and criteria that are influenced by others.
4. Multi-Actor Multi-Criteria Analysis for Implementation of Sustainable Urban Freight Transport Measures in Szczecin, Based on the AHP and DEMATEL Methods
4.1. The Research Area Introduction
This analysis was made for the Szczecin Municipality. Szczecin is the capital city of the West Pomeranian Voivodeship in Poland, situated along the Oder River close to the Baltic Seacoast. It is the seventh-largest city in Poland, with a population of more than 400,000, and one of its major seaports [
66]. A significant area within the city is Dąbie Lake, which divides the city into two parts: The Right Bank and the Left Bank (additionally, the city is divided by the Oder River). The centre of Szczecin is located on the Left Bank of the city. The residential districts of Szczecin cover practically the whole of the Right Bank and the further areas of the Left Bank.
Szczecin is a typical Eastern European city in the post-communist period. After 1989, there was a very rapid increase in car ownership, and this growth has continued after 2000 [
66]. This growth was supplanted onto an extensive public transport network of electric trams and diesel powered bus lines. Szczecin now has about 784 km of roads, and private cars are now the dominant mode of mobility [
66].
The city has been developed in an arc around the port and waterside areas. The historic city centre covers a series of lower density residential areas in recent years, around denser inner districts of apartment blocks. The main aims of the municipal policy are environmental protection, improved road safety and security, and improved quality of transport [
66].
A crucially important part of the transport system in Szczecin is freight transport. Due to numerous commercial entities (mostly shops, HoReCa, as well as service outlets and small industry facilities) in the city centre, deliveries face several problems. Based on the results of the GRASS project, 78% of the entities are supplied by vehicles with a capacity up to 3.5 t. The remaining 22% are supplied by vehicles with a capacity from 3.5 t to 12 t. Based on these data, it was calculated that the total average number of deliveries per week within the analysed area amounted to 8024, and the majority of them were deliveries made to retail entities (5585—8 deliveries per week to one entity) [
67].
In view of these numbers, the Szczecin Municipality has been trying to find solutions that will help reduce the negative impacts of the freight transport system on the city environment.
4.2. Selection of Decision Alternatives
As a starting point for the analysis in the later part of the paper, the categories of solutions developed under the C-LIEGE project were applied. The analysis of good practices based on a review of 97 implementations in selected European countries resulted in the selection of 17 categories of solutions. The selection was made based on the knowledge and experience of experts (from 11 European countries) involved in the project. The analysis focused on soft solutions, both push and pull types.
After taking into account the specifics of Szczecin, 16 solutions were chosen for further analysis (
Table 2). Implementation of a low-emission zone was eliminated due to the polycentric character of the city. Other actions were subject to multi-criteria AHP analysis, which offer a choice of solutions that can be implemented in Szczecin in order to improve urban freight transport efficiency.
4.3. Stakeholders Engagement
Stakeholders’ engagement was provided via the Freight Quality Partnership for the Szczecin Metropolitan Area, which was established during the C-LIEGE project implementation. The functioning of this structure is the basis of activities carried out under the (GReen And sustAinable freight transport Systems in cities (GRASS) [
8] and New cooperative business models and guidance for sustainable city logistics (NOVELOG) [
9] projects, which are direct continuations of the C-LIEGE. The Freight Quality Partnership is a kind of agreement between city authorities, representatives of businesses, logistics operators, transport companies, and organizations dealing with environmental protection, local communities and other stakeholders. It determines how to work together to solve specific problems related to freight transport [
69]. The main task of FQP is ensuring sustainable growth of freight transport in cities, while meeting expectations of various stakeholder groups and reconciling them with overarching strategic goals of a city or region. The activities of FQP are focused on the cooperation between municipalities, transport operators, entrepreneurs, environmental organizations, and other interested parties, which forms the basis for developing a collection of best practices to make freight transport more ecological, economical, safe, and efficient [
70]. All these entities collaborate to develop a possibly full and consensual understanding of freight transport issues and problems, to promote constructive solutions that reconcile the need for access to goods/services with the local environmental and social concerns, and thus optimally serve the needs of local businesses and communities [
71]. This kind of partnership is established mostly by local authorities, freight transport industry, local businesses, local communities, environmental organizations, and other interested parties [
66]. Its proper functioning is dependent mainly on keeping its members interested, acquiring financial resources, and attracting new stakeholders [
66].
The FQP in Szczecin engaged stakeholders from several key groups: Delivery companies and distributors, local and regional authorities, local businesses, local communities, environmental organizations, and universities. As part of the functioning of the Freight Quality Partnership in Szczecin, the partners exchange information and experience, and also initiate projects regarding transport issues in the broad sense [
71]. Working meetings are usually held in the form of the so-called “round tables”, at which individual stakeholders present their problems and try to work out consensus solutions to ensure meeting expectations (based on the achieved compromise) [
71].
4.4. Identification of the Criteria and Weights
The starting point for the development of the hierarchical model was to determine the main goal, which was “the selection of solutions to improve the distribution of goods while maintaining the principles of sustainable development and an indication of their possible adaptation in Szczecin, taking into account the local conditions”. For the goal formulated in such a way, it is possible to specify the following set of elementary consequences, resulting from the implementation of specific solutions:
Consequences for residents, such as a change in habits, increase in security, and reduction of environmental pollution caused by commercial vehicles traffic
Consequences for entities engaged in economic activities in the surveyed area (e.g., shops and HoReCa sector entities), such as the need to adapt to changes in delivery hours, and the cost of implementing some solutions
Consequences for the city, including improving the image and functionality of the city
Consequences for the environment, e.g., improving environment quality by reducing the traffic of commercial vehicles, and noise reduction
Based on the above-mentioned factors, the three main criteria to assess the planned actions were determined [
71]:
Scope of change—understood as the scope necessary to carry out interventions in the current structure of the city, both in terms of changes in infrastructure and organization
Implementation possibility—understood as the possibility to overcome difficulties in implementing the solutions; this criterion was divided into four sub-criteria taking into account the division of implementation difficulties according to the following categories:
- -
Administrative decisions—the impact of official decisions, legislative circumstances, strategies, policies, etc. on the implementation of the solutions
- -
Cooperation—the importance of the degree of cooperation between stakeholders aimed at successful implementation; this factor determines the extent to which this cooperation determines achievement of intended results
- -
Time—determines the extent to which the success of the implementation is determined by time, a period required for effective implementation (usually large, complex projects take into account a much-broader time horizon)
- -
Funds—it determines the extent to which financial resources determine the success of the project, or in other words, what is its sensitivity to the available funds
Positive impact on the environment—this criterion is the basis for actions taken for the development of sustainable transport and EU requirements; it is understood as an impact on the reduction of pollution and noise levels.
Figure 3 shows the hierarchical structure of criteria constructed for the purpose of this paper.
The pairwise comparison matrix was determined (
Table 3) for criteria developed above. It was based on evaluation by the experts involved in activities carried out under the FQP Szczecin. Each pair of the criteria was analysed in the context of their importance. The results summarized in the pairwise comparison matrix should be interpreted as: “Impact on environment” is twice as important as “Implementation possibility” and three times as important as “Scope of change”; “Implementation possibility” is three times as important as “Scope of change” (
Table 3).
The next step is to determine the hierarchy of criteria. For this purpose, it is necessary to determine the vector of priorities. According to the assumptions developed by Saaty, the first step of the process is to square the matrix of criteria comparisons [
55]. Then, the priority distribution vector is determined by summing up the rows of the matrix and defining their normalization to one unit. For a square matrix A of m size, this vector is calculated as:
where:
pi the priority value in the priority vector for the i-th criterion
Ai,j element of the A matrix lying in the i-th row and j-th column
pni normalized priority in the matrix vector for the i-th criterion
With the use of an iterative process, this procedure is repeated until the value of the normalized priority vector for matrix A does not differ from the values for the normalized priority vector for matrix A, calculated in the previous iteration, assuming a limit to the accuracy of four decimal places.
Table 4 show the priority distribution vector.
A similar procedure was applied to prepare the matrix for pairwise comparisons of sub-criteria. Normalized sub-criteria priority distribution vector is shown in
Table 5.
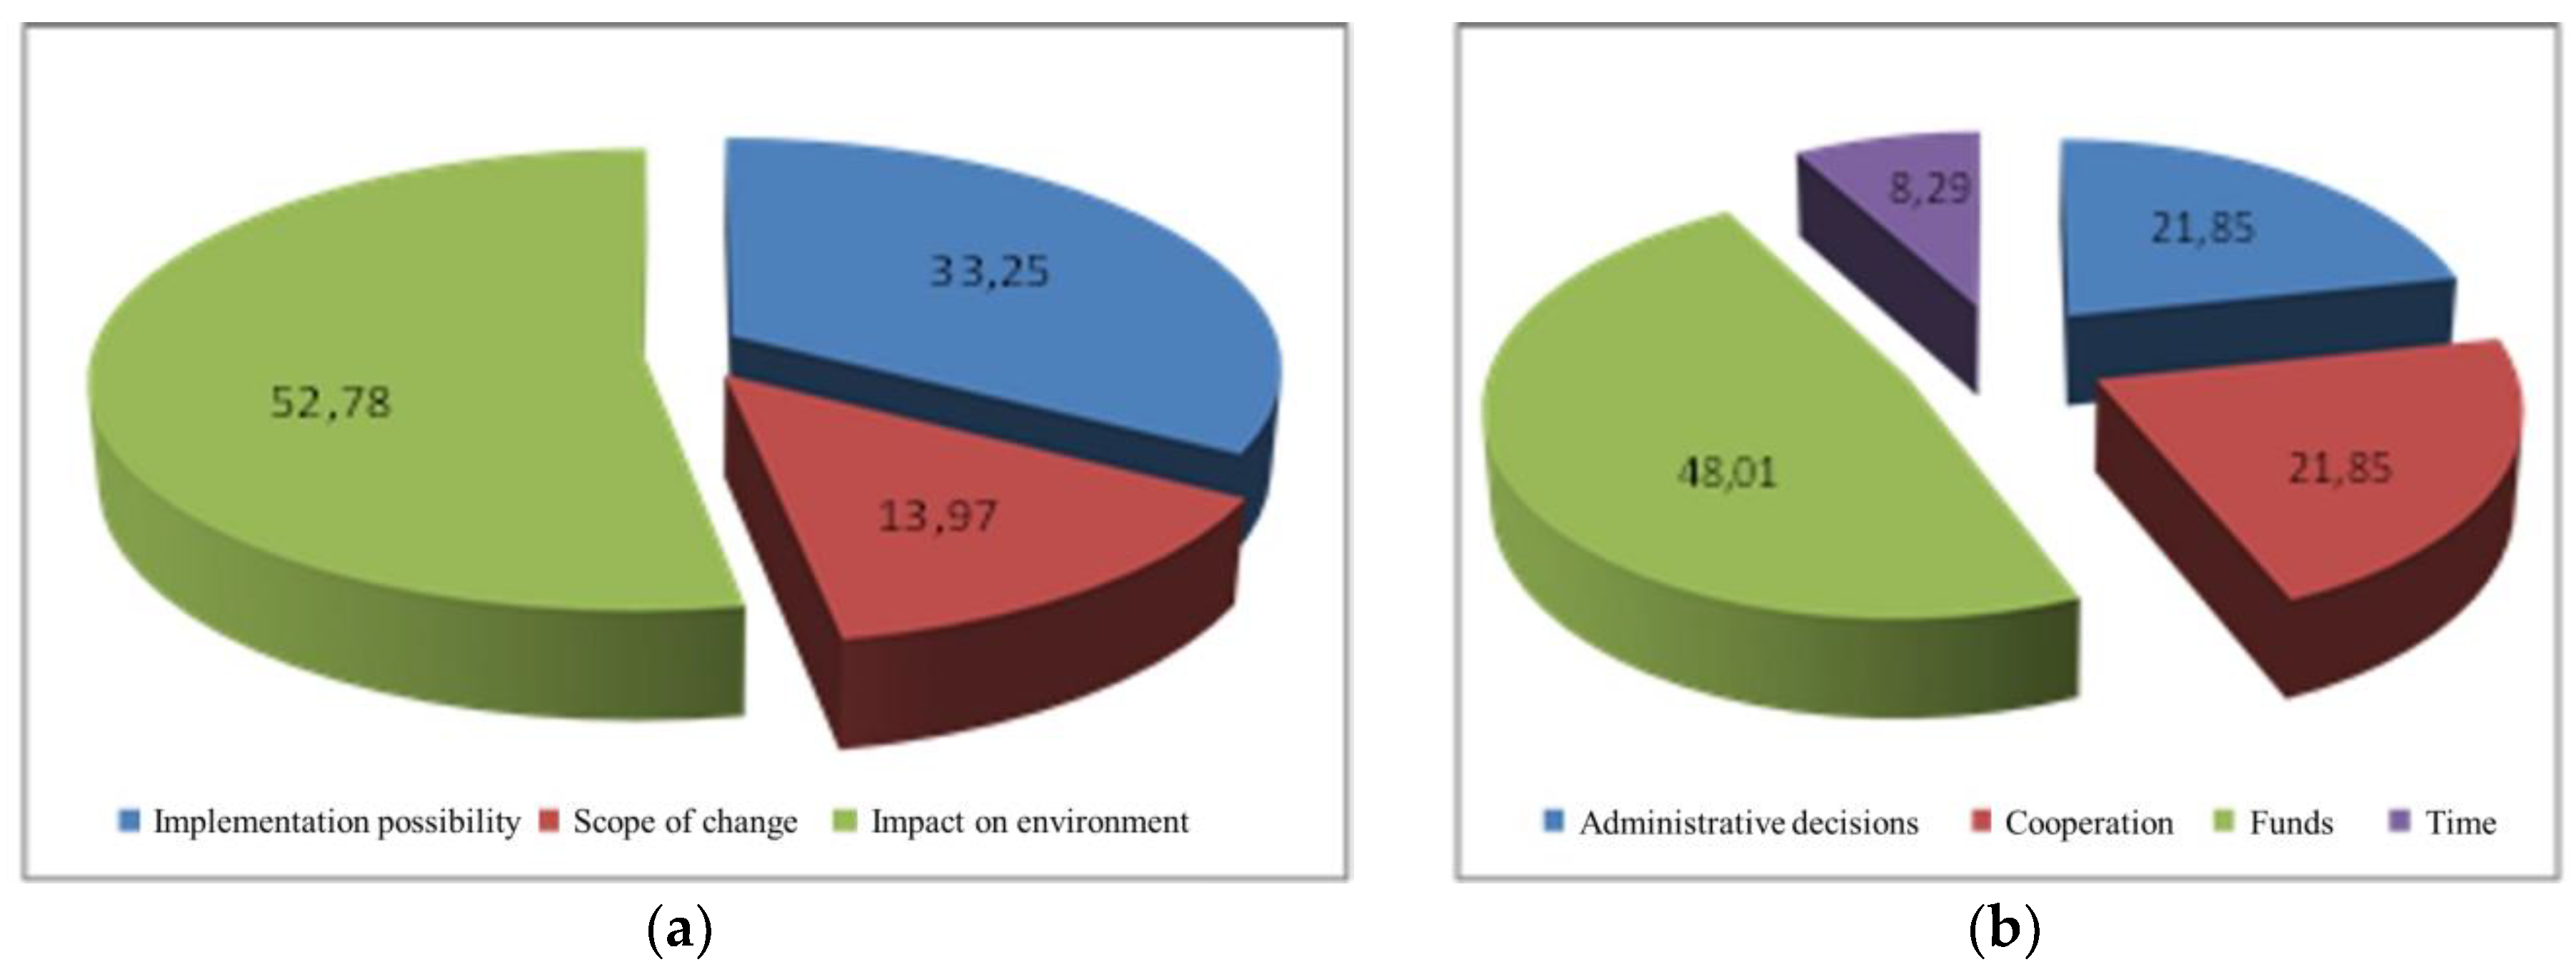
Illustrative priority distribution of the main criteria and sub-criteria is shown in
Figure 4a,b.
The most important criteria ranked as follows: Environmental criteria (52.78%), implementation possibility (33.25%), and scope of changes 13.97%. The most important sub-criterion turned out to be funds (45.1%); followed by administrative decisions and cooperation, which obtained 21.85% each, and the least significant was time (8.79%).
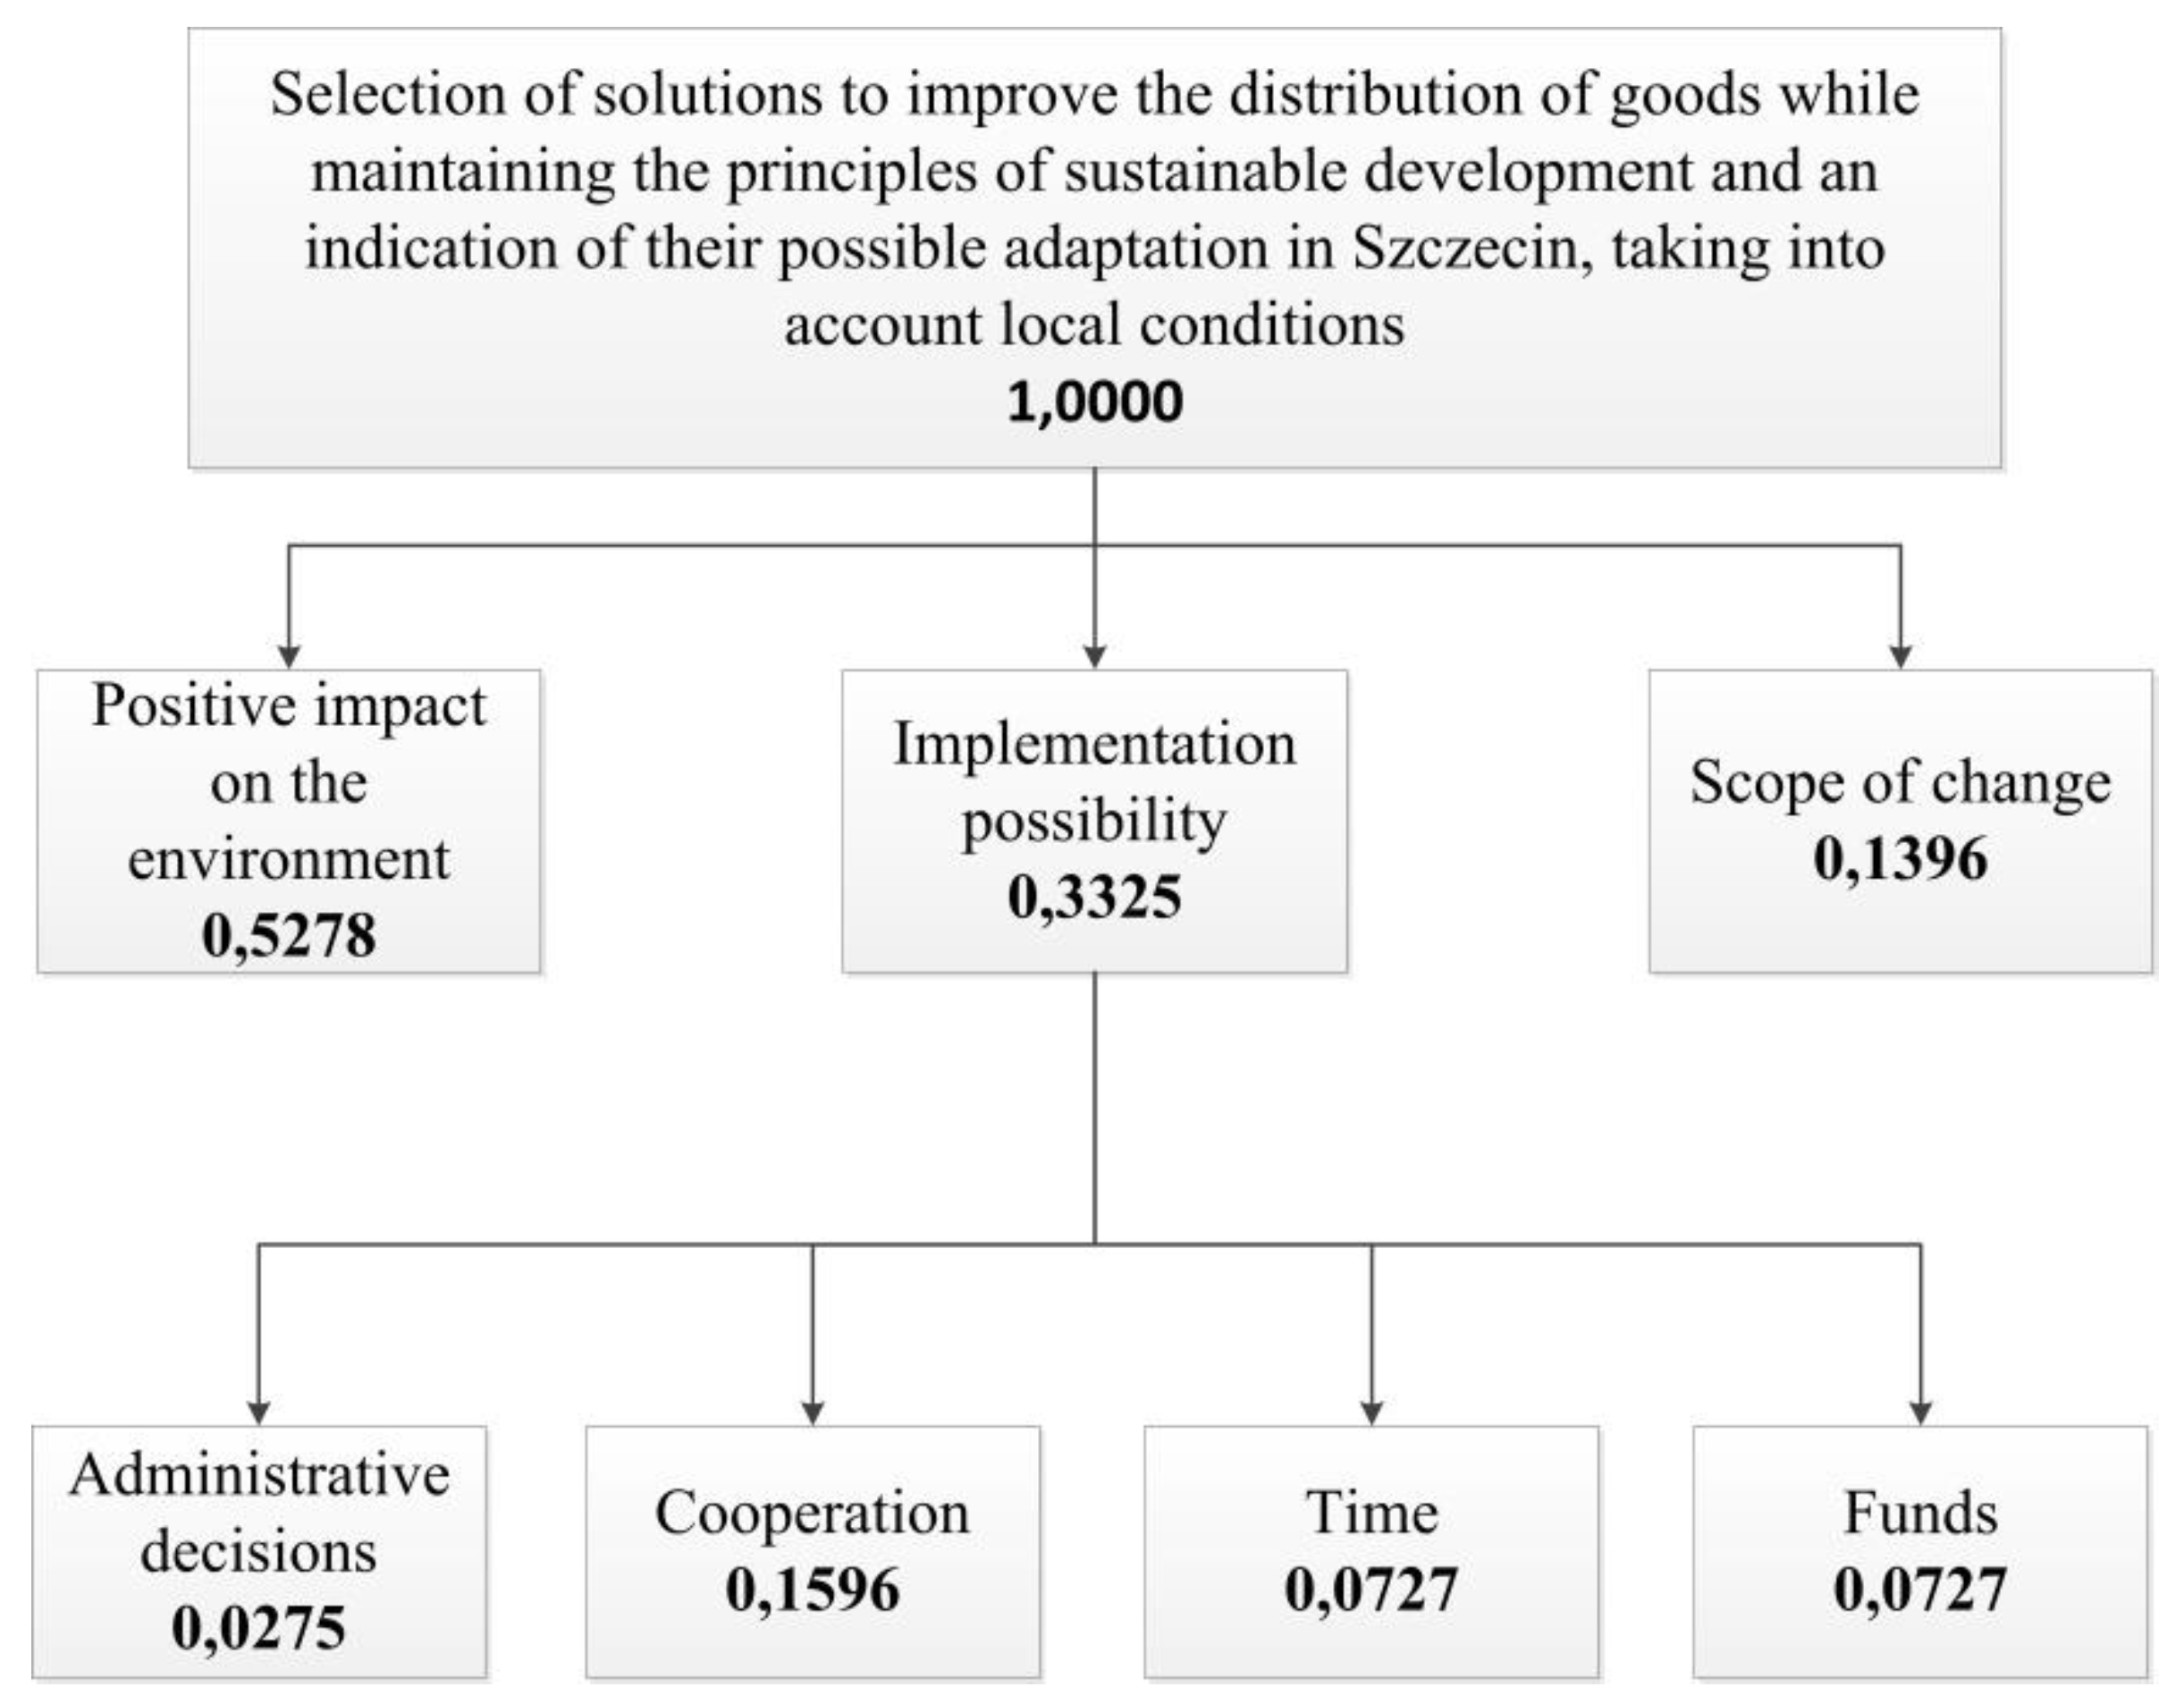
At this stage, priorities for the criteria indicate their rank in relation to the original criterion. In the next step, it is necessary to define global priorities for each of the sub-criteria, which have an impact on the main goal and form the basis for further analysis. This is done by multiplying the sub-criterion by original criterion priority value. Following the calculations, the final hierarchical structure of the criteria and sub-criteria and their priorities took form, as presented in
Figure 5.
4.5. Measurement of the Indicators
Decision alternatives were evaluated using the expert method. External experts and representatives of stakeholders involved in the FQP in Szczecin were asked to complete a questionnaire in which each of the above-mentioned criteria for the analysed solutions was assigned a value ranging from 1 (least favourable for a given criterion) to 3 (the most favourable for a given criterion). In the case of the “scope of change” criterion, the values relate to the degree necessary to make changes in the infrastructure or to make additional investments. ‘Implementation possibility’ means significant difficulties in implementation (value 1) or high implementation potential and ease of carrying out the processes (value 3). ‘Impact on the environment’ denotes a relatively smaller or larger scope of the impact.
Averaged results of the expert research were (
Table 6) the basis for further analysis using priority vectors for the criteria presented above.
In order to evaluate the solutions, it was necessary to normalize the results.
Table 6 summarizes the normalized values of expert research results shown in
Table 7.
4.6. The Final Evaluation and Ranking of Alternatives
The table showing the ranking of the analysed solutions according to the established guidelines and in relation to all the decision-making criteria was obtained by multiplying the value of the normalized results of the expert research by global priorities for each criteria and sub-criteria. The calculation results are shown in
Table 8.
4.7. The Implementation of DEMATEL Method to Assess the Urban Freight Transport Parameters
At the beginning of DEMATEL creation, for categories as well as measures presented in
Table 9, the values of mutual interaction with each other of pairs of all criterion have been set. A scale of 0–5 has been adopted, where 0 means no influence, and 5 means extremely high influence. Based on Equation (4) and expert methods, a matrix of direct influence
D was created (
Table 9).
Normalized direct influence matrix
N has been calculated (
Table 10) according to Equation (5).
Next, based on Equation (7), the matrix of total relations
E was determined (
Table 11).
The matrix of total relations
E can be viewed as a
EC submatrix based on five categories from
Table 2, and
EM submatrix based on measures.
Table 12 presents
EC and
EM matrices and respective position and relations indicators.
Next, based on
Table 12, a causal diagram was created in (
ri +
ci,
ri −
ci) layout for five categories, offering a choice of solutions that should be implemented in Szczecin in order to improve the efficiency of urban freight transport (
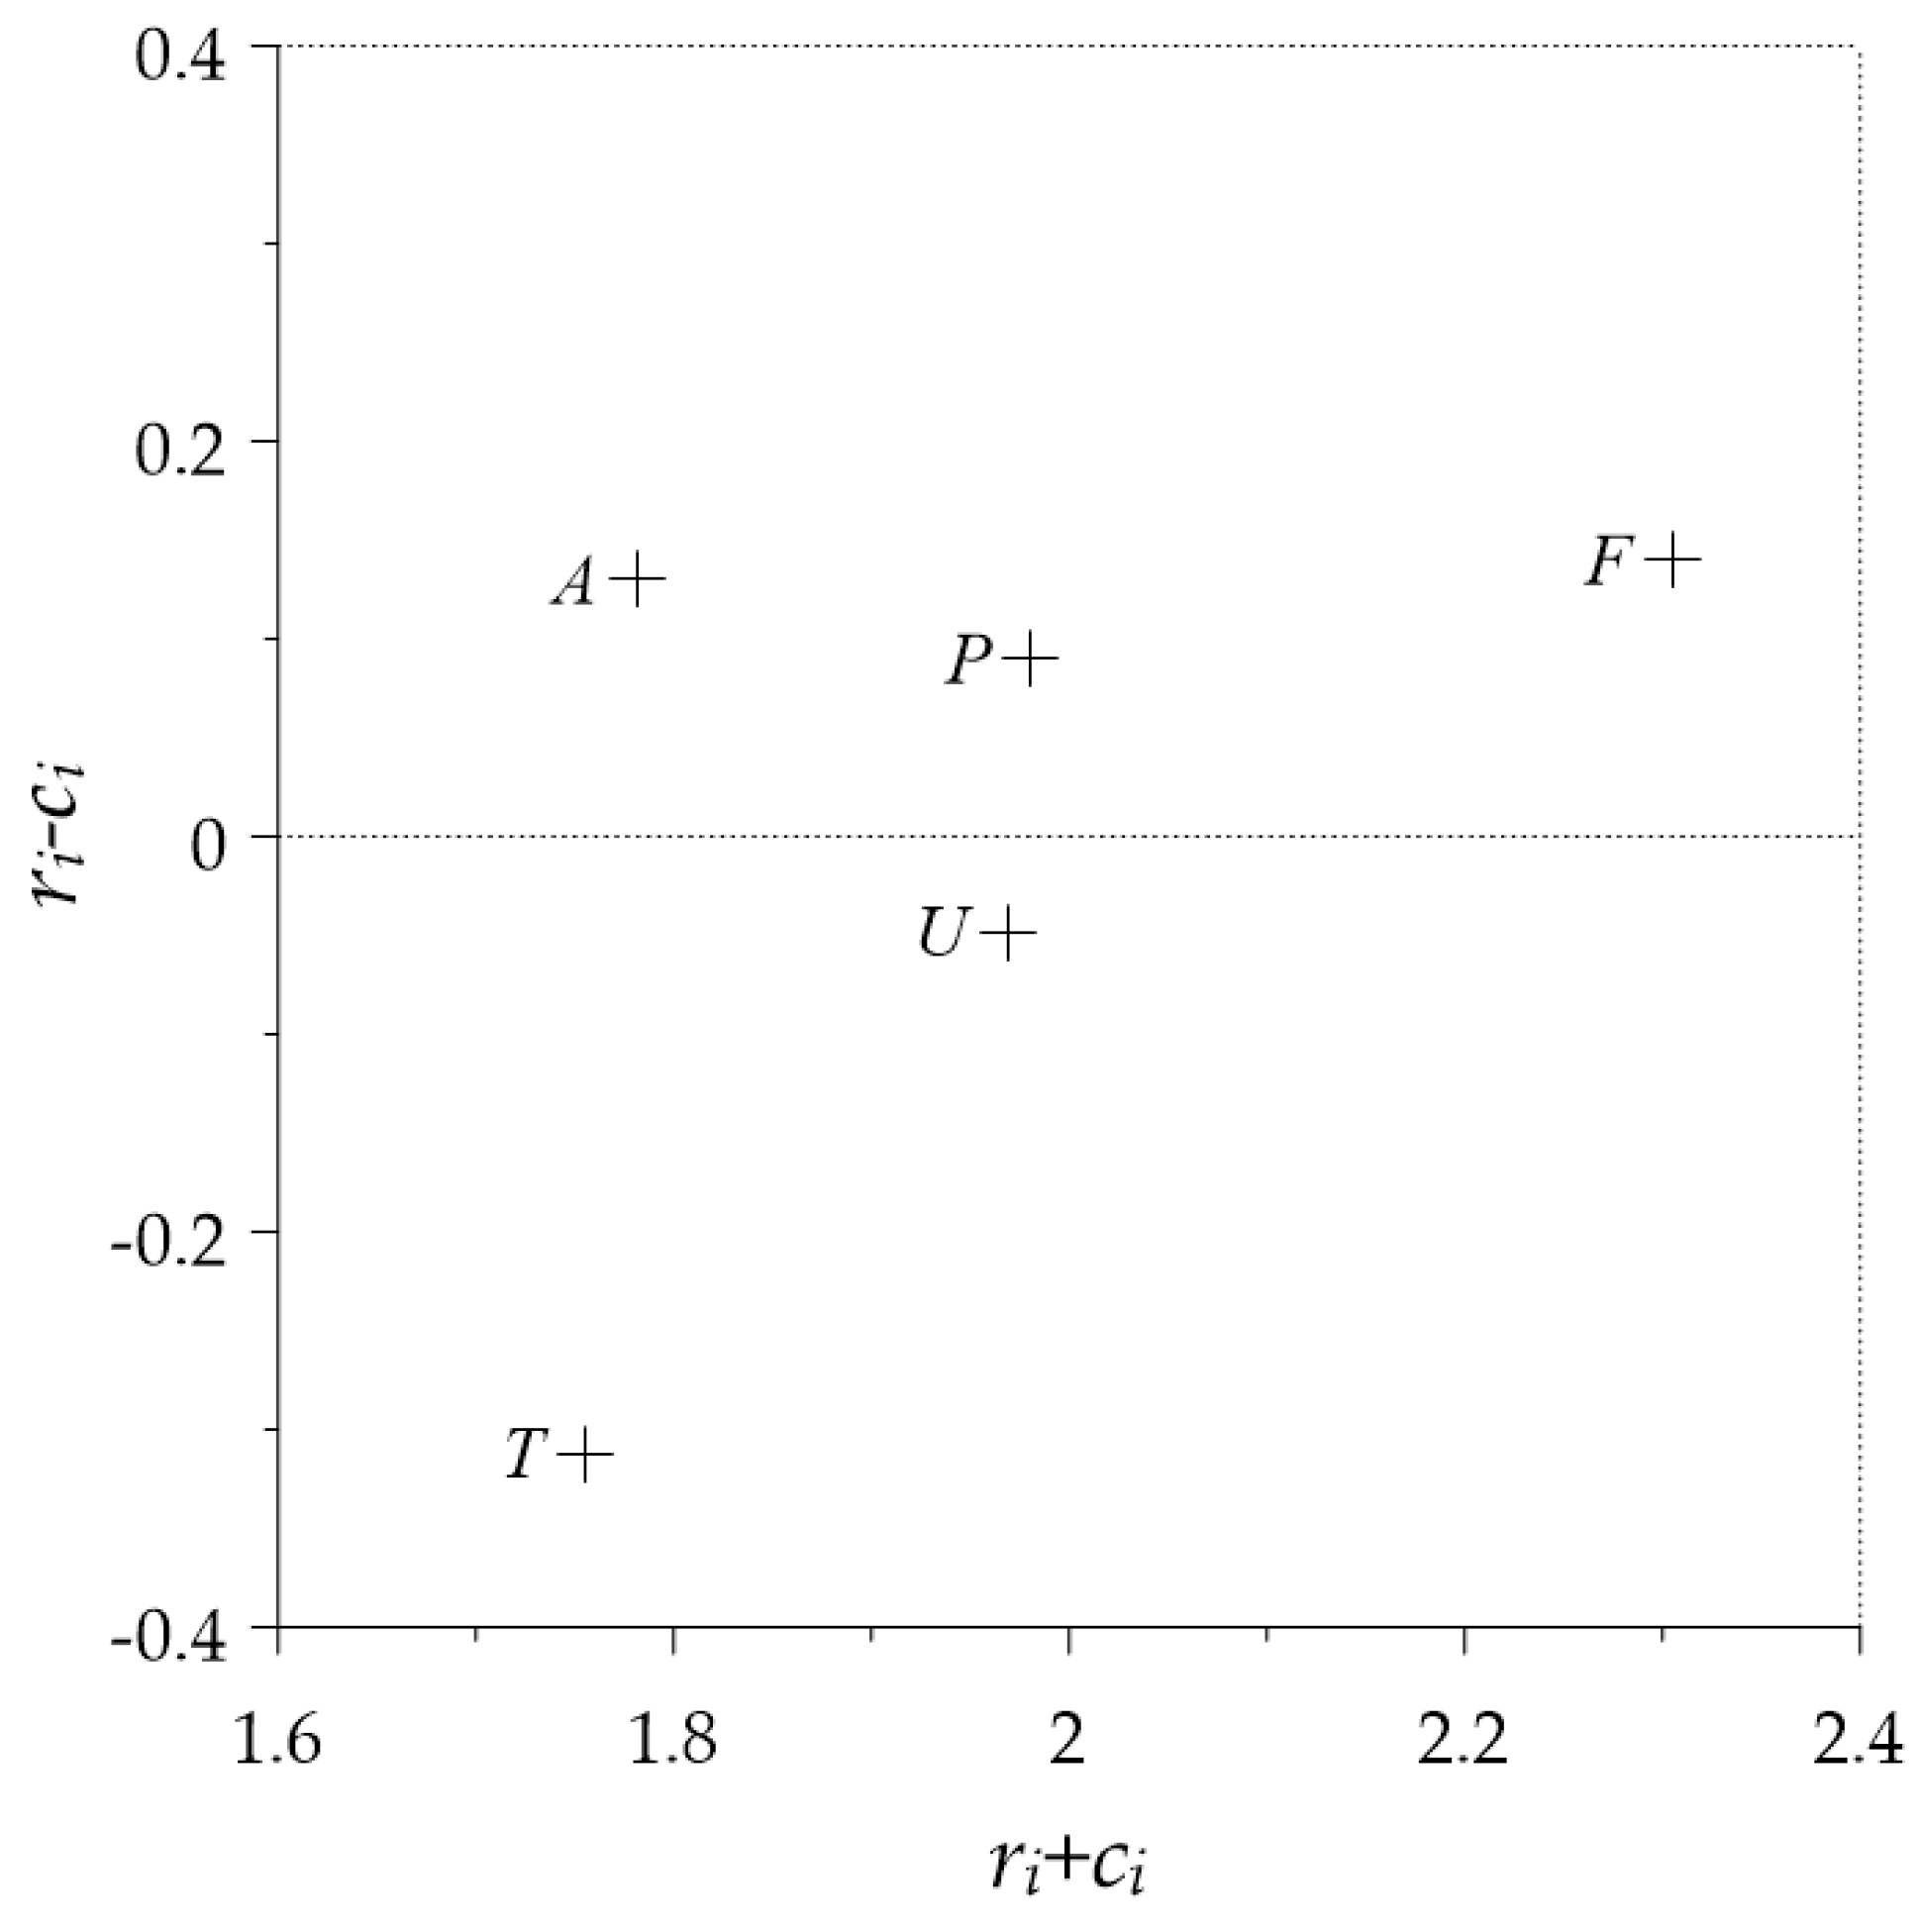
Figure 6).
In
Figure 7, a diagram showing 16 measures of urban freight transport in Szczecin is presented.
In
Figure 6, the
F—finance perspective—has the highest
ri +
ci position indicator value, which means that it has the strongest association with the other perspectives, taking a central place in the web of mutual relations. The lowest value of this indicator is attained by T—technical perspective. Moreover, in
Figure 7, the highest indicator value of position is assigned to
F1—mobility credit schemes—thereby taking the central position in the web of mutual relations. The lowest position indicator value is attained by
T2—intelligent route guidance in freight transport. In turn, the
ri −
ci relation indicator allows to set a level of influence of the analysed parameter on other parameters. It is simultaneously assumed, that it allows to reflect the parameter’s priority among other analysed relations. In
Figure 6,
F—financial perspective—has the greatest, positive value of
ri −ci relation indicator, which means that it has a dominating, casual influence on other perspectives and simultaneously is the most important. In turn,
T—technical perspective—with the highest negative value on the relation indicator, is the biggest recipient of the influence extended by other perspectives. In
Figure 7,
A1—implementation of loading—with the highest positive value on the relation indicator, extends the strongest influence on other criteria and is the most important in assessing urban freight transport. On the other hand,
T2—intelligent route guidance in freight transport—with the highest negative value of
ri −
ci is the largest recipient of influence from other parameters and has the lowest priority in the group of 16 criteria for assessment of urban freight transport in Szczecin.
4.8. The Results of the Analysis by Using Both AHP and DEMATEL Methods
Based on the AHP method (in this analysis, taking into account the total value for all criteria), top rank was obtained by the alternative P2—eco-driving trainings. This solution achieved the best result with respect to the implementation criterion and very good results for the other two criteria. The runner-up alternative in the ranking proved to be T4—alternative delivery systems. This was mainly due to the impact on the environment and high implementation possibility of this solution. Another solution, which turned out to be the most advantageous from the point of view of all the adopted criteria, was P1—Promotional campaigns for sustainable transport. It is worth noting that all these actions are voluntary (‘pull’ type) and are not based on restrictions imposed on carriers, suppliers or customers. It is also important to note that the expert research participants were convinced of the importance of sustainable transport awareness and the need to promote knowledge in this regard. Undoubtedly, only in this case, it is possible to actually reduce the negative impact of freight transport on the urban environment.
When it comes to the DEMATEL method, it was found that A1—implementation of loading/unloading and transit restrictions—highly influences other coefficients and T2—intelligent route guidance in freight transport is highly influenced. As a result of using this method, the policy of freight transport development could take into consideration how these coefficients influence each other. The F1 criterion—mobility credit schemes—takes central position in the web of mutual relations with other criteria. The lowest position of this kind was attained by T2—intelligent route guidance in freight transport.
The AHP results are often considered for a short period of time. On the other hand, the DEMATEL method evaluates both the importance of criteria and shows the causal relations of factors. Analysing the causal diagrams might help improve the effects of decisions for a longer period. Finally, the main advantage of using AHP and DEMATEL methods simultaneously is that the decision-making process can be continuously improved from short and long period perspectives.
4.9. The Policy Implication and Utilization of the Results
The results presented above form the basis of an implementation plan for sustainable UFT development. This approach could help draft a UFT policy in accordance with different objectives and taking into account points of view of various stakeholders. It was applied in the sustainable UFT measures implementation planning for Szczecin Municipality.
The AHP results correlate with the general conclusions of the Freight Quality Partnership meetings in Szczecin and the approach adopted in this city, based largely on the popularization of knowledge in this field and providing mechanisms for cooperation and exchange between multiple stakeholders (including the FQP or the role of an urban logistics manager).
According to the results of the analysis, three major measures were implemented in Szczecin:
Publication of an eco-driving guide, made available for free on the Szczecin municipality website, and including of this approach in the activities of “SOS Foundation—Responsible Driving Schools” (related to the measure “eco-driving trainings”)
Analysis of utilization of InPost parcel lockers in the Szczecin area and, in the next step, in other areas of Poland; this analysis helped to optimize the parcel locker system and reflect on users’ points of view with the aim to reduce the number of trips taken to collect the parcels (related to the measure “alternative delivery systems”)
Web-based promotion of the sustainable UFT system in Szczecin and the Szczecin Metropolitan Area, meetings with stakeholders, organization of “The Sustainable Transport Day” at the Maritime University of Szczecin, and media-based activities (related to the measure “promotional campaigns for sustainable transport”).
The example of Szczecin shows that AHP is a very efficient, simple and valuable method of multi-actor-multi-criteria decision making. It offers a solid background for the creation of a planning implementation process in the area of urban freight transport systems. It is significantly important in view of the diverse expectations of different UFT stakeholder groups.
5. Conclusions
The proper implementation of measures is the most important factor of sustainable urban freight transport development. In view of the high complexity of this system as well as diverse and often conflicting expectations of UFT stakeholders, the decision-making process in this area has become complicated. As a result, utilization of MCDA methods, particularly the MAMCA approach, is an ideal way to find solutions that are optimal from all perspectives.
In this paper, the authors introduced the practical example of applying the MCDA method, as well as some aspects of the MAMCA method, in implementation of sustainable urban freight transport measures in Szczecin. The analysis was based on the Analytic Hierarchy Process (AHP) as well as the Decision Making Trial and Evaluation Laboratory Method (DEMATEL), which are well-known approaches to multi-criteria problem solving.
In recent years, many MAMCA-related analyses have been made in the field of city logistics. The most valuable example is the STRAIGHTSOL project [
6]. One of the aims of this project was to include the stakeholder approach in the impact assessment framework. It is directly related to the approach proposed in the NOVELOG concept. However, the framework introduced in STRAIGHTSOL is mostly focused on a scenario-based analysis. The multi-actor multi-criteria analysis was used in this project to assess how much business-as-usual, the STRAIGHTSOL demonstration and a number of possible future scenarios, contributes to the objectives of the stakeholders [
72]. In addition, the MCDA has been practically implemented to assess the utilization of electric vehicles in urban deliveries [
73]. The authors applied their framework in a future-proof problem of choice of EFVs for deliveries in cities. Based on the formulated assumptions, a multi-criteria model was presented to enable the selection (out of a defined vehicle catalogue) of solutions that are optimal in terms of potential effectiveness [
73]. The multi-criteria decision-making approach to selecting alternative configurations for the distribution chain in urban areas in terms of sustainability was introduced in [
74]. The authors used the fuzzy multi-criteria analysis to aggregate scores for sustainability assessment and selection of the best distribution chain alternative in urban areas, thus considering not only different weights, but also uncertainty. The practical application of the proposed framework was the analysis of alternative courier operations in Rio de Janeiro, Brazil [
74]. However, all the mentioned results are focused on the chosen solutions and activities.
The studies introduced in the paper are different from the achievements presented above. A major novelty is the measures-oriented approach. The assessment is focused on the analysis of measures in general, but not on the scenario level. The analysis of a set of criteria dedicated to the assessment of urban freight transport measures’ implementation was presented. On determining the most important criteria in each of the five perspectives, a set of 16 factors is obtained. Next, with the use of DEMATEL methodology, the matrix of interdependent influences is determined for all criteria pairs. Finally, the matrix of total relations E is created and indicators of position and relation are determined for 5 perspectives, as well as 16 parameters. Following this, the 5 perspectives as well as criteria within these perspectives are determined, identifying the highest and least overall, and net influence.
Using both AHP and DEMATEL methods, we conclude that: (i) All coefficients from administrative, financial, technical and promotional measures are highly interconnected; (ii) strategy of freight transport development should take into consideration how these coefficients influence each other (iii) P2—eco-driving trainings, T4—alternative delivery systems and P1—promotional campaigns for sustainable transport are the most important criteria and should be priorities for investments; (iv) A1—implementation of loading/unloading and transit restrictions highly influences other coefficients; (v) T2—intelligent route guidance in freight transport is highly influenced by them. Additionally, the presented 16 factors can be considered as significant criteria to improve the sustainability of freight transport in the Szczecin metropolitan area.
The results of the analysis were prepared under the Freight Quality Partnership, established in Szczecin during the C-LIEGE project and continued under the following city logistics projects: GRASS and NOVELOG. These results can be useful to Szczecin Municipality in both the evaluation of current operations, as well as in setting future strategies for a more-efficient urban freight transport system, which will be able to meet the expectations of sustainable development of city transport.
It needs to be emphasized that the principal strategic document adopted by the Szczecin Municipality, named “The Strategy for Szczecin Development 2025”, covers areas of the city development policy (in the social, economic and spatial aspects) which, if supported under the current budget conditions, will contribute to the most-effective social and economic development of the city [
75]. A Local Freight Development Plan is being developed since 2016. It will be a strategic plan focused on freight transport functioning, covering the goals and measures to be taken in the mid- and long-term. Additionally, it will be based on systematic surveying of the needs of local stakeholders, who, as the research has shown so far, aptly recognize urban delivery problems [
71]. It is also important that the selection of measures, achieved during the analysis, is not closed and there is openness towards other ideas and projects that may be devised by a vast range of city development stakeholders (both internal and external in relation to the local self-government; including inhabitants, entrepreneurs, investors, institutions, organizations, etc.) [
71].
Moreover, one of the major objectives of the NOVELOG project was to establish a background to prepare Sustainable Urban Logistics Plans (SULP), which should act as supplementary strategic documents for Sustainable Urban Mobility Plans. The analysis introduced in the paper is an important added value in this context. Based on the multi-actor multi-criteria analysis, it is possible to find crucial measures that could serve as general directives for future implementations and developments. The authors introduced the example of utilization of MCDA methods to offer more valuable results and to include different factors in the analysis, which further affect the urban freight transport system in Szczecin. The analysis includes not only the Szczecin city centre, but also other parts of the Szczecin Metropolitan Area.


