Article

Effect of Sugarcane Straw and Goat Manure on Soil Nutrient Transformation and Bacterial Communities

1
Key Laboratory of Sugarcane Biology and Genetic Breeding, Ministry of Agriculture, Fujian Agriculture and Forestry University, Fuzhou 350002, China
2
College of Crop Science, Fujian Agriculture and Forestry University, Fuzhou 350002, China
3
College of Plant Protection, Fujian Agriculture and Forestry University, Fuzhou 350002, China
4
Fujian Provincial Key Laboratory of Agroecological Processing and Safety Monitoring, College of Life Sciences, Fujian Agriculture and Forestry University, Fuzhou 350002, China
5
Key Laboratory of Crop Ecology and Molecular Physiology, Fujian Agriculture and Forestry University, Fuzhou 35002, China
*
Authors to whom correspondence should be addressed.
Sustainability 2018, 10(7), 2361; https://doi.org/10.3390/su10072361
Submission received: 8 June 2018 / Revised: 4 July 2018 / Accepted: 5 July 2018 / Published: 6 July 2018
(This article belongs to the Collection Organic Waste Management)

Abstract

:
Crop residue and animal manure as a soil amendment have been recognized as a feasible agricultural practice owing to its contribution in improving the soil fertility (SF). The primary advantages of this practice are determined by the activities of soil microorganisms. However, goat manure (M), sugarcane straw (S), and goat manure plus straw (MS) amendments influence soil bacteria, their activities, and SF in clay-loam soil remains undefinable. Therefore, this study distinguished the efficacy of M, MS, and S amendment on soil enzyme activities and the availability of nutrients, including various bacterial populations in clay-loamy soil with respect to two different phases (50 and 100 days). In order to analyze the bacterial structure and their activities, we employed high-throughput sequencing (HTS) and soil enzyme activity (SEA) tests. Soil amended with M and MS not only significantly enhanced nutrient availability, including C, P, and N, soil pH, as well as SEA for C and N cycles in both phases. Additionally, the increase in nutrient availability was greater in M- and MS-amended soils in the second phase (100 days) compared to the M- and S-amended soils in the first phase (50 days). Moreover, plant growth promoting and lignocellulose degrading bacterial genera were enhanced under M- and MS-amended soil compared to S-amended soil in both phases. Distance-based redundancy analysis (dbRDA) showed that soil pH, carbon-nitrogen ratio (C:N), and nitrates (NO3) were inducing the fewest changes, while total nitrogen (TN), total carbon (TC), available nitrogen (AN), available phosphorus (AP), total phosphorus (TP), available potassium (AK), and ammonium (NH4+) were the main operators in terms of change in bacterial populations. In general, we observed that M and MS are better amendment sources as compared to S amendment in order to enhance the SF in the clay-loamy soil in both phases, but greater fertility was exhibited in the second phase.

1. Introduction

Utilization of mineral fertilizers to enhance soil fertility (SF) is a fundamental agricultural practice which is primarily employed to increase the nutrients availability for crops, with response to variations in soil characteristics and microbial communities [1]. In the future, agricultural land will be limited due to the continuously rising need for food, shelter, and resources. In view of this, ensuring food security under these circumstances is the main concern that cannot be resolved by adopting only mineral fertilizers in the agricultural sector. Soil degradation and acidification are the leading problems triggered by the application of fertilizers, especially nitrogen fertilizers (N), in order to produce high yields which, in turn, lead to a drastic reduction in soil fertility, including crop yields [2,3,4]. On the contrary, agricultural farming depends on the utilization of organic fertilizers, which is not only highly promising in reducing the application of mineral fertilizers, but also enhances the crop productivity via ensuring ecosystem sustainability [4,5,6,7,8]. In order to increase the SF and productivity, animal manure and crop residues as soil amendments are considered a great agricultural practice [9,10]. Several studies have been carried out to identify the role of organic material (e.g., plant leaves) in the soil. For instance, dry branches and leaves are the main additional resources of organic matter and nutrients as they constitute an imperative operation in the cycling of nitrogen (N) and carbon (C) among plants and soil [11,12]. Additionally, leaves have an enormous quantity of N and C, which are the main nutrient sources used for soil microorganisms’ activities [13]. Consequently, decomposed and decayed leaves have a positive influence on soil microorganisms, due to the increase in C content and nutrients in the alternating soil microclimate [14]. Similarly, recently investigators have examined the impacts of plant leaves on soil properties and revealed that leaves were the major sources to add extra carbon and nitrogen to the soil. In the same way, decomposed leaves take part in the release of essential nutrients and these nutrients are important for the growth and development of plants [12,13,15]. More recent evidence has suggested that the addition of litter has a significant effect on the development of soil microbiota leading towards higher nutrient levels in soil and microbial biomass [16].
Soil microbiota have the main role of sustaining soil functions. They have great metabolic functions and are indispensable for almost all biogeochemical processes [4,17]. Using organic fertilizers on agricultural land has a promising effect on bacterial communities in the soil [4]. Fluctuations in bacterial populations in the soil in relation to diverse agricultural practices can help us explain the processes of nutrient cycling in the soil. Recently, researchers have examined microbial ecological changes under the organic waste amendment of the soil [18,19]. For instance, Giacometti et al. [20] and Peruzzi et al. [21] reported that manure amendment shows significant changes in the bacterial communities under S amendment. For instance, Das et al. [9] revealed that cattle manure amendment has developed the nutrient availability, particularly C, P, and N, improving soil microbial biomass, as well as soil pH. Additionally, it enhanced some species that decompose the organic compounds and promote the growth of plants. Similarly, Cesarano et al. [10] compared the mineral fertilizers and various organic amendments of the soil. They revealed that organic amendment not only improves the soil physiochemical features and microbial diversity, but also improves the functions of the microbes.
The traditional techniques for investigating the soil microorganisms are greatly restricted, mainly concerning cultivable microorganisms and a beneficial group of bacteria. With the advancement of molecular biology, HTS has been recognized as an effective method for the evaluation of soil microbial ecology [22]. However, current studies have employed HTS to understand the soil microbial diversity and composition under various organic amendments [9,10,23]. Much work on the potential utilization of organic fertilizers as a promising approach in order to recover soil fertility in agriculture has been carried out [4,24,25]. However, the impact of organic amendments in clay-loam soils in terms of a specific period of time was yet to be explored. Assuming that different organic amendment (goat manure (M), sugarcane straw (S), and sugarcane straw + goat manure (MS)) has diverse effects on the soil physiochemical features, including soil nutrients. Moreover, we assumed that these modifications may greatly alter the soil bacterial population, as well as their functions, which may have an encouraging impact on SF. Adopting a distance-based redundancy approach combined with microbial community characterization by HTS and SEA indicative of C, N, and P cycling, this study was aimed to identify the time and most appropriate M and MS amendment practices (M1, MS1 and M2, MS2) compared to S (S1, S2) to improve SF in clay-loamy soil. The primary objectives of our experimentation were (a) to examine the differences of soil bacterial populations in M-, S-, and MS-amended-soil; (b) to estimate the significance of different bacterial populations and structures on C, N, and P acquisition; and (c) to investigate the relationships among bacterial composition and soil features in two phases.

2. Material and Methods

2.1. Experimental Design and Soil Sample Preparation

S, M, and MS amendment were examined on soil chemical properties and bacterial dynamics under two phases (50 days and 100 days). Four treatments applying two types of organic matter (M, S, and MS) and without amendment control (CK) soil were designed and conducted from March 2017 to June 2017 at Fujian Agriculture and Forestry, Fuzhou, Fujian Province, China. In this experiment, pots (red PVC) with 180 mm height and 120 mm diameter were filled with clay-loamy soil collected from the a 0–12 cm layer from a university sugarcane cultivation field (latitude: 26°05′9.60″ N; longitude: 119°14′3.60″ E). S was sampled from the university sugarcane garden and chopped into small pieces, air dried for twenty days, and then stored at room temperature. However, M was bought from the local market. Physiochemical properties of soil, sugarcane straw, and goat manure used in this experiment were as follow; (i) soil: total carbon (TC) 0.97%, total phosphorus (TP) 0.07%, total nitrogen (TN) 0.10%, soil mechanical composition was: clay 20.3% silt 43.1% sand 36.6%; (ii) sugarcane straw: TC 44.15%, TN 0.45%, TP 0.04%, total potassium (TK) 0.5%, and C:N ratio 98.11; and (iii) goat manure: TC 17%, TN 0.8%, TP 0.52%, TK 0.41%, and C:N ratio 21.25. For S amendments, the mixture contained 15% S and 85% soil by dry weight. A similar concentration for M amendment had 15% M and 85% soil. However, for MS amendment, the mixture contained 7.5% M, 7.5% S, and 85% soil, respectively [26]. Overall, three replications were considered for each pot. According to Sun et al.’s [16] experiment, mean low and high air temperature (18–30 °C) and 75–80% of relative humidity were maintained throughout the trial. Pots of every treatment were irrigated by one liter of distilled water on a weekly basis. After 50 days (Phase 1) and 100 days (Phase 2), 20 g of soil obtained from each pot was sieved by employing a 2-mm sieve. Furthermore, freshly-sieved soil samples were stored at −80 °C in order to isolate DNA, while some soil samples were air-dried for soil physio-chemical analysis.

2.2. Physiochemical Properties of the Soil

A glass electrode pH meter was used to measure the soil pH. TN and TC were determined by using the Flash Smart elemental analyzer (Thermo Scientific™, Waltham, MA, USA). The Molybdenum Blue method was followed to estimate available phosphorus (AP) via using ammonium fluoride and hydrochloric acid. The alkaline hydrolyzable method was used for calculating the available nitrogen (AN), while ammonium acetate and flame photometry were utilized to extract available potassium (AK) [27]. For the extraction of ammonium (NH4+) and nitrate (NO3) contents of soil, 2 M KCl was utilized and, moreover, these contents were measured by a Bran+Luebbe GmbH-AutoAnalyzer 3 (Bran+Luebbe, Norderstedt, Germany).

2.3. Soil Enzymes Activity

Soil urease (UE) and cellulase (CL) activities were determined via protocols utilized by Chen et al. [23] and Sun et al. [26]. Soil cellulase activity (CL) is indicated as the number of milligrams of glucose in 1 g of dry soil at 37 °C for 24 h, which was measured colorimetrically by measuring the 3.5-dinitrosalicylic acid reduction from the reducing sugars leading towards the incubation of soil with a buffered sodium carboxymethylcellulose solution at 37 °C for 24 h. Improved sodium phenate and sodium hypochlorite colorimetry were used to determine the soil urease activity, which has been indicated as the number of μg of NH3-N in 1 g dry soil at 37 °C for 24 h [28]. Nitrophenyl phosphate disodium was used as a substrate to analyze the neutral phosphatase (NP), which is indicated as the number of nmol of phenol in 1 g of dry soil at 37 °C for 24 h. The activity of β-glucosidase (p-nitrophenol, μmol g−1, 24 h, 37 °C) was estimated through the release and detection of p nitrophenol (PNP) using p-nitrophenyl-β-glucopyranoside as a substrate in spectrophotometer [29].

2.4. DNA Extraction and Purification

Genomic DNA from all the samples was extracted by employing the Fast DNATM Spin kit according to the manufacturer’s guideline (MP Biomedical, Santa Ana, CA, USA) which is designed for soil DNA isolation. Moreover, all isolated DNA samples were subjected to gel electrophoresis. In addition, DNA purification was completed via DNA purification kits according to manufacturer instructions (Tiangen Biotech Co., Ltd., Beijing, China). Nanodrop was adopted for all DNA samples to quantify prior to storage at −20 °C for further analysis.

2.5. Metagenomics Analysis of the Soil Bacteria

For the measurement of the bacterial community structure, purified DNA samples were transferred to Novo Gene Bioinformatics Technology Co., Ltd. (Beijing, China). Before HTS, amplification of the 16S V4, 16S rRNA distinct gene region was amplified via the primer 515F-806R with barcodes [30]. Thirty microliters of total PCR reaction volume was used, containing 15 µL of Phusion® High-Fidelity PCR Master Mix (New England Biolabs (Beijing) Ltd., Beijing, China), along with template DNA (~10 ng) and 0.2 M of each primer pair. The PCR conditions involved initial denaturation at 98 °C for 1 min, followed by another denaturation (30 cycles) at the same temperature for 10 s. Then annealing was done at 50 °C for 30 s, followed by elongation at 72 °C for 60 s, and a final extension at 72 °C for 5 min. Afterward, gel electrophoresis was performed via agarose gel solution (2%) for verification of successful DNA amplification and the visualization of bands. Samples showing 400–450 bp bright bands were excised and purified by using a Gene JET Gel Extraction Kit (Qiagen, Hilden, Germany) leading towards their successful Illumina sequencing via generating libraries through specialized NEB Next® Ultra™ DNA Library Prep Kit (New England Biolabs (Beijing) Ltd.) according to the manufacturer’s instructions. Index codes were added for each library. An Agilent Bioanalyzer 2100 system (Agilent, Santa Clara, CA, USA) and the Qubit® 2.0 fluorimeter (Thermo Fisher Scientific, Waltham, MA, USA) was used to check the quality of each library. Finally, 250/300 bp paired-end reads were generated on an Illumina MiSeq platform (Illumina, San Diego, CA, USA).

2.6. Statistical and Bioinformatics Analysis

On the basis of specified barcodes given to each sample, all the raw sequences were further classified via using Quantitative Insights Into Microbial Ecology (QIIME) (CO, USA) [30]. FLASH (Baltimore, MD, USA) was employed to merge the paired-end reads (PERs) taken from the original DNA segments leading to assigning of the unique barcodes to each PER [31]. Analysis of each sequence was done through UPARSE-OTU and UPARSE-OUT reference algorithms with the UPARSE pipeline (CA, USA). QIIME (CO, USA) was used to assess the beta and alpha diversity of the samples [30]. Similar operational taxonomic units (OTUs) were assigned to the sequences with 97% in each sample. Each OTU was further represented by a single sequence for annotating the taxonomic information by using the RDP classifier. The OTU table was then rarified for measurement of the alpha diversity (species abundance estimation through Chao1, while Simpson and Shannon’s indices were utilized for determination of and the observed species community diversity. Furthermore, for each of these indices, rarefaction curves were developed. From phylum to species to other bacterial taxa, the abundance of each community has been shown via graphs through Krona Chart (V 2.7). On the other hand, QIIME (Version 1.7.0) (CO, USA) was used to measure the beta diversity for both weighted and unweighted UniFrac distances. Principal component analysis (PCA) and principal coordinate analysis (PCoA) were performed and visualized using R (Version 2.15.3) packages stat, WGCNA, and ggplot2 (Elegant graphics for data analysis, New York, NY, USA). db-RDA was used to identify the association between the abundant bacterial phylum [32], further generating the triplots using vegan and ggplot2 packages in R software (R version 3.3.1) (Foundation for Statistical Computing, Vienna, Austria).

3. Results

3.1. Soil Physicochemical Characteristics

Soil physicochemical characteristics have been mentioned in Table 1. Amendment of soil with M, S, and MS (i.e., M1, S1, and MS1) significantly enhanced the soil characteristics, such as pH, TC, TN, AP, AN, AK, and total P, in the first phase (after 50 days). Soil nitrate (NO3) and ammonium (NH4+) concentration were high in M1 and MS1, as compared to all other treatments in the first phase, and enhanced more in the M1 and MS1 treatments. A similar trend was observed in all the treatments in the second phase (after 100 days).

3.2. Soil Enzyme Activity (SEA)

Urease (UE) and β-Glucosidase activity (β-GC) was significantly improved in M- and MS (M1 and MS1)-amended soil as compared to CK1 and S1 in the first phase. A similar trend was observed in M2 and MS2, as compared to CK2 in the second phase. Natural phosphatase activity (NP) was significantly decreased in M1 and MS1, as compared to control CK1 and S1 in the first phase. Similarly, natural phosphatase activity (NP) decreases significantly in M2 and MS2, as compared to control CK2 and S2 in the second phase. Cellulase activity (CL) in M1, MS1 increased insignificantly, as compared to CK1 and S1 in the first phase, while increasing significantly in M2 and MS2, as compared to CK2 and S2 in the second phase (Table 2).

3.3. Meta-Genomic Analysis Based on 16S rDNA of All Soils

According to analysis of rarefaction, OTUs for the 16S rRNA plateaued after 45,000 sequences through 97% resemblance (Figure 1). This indicated that in order to capture the richness and diversity in organic-amended soil samples, sequencing gravity was enough. The HTS analyzed a total of 1,693,676 (mean: 70,570) number of reads. Bacterial relative abundance was observed by phylum, including the genus level, to inspect the response of S and the M amendment on bacterial composition with different time periods. Thirty-five various phyla were noticed in all soils in two phases (after 50 days and 100 days). However, only Proteobacteria, Bacteroidetes, Acidobacteria, Firmicutes, Chloroflexi, Gemmatimonadetes, Verrucomicrobia, Actinobacteria, and Lagnavibacteriae were detected in all samples which represent 90–96% of the bacterial sequences (Figure 2a). In the first phase (after 50 days) the composition of the microbial community in the control soil (CK1) without amendment was dominated by Proteobacteria (H16, Shingomonas, Haliangium, Rhizomicrobium), Acidobacteria (Candidatus koribacter, Candidatus soliibacter, Bryobacter), Bacteroidetes (Bacteroids), Firmicutes, Verrucomicrobia (Opitutus), Actinobacteria, Planctomycetes (Candidatus nitrosotalea), Chloroflexi, Gemmatimonadetes, and Ignavibacteriae with average relative abundances of 39.38%, 24.59%, 10.84%, 4.28%, 4.02%, 2.46%, 1.13%, 2%, 2%, and 0.15%, respectively (Figure 2a,b). The application of M shifted the microbial population in M1 (Figure 2). The dominant phyla in the M1 soil sample were Proteobacteria (Unidentified Xanthomonadales, Altererythrobacter, Simiduia, Luteimonas and Azoarcus), Acidobacteria, Bacteroidetes (Chryseolinea, Pertrimonas and Ruminofilibacter), Firmicutes, Planctomycetes, Chloroflexi, Gemmatimonadetes, Verrucomicrobia, Actinobacteria, and Ignavibacteriae with average relative abundances of 55.13%, 3.39%, 24.54%, 3.07%, 0.78%, 0.94%, 0.94%, 2.7%, 1.58%, and 0.09%, respectively. The application of the MS-shifted composition of the microbial community in the MS2 soil sample was dominated by Proteobacteria (Simiduia, Luteimonas, Azoarcus, Pseudomonas, Hydrogenophaga and Arenimonas), Bacteroidetes (Proteiniphilum, Petrimonas, and Ruminofilibacter), Acidobacteria, Firmicutes, Planctomycetes, Chloroflexi, Gemmatimonadetes, Verrucomicrobia (Opitutus), Actinobacteria, and Ignavibacteriae, with average relative abundances of 52.41%, 24.50%, 4.53%, 5.17%, 0.92%, 1.46%, 1.46%, 2.3%, 1.6%, and 0.13%, respectively, whereas only S application shifted the microbial community structure in the S1 soil sample, which was dominated by Proteobacteria (Geobacter, Anaeromyxobacter, Sphingomonas, Rhizomicrobium, Haliangium and H16), Acidobacteria (Candidatus koribacter, Candidatus soliibacter and Bryobacter), Bacteroidetes (Flavisoilbacter), Firmicutes, Planctomycetes, Chloroflexi, Ignavibacteriae, Verrucomicrobia (Opitutus), Actinobacteria, and Gemmatimonadetes which accounted for average relative abundances of 55.10%, 13.86%, 10.41%, 3.59%, 0.69%, 2.3%,0.51%, 3.18%, 2.5%, and 2.3%, respectively.
Similarly, relative abundances of bacterial taxa were examined in the same soil samples in the second phase (after 100 days); the dominant bacterial communities in control soil (CK2) were Proteobacteria (Rhizomicrobium, Dyella, Haliangium, H16, Acidibacter and Denitratisoma), Acidobacteria (Candidatus koribacter, Bryobacter, and Candidatus solibacter), Bacteroidetes (Bacteroides), Planctomycetes (SM1A02, Candidatus jettenia) and firmicutes (Enterococcus), Chloroflexi (unidentified_SJA−28), Ignavibacteriae (Ignavibacterium), Actinobacteria, Gemmatimonadetes, and Verrucomicrobia with average relative abundances of 35%, 22.7%, 8.1%, 5%, 4.4%, 3.7%, 1.9%, 1.3%, 3.7%, and 2.9%, respectively. In the M-containing soil (M2), Proteobacteria (unidentified Xanthomonadales, Altererythrobacter, Acidibacter, Pseudomonas, Arenimonas, Denitratisoma and Haliangium), Acidobacteria (Paludibaculum), Bacteroidetes (Chryseolinea), Planctomycetes (SM1A02 and Candidatus jettenia), Ignavibacteriae (Ignavibacterium), Chloroflexi (unidentified SJA−28), firmicutes, Verrucomicrobia (Opitutus), Actinobacteria, Gemmatimonadetes, and Verrucomicrobia were dominant with average relative abundances of 50%, 7%, 11%, 6.2%, 1.5%, 3.9%, 2.2%, 2.4%, 2.2%, and 3.9%, respectively (Figure 2a,b).
Application of MS shifted the composition of the microbial community in the MS2 soil sample, which was dominated by Proteobacteria (Acidibacter, Denitratisoma, unidentified Xanthomonadales, Altererythrobacter, Pseudomonas, Hydrogenophaga), Bacteroidetes, Acidobacteria (Paludibaculum), Planctomycetes (SM1A02 and Candidatus_Jettenia), Firmicutes, Chlorobi (unidentified SJA−28), Ignavibacteriae (Ignavibacterium), Verrucomicrobia (Opitutus), Actinobacteria, and Gemmatimonadetes with average relative abundances of 51%, 9.6%, 8.5%, 7.6%, 1.7%, 4.3%, 1.8%, 2.7%, 1.3%, and 4.3%, respectively. Likewise, the dominant bacterial communities in S-amended soil (S2) in the second phase were Proteobacteria (Geobacter, Anaeromyxobacter, Sphingomonas, Rhizomicrobium, H16, Acidibacter, Denitratisoma, Haliangium and Dyella), Acidobacteria (Candidatus koribacter, Bryobacter and Candidatus solibacter), Bacteroidetes, Firmicutes, Planctomycetes (Candidatus jettenia), Ignavibacteriae (Ignavibacterium) and Chlorobi (unidentified SJA−28) Verrucomicrobia, Actinobacteria, and Gemmatimonadetes with average relative abundances of 50.2%, 18%, 6.2%, 4.3%, 3.1%, 1.77%, 2.60%, 2.44%, 2.32%, and 2.6%, respectively (Figure 2a,b).

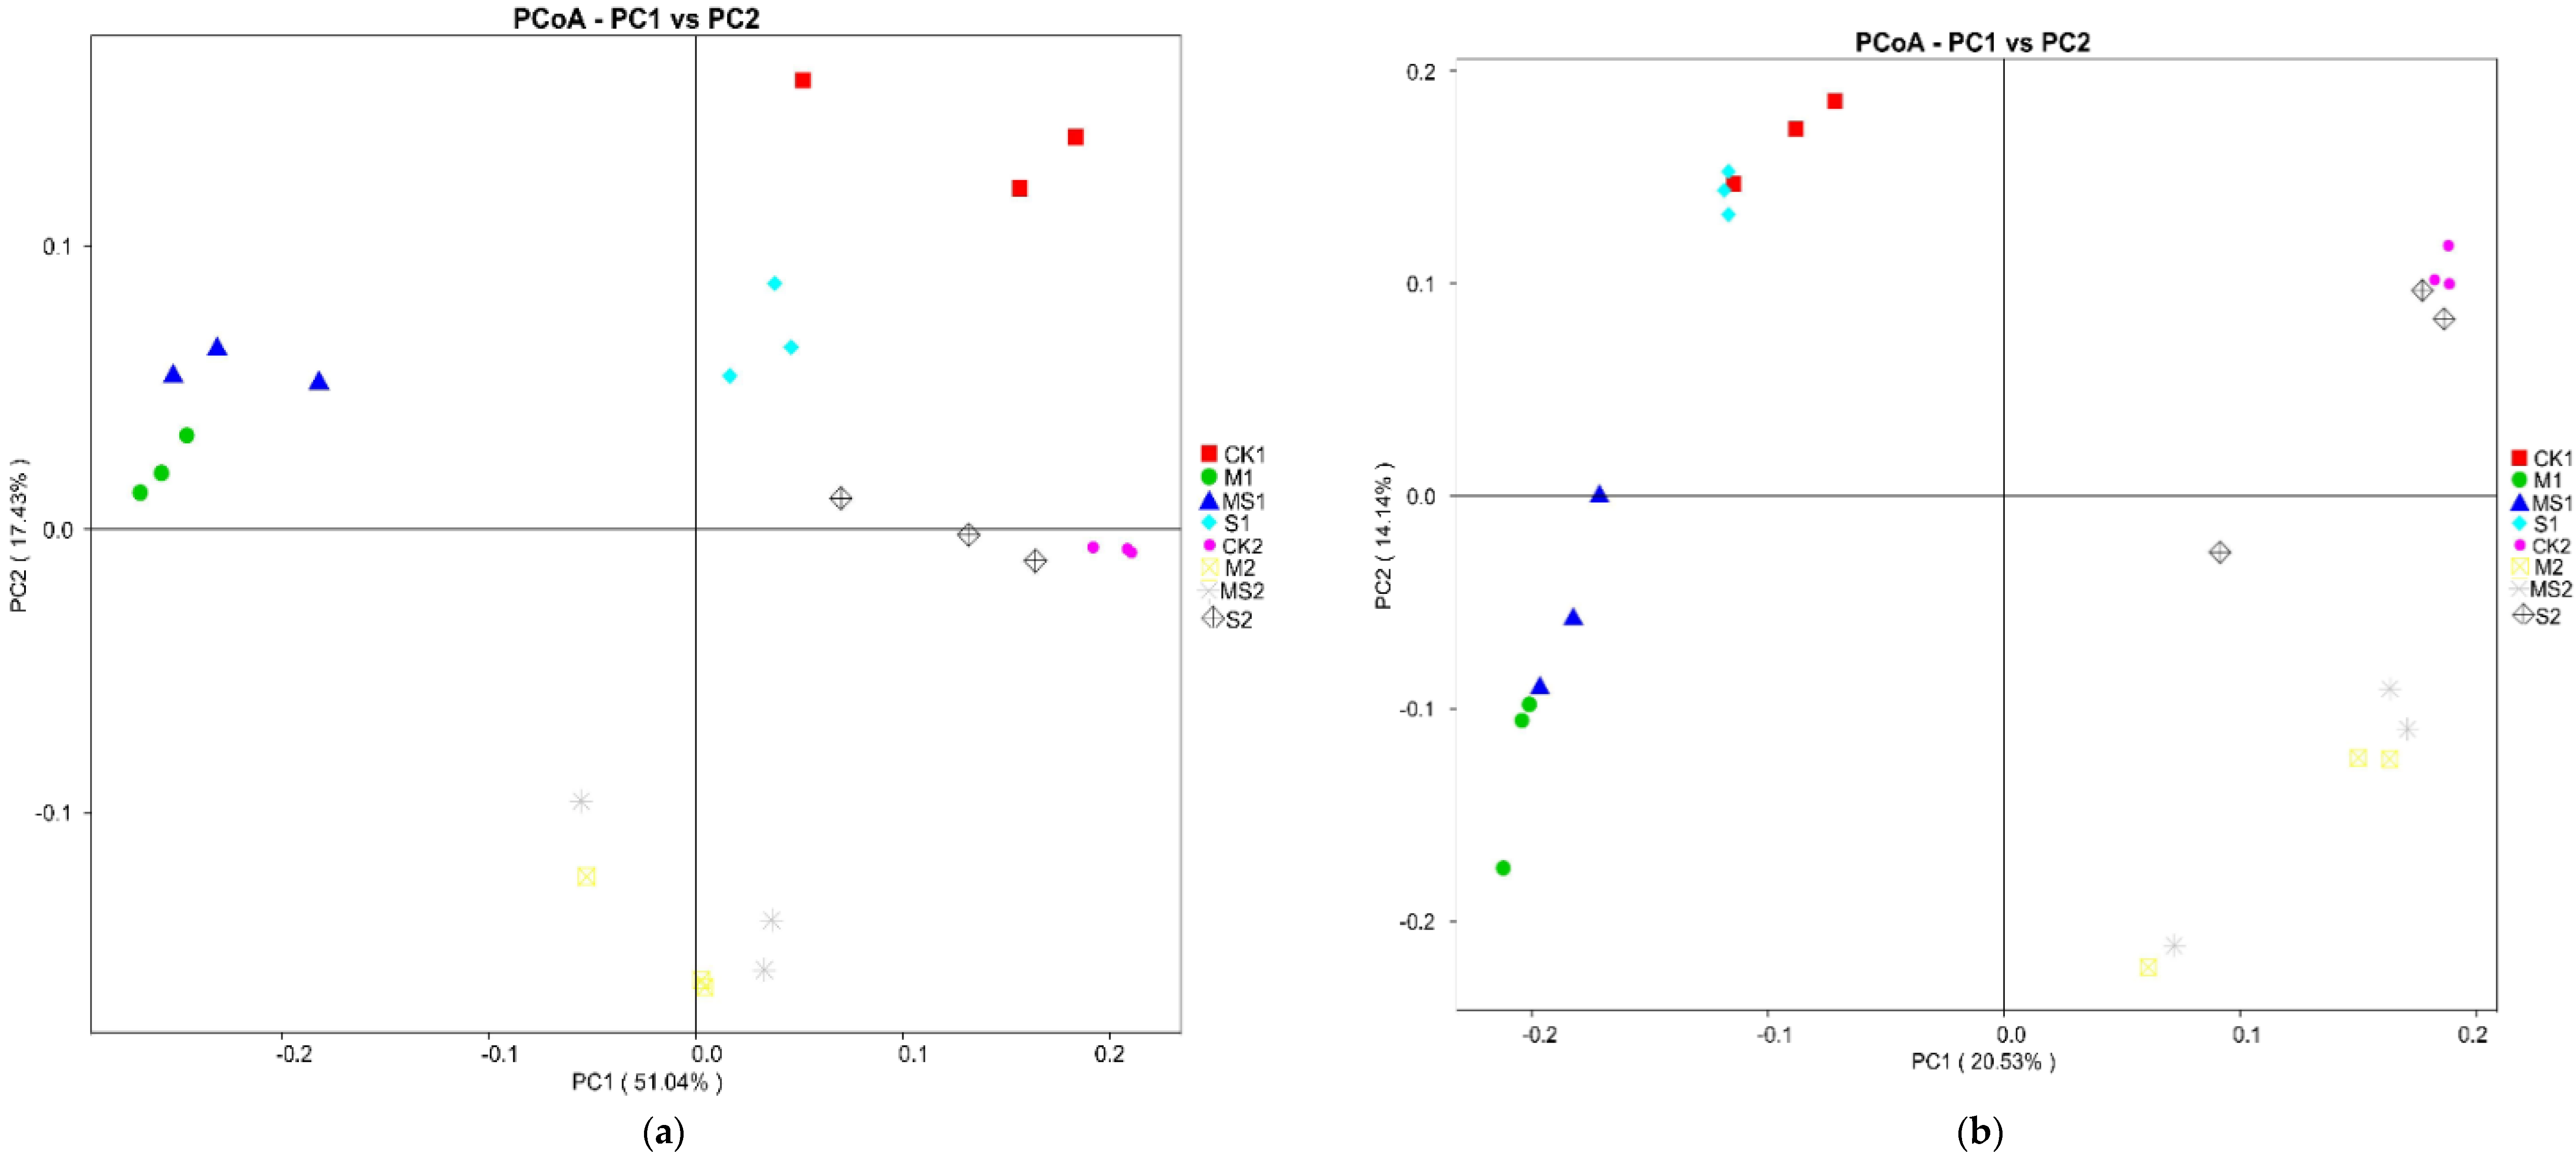
3.4. Overlying and Separate Bacterial Groups across All Soil Sample with Different Time

ACE and Chao1 estimation demonstrated that soil amended with M and MS (M1, MS1) showed lower bacterial community richness as compared to control and all other amended soils (CK1, S1), in the first phase, respectively (Figure 3a,b). However, during the second phase, M-amended (M2) soil showed higher bacterial community richness than all other amended and control soils (S2, MS2, and CK2), respectively, while diversity of Simpson including Shannon (SSD) indices declined in S- and M-amended soils (M1 and MS1) as compared to control (CK1) and S-amended soil (S1) during the first phase. Likewise, a significant decrease in the M2 and MS2, as compared to control soil (CK2) and S-amended soil (S2) during the second phase was recorded. From a diversity comparison among all amended soils in both phases, the SSD decreased significantly in M1, M2, MS1 and MS2, however, no significant differences were observed for S1, S2 across all the samples (Figure 3c,d). Both weighted (WT) on the basis of taxa abundance and un-weighted (UWT) based on sensitive to rare taxa UniFrac distance matrices were used to estimate the β-diversity among soil samples. From the WT UniFrac principal coordinate analysis (PCoA) during both phases, soils displayed that bacterial populations in control (CK1, CK2) and (S1, S2) were distinguished from (MS1, MS2) and (M1, M2). Clustering of M1, M2, and MS1 and MS2 was observed along axis-1, while the clustering of S1 and S2 was along axis-2. Furthermore, UWT UniFrac PCoA analysis demonstrated that bacterial populations in the CK1 and S1 were also differentiated from M1 and MS1, and their clustering was observed towards axis-1 in both phases while clustering of M2, S2, and MS2 was along axis-2 (Figure 4a,b).
The difference between the structure of bacterial communities among various samples was shown via the UWT pair group method with arithmetic mean clustering analysis (UPGMA) (Figure 4c). In the first phase, WT and UWT UniFrac distances among CK1, M1, CK1, MS1 CK1, and S1 were 0.424, 0.414, 0.374, 0.430, 0.219, and 0.411, respectively, whereas, in the second phase, distances among CK2, M2, CK2, MS2, CK2, and S2 were 0.279, 0.416, 0.263, 0.408, 0.210, and 0.373, respectively. In comparison between both phases, distances among CK1, CK2 M1, M2, MS1, MS2, S1, and S2 were 0.184, 0.433, 0.305, 0.469, 0.311, 0.487, 0.192 and 0.466 respectively. Comparing CK (CK1, CK2) with all other S-, M-, and MS-amended soils (M1, M2, MS1, MS2, and S1, S2), the WT and UWT UniFrac distances increased in M1, M2 and MS1, MS2 during both phases (Figure 4d).

3.5. Correlation among Bacterial Groups and Soil Variables

Significant correlation was observed between the soil pH, C:N, NO3, TC, TN, AN, TP, AP, AK, and NH4+ with soil bacterial communities via Mantel test (MT) analyses (Table 3). The results clarified that the soil TC, TN, AN, TP, AP, AK, and NH4+ have a strong influence upon various bacterial communities. Distance-based redundancy analysis (dbRDA) plots showed a distinct grouping of bacterial populations from various treatments. In addition, soil pH, C:N, NO3, TC, TN, AN, TP, AP, AK, and NH4+ had a positive and significant relationship with dbRDA axis-1 (Figure 5a,b). Furthermore, Proteobacteria displayed positive and significant correlation, whereas Acidobacteria, Actinobacteria and Verrucomicrobia demonstrated significant and negative interaction with C:N, pH, NO3, TC, TN, AN, TP, AP, AK, and NH4+ (Figure 5a). The genera Pseudomonas, Hydrogenophaga, and Arenimonas had significant and positive interaction, although Geobacter, Sphingomonas, and Candidatus soliibacter had a negative and significant relationship with NO3, pH, C:N, TC, TN, AN, TP, AP, AK, and NH4+ (Figure 5b).

4. Discussion

Although utilization of organic fertilizers and other agricultural amendments in crop cultivation have been admitted to be an encouraging management method to recover SF, however, there were concerns regarding which organic matter as a soil amendment and time are more effective prior to crop sowing. Therefore, the current research is helpful to distinguish the outcomes of goat manure (M), sugarcane straw (S), or goat manure + sugarcane straw (MS) on SF, with a focus on the soil bacterial communities’ structures with different periods. Organic fertilizer application in soil increases or stabilizes the soil pH [4,33,34]. However, the findings of this study indicated that M1, MS1, M2, and MS2 amendments were more effective in increasing the soil pH, which is consistent with the previous results of Han et al. [35] and Das et al. [9]. Adding various organic supplements to the soil enhances the accumulation of basic macronutrients, especially N, K, and P, as well as soil organic matter [16]. Correspondingly, our results suggested an improvement of various soil properties in M1, MS1, M2, and MS2 amendments, such as TC, AP, AK, TN, AN, NH4+, NO3, compared to CK1, CK2, and S1, S2 with the same amendment rate in both phases (Table 1). On the other hand, there was a decrease in species richness of M- and S-amended soil (M1, M2, MS1, and MS2) compared to the S-amended (S1, S2) soil in both phases. This may be due to a higher population of oligotrophs (organisms that frequently exist in an environment with low levels of nutrients) in CK and S soils [36]. Furthermore, we believe that the high nutrient availability reduced the species richness in M1-, M2-, MS1-, and MS2-amended soil and a small quantity of nutrients stimulated their growth in CK1, CK2, as well as in S1, S2, in both phases. [9,16]. It is assumed that the increase in beneficial bacterial composition and biomass, including greater availability of C, P, and N in the M1-, M2-, MS1-, and MS2-amended soils, will improve the fertility of the soil.
SEAs are considered sensitive indicators for SF as they are essential to catalyze the key biochemical reactions, such as the degradation of organic nutrients and nutrient cycling [23,37,38]. The evidence presented in this section suggests that M- and MS (M1, M2, MS1, MS2)-amended soil enhanced the N and C cycling enzymes as compared to S-amended soil (S1, S2) in both phases (Table 2). Additionally, a greater turnover amount of C and N in M1-, M2-, MS1-, and MS2-amended soils were recorded as compared to S1- and S2-amended soils. This may be due to the enhanced population of autochthonous microorganisms in M1, MS1, M2, and MS2 soils compared to CK1, CK2, and S1, S2. The improved activities for N, P, and C cycling enzymes have been reported as a consequence of the application of M and S in soils [23,39]. Interestingly, a decline of P-cycling enzyme activity was examined in both M- and MS (M1, MS1, M2, and MS2)-amended soils compared to S-amended soil (S1, S2) and control soils in both phases (Table 2). Previous findings correspond with the reduction in phosphatase enzyme activity via the application of organic manure in agricultural soils. The increase in P demand for the soil microorganisms may enhance the enzymatic acquisition of P in livestock manure-amended soils [9,40].
Researchers have investigated the impact of agriculture management techniques on SEAs, including the microbial composition in soil. Moreover, microbial diversity assessment has become more authentic in the presence of HTS. Identification of key species that influence ecosystem functions is one of the excellent features of the HTS approach [41]. Our results presented a higher abundance of Proteobacteria in all organic amendments compared to CK in both phases, which is in agreement with the previous results [9,10,16]. Proteobacteria are known as copiotrophic microorganisms, which exist in an ecosystem with high nutrients. [36,42]. Bacteroidetes exhibited much higher abundance under M1, MS1, M2, and MS2 as compared to CK1, CK2, S1, and S2. Notably, in both phases, the relative abundance of Bacteroidetes was much lower in CK1-, CK2-, S1-, and S2-amended soils, respectively, which is supported by the previous findings [9]. Bacteroidetes was much more abundant in M-amended soil because it is one of the plentiful bacterial phyla of livestock manure [43], recognized as a crop straw decomposer, and survives in the agricultural land [44,45]. Acidobacteria exhibited low abundance in M-, MS-, and S-amended soil compared to CK in both phases. By the application of S and M, a decrease in Acidobacteria was recorded, which is consistent with the previous results [9,16]. Additionally, HTS-based investigations exposed that the abundance of Acidobacteria is reduced significantly by the amendment of organic fertilizer [40,46,47]. Actinobacteria decompose the organochemicals [48] and were more abundant in CK1 and MS2 [10], as well as S soil (S1, S2). The abundance of these bacteria was greater in S-amended soil due to their strength to decompose of soil organic matter (e.g., chitin and cellulose) [49]. These findings corroborate the previous results as well [9]. The highest abundance of Firmicutes was observed in the MS1- and S2-amended soils. These bacteria thrive in soil with high C availability [50] and are well-known to degrade several complex organic materials [51,52]. Similarly, Wu and He [53] explained that Firmicutes can play a role in lignin depolymerization. Moreover, they can take part in rice straw compost [54,55], and decaying wood [56]. The phyla Verrucomicrobia and Gemmatimonadetes were highly abundant in the S-, compared to the M- and MS-amended soils in the first phase, whereas MS was most dominant, as compared to M- and S-amended soil in the second phase, respectively. It is difficult to conclude their possible function in the ecosystem owing to the absence of cultured representatives of these phyla. Planctomycetes are anaerobic ammonium oxidizing bacterium which can contribute to N and C cycling in the soil [57]. A higher abundance of these bacteria in M- and MS-containing soil is due to a large amount of N and C sources than CK- and S-amended soil in the second phase [23].
We found some dominant genera which have a vital role in plant promotion, as well as in lignocellulose degradation. M-amended soil was dominated by Simiduia, Luteimonas, Azoarcus, Opitutus, unidentified Xanthomonadales, and Altererythrobacter genera as compared to CK-, MS-, and S-amended soil in the first phase. Similarly, MS-amended soil was dominated by Proteiniphilum, Petrimonas, Ruminofilibacter, Thermomonas, Pseudomonas, Hydrogenophaga, and Arenimonas genera as compared to CK, M, and S in the first phase while, in the second phase, dominant genera (SM1A02, Chryseolinea, unidentified Xanthomonadales, Altererythrobacter) were found in the M-amended soil as compared to CK-, MS-, and S-amended soils. Likewise, MS-amended soil was dominated by Paludibaculum, Candidatus jettenia, and Opitutus as compared to CK-, M-, and S-amended soil in the second phase. Evident from multiple studies, most of these dominated genera promote plant growth (Supplementary Table S2) [1,58]
Soil characteristics are the most significant modulators of the bacterial community composition [4,59]. In a comparison of both phases, C:N and NO3 were minor, while AK, AN, and NH4+ were major factors affecting the bacterial community structure under M- and MS-amended soils in the first phase. In the second phase, soil pH was minor, while TC, TN, TP, and AP were major factors affecting the bacterial community structure under M2- and MS2-amended soil. Overall, our observation revealed that M1, M2, MS1, and MS2 amendment not only increased the major nutrients, especially N, C, and P, and increased soil pH, but also stimulated the positive bacterial genera which have important functions in the plant growth promotion and decomposition of complex organic matters in both phases. The changes can be effective to improve SF under M1, M2, MS1, and MS2 amendment in the clay-loamy soil after 50 days, as well as 100 days. We further disclosed the effect of M and MS amendment, as well as the role of time on SF, soil biochemical properties, and soil microbial diversity as compared to S amendment. These observations have increased our knowledge of what type and time of organic amendment are suitable before crop sowing.

Supplementary Materials

The following are available online at https://www.mdpi.com/2071-1050/10/7/2361/s1, Table S1: Statistics of Operational Taxonomic Units (OUT), Table S2: Dominant genus possible role on soil fertility and plant growth.

Author Contributions

All authors contributed to the intellectual input and provided assistance to this study and manuscript preparation. M.T., W.I., C.Z., and Y.A. designed the research and conducted the experiments. M.T., W.I., Q.P., Y.L., and M.W. analyzed the data. M.T. and W.I. wrote the manuscript. H.Z., W.L., and S.L. reviewed the manuscript. H.Z., supervised the work and approved the manuscript for publication.

Funding

This research was funded by Public Welfare Industrial Research Project of China grant number 20150311904-01 and the Earmarked Fund for the Modern Agriculture Technology of China via grant number CARS-20-4-3.

Acknowledgments

We acknowledge the Public Welfare Industrial Research Project of China, (20150311904-01) and the Earmarked Fund for the Modern Agriculture Technology of China (CARS-20-4-3). We want to praise the donor agencies of China for supporting this project.

Conflicts of Interest

The authors declare no conflicts of interest.

References

  1. Li, F.; Chen, L.; Zhang, J.; Yin, J.; Huang, S. Bacterial community structure after long-term organic and inorganic fertilization reveals important associations between soil nutrients and specific taxa involved in nutrient transformations. Front. Microbiol. 2017, 8, 187. [Google Scholar] [CrossRef] [PubMed]
  2. Tao, J.; Liu, X.; Liang, Y.; Niu, J.; Xiao, Y.; Gu, Y.; Ma, L.; Meng, D.; Zhang, Y.; Huang, W.; et al. Maize growth responses to soil microbes and soil properties after fertilization with different green manures. Appl. Microbiol. Biotechnol. 2017, 101, 1289–1299. [Google Scholar] [CrossRef] [PubMed]
  3. Ju, X.-T.; Xing, G.-X.; Chen, X.-P.; Zhang, S.-L.; Zhang, L.-J.; Liu, X.-J.; Cui, Z.-L.; Yin, B.; Christie, P.; Zhu, Z.-L. Reducing environmental risk by improving N management in intensive Chinese agricultural systems. Proc. Natl. Acad. Sci. USA 2009, 106, 3041–3046. [Google Scholar] [CrossRef] [PubMed] [Green Version]
  4. Tayyab, M.; Islam, W.; Khalil, F.; Ziqin, P.; Caifang, Z.; Arafat, Y.; Hui, L.; Rizwan, M.; Ahmad, K.; Waheed, S.; et al. Biochar: An efficient way to manage low water availability in plants. Appl. Ecol. Environ. Res. 2018, 16, 2565–2583. [Google Scholar]
  5. Kravchenko, A.N.; Snapp, S.S.; Robertson, G.P. Field-scale experiments reveal persistent yield gaps in low-input and organic cropping systems. Proc. Natl. Acad. Sci. USA 2017, 114, 926–931. [Google Scholar] [CrossRef] [PubMed] [Green Version]
  6. Tilman, D.; Cassman, K.G.; Matson, P.A.; Naylor, R.; Polasky, S. Agricultural sustainability and intensive production practices. Nature 2002, 418, 671–677. [Google Scholar] [CrossRef] [PubMed] [Green Version]
  7. Dai, H.; Chen, Y.; Yang, X.; Cui, J.; Sui, P. The effect of different organic materials amendment on soil bacteria communities in barren sandy loam soil. Environ. Sci. Pollut. Res. 2017, 24, 24019–24028. [Google Scholar] [CrossRef] [PubMed]
  8. Sarfraz, R.; Shakoor, A.; Abdullah, M.; Arooj, A.; Hussain, A.; Xing, S. Impact of integrated application of biochar and nitrogen fertilizers on maize growth and nitrogen recovery in alkaline calcareous soil. Soil Sci. Plant Nutr. 2017, 63, 488–498. [Google Scholar] [CrossRef]
  9. Das, S.; Jeong, S.T.; Das, S.; Kim, P.J. Composted cattle manure increases microbial activity and soil fertility more than composted swine manure in a submerged rice paddy. Front. Microbiol. 2017, 8, 1–10. [Google Scholar] [CrossRef] [PubMed]
  10. Cesarano, G.; De Filippis, F.; La Storia, A.; Scala, F.; Bonanomi, G. Organic amendment type and application frequency affect crop yields, soil fertility and microbiome composition. Appl. Soil Ecol. 2017, 120, 254–264. [Google Scholar] [CrossRef]
  11. Li, X.; Fan, P.; Zang, M.; Xing, J. Rapid Determination of Oligopeptides and Amino Acids in Soybean Protein Hydrolysates using High-Resolution Mass Spectrometry. Phytochem. Anal. 2015, 26, 15–22. [Google Scholar] [CrossRef] [PubMed]
  12. Suthar, S.; Gairola, S. Nutrient recovery from urban forest leaf litter waste solids using Eisenia fetida. Ecol. Eng. 2014, 71, 660–666. [Google Scholar] [CrossRef]
  13. Wang, Q.; Wang, S.; He, T.; Liu, L.; Wu, J. Response of organic carbon mineralization and microbial community to leaf litter and nutrient additions in subtropical forest soils. Soil Biol. Biochem. 2014, 71, 13–20. [Google Scholar] [CrossRef]
  14. Fanin, N.; Bertrand, I. Aboveground litter quality is a better predictor than belowground microbial communities when estimating carbon mineralization along a land-use gradient. Soil Biol. Biochem. 2016, 94, 48–60. [Google Scholar] [CrossRef]
  15. Hristovski, S.; Berg, B.; Melovski, L. Limitless decomposition in leaf litter of Common beech: Patterns, nutrients’ and heavy metal’s dynamics. Pedobiologia 2014, 57, 131–138. [Google Scholar] [CrossRef]
  16. Sun, H.; Wang, Q.X.; Liu, N.; Li, L.; Zhang, C.G.; Liu, Z.B.; Zhang, Y.Y. Effects of different leaf litters on the physicochemical properties and bacterial communities in Panax ginseng-growing soil. Appl. Soil Ecol. 2017, 111, 17–24. [Google Scholar] [CrossRef]
  17. Prosser, J.I.; Bohannan, B.J.M.; Curtis, T.P.; Ellis, R.J.; Firestone, M.K.; Freckleton, R.P.; Green, J.L.; Green, L.E.; Killham, K.; Lennon, J.J. The role of ecological theory in microbial ecology. Nat. Rev. Microbiol. 2007, 5, 384–392. [Google Scholar] [CrossRef] [PubMed]
  18. He, J.-Z.; Zheng, Y.; Chen, C.-R.; He, Y.-Q.; Zhang, L.-M. Microbial composition and diversity of an upland red soil under long-term fertilization treatments as revealed by culture-dependent and culture-independent approaches. J. Soils Sediments 2008, 8, 349–358. [Google Scholar] [CrossRef] [Green Version]
  19. Shen, J.-P.; Zhang, L.-M.; Guo, J.-F.; Ray, J.L.; He, J.-Z. Impact of long-term fertilization practices on the abundance and composition of soil bacterial communities in Northeast China. Appl. Soil Ecol. 2010, 46, 119–124. [Google Scholar] [CrossRef] [Green Version]
  20. Giacometti, C.; Demyan, M.S.; Cavani, L.; Marzadori, C.; Ciavatta, C.; Kandeler, E. Chemical and microbiological soil quality indicators and their potential to differentiate fertilization regimes in temperate agroecosystems. Appl. Soil Ecol. 2013, 64, 32–48. [Google Scholar] [CrossRef]
  21. Peruzzi, E.; Franke-Whittle, I.H.; Kelderer, M.; Ciavatta, C.; Insam, H. Microbial indication of soil health in apple orchards affected by replant disease. Appl. Soil Ecol. 2017, 119, 115–127. [Google Scholar] [CrossRef]
  22. Shendure, J.; Ji, H. Next-generation DNA sequencing. Nat. Biotechnol. 2008, 26, 1135–1145. [Google Scholar] [CrossRef] [PubMed]
  23. Chen, Y.; Xin, L.; Liu, J.; Yuan, M.; Liu, S.; Jiang, W.; Chen, J.; Chen, Y.; Xin, L.; Liu, J.; et al. Changes in bacterial community of soil induced by long-term straw returning. Sci. Agric. 2017, 74, 349–356. [Google Scholar] [CrossRef] [Green Version]
  24. Scotti, R.; Bonanomi, G.; Scelza, R.; Zoina, A.; Rao, M.A. Organic amendments as sustainable tool to recovery fertility in intensive agricultural systems. J. Soil Sci. Plant Nutr. 2015, 15, 333–352. [Google Scholar] [CrossRef]
  25. Wang, J.; Song, Y.; Ma, T.; Raza, W.; Li, J.; Howland, J.G.; Huang, Q.; Shen, Q. Impacts of inorganic and organic fertilization treatments on bacterial and fungal communities in a paddy soil. Appl. Soil Ecol. 2017, 112, 42–50. [Google Scholar] [CrossRef]
  26. Sun, J.; Zhang, Q.; Zhou, J.; Wei, Q. Pyrosequencing technology reveals the impact of different manure doses on the bacterial community in apple rhizosphere soil. Appl. Soil Ecol. 2014, 78, 28–36. [Google Scholar] [CrossRef]
  27. Pansu, M.; Gautheyrou, J. Handbook of Soil Analysis: Mineralogical, Organic and Inorganic Methods; Springer Science & Business Media: Berlin, Germany, 2007; ISBN 3540312110. [Google Scholar]
  28. Li, Z.G.; Luo, Y.M.; Teng, Y. Research Methods of Soil and Environmental Microbiology; Science Press: Beijing, China, 2008. [Google Scholar]
  29. Eivazi, F.; Tabatabai, M.A. Glucosidases and galactosidases in soils. Soil Biol. Biochem. 1988, 20, 601–606. [Google Scholar] [CrossRef]
  30. Caporaso, J.G.; Kuczynski, J.; Stombaugh, J.; Bittinger, K.; Bushman, F.D.; Costello, E.K.; Fierer, N.; Pẽa, A.G.; Goodrich, J.K.; Gordon, J.I.; et al. QIIME allows analysis of high-throughput community sequencing data. Nat. Methods 2010, 7, 335–336. [Google Scholar] [CrossRef] [PubMed] [Green Version]
  31. Magoč, T.; Salzberg, S.L. FLASH: Fast length adjustment of short reads to improve genome assemblies. Bioinformatics 2011, 27, 2957–2963. [Google Scholar] [CrossRef] [PubMed]
  32. Saqib, H.S.A.; You, M.; Gurr, G.M. Multivariate ordination identifies vegetation types associated with spider conservation in brassica crops. PeerJ 2017, 5, e3795. [Google Scholar] [CrossRef] [PubMed]
  33. Zhong, W.; Gu, T.; Wang, W.; Zhang, B.; Lin, X.; Huang, Q.; Shen, W. The effects of mineral fertilizer and organic manure on soil microbial community and diversity. Plant Soil 2010, 326, 511–522. [Google Scholar] [CrossRef]
  34. Deng, S.P.; Parham, J.A.; Hattey, J.A.; Babu, D. Animal manure and anhydrous ammonia amendment alter microbial carbon use efficiency, microbial biomass, and activities of dehydrogenase and amidohydrolases in semiarid agroecosystems. Appl. Soil Ecol. 2006, 33, 258–268. [Google Scholar] [CrossRef]
  35. Han, S.H.; An, J.Y.; Hwang, J.; Kim, S.B.; Park, B.B. The effects of organic manure and chemical fertilizer on the growth and nutrient concentrations of yellow poplar (Liriodendron tulipifera Lin.) in a nursery system. Forest Sci. Technol. 2016, 12, 137–143. [Google Scholar] [CrossRef]
  36. Fierer, N.; Bradford, M.A.; Jackson, R.B. Toward an ecological classification of soil bacteria. Ecology 2007, 88, 1354–1364. [Google Scholar] [CrossRef] [PubMed]
  37. Nannipieri, P.; Giagnoni, L.; Renella, G.; Puglisi, E.; Ceccanti, B.; Masciandaro, G.; Fornasier, F.; Moscatelli, M.C.; Marinari, S. Soil enzymology: Classical and molecular approaches. Biol. Fertil. Soils 2012, 48, 743–762. [Google Scholar] [CrossRef]
  38. Burns, R.G.; DeForest, J.L.; Marxsen, J.; Sinsabaugh, R.L.; Stromberger, M.E.; Wallenstein, M.D.; Weintraub, M.N.; Zoppini, A. Soil enzymes in a changing environment: Current knowledge and future directions. Soil Biol. Biochem. 2013, 58, 216–234. [Google Scholar] [CrossRef]
  39. Mikanová, O.; Šimon, T.; Kopecký, J.; Ságová-Marečková, M. Soil biological characteristics and microbial community structure in a field experiment. Open Life Sci. 2015, 10, 249–259. [Google Scholar] [CrossRef]
  40. Francioli, D.; Schulz, E.; Lentendu, G.; Wubet, T.; Buscot, F.; Reitz, T. Mineral vs. organic amendments: Microbial community structure, activity and abundance of agriculturally relevant microbes are driven by long-term fertilization strategies. Front. Microbiol. 2016, 7, 1446. [Google Scholar] [CrossRef] [PubMed]
  41. Hartmann, M.; Frey, B.; Mayer, J.; Ma, P. Distinct soil microbial diversity under long-term organic and conventional farming. ISME J. 2015, 9, 1177–1194. [Google Scholar] [CrossRef] [PubMed]
  42. Newton, R.J.; Mcmahon, K.D. Seasonal differences in bacterial community composition following nutrient additions in a eutrophic lake. Environ. Microbiol. 2011, 13, 887–899. [Google Scholar] [CrossRef] [PubMed]
  43. Shanks, O.C.; Kelty, C.A.; Archibeque, S.; Jenkins, M.; Newton, R.J.; McLellan, S.L.; Huse, S.M.; Sogin, M.L. Community structures of fecal bacteria in cattle from different animal feeding operations. Appl. Environ. Microbiol. 2011, 77, 2992–3001. [Google Scholar] [CrossRef] [PubMed]
  44. Acosta-Martínez, V.; Dowd, S.; Sun, Y.; Allen, V. Tag-encoded pyrosequencing analysis of bacterial diversity in a single soil type as affected by management and land use. Soil Biol. Biochem. 2008, 40, 2762–2770. [Google Scholar] [CrossRef]
  45. Sauvadet, M.; Chauvat, M.; Cluzeau, D.; Maron, P.A.; Villenave, C.; Bertrand, I. The dynamics of soil micro-food web structure and functions vary according to litter quality. Soil Biol. Biochem. 2016, 95, 262–274. [Google Scholar] [CrossRef]
  46. Herzog, S.; Wemheuer, F.; Wemheuer, B.; Daniel, R. Effects of fertilization and sampling time on composition and diversity of entire and active bacterial communities in German grassland soils. PLoS ONE 2015, 10, e0145575. [Google Scholar] [CrossRef] [PubMed]
  47. Sun, R.; Zhang, X.X.; Guo, X.; Wang, D.; Chu, H. Bacterial diversity in soils subjected to long-term chemical fertilization can be more stably maintained with the addition of livestock manure than wheat straw. Soil Biol. Biochem. 2015, 88, 9–18. [Google Scholar] [CrossRef]
  48. Bonanomi, G.; De Filippis, F.; Cesarano, G.; La Storia, A.; Ercolini, D.; Scala, F. Organic farming induces changes in soil microbiota that affect agro-ecosystem functions. Soil Biol. Biochem. 2016, 103, 327–336. [Google Scholar] [CrossRef]
  49. Sykes, G.; Skinner, F.A. Actinomycetales: Characteristics and Practical Importance; Academic Press: Cambridge, MA, USA, 1973; ISBN 0126799504. [Google Scholar]
  50. Pershina, E.; Valkonen, J.; Kurki, P.; Ivanova, E.; Chirak, E.; Korvigo, I.; Provorov, N.; Andronov, E. Comparative analysis of prokaryotic communities associated with organic and conventional farming systems. PLoS ONE 2015, 10, e0145072. [Google Scholar] [CrossRef] [PubMed]
  51. Charbonneau, D.M.; Meddeb-Mouelhi, F.; Boissinot, M.; Sirois, M.; Beauregard, M. Identification of Thermophilic Bacterial Strains Producing Thermotolerant Hydrolytic Enzymes from Manure Compost. Indian J. Microbiol. 2012, 52, 41–47. [Google Scholar] [CrossRef] [PubMed]
  52. Watanabe, K.; Nagao, N.; Yamamoto, S.; Toda, T.; Kurosawa, N. Thermobacillus composti sp. nov., a moderately thermophilic bacterium isolated from a composting reactor. Int. J. Syst. Evol. Microbiol. 2007, 57, 1473–1477. [Google Scholar] [CrossRef] [PubMed]
  53. Wu, Y.R.; He, J. Characterization of anaerobic consortia coupled lignin depolymerization with biomethane generation. Bioresour. Technol. 2013, 139, 5–12. [Google Scholar] [CrossRef] [PubMed]
  54. Matsuyama, T.; Nakajima, Y.; Matsuya, K.; Ikenaga, M.; Asakawa, S.; Kimura, M. Bacterial community in plant residues in a Japanese paddy field estimated by RFLP and DGGE analyses. Soil Biol. Biochem. 2007, 39, 463–472. [Google Scholar] [CrossRef]
  55. Tayyab, M.; Noman, A.; Islam, W.; Waheed, S.; Arafat, Y.; Ali, F.; Zaynab, M.; Lin, S.; Zhang, H.; Lin, W. Bioethanol production from lignocellulosic biomass by environment-friendly pretreatment methods: A review. Appl. Ecol. Environ. Res. 2018, 16, 225–249. [Google Scholar] [CrossRef]
  56. Zhang, H.B.; Yang, M.X.; Tu, R. Unexpectedly high bacterial diversity in decaying wood of a conifer as revealed by a molecular method. Int. Biodeterior. Biodegrad. 2008, 62, 471–474. [Google Scholar] [CrossRef]
  57. Mori, K.; Kamagata, Y. The challenges of studying the anaerobic microbial world. Microbes Environ. 2014, 29, 335–337. [Google Scholar] [CrossRef] [PubMed]
  58. Zhang, X.; Zhang, R.; Gao, J.; Wang, X.; Fan, F.; Ma, X.; Yin, H.; Zhang, C.; Feng, K.; Deng, Y. Thirty-one years of rice-rice-green manure rotations shape the rhizosphere microbial community and enrich beneficial bacteria. Soil Biol. Biochem. 2017, 104, 208–217. [Google Scholar] [CrossRef]
  59. Arafat, Y.; Wei, X.; Jiang, Y.; Chen, T.; Saqib, H.S.A.; Lin, S.; Lin, W. Spatial distribution patterns of root-associated bacterial communities mediated by root exudates in different aged ratooning tea monoculture systems. Int. J. Mol. Sci. 2017, 18, 1–16. [Google Scholar] [CrossRef] [PubMed]
Figure 1. Rarefaction curve established on 97% similarity. CK1.1, CK1.2, and CK1.3 refer to control soil; M1.1, M1.2, and M1.3 represent the goat manure-amended soil; MS1.1, MS1.2, and MS1.3 represent the sugarcane straw and goat manure-amended soil; and S1.1, S1.2, and S1.3 represent the sugarcane straw amended soil in the first phase, respectively. Similarly, CK2.1, CK2.2, and CK2.3 refer to control soil; M2.1, M2.2, and M2.3 represent the goat manure-amended soil; MS2.1, MS2.2, and MS2.3 represent the sugarcane straw and goat manure-amended soil; and S2.1, S2.2, and S2.3 represent the sugarcane straw-amended soil in the first phase, respectively.
Sustainability 10 02361 g001
Figure 2. (a) Dispersal of the 35 highly dominant genera in a heat map. (b) Dispersal of top 10 highly dominant phyla in control soil (CK1), goat manure-amended soil (M1), goat manure and sugarcane-amended soil (MS1), and sugarcane-amended soil (S1) in the first phase. Similarly, dispersal of highly dominant genera and phyla in control soil (CK2), goat manure-amended soil (M2), goat manure and sugarcane-amended soil (MS2), and sugarcane-amended soil (S2) in the second phase.
Sustainability 10 02361 g002
Figure 3. α-Diversity indices containing calculations of (a) ACE; (b) Chao1; (c) Shannon; and (d) Simpson in control soil (CK1), goat manure-amended soil (M1), goat manure and sugarcane straw-amended soil (MS1), sugarcane straw-amended soil (S1) in the first phase. Similarly, in control soil (CK2), goat manure-amended soil (M2), goat manure and sugarcan-amended soil (MS2), sugarcane-amended soil (S2) in the second phase.
Sustainability 10 02361 g003aSustainability 10 02361 g003b
Figure 4. Biplot ordination of (a) principal coordinate analysis (PCoA) of weighted Unifrac and (b) unweighted UniFrac distances among various samples; (c) Based on weighted UniFrac distances UPGMA clustering analysis shows the relative abundance of the utmost abundant bacterial phylum in various amendments at different times; (d) Heat map of β-diversity based on unweighted (UUF) UniFrac and weighted (WUF) distances. Lower and upper corner values indicate the UUF and WUF distances.
Sustainability 10 02361 g004aSustainability 10 02361 g004b
Figure 5. Distance-based redundancy analysis (dbRDA) relating phylum (a) and genera (b) to selected soil characteristics which are shown by the arrows. The lengths of these arrows shows the relative significance of measured variables, while the angle between the arrows and the axis reflects the degree to which they are correlated.
Sustainability 10 02361 g005
Table 1. Physiochemical characteristics of the soil.
TreatmentspHAPTPAKTNANNH4+NO3TCC/N
g/kgg/kgmg/kgg/kgmg/kgmg/kgmg/kgg/kg
CK15.64 ± 0.01 f0.09 ± 0.00 e0.70 ± 0.07 bc71.85 ± 3.140 e1.12 ± 0.07 f113.05 ± 1.01 cd2.79 ± 0.13 d21.85 ± 1.10 b9.96 ± 0.10 g8.95 ± 0.660 e
M15.72 ± 0.03 e0.20 ± 0.00 c0.88 ± 0.08 b865.92 ± 3.02 c2.50 ± 0.02 c307.30 ± 2.02 a9.49 ± 0.52 a29.46 ± 0.37 a32.71 ± 0.36 c13.09 ± 0.22 a
MS17.51 ± 0.01 b0.25 ± 0.01 b1.27 ± 0.04 a1008.41 ± 6.18 b2.29 ± 0.02 d207.55 ± 9.09 b9.79 ± 0.26 a20.16 ± 0.12 bc27.32 ± 0.07 d11.91 ± 0.06 b
S16.10 ± 0.02 d0.10 ± 0.00 d0.71 ± 0.00 bc151.46 ± 18.09 d1.11 ± 0.01 f113.05 ± 5.05 cd5.90 ± 0.09 c19.53 ± 0.49 bc12.69 ± 0.03 f11.47 ± 0.09 bc
CK25.73 ± 0.02 e0.09 ± 0.00 de0.61 ± 0.01 c65.73 ± 6.28 e0.93 ± 0.01 g79.80 ± 4.040 d2.10 ± 0.05 d18.89 ± 0.36 bc10.16 ± 0.06 g10.89 ± 0.08 cd
M26.80 ± 0.02 c0.39 ± 0.00 a1.34 ± 0.07 a1138.21 ± 3.09 a4.59 ± 0.02 a327.25 ± 5.46 a6.90 ± 0.33 bc32.41 ± 0.12 a47.50 ± 1.00 a10.35 ± 0.19 d
MS27.61 ± 0.02 a0.25 ± 0.00 b1.42 ± 0.11 a980.61 ± 3.03 b3.17 ± 0.11 b222.95 ± 15.16 b7.71 ± 0.12 b21.00 ± 0.85 bc36.70 ± 1.26 b11.59 ± 0.02 bc
S26.15 ± 0.02 d0.09 ± 0.00 de0.75 ± 0.04 bc129.03 ± 6.13 d1.31 ± 0.01 e136.50 ± 5.66 c6.18 ± 1.00 c18.05 ± 0.12 c16.67 ± 0.09 e12.72 ± 0.10 a
For every treatment with three replicates, one-way variance analysis (ANOVA) by LSD test (p = 0.05) was performed using DPS 7.5 Statistics. Various letters displaying the significant shift among various treatments. CK1 refers to the control soil without amendment, M1 represents goat manure-amended soil, while MS1 represents goat manure + sugarcane straw-amended soil and S1 sugarcane straw-amended soil of the first phase (after 50 days). Similarly, CK2 refers to the control soil without amendment, M2 represents goat manure-amended soil, while MS2 represents goat manure + sugarcane straw-amended soil, and S2 represents sugarcane straw-amended soil of the second phase (after 100 days).
Table 2. Soil enzymatic activities.
TreatmentUrease
(NH3-N, μg g−1, 24 h, 37 °C)
Neutral Phosphatase
(Phenol, nmol g−1, 24 h, 37 °C)
β-Glucosidase
(p-Nitrophenol, μmol g−1, 24 h, 37 °C)
Cellulase
(Glucose, mg g−1, 24 h, 37 °C)
CK114.09 ± 1.09 c2.71 ± 0.13 b18.34 ± 0.35 bc11.65 ± 1.24 bc
M131.79 ± 0.08 a1.58 ± 0.03 d28.12 ± 1.95 a11.72 ± 0.68 bc
MS125.57 ± 0.08 b1.09 ± 0.06 e23.54 ± 2.22 abc11.48 ± 0.04 bc
S112.71 ± 0.50 c2.50 ± 0.04 bc20.42 ± 0.49 bc10.52 ± 0.20 c
CK214.60 ± 0.21 c2.30 ± 0.12 c17.92 ± 2.57 c10.58 ± 0.24 c
M226.20 ± 0.04 b1.91 ± 0.01 d18.06 ± 1.60 c16.08 ± 2.02 a
MS225.61 ± 1.85 b1.65 ± 0.02 d24.92 ± 1.11 ab16.08 ± 0.22 a
S213.51 ± 1.35 c3.56 ± 0.24 a20.42 ± 3.68 bc14.15 ± 0.29 ab
For every treatment with three replicates, one-way variance analysis (ANOVA) by LSD test (p = 0.05) was performed using DPS 7.5 Statistics. Various letters displaying the significant shift among various treatments. CK1 refers to the control soil without amendment, M1 represents goat manure-amended soil, while MS1 represents goat manure + sugarcane straw-amended soil and S1 sugarcane straw-amended soil of the first phase (after 50 days). Similarly, CK2 refers to the control soil without amendment, M2 represents goat manure-amended soil, while MS2 represents goat manure + sugarcane straw-amended soil, and S2 represents sugarcane straw-amended soil of the second phase (after 100 days).
Table 3. Correlation coefficient (r) among the soil bacterial community and variables revealed by the Mantel test (p-value = 0.01).
Environmental Variabler-Value
pH + TC0.5407
pH + C:N0.2881
pH + NH4+0.5266
pH + TN0.5005
pH + NO30.414
AP + TP + AK0.5898
NO3 + NH4+0.5971
TN + TC0.6033
NO3 + NH4+ + TN + AN0.6564

