1. Introduction
Projects in low-income countries have been negatively influenced by communication gaps and ill-defined/managed processes. According to the World Bank [
1], the income level of West Bank and Gaza is classified as lower middle level. In the country, public construction projects are funded by donor organizations due to the country’s difficult economic situation. In fact, the construction industry in Palestine is one of the key industries and is the main force motivating the Palestinian National Economy (PNE), which has witnessed noticeable expansion since 1994 [
2]. The industry can be viewed as an advancement enabler for achieving nationwide goals in modern society. In the country, the problems in construction projects are not only caused by the lack of technical skills and financial resources but also as a result of inadequate coordination, integration, communication and control of project activities. Lack of communication and coordination in projects in Palestine causes many problems that lead to the delay in the construction projects [
3] and most of these projects are over budget and away from the required quality [
4,
5,
6]. It is mentioned that 90% of all problems on site are due to late or inadequate information [
7]. Delayed information can cause thousands of dollars of losses in design and construction phases. Efficient communication and coordination will contribute very much to the timeliness and accuracy of information. To foster successful projects, this study addressed the difficulties related to the lack of communication and coordination among all parties and focused on supporting coordinated and integrated project delivery with the help of a process map. The aim of this research was determined as depicting a process map for donor-funded projects with the goal of overcoming the communication and coordination problems by increasing the awareness on different types of processes. “Palestine” was selected as the focus country for the research as most public projects are funded by donors due to the country’s economic situation. The research aims were: identification of coordination problems in donor-funded projects through literature review and analyzing real life case studies; creating a process protocol model (i.e., map) for facilitating communication among parties; and validating the model through conducting semi-structured interviews with professional experts in construction. As donor-funded construction is specific to few regions of the world, finding data about and conducting the analysis of the processes of this type of projects are difficult tasks. Although there have been various studies for developing the process maps for construction in the past, the novelty of this research is in the development of the process maps for donor-funded construction projects.
The paper first provides a background on industry structure, and then discusses the methodology adopted to fulfil the research aims. Following this, the literature review findings regarding the coordination problems in the industry are presented. The paper then elaborates on the concept of process based construction management. The following section of the paper presents coordination related problems for the donor-funded projects. The next sections elaborate on: (i) the Building Construction Process Map, which is defined with the aim of eliminating coordination problems by standardizing the processes; and (ii) the validation study.
2. Background
The global construction industry has unique characteristics compared with other industries. The projects in the construction industry have a significantly high rate of business failure, collapse and bankruptcy [
8]. These are common terms in the industry due to the many risks inherited in how this industry operates. The projects in the industry has been significantly affected by economic, environmental and political cycles due to many uncertainties resulting from many players of multiple disciplines who are brought together at various stages throughout a single project [
9]. Palestine construction industry is not an exception; the industry is complex and influenced by factors that may cause weakness including changing economy, closures, mismanagement of projects and the lack of skills and technology [
10]. The broad spectrum of construction projects can be classified into four major categories: residential housing, institutional and commercial buildings, specialized industrial that usually involves very large scale projects, and infrastructure and heavy construction [
11].
The actors in the industry include contractors, project managers, supply managers, site managers, subcontractors, design engineers, structural engineers, mechanical engineers, subcontractors, owners and donors. Different types of enterprises take part in the construction industry, according to Palestinian Contractor Union are as follows [
12]:
- -
Donor enterprises (International Financing) that offer grants to the construction industry in Palestine include world bank (WB), Islamic development bank (IDB), united nations relief and work agency (UNRWA), U.S. agency for international development (USAID), united nations development program (UNDP), European union (EU), German and Japanese institutions, Welfare Association and World Vision [
4,
12].
- -
Public enterprise covers governmental institutions that own or manage public projects, i.e., they may be the owner of a construction project or they may be in role of control and supervision in accordance with their legal entitlement [
13,
14].
- -
Private enterprise involves the construction contracting business which includes any work pertaining to the construction, such as engineering services, private project owners, manufacturers of construction materials, and the service industry which consists of transportation companies, importing firms, insurance corporations and so on [
4].
The contractors in Palestine must be registered and classified at the Palestinian Contractor’s Union (PCU). In the country, the contractors are classified according to their specialties, in five categories as, road construction contractors, building contractors, water and sewage contractors, electro-mechanics contractors, public works and maintenance contractors. Regardless of the type, the goal of any project is to fulfil the requirements in appropriate time, with the desired quality and an optimal budget, while providing the contractor an opportunity to make a fair profit.
The different types of construction contracts found to be actively used in the country are: unit price contracts, special contract method, construction by daily labor contracts, turnkey contracts, lump sum, and build–operate–transfer contracts (BOT). The selection of the contract type in Palestine depends on several factors such as government agency type, project type, and sponsor identity. Sometimes the local agencies are even enforced to use the contract template of the sponsor organization’s country. Most agencies presume special conditions to overcome some of the general condition provisions that are not suitable for the agency [
10].
In summary, in Palestine, construction projects can be classified into four major categories: residential housing, institutional and commercial building, specialized industrial and infrastructure/heavy construction. There are several actors in the industry ranging from designers/engineers to contractors. Three different types of enterprises exist in the country: public, private and donor enterprise. There are different types of construction contractors (ranging from building to maintenance contractors) and contracts in the country (ranging from unit price to lump sum), and selection of the contract type is dependent on multiple factors.
3. Research Methodology
Literature in the field (e.g., [
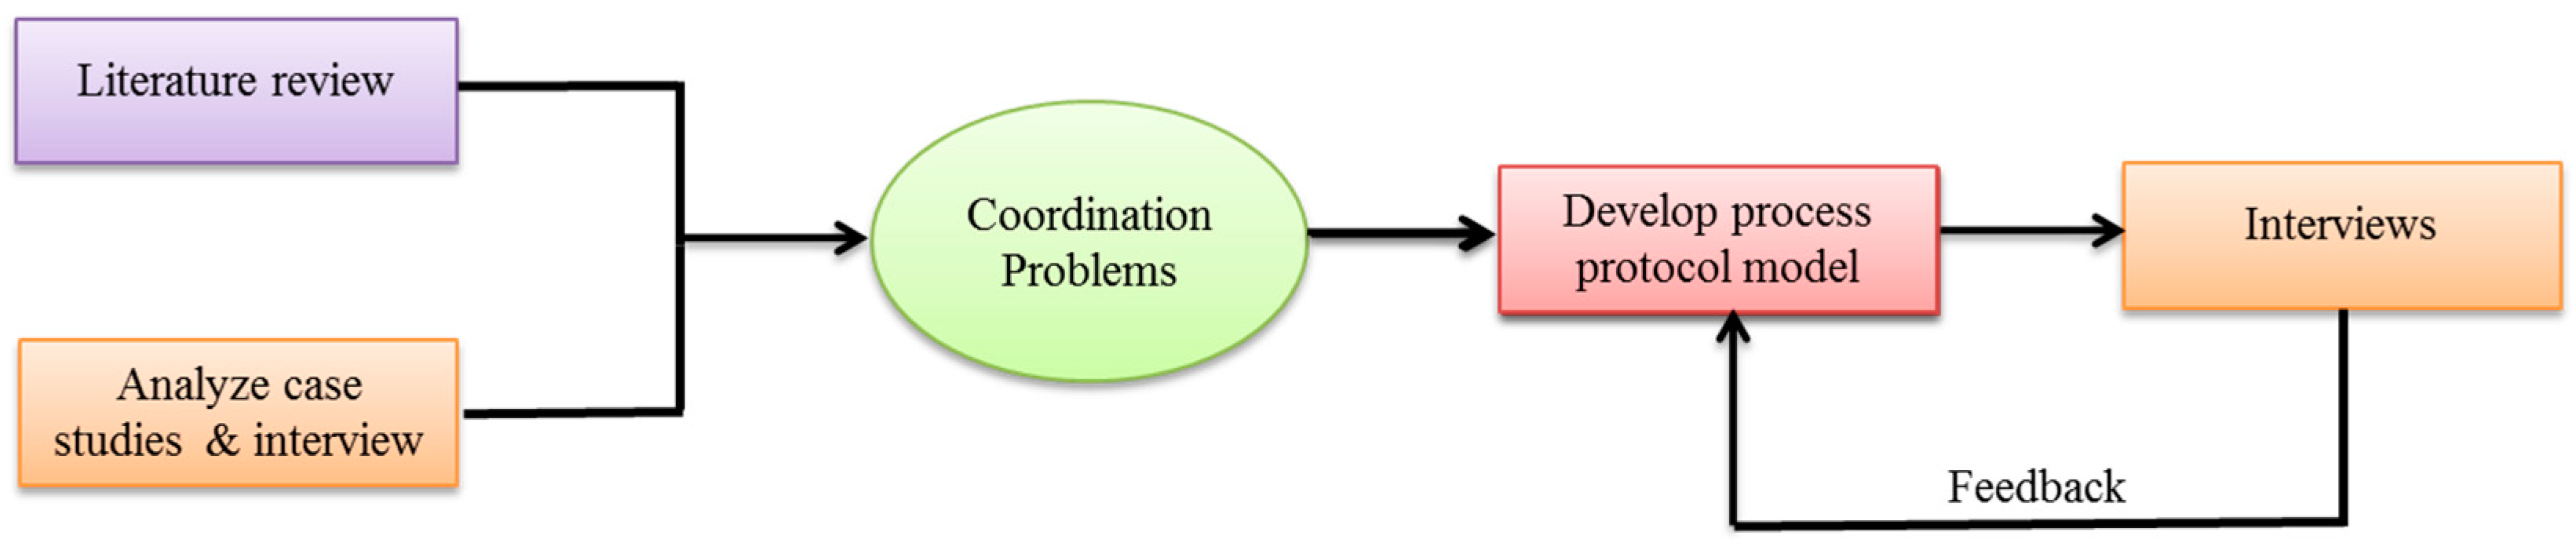
15]) indicates that development of the process maps requires a triangulation of several research approaches ranging from literature review, case studies and interviews to action research. Literature review and case analysis techniques are used to understand the current state of the art and problems related to coordination. The process model is developed taking these problems into account; in fact, the main function of the model was to provide a clear illustration of the processes. Finally, expert interviews were conducted to validate the developed process maps. The interviews in this stage were necessary to ensure the quality of the information that would be used to validate the developed maps. The methodology adopted to achieve the objective of this research consists of three main stages, as shown in
Figure 1. The focus geographic region of the study is selected as Middle East and specifically Palestine as donor funding for public construction projects is very common. The literature review was focused on identifying the problems in the industry, and uncovering the details of the process protocol approach/methodology applied earlier. Furthermore, five real-life cases were analyzed by semi-structured interviews to understand the real-life processes and problems related to the coordination in donor-funded projects, and to develop proposed process protocol for overcoming these coordination problems. The questions used in the semi-structured expert interviews and the unstructured interviews done with real-life project participants were prepared based on the literature review conducted related to coordination problems in construction. As the information gathered would be qualitative in these techniques, the validity and reliability were ensured through an internal pilot. In addition, self-checking procedures are completed by all researchers to ensure the questions are easy to understand and non-biased. The review of legal documentation for these five projects was also conducted prior to the development of the process map. In the next stage of the research, a set of process maps were developed. The strategy used for validation of the process maps is explained in detail in
Section 6. The strategy of the map validation included an interview with ten experts including engineers, contractors, and project managers, performed in a period of three months to validate the process maps and also to determine the role of a process model in improving the coordination in construction projects.
4. Coordination Problems in Construction
4.1. Coordination Problems Identified in Literature Review
Coordination can be defined as the act of managing dependencies between activities or as the integration and harmonious adjustment of individual work effort towards the accomplishment of the larger goal [
7]. Coordination is an important function in the construction process, and it is one of the most sensitive functions of management [
16]. The construction process involves the organization, administration, and coordination of all resources, such as labor, materials, equipment and monetary. These must be integrated in the most efficient manner to complete construction projects on schedule, within the budget and according to the standards of quality specified by the project owner and designer. The greatest problems that directly affect coordination include the lack of experience in the line of work, lack of experience in contracts, lack of using project management techniques, lack of a communication system, lack of using computer applications, absence of construction regulations, un-coordinated design, rushed design, legal disputes during the construction phase, new governmental acts or legislations, gaps between the implementation and the specifications due to misinterpretation of drawings and poor communication between involved parties [
9]. The lack of planning results in insufficient information to complete tasks and to eliminate inconsistencies within the construction documents. Poor communication, lack of adequate documentation, deficient or missing information, unbalanced resource allocation, lack of coordination between disciplines, and erratic decision making have been pointed out as the main problems in construction management [
17]. The problems in developing economies (such as Palestine) can be categorized into three areas [
18]:
- -
Shortages or inadequacies in supply chain, lack of training and inadequate communications.
- -
Problems caused by clients and consultants regarding changes in design, due to designs completed with inaccurate information.
- -
Problems caused by contractor’s incompetence/inadequacies.
The first two categories will greatly be facilitated through better coordination. As the process models are known as facilitators of coordination, process maps will be beneficial for the construction industry.
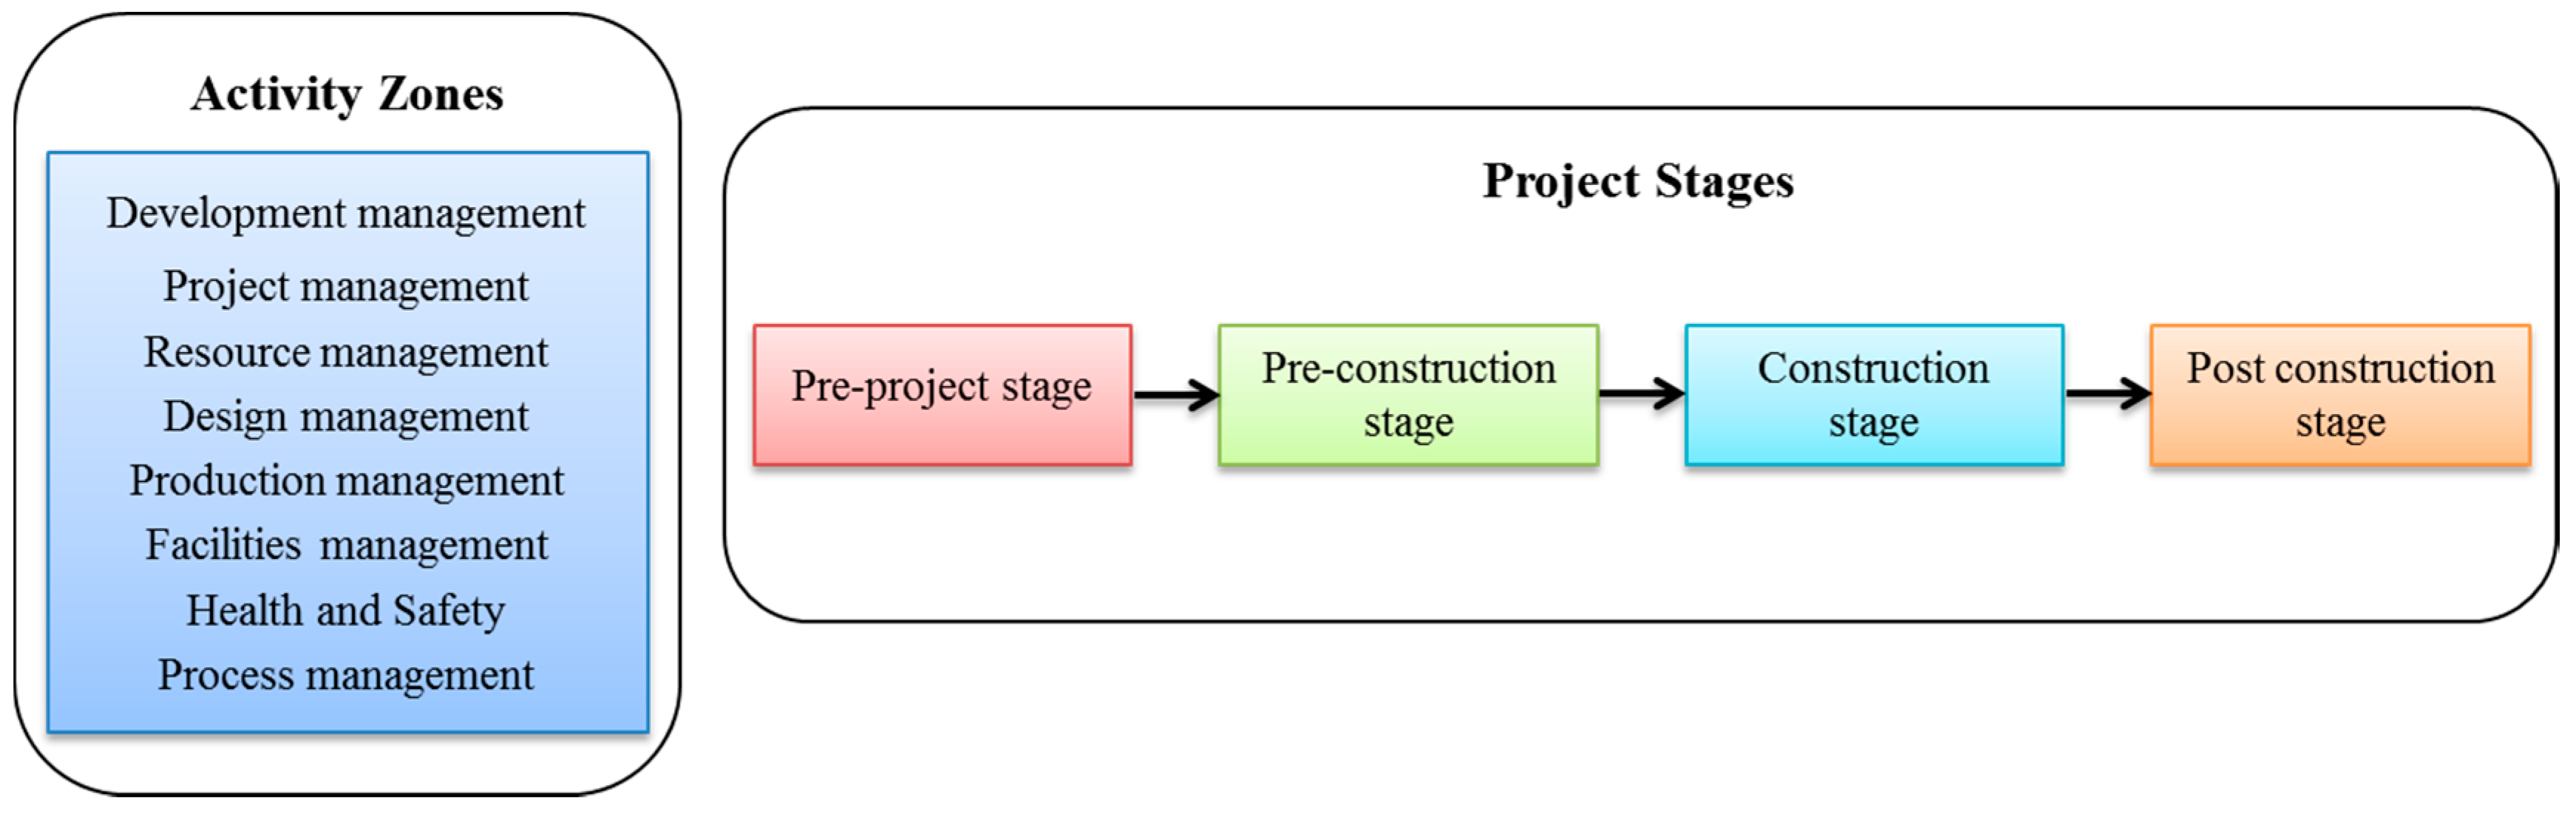
A process protocol is a tool and methodology for formalizing the process in the construction industry. The formalization of the processes serves for better understanding of the flow of events and interactions between the parties, finally resulting in better coordination during the design and construction stages. The approach has its roots in systems engineering and total quality management, where each molecular level component of a business is identified in detail. This identification includes the identification of the activities, actors that take part in this process, the input and outputs of the process, and identification of the relations between different processes, between super and sub processes. U.K. and U.S. institutions are the leading research bodies in this field. The U.K. construction industry process protocol is a well-known protocol and is based on a recognized process model. In the model, construction processes are grouped into four main stages: pre-project, pre-construction, construction and post-construction. In addition, the participants within the Process Protocol [
15] are organized into activity zones (
Figure 2).
The literature in the field mainly indicates that coordination is a key element in the management of construction projects. The success of the project is directly proportional with well-established coordination between all the stakeholders. On the other hand, the literature indicates that formalization of processes and tasks would lead to better coordination. In this respect, mechanisms that help in the process formalizations, such as process maps, would be very beneficial in enabling better coordination and this in turn would contribute to the quality of management of the construction projects. Although there are many critical success factors that have an impact on the quality of management of construction projects, formalization of processes can be considered one of the key ones, as it has a direct impact on the quality through enabling better coordination. In light of this view, this research mainly focused on implementing process modeling for facilitating coordination in the donor-funded projects. The following section draws the research picture regarding the coordination problems in donor-funded projects based on the findings of the interviews and case studies.
4.2. Coordination Problems Identified in Interviews and Real-Life Cases
Identification of coordination related problems in donor-funded projects is accomplished through conducting interviews with experts in the field, and analyzing five real-life cases of donor funded projects. The identified problems in the interviews were either the reasons behind poor coordination and communication (i.e., the cause) or they were the problems that appear as a result of lack of sufficient level of communication or coordination (i.e., the effect). On the other hand, the problems identified from the real-life cases were related to the level of communication or coordination (i.e., the effect).
4.2.1. Problem Identification through Interviews
The objective of the interviews was to highlight the industry problems and obstacles related to lack of coordination from the perspective of different participants in donor-funded projects. Semi-structured interviews were conducted by the researchers with twenty experts including engineers, contractors, and project managers. The interviewees were selected based on their experience in construction projects. In addition, they were working in different institutions and each has key positions in the government, contracting companies or engineering offices. The interview process took place over the period May–June 2015.
Prior to the start of the interview, the researchers introduced themselves and clarified the objectives of the interview. Open-ended questions, most of which were prepared prior to the interview, were used mainly as the interview instrument, and some emerging questions were asked spontaneously during the interview. Once the interview concluded, the researchers analyzed the responses. The problems that were identified through literature review and problems appeared as the result of the interviews were grouped together into six main groups: construction information related problems, problems related to management, legal, financial dimensions, design phase problems, and technical problems. The construction information related problems were regarding the lack of operational information, unclear or contradictory information which is not comprehensive enough, incomplete drawings and documents, misinterpretation of drawings during implementation on site, and problems in scheduling. Management problems were related with planning and controlling. Furthermore, unclear task specifications and unpredictable changes in the project scope and requirements were identified as the key problems. The legal problems identified were weakness in the harmonization of laws, and ambiguities such as legal disputes that emerge during the construction phase, changes that occur in government regulations and laws during the construction of the building. The financial problems were related to poor cost management and quantity surveying practices, and to the lack of cash flow management systems. The design phase problems include conflicts between consultants and design engineers, and lack of coordination among diverse disciplines (architectural, structural, mechanical, and electrical). Finally, the technical problems were regarding the lack of technical support for the project team and lack of human resources with required technical skills. Technical problems mainly appeared as a result of rushed bidding processes and the use of obsolete technology.
4.2.2. Problem Identification through Real-Life Cases
To identify the details of the construction processes and the problems which occur during the project life cycle, the researchers visited the project offices and constructions sites and performed unstructured interviews with project stakeholders (including designers, site engineers, architects, consultants, and owners) in real-life cases. The projects studied are shown in
Table 1.
Following the interviews, researchers noted the findings immediately and identified construction problems. Unclear communication patterns between stakeholders, inefficiencies in decision making, social and cultural controversies, and rushed bidding process were found as the problems common to all projects. The key problem that was observed was the lack of coordination among the designers, consultants, contractors and owners, which resulted in many conflicts during the design and construction stages. Additionally, interviews revealed that there were inconsistent engineering roles in the project, which caused conflicts between multiple decision makers. Furthermore, in some cases, there were financial failures of the government, which caused delays in payments to the contractor. Inefficient use of design tools, lack of efficient resource planning and cash flow management caused the projects to become late and over budget. The requirement of selecting the lowest bidder without the technical assessment of the candidate contractor in the tendering system resulted in poor quality and performance during construction. The management problems facing the stakeholders in Palestine construction industry are summarized in
Table 2.
As illustrated in
Table 2, unclear communication patterns and the absence of coordination among partners are observed in all case studies and were amongst the most common problems between all projects. Moreover, many other problems, such as passing the planned completion time and budget of the project, issuing high number of change orders, poor quality and performance, too much paper work, slow decision making, rework required due to worker errors, late review and approval of design documents, poor utilization of design tools, and financial problems between the government and the design office/contractor, either have as one of their root causes a coordination problem or a coordination problems helps the development and growth of the problem.
Thus, an approach that would be beneficial for overcoming the coordination problems would also help in eliminating the other problems that occur during the design and construction processes. The proposed process map presented in the following section is developed to help in overcoming the coordination problems, by making processes easier to understand and easier to agree on. The proposed model was validated through interviews with industry. The following section elaborates on the processes for donor funded construction projects in Palestine based on information gathered in interviews and case studies. To limit the focus of the research, the project type was restrained to buildings.
5. The Process Map Donor-Funded Construction Projects
The proposed process map presented in this section was developed as a result of findings of the literature review, case studies and interviews. The map concentrates on the four phases of the (donor-funded) project lifecycle: pre-design, pre-construction, construction and post-construction. In Palestine (where donor-funded projects are common), public procurement law, International Federation of Consulting Engineers (FIDIC), and Consultant Working Manual are used as standard legal forms of contracts in construction projects which are signed with a goal of establishing fair balance between the rights and obligations of the owners and contractors. In fact, in the country, a clear definition of processes and construction management—based on standardized processes—has not been realized yet. This is due to insufficient project planning and management skills, and the weak documentation of information in most of the projects. Moreover, as most of projects are funded by donors, they impose their own methodology in managing the projects. According to the laws and government regulations, the construction projects in public sector in Palestine are funded by donors and owned/managed by a government institution. The model (and maps) presented below cover the processes of donor-funded projects. The model: (i) identifies the inputs required for each project stage; (ii) identifies the processes and sub-processes for that stage; (iii) identifies the actors who participate in each process; and (iv) determines the outcomes from each stage. The four phases of the overall construction process are defined as pre-design, pre-construction, construction and post-construction. The sub-sections below explain the details of the processes in these phases and present the process maps for each.
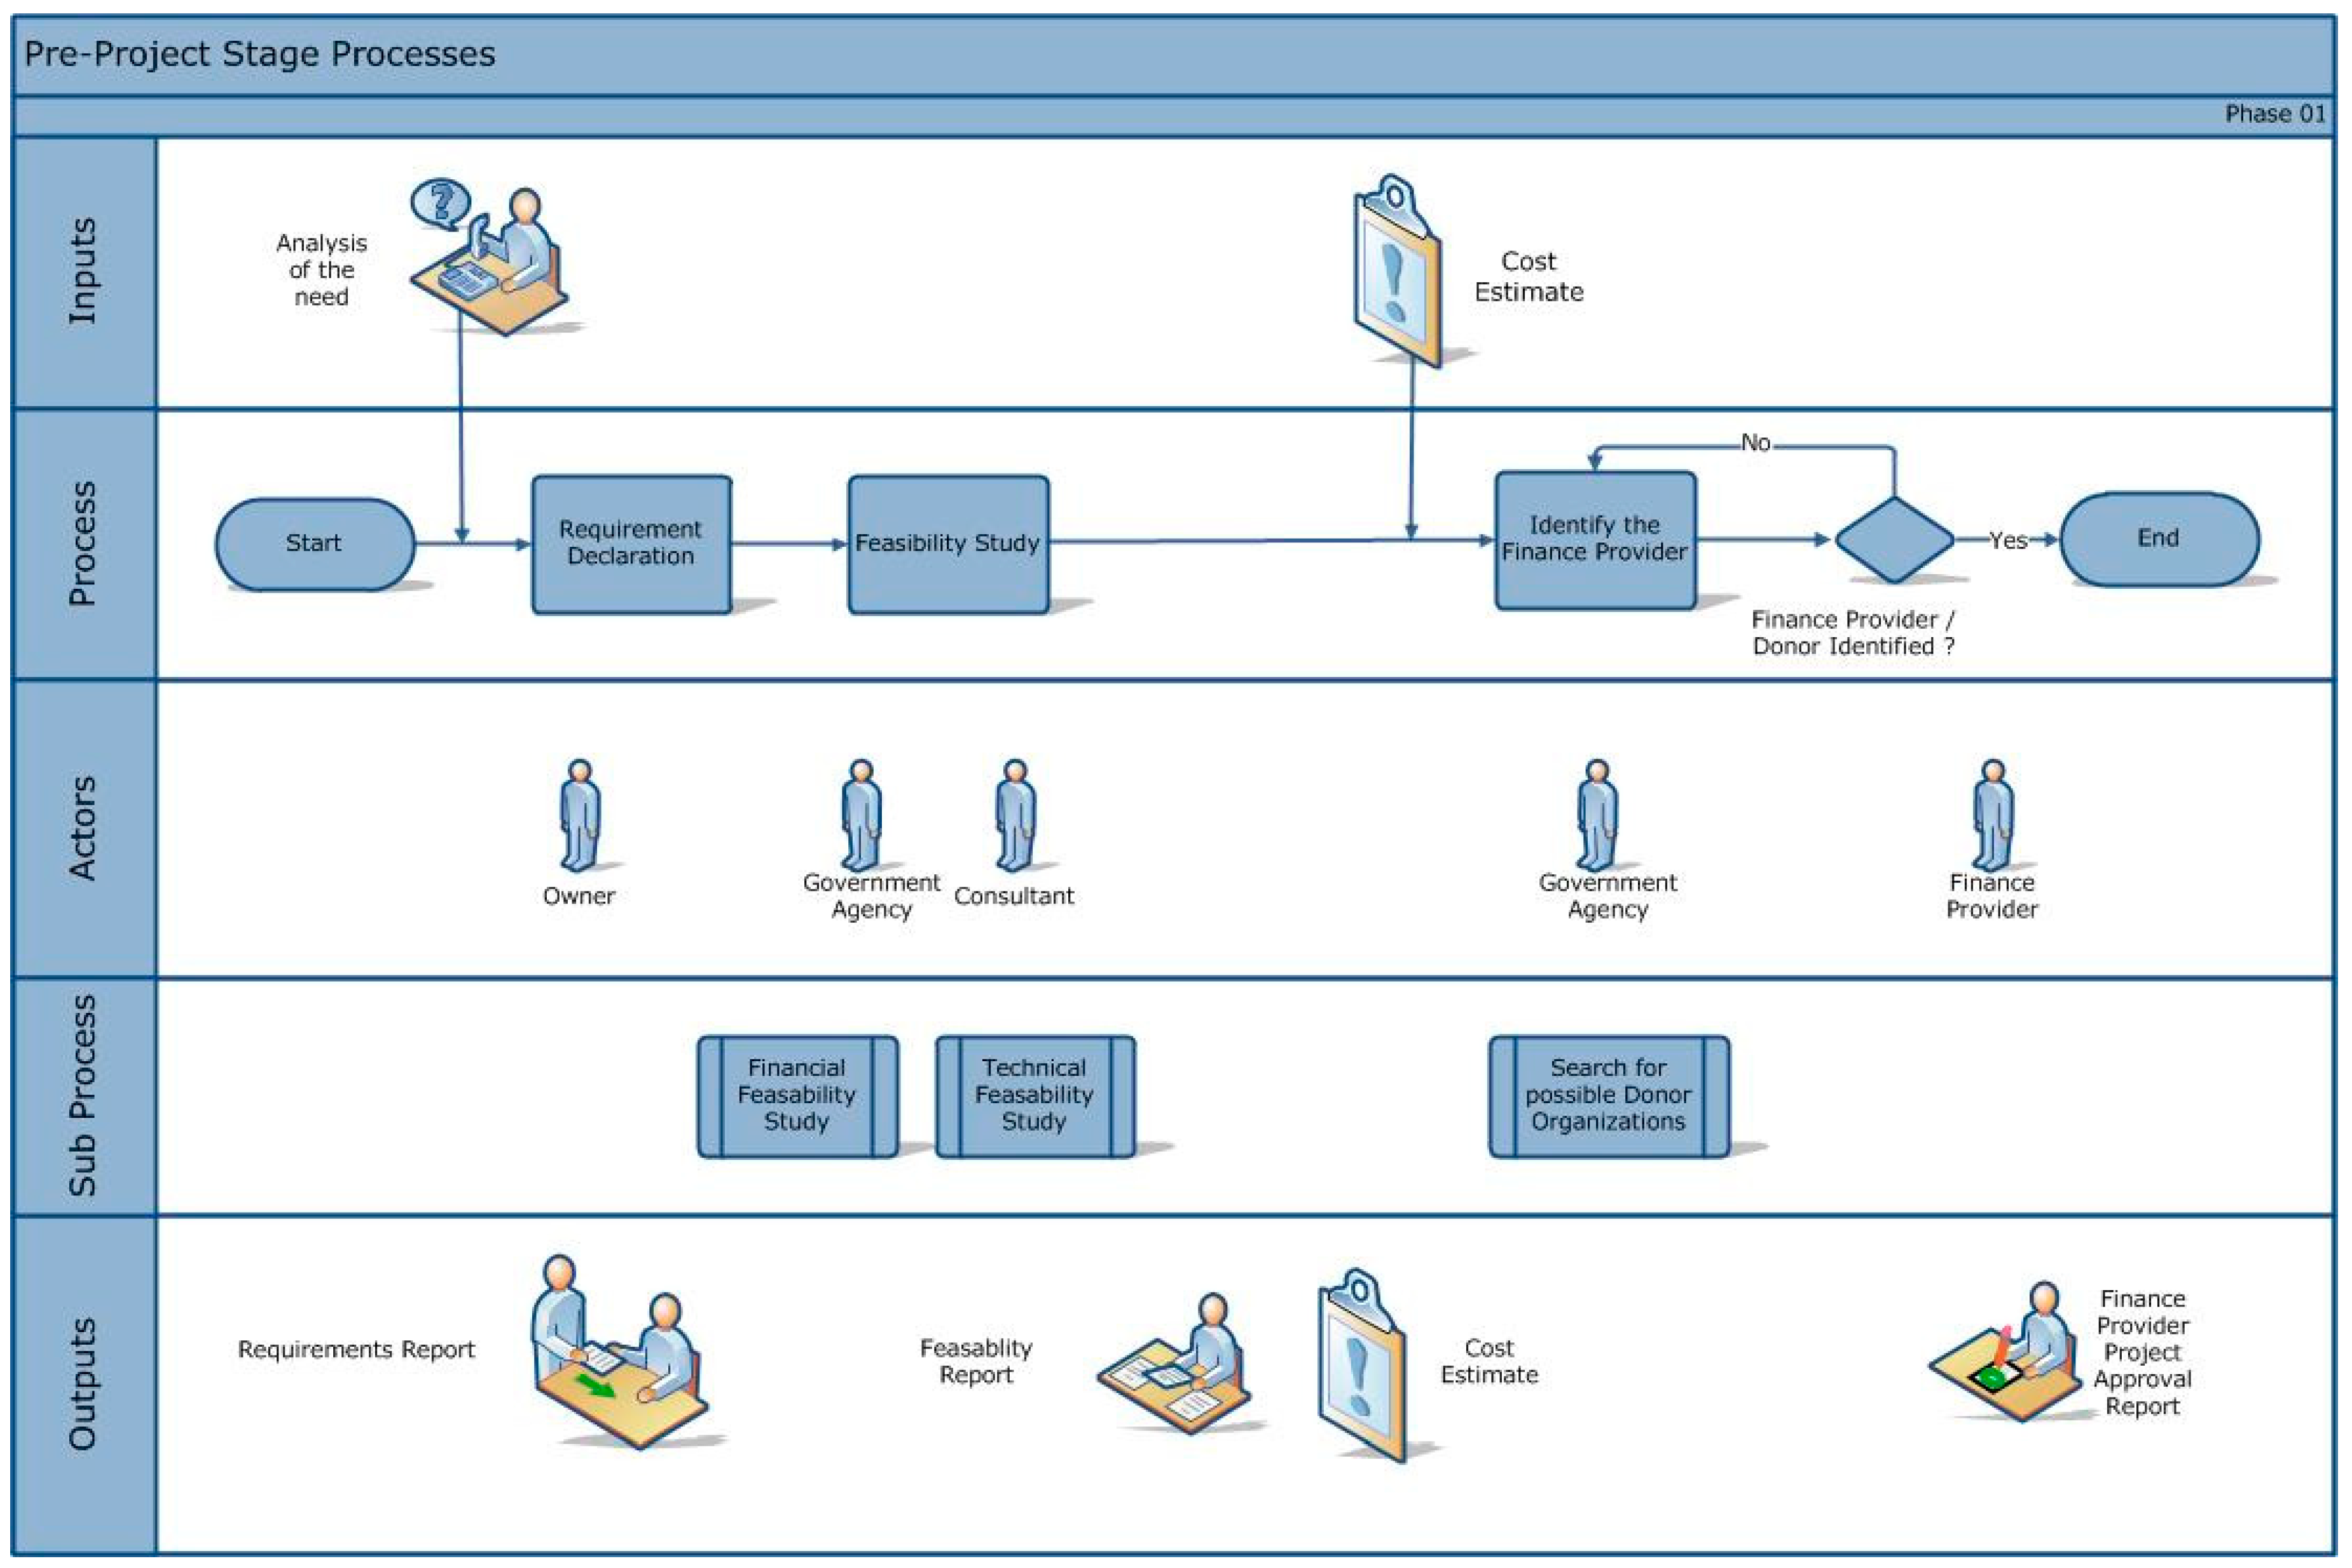
5.1. Pre-Design Phase Processes
The lifecycle of the project starts when the owner organization indicates a requirement for a building to the responsible body of government (i.e., government agency) such as ministry of education, or ministry of public works and housing. The government agency then elaborates on this project idea, conducts a feasibility study and starts to look for the financial (i.e., funding) authority that would support the project. A donor organization is then found and the support request for proposed project is approved by the donor organization. The organization then starts transferring the funds for the project through the ministry of finance. Most coordination problems observed to start in this phase are due to misinterpretation of clients’ needs and due to problems in feasibility studies. The identification of the financial authority is a key stage and requires high level of collaboration and coordination between the owner organization and the government agency.
Figure 3 presents the detailed process map and the outcomes of this phase.
5.2. Pre-Construction Phase Processes
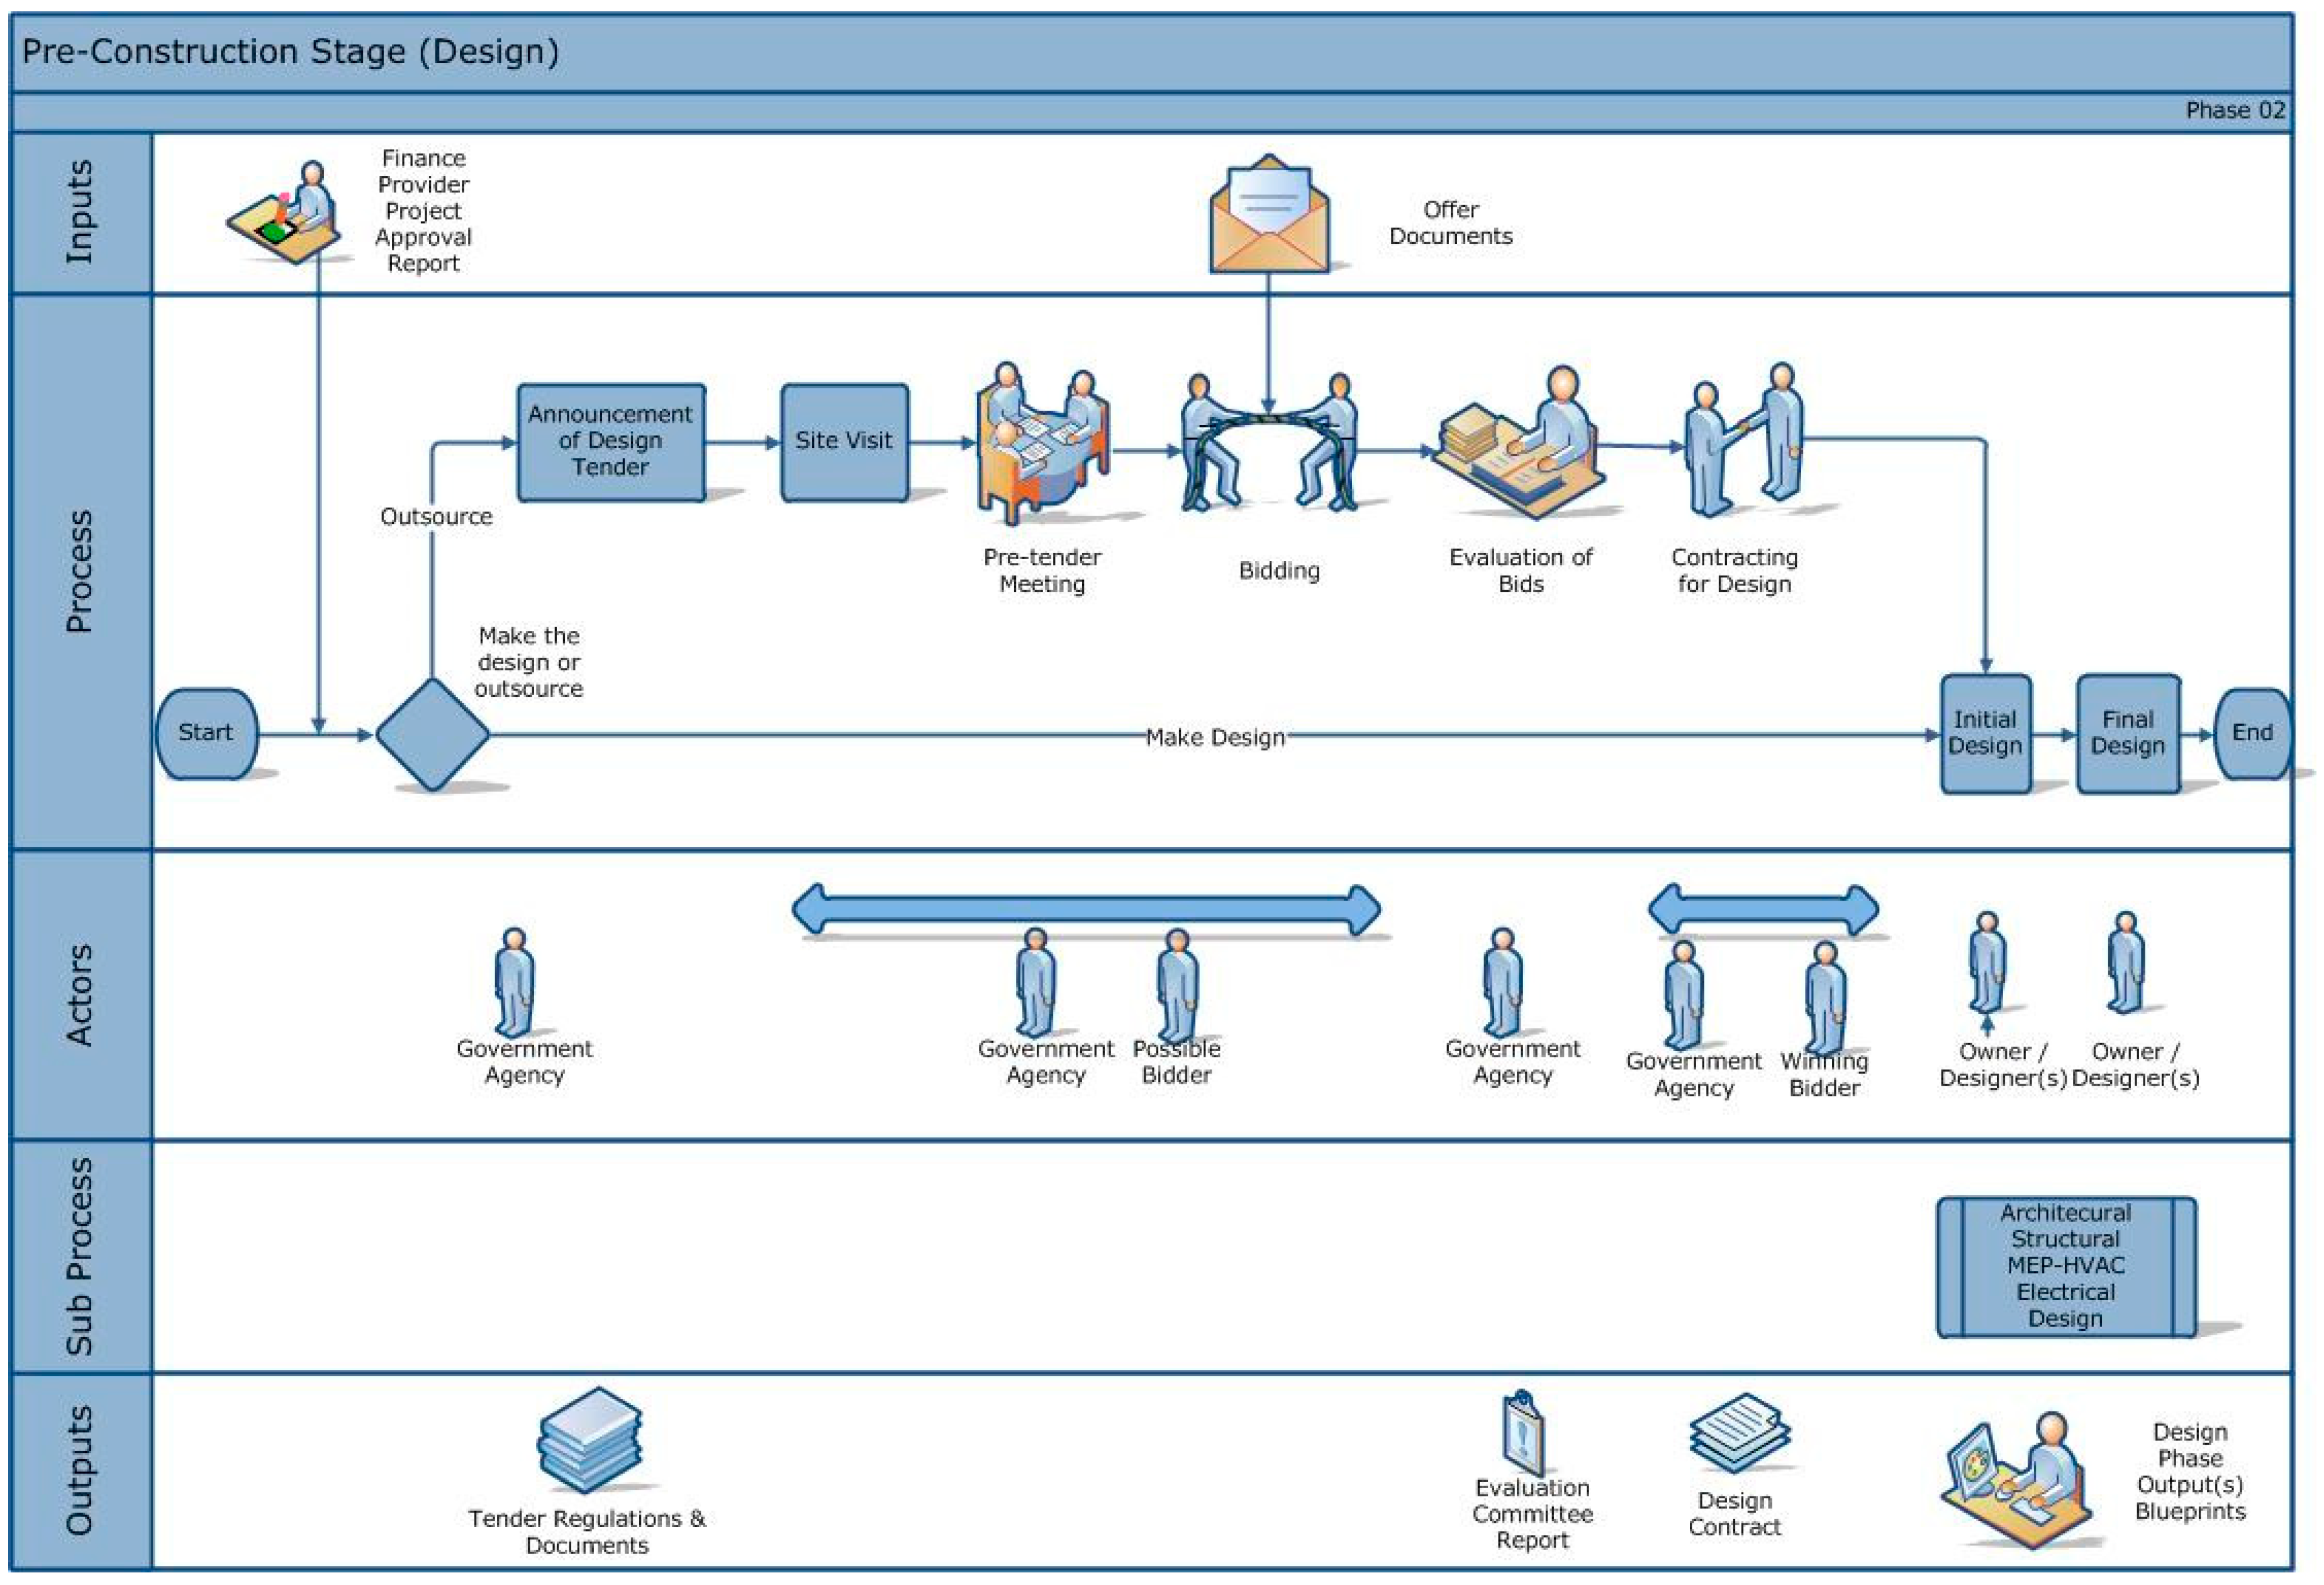
The next phase is the pre-construction phase. Once the government arranges the financing of the project, there are two routes to follow. In the first route, the design and supervision department prepares the design, and construction bid documents based on the client specifications and the budget allocated for the project. In the second route, the design is delegated to a design consultant as a result of a bidding process. In this option, the bid-for-design is announced in local newspapers to reach sufficient number of bidders. This is followed by the visit to the site, and an initial meeting to respond to the information requests of the possible bidders before the tender is opened. Once the tender is opened and finalized, the evaluation of the bids is conducted by the evaluation committee of the government agency. A design development contract is then signed with the winning bidder. The winner prepares design documents, and the documents required for the construction tender (including detailed design, bill of quantities (BOQs) and so on). This stage is illustrated in
Figure 4.
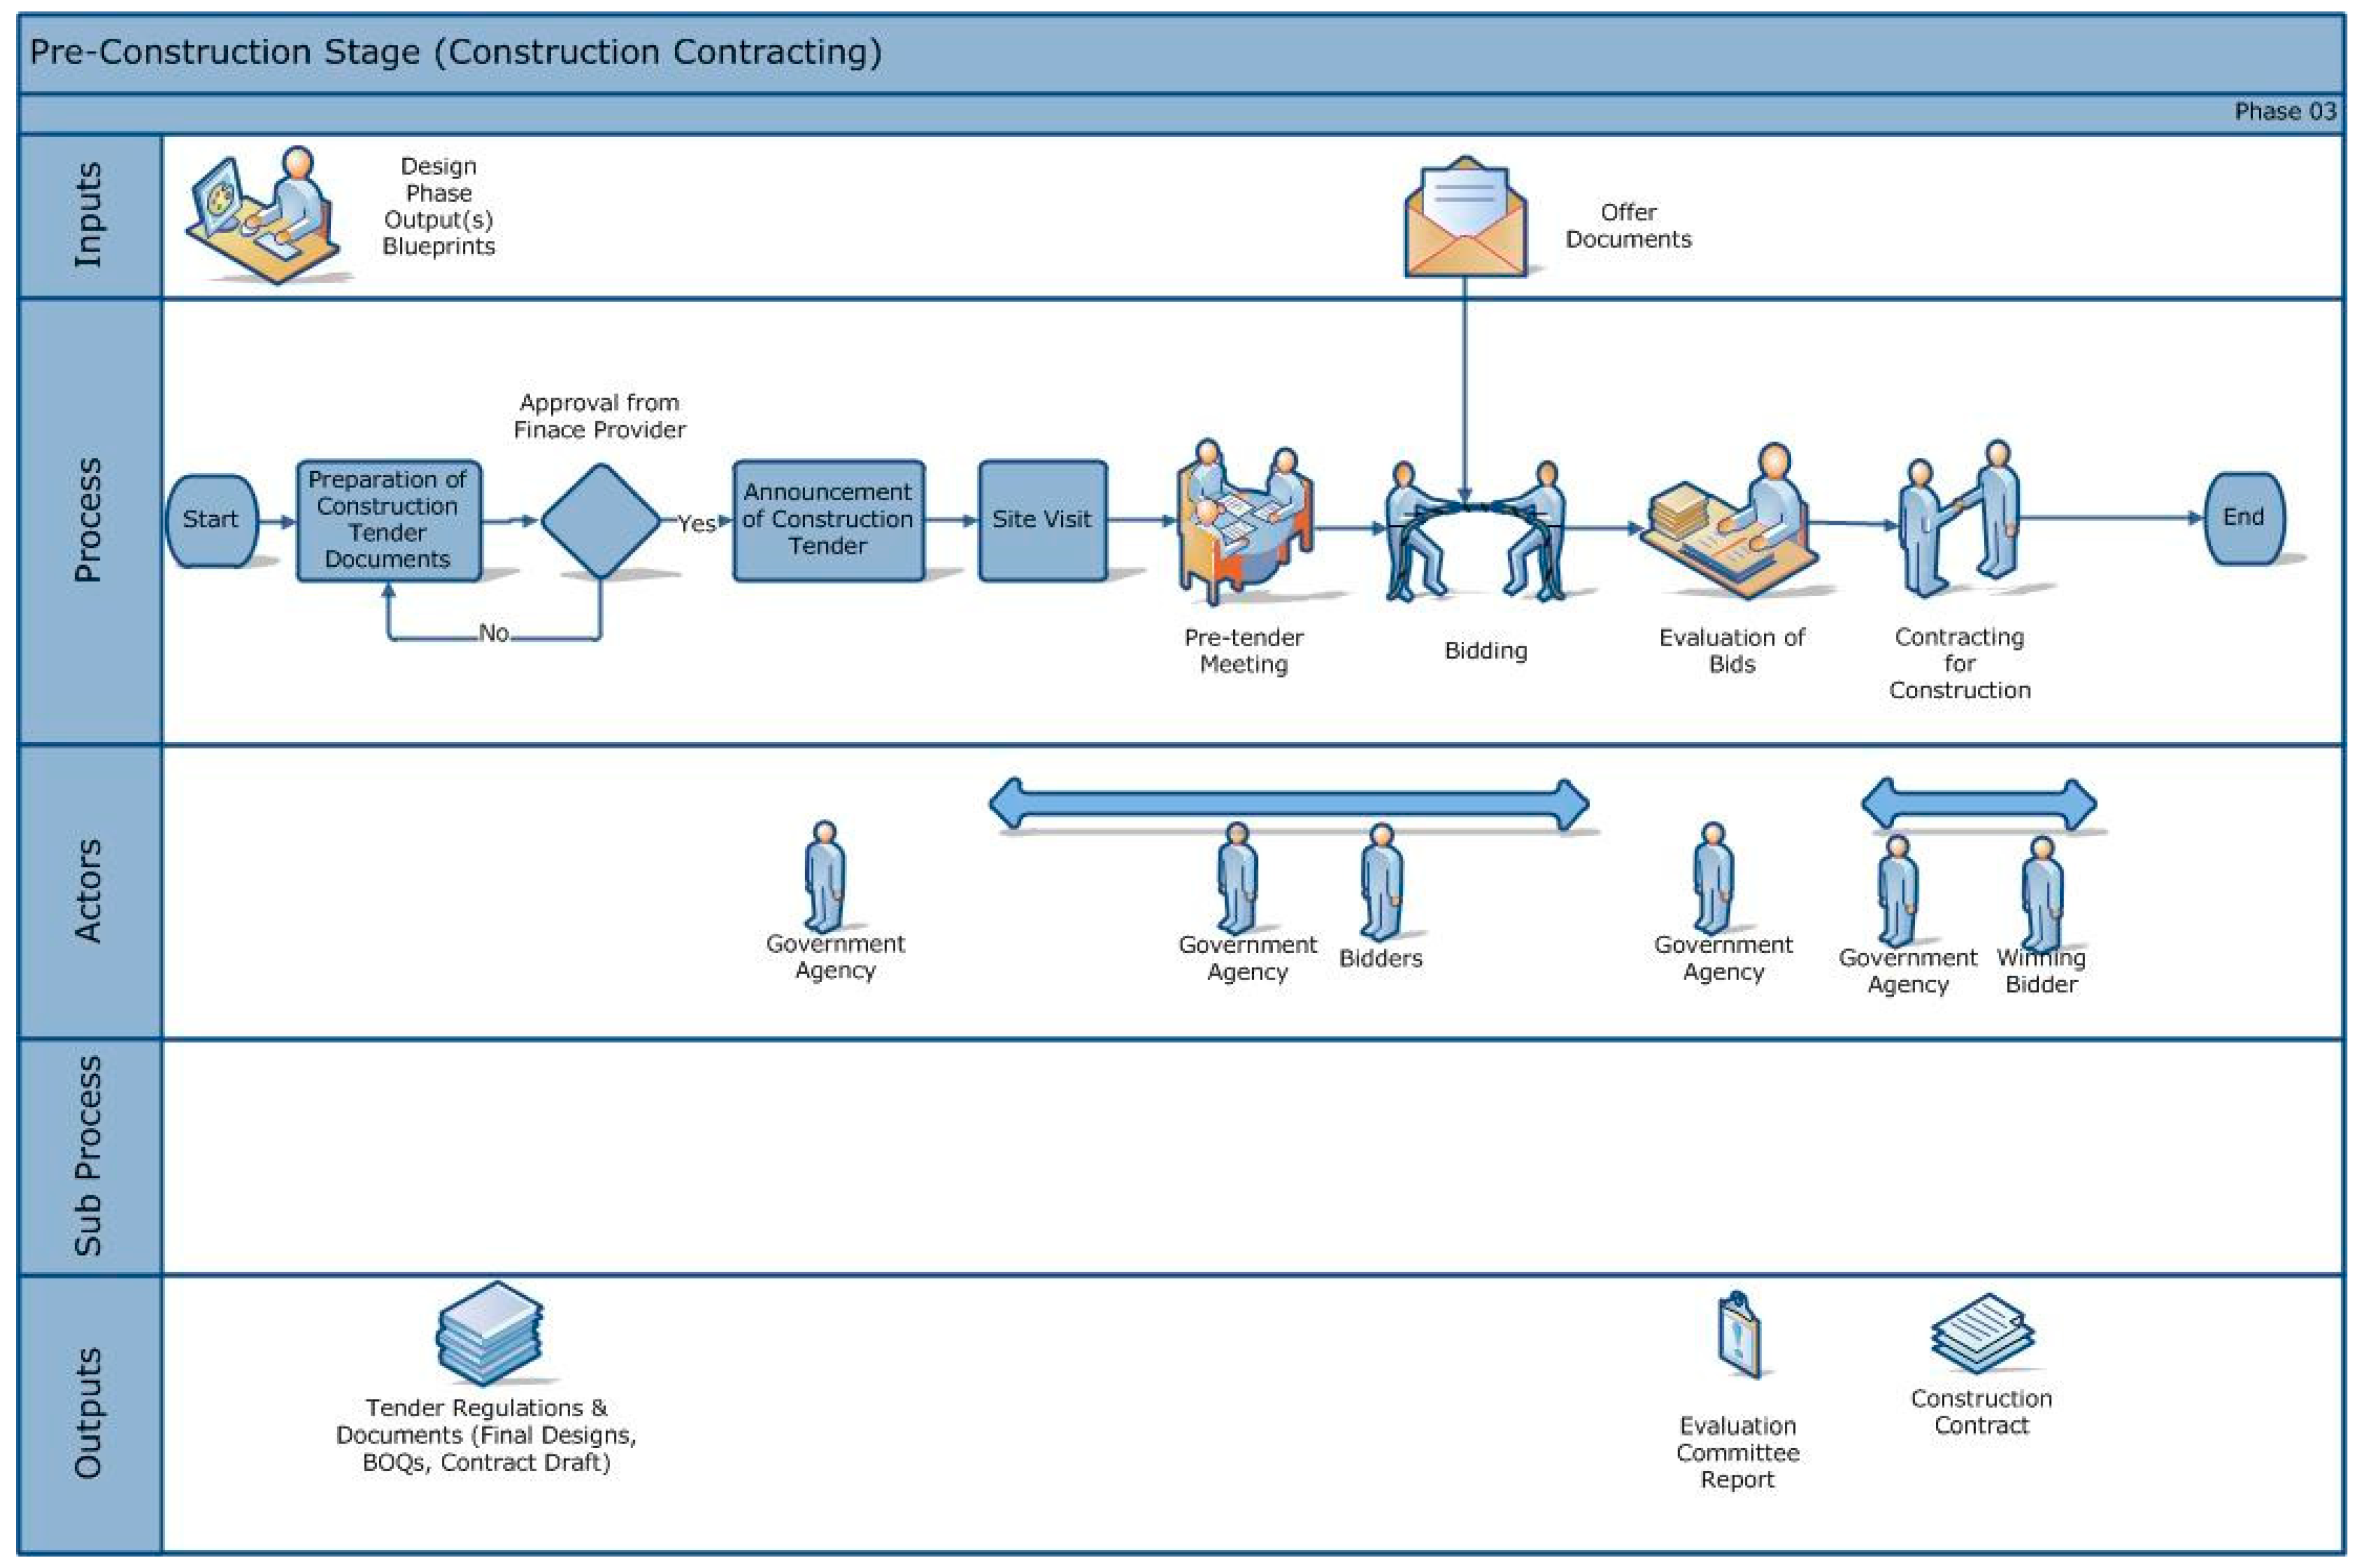
Following this stage, the tender-for-construction is opened and completed following the similar steps with the tender-for-design which includes announcement of the tender, site visit by possible bidders, a meeting for responding to information requests, opening of the tender and the submission of the bids by the bidders. An evaluation meeting is then held by the evaluation committee [
19]. The process is terminated with the selection of a qualified lowest price contractor and the contract is signed [
20]. The tender-for-construction (i.e., bidding) stage is depicted in
Figure 5.
5.3. Construction and Post-Construction Phase Processes
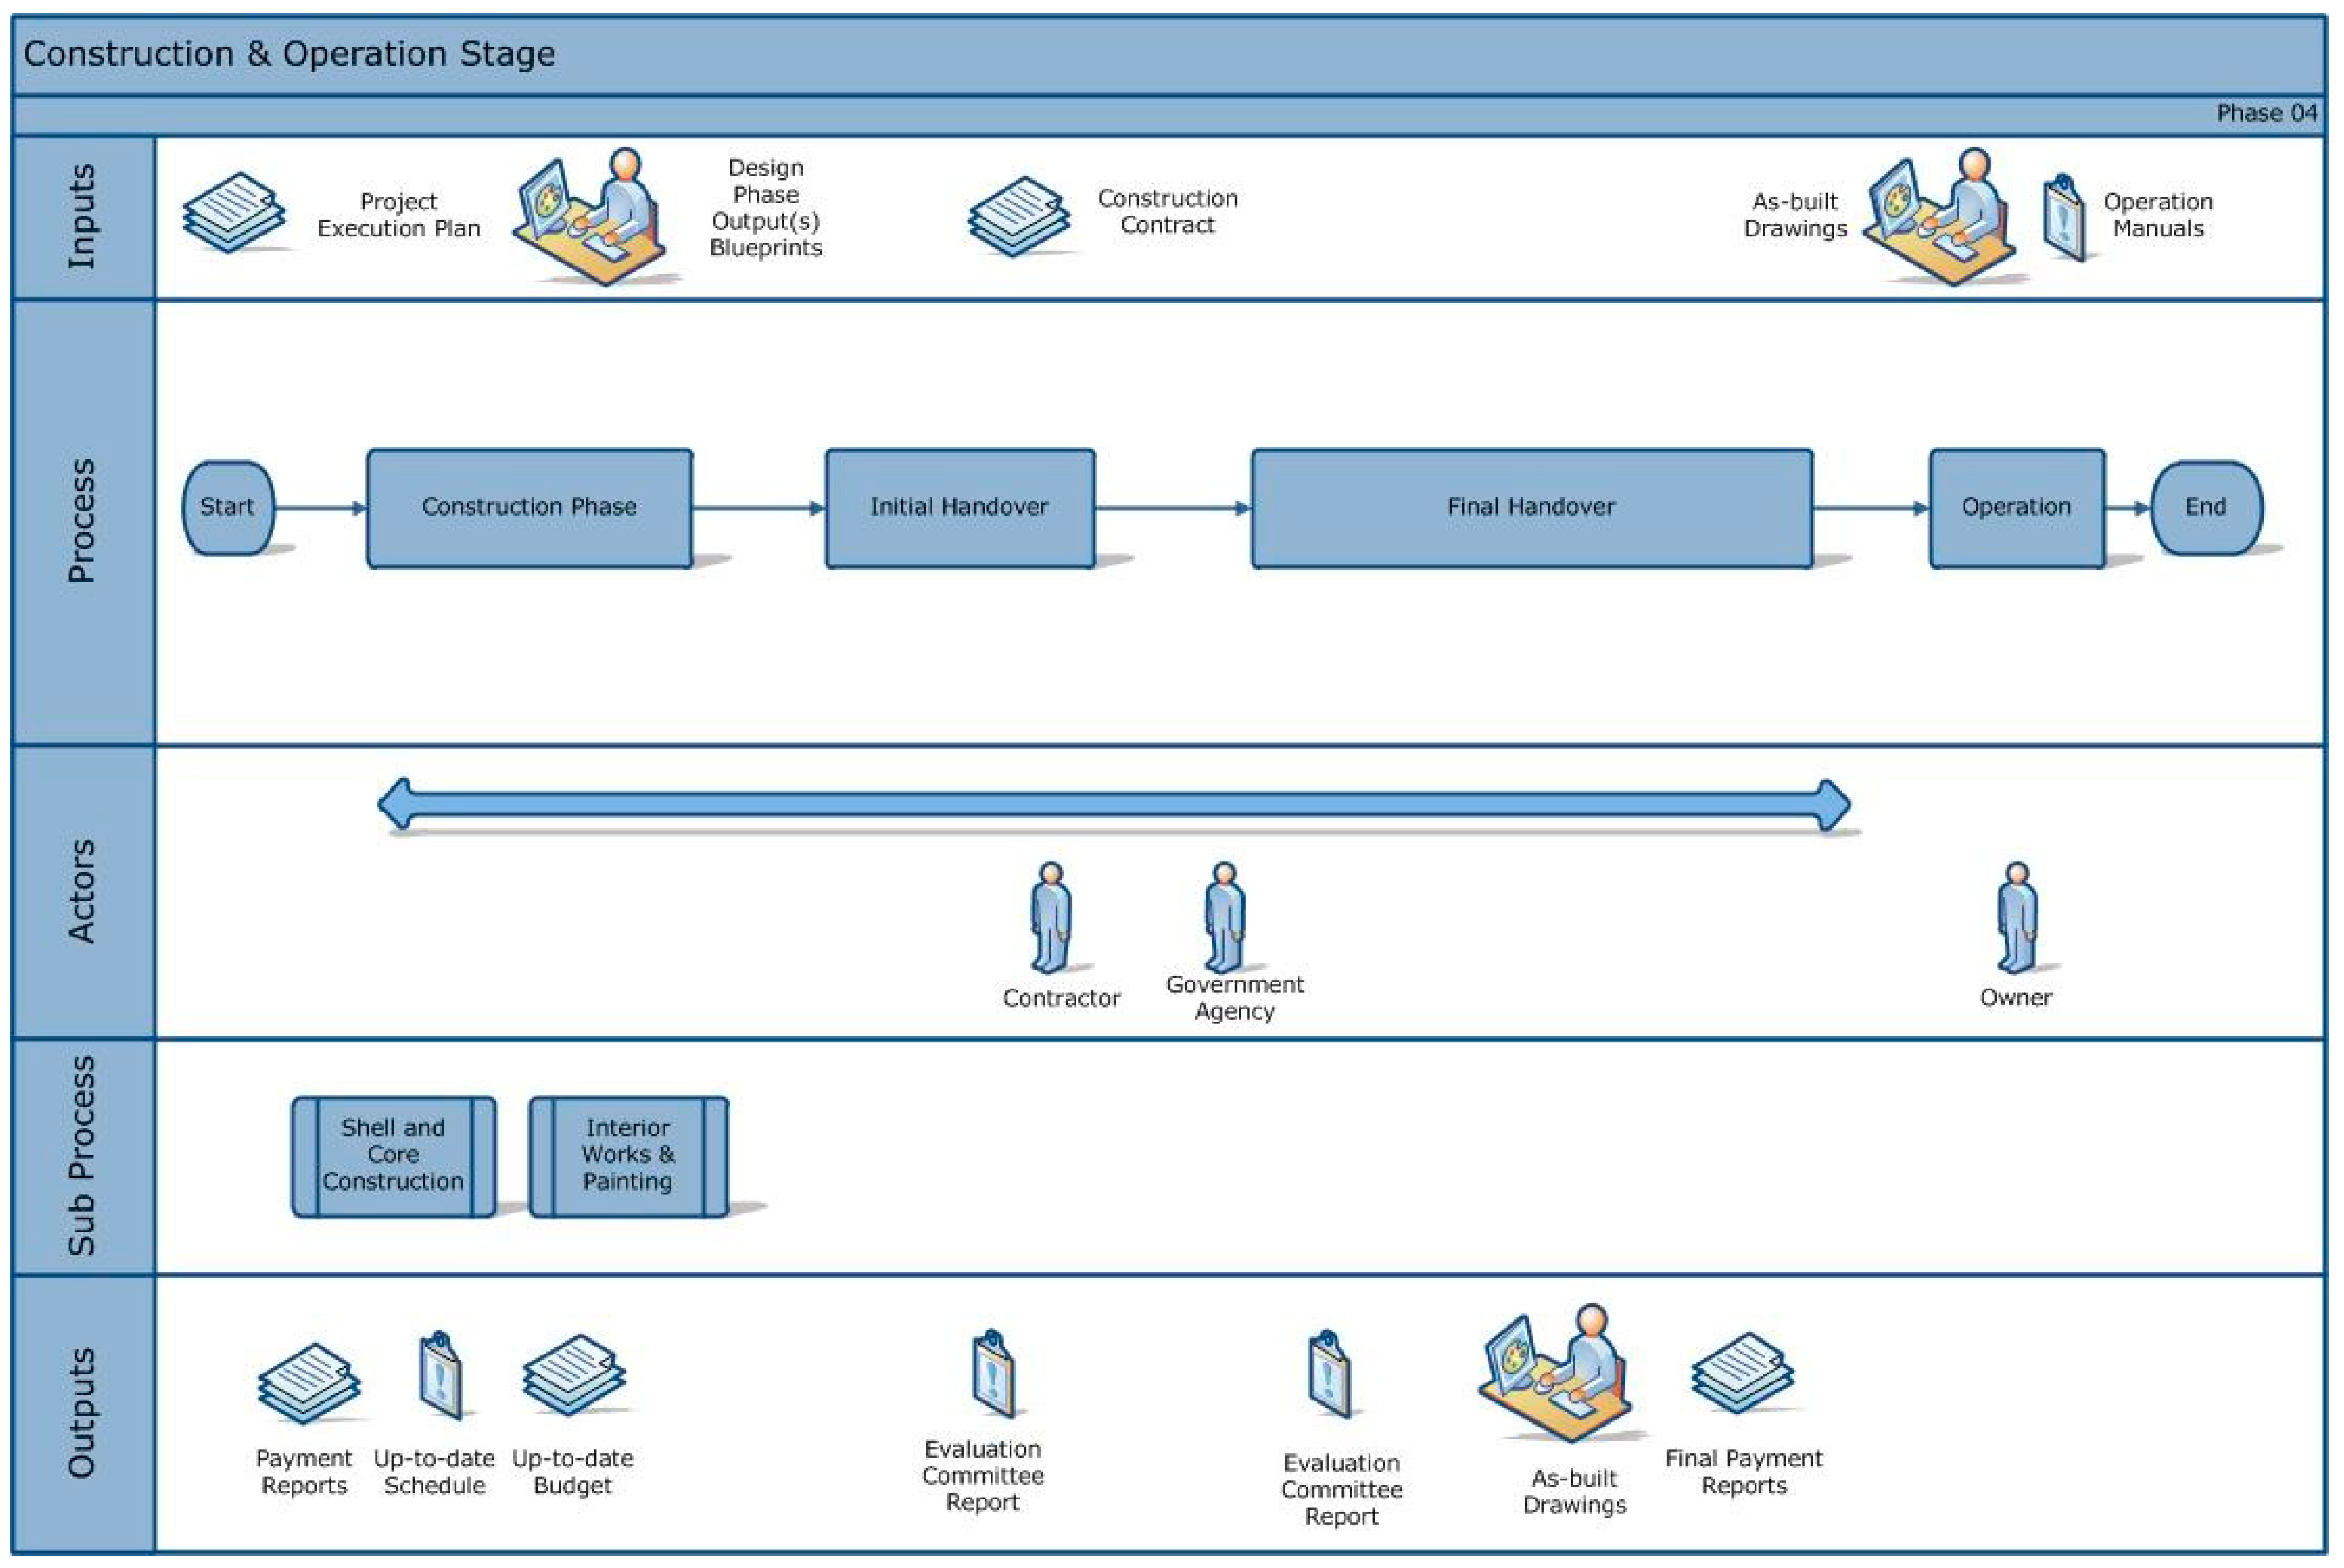
This stage starts with development of a project execution plan which sets out the strategy for managing the construction process. The overall plan includes roles and responsibilities, time plan, the cash flow plan, procurement plan, and inventory management plan. This phase includes all the activities that will be performed by the contractor, including the procurement of materials and equipment, preparation of materials on site and the actual production processes. In this phase, the contractor works with many documents, such as workflow charts, drawings, financial claims, and work orders; all of these documents become part of the administrative records and must be kept as a part of project documentation. It is common in this phase for the owner to ask for some amendments/changes to the contract documents and issue change orders. The contractor gets periodic payments from the owner during the construction phase.
The final phase is the post-construction and operation phase. Once the contractor finishes all the work in compliance with the contract, the handover of the finalized construction is accomplished in initial handover and final handover stages. The final handover includes the delivery of as-built drawings and operation manuals to the owner. The building is operated and maintained by the owning organization or party.
Figure 6 illustrates the processes in construction and post-construction phases.
6. Validation of the Process Maps
The presented model and maps identified commonly observed processes in donor-funded projects. To ensure that the model can be generalized to cover different donor funded projects, a model validation study was necessary. The model (and maps) were validated through semi-structured interviews conducted with experts from ten different organizations taking part in the donor-funded construction projects. The questions mentioned in
Appendix B were used to clarify the following issues into a total of 25 processes (i.e., 20 processes and 5 sub-processes):
- -
Whether the proposed processes and sub-processes are implemented in their organizations (Q1)
- -
Whether they suggest any additional input (Q2) or output (Q3) documents to be added to the process maps.
- -
Whether the actors in the processes defined correctly in the map (Q4), and if there are any additional actors that are required to involve in each process (Q5).
- -
Whether there are any missing processes that are not mentioned in maps (Q6)
- -
Whether the processes and sub-processes are in correct order (Q7).
The results obtained from interviews analysis are presented in the following sections.
6.1. Pre-Design Phase Validation
This phase consists of three processes, where the second process involves two sub-processes.
Table 3 provides a summary of processes at this phase.
Table 4 presents the results of interviews. It is clear that 50% of the interviewees did not implement Process 1 (i.e., requirement declaration). For Process 2 (conducting the feasibility study), the vast majority of experts (about 80%) indicated that feasibility studies were implemented in their organizations, and they used the input documents mentioned in the process map without the need of any additional documents. In addition, about 60% of interviewees stated that the output documents mentioned in the process map (feasibility report and cost estimation) are used in their real life projects, whereas 30% of them did not have any idea about that.
Furthermore, more than two thirds of interviewees agreed that the actors of the process are correctly defined and no additional actors are required to be involved in Process 2. The same conclusion can be depicted for Process 3 (identifying the finance provider). Finally, 80% of interviewees agreed that there is no missing key process and the processes are in correct order.
6.2. Pre-Construction Phase (Design Map) Validation
This phase consists of nine processes.
Table 5 presents an overview of this phase. The results of interviews for this phase are shown in
Table 6. It is noticeable that about 80% of the interviewees confirmed that the processes of this phase are implemented in their organization. Furthermore, 80% of experts assured that the input documents mentioned in the process map are usually utilized in real life and there is no need to use any additional input documents. Similar results were obtained regarding the output documents, where 80% of experts assured that the outputs mentioned in the process map are compliant with real life cases. However, some interviewees stated that it is required to involve donors (who participate in most of this phase’s processes) in the maps. Moreover,
Table 6 shows that there is an agreement of 80% that no key processes were neglected in preparing the map; and they assured that all of the processes are arranged in the correct order for this phase.
6.3. Pre-Construction Phase (Construction Contracting Map) Validation
This phase consists of seven processes.
Table 7 presents a summary of processes in this phase. The outcome of interviews for this phase can be seen in
Table 8. In
Table 8, there is 80% agreement of the interviewees on implementation of Processes 1, 5 and 7 in their organization. On the other hand, 60% indicated that Processes 2 and 6 were implemented in their organization, but 40% of them did not have any idea about these two processes. However, there is consensus from all interviewees about employing Processes 3 and 4 (site visit and pre-tender meeting) in their real-life cases. The majority of experts agreed that no additional input documents are required and the inputs mentioned in the map are adequate for this phase. Furthermore, the output documents mentioned in the proposed protocol are usually utilized in their real life projects and no additional output is needed. Similar to the results mentioned in the previous section, in the pre-construction design phase, the interviewees confirmed that the donor needs to be added as the actor of the processes of this phase. Finally, most of interviewees stated that the processes are ordered correctly and there are no missing key processes.
6.4. Construction and Post Construction Phases Validation
These phases consist of four processes; the first three processes are related to construction phase, whereas the last one is related to operation phase (post-construction phase).
Table 9 provide highlights of these two phases. The results of interviews are shown in
Table 10. The results indicated that the vast majority of experts confirmed that all of the processes are employed in their organizations. They also pointed out that the input and output documents mentioned in the proposed process map for these two phases are adequate. Moreover, similar to the previous phase, there is an agreement from most of interviewees on the importance of involving donor during the construction phase. Lastly, the results also indicated that the processes were arranged in the right way and none of key processes were ignored in the maps.
The results of the interview indicate that most experts consider the proposed protocol map as an efficient and effective tool. There is evidence that the developed tool has the potential to help overcome coordination problems in donor-funded projects. The process maps were found to be a comprehensive resource by the interviewees. The next phase of the study concentrates on verification of the methodology used for validation.
7. Verification of the Methodology
To verify the methodology used in model validation and also to ensure the validity of the maps and data collection approach a series of statistical analysis are provided in this section. The first analysis in the verification study was concerned with understanding the knowledge level of the organizations based on their responses. The aim of this analysis was to determine if organizations that were interviewed were knowledgeable at a level to test/validate the process maps that were provided to them.
7.1. General Overview on Knowledge Level of Respondents
Table 11 provides percentage of “I have no idea responses” for all seven questions, each asked for all 25 processes. The list of organizations where the face-to-face interviews are conducted are provided in
Appendix A.
As demonstrated in
Table 11, Company 1 and Company 2 were the participants with the least level of knowledge, as they did not have an idea on 68% of the processes. This is followed by Engineering Office 1 and Engineering Office 2; the rate of their “I have no idea” responses were 48%. Although the knowledge level of these offices appear as low among the other interviewees, their knowledge level about the processes was over %50. The responses from NGO showed that that participant have a knowledge about 96% of the overall processes. Five other participants, MOHE, MOH, MPWH, MOLG, and NM, were very knowledgeable about the processes, as they had an idea about all the processes. The results have demonstrated that 60% of the organizations that joined the validation study had a knowledge level >96%, while 20% have a knowledge level >52% and remaining 20% had a knowledge level >32%. In the verification study another test was conducted concerning with the level of awareness from the perspective of processes. The next stage of the verification study focused on the analysis of the responses to the questions.
7.2. Analysis of Questions
The reliability test of the survey revealed a Cronbach’s Alpha of 0.975 for Pre-Design Phase process related responses, a Cronbach’s Alpha of 0.989 for Design phase process related responses, a Cronbach’s Alpha of 0.994 for Pre-Construction phase process related responses, and a Cronbach’s Alpha of 0.951 for Construction and Operation phase related responses. The overall results prove that the reliability of the survey is high.
Individual analysis of responses to each question is presented in this section. Each table below provides detailed information on questions and response types and rates. The responses to Q1 (
Table A2) reveal that 76.4% of the processes defined in the maps are actually implemented in business practices. It can be concluded that the mapping effort is successful in representing the processes implemented in business practices.
As indicated in
Table A3, 76.4% respondents indicated that they do not propose any additional input documents apart from the ones that are defined in the process maps. The remaining 23.6% had no idea related to that question.
As illustrated in
Table A4, only 4.7% of the overall responses indicated that there is a need for definition of additional output documents in the process maps. The possibility of getting a positive answer to this question is 2.3–8.4% in 95% Confidence Interval, which is a very low probability. Additional Kruskal–Wallis test was applied to discover if there is a significant difference in positive responses among all processes. The test result (Sig. = 0) indicated that there is a significant difference between the responses to several processes, as most positive responses are cumulated in Process 4 of Construction and Operation Stage processes (i.e., the building operation process). This shows that it is significant and clear that additional output document definitions related to this processes are required. In general, it can be stated that the process maps were found to be successful in defining the output documents used in business practices.
As stated in
Table A5, 73.8% of the responses pointed that the actors of the processes were defined correctly. The possibility of getting a positive answer to this question is 67–79% in 95% Confidence Interval which is a high possibility. A Kruskal–Wallis test was applied to discover if there is a significant difference in negative responses among all processes. The test result (Sig. = 0.728) indicates that there is a uniform distribution of negative responses between all processes, i.e., there is no significantly apparent process that the additional output documents needs to be re-defined in short term.
As mentioned in
Table A6, 70.5% of the responses indicate the need for additional actor definitions for the processes. The possibility of getting a positive answer to this question is 23–36% in 95% Confidence Interval which is a low possibility. A Kruskal–Wallis test was applied to discover if there is a significant difference in positive responses among all processes. The test result (Sig. = 0.181) indicates that there is a uniform distribution of positive responses between all processes, i.e., there is no significantly apparent process that the actors need to be re-defined in short term.
Table A7 shows that all respondents agree that the process in the model reflects the real-life business processes with accuracy.
Table A8 indicates that the order of processes was found correct by all participants of the validation study.
In the next stage, the verification study concentrated on determining the correlation between the responses in each stage for all Pre-Design, Design, Pre-Construction, and Construction and Operation stages These correlations are calculated for every process and sub-process by taking into account responses to all questions (i.e., Q1–Q7) for that process (please see
Appendix C). As illustrated in
Appendix C, for example, for Pre-Design stage (Sig. = 0), the result of the correlation test between processes P1 and P3 indicates that the responses to all questions have a meaningful relation between them for P1 and P3 processes. In other words, the tables shows that, for instance, for Pre-Design stage, when respondents answered Yes Q1 for P1, there is a 77% (i.e., correlation coefficient) they also answered Yes for Q1 for P3.
The tables in
Appendix C show that for many processes there is a correlation between the responses (where Sig. < 00.5). The high number of correlations between the responses for each stage shows that there is a common agreement between all validation survey respondents for most of the responses.
8. Conclusions
Weak coordination is one of the key problems that has a negative impact on the success of construction projects. Coordination can be facilitated through well-defined and formalized processes. Process maps are known as important tools in the formalization of the processes. The main aim of this research was to formulate a process map for donor-funded projects with the goal of facilitating coordination through the utilization of well-defined processes. The implementation of the maps and project management based on industry standard process maps require substantial changes in the culture of the industry, but this implementation will contribute to the improvement of management skills at all levels. To achieve the targets of becoming more efficient and sustainable, the industry needs to make radical changes to adapt process based construction management principles where processes are explicitly defined and monitored by all stakeholders. The gaps in exchange of information between the processes need to be bridged through better information management practices. Once the processes are clearly identified, the barriers to coordination related problems will be highly reduced. Process maps developed in this study can also be used to determine the information exchange requirements which is a key component in Building Information Modeling (BIM) and Integrated Project Delivery approaches. Once the information exchange requirements are clearly determined, the BIM adoption in these types of project would be fast and seamless. The definition of processes in process maps will also serve as key checkpoints for quality control during the design and construction phases.
Further research will be focused on developing more detailed versions of the process map and measuring the impact of the implementation of process map in donor-funded projects. In addition, implementing a project management effort based on the developed maps in a real life project is a significant future endeavor. During the interviews for the development and validation of the process maps, the following recommendations are provided by interviewees for enabling process based construction management and better coordination in construction projects in Palestine. The government is recommended to reevaluate the regulations related to construction industry. The government is advised to speed up the ratification of proposed laws on topics related to construction processes and contracts. It is highly recommended to form a specialist body that contains engineers, contractors, decision makers from government bodies, legal advisors and academics to adopt process maps in construction management. Continuous training programs involving lectures, training courses, seminars, and workshops would help the parties to be familiar with operational and legal issues in processes, which in turn would help in management and decision-making. The ministry of public works and housing is recommended to establish a research and development (R&D) unit to tackle all problems facing the construction industry which appear as a result of the lack of coordination in projects. The interviewees indicated that the industry should be open to use new technologies such as BIM, which may very much contribute to the collaboration and coordination in donor-funded projects.

 ,
, 


