Abstract
A state-owned enterprise (SOE) is a mechanism by which market stability is achieved through government intervention. As economic freedom intensifies, most SOEs still have a rigid personnel system, unsound financial structure, and high product costs, along with poor management and operating losses, making them financial burdens. This study uses grey relational analysis and a Boston Consulting Group matrix to develop a sustainable management and development model for enterprises. The 13 business units of the Taiwan Sugar Corporation (Tainan, Taiwan) created through diversification were evaluated to determine if they have led to new competitiveness. The findings reveal that only two of the business units—land development and property management—have justified their operations, while the other 11 business units have brought no benefits to the country. Overall, diversification has created a greater burden for the country.
1. Introduction
The Taiwan Sugar Corporation (TSC) is a state-owned business unit under the Ministry of Economic Affairs of the Republic of China (Taipei, Taiwan). Growing along with Taiwan’s economy, the TSC has undergone three important transformational and development stages: exports, industrialization, and diversification. The exports stage occurred from 1952 to 1964. In this stage, the value of sugar exports ranked number one on Taiwan’s exports list, accounting for 74% of Taiwan’s total foreign exchange earnings at its peak. Sugar was the major source of economic income during Taiwan’s rural economic development.
The industrialization stage started in 1970, when international sugar prices fell into a long-term dip and the cost of production was high. The sugar industry could no longer meet the market’s volatile daily domestic needs. Consequently, most sugar in Taiwan is now imported. During this stage, Taiwan began to transform from an agricultural society to an industrial one. For example, “cane sugar farms were transformed into schools and technology parks and regions”, while “farmland was transformed into huge developments” that facilitated Taiwan’s industrial and high-tech development. The share of the sugar industry gradually declined during this period of industrialization.
The diversification stage occurred in 2003 and 2004. To achieve sustainable development, the TSC began to transform by adjusting its management and operational strategies while striving for diversified management. The TSC set up 13 business units based on several product attributes: biotechnology, hypermarket, petroleum, marketing, sugar, livestock and breeding, fine agriculture, leisure and recreation, environmental protection, land development, property management, organic and safe agriculture, and general management. At the same time, the privatization of businesses other than sugar through a holding company approach was being planned.
As the economy developed, the TSC faced many challenges, such as the collapse of sugar prices, fund shortages, and the sale of large areas of land at prices much lower than their cost. Originally set up as a market stabilization mechanism, the TSC, a state-owned enterprise (SOE), created a huge financial burden on the country. It received negative evaluations on both management and operations, and its losses constituted a persistent weakness that never improved. Could the TSC’s competitiveness really be improved through diversification? This study constructs a sustainable management and development model for the TSC. First, grey relational analysis (GRA) is used from an objective perspective to evaluate the business performance of the TSC’s 13 business units. Then, a Boston Consulting Group (BCG) (Boston, MA, USA) matrix is employed [1] to position the 13 business units and determine which one(s) negatively impacted the TSC after the restructuring that prevented it from changing. The evaluation results could serve as a reference for Taiwan, and help it ensure the sustainability of its SOEs.
2. Literature Review
In an industry’s life cycle, a firm’s most optimal industrial value chain strategies include the following:
- Vertical integration is the correlation between upstream and downstream, whereby an enterprise generates its own inputs (regarded as backward or upstream integration) or processes its own outputs (regarded as forward or downstream integration) [2]. When an enterprise expands its scale of production through vertical integration or undergoes mass production, profitability can be improved from economies of scale [3,4].
- Horizontal integration is an expansion strategy that involves the merging of competing companies through the positioning of products or similar high-quality products; the newly merged company provides similar services or products. This strategy is generally adopted to enhance competitiveness and increase market share with the key objective of “eliminating rivals and grabbing market share” [5].
- Vertical disintegration divides production into several layers according to the value chain. The same manufacturer will engage in the production of only one particular layer (and will thus specialize), but all manufacturers in the alliance will mutually benefit [6]. This strategy is the exact opposite of vertical integration, as vertical disintegration separates the production activities in the value chain into layers, but decision-making is still based on the industrial value chain.
- Rumelt [7] pointed out that diversification can be categorized into unrelated diversification, related diversification, and the diversification of major products based on the extent of diversification. In unrelated diversification, some of the enterprise’s businesses belong to many unrelated areas. Related diversification occurs in enterprises with related businesses. The diversification of major products refers to diversification into products that complement the enterprise’s major products [8].
- Leutert [9] presented the political mobility of Chinese officials between 2003 and 2012 at central, provincial, municipal, and county levels—the leaders of China’s core central SOEs. This paper underscores the theoretical importance of disaggregating types of lateral transfer in the research on political mobility of Chinese officials and the cadre management system.
Shawtari et al. [10] used a quantile regression reveal to investigate the relationship between board characteristics and real performance among SOEs in Malaysia in a longitudinal period following the introduction of the transformation policy. The result indicated that the post-transformation performance is indifferent compared with the pre-transformation policy period. Sánchez [11] used the corporate social responsibility (CSR) information disclosed by SOEs and the influence exerted by the characteristics of the SOEs themselves (size, industry sector, degree of government ownership, and number of years in operation) and by those of their managers (age, gender, CSR education profile, and CSR responsibilities in the workplace). The results obtained and the size and sector of the SOE, together with the manager’s CSR responsibilities, were found to be the factors that most significantly affect the online disclosure of CSR information. For state-owned non-transparent procedures, Tkachenko et al. [12] observed significant overpricing of contracts with state-owned suppliers compared with private suppliers, especially in the case of repeated contracts. Whereas for competitive e-auctions, there is only a small difference between the contract prices of state-owned suppliers and private suppliers.
Tang [13] claimed that most big enterprises are diversified, and companies lose growth momentum when their undiversified businesses mature, resulting in inevitable failure, because their current businesses are unlikely to continue growing in the long run. Zheng and Liu [14] employed data envelopment analysis to explore the correlation between bank size, extent of diversification, and operational efficiency. Their findings showed that private banks were experiencing increasing returns to scale and could adopt a merger-and-acquisition approach in order to expand their operational scale, whereas public banks could downsize to improve efficiency. Su [15] employed entropy to develop diversification indices in order to explore changes in diversification levels among Taiwanese business groups. The analysis revealed the following. (1) When the growth of an enterprise’s core product slowed, the business groups tended to engage in unrelated diversification. (2) When an enterprise’s R&D intensity was high, it tended to engage in diversification activities in generally unrelated directions. (3) When the professional education of an enterprise’s senior management was widely scattered, the enterprise was likely to engage in diversification in generally unrelated directions. (4) Finally, the older the enterprise was, the higher its degree of diversification.
Hung et al. [16] studied the relationships between corporate governance mechanisms, innovation strategies, and market performance, finding that the relationships were consistent with expectations. That is, shareholders preferred using innovative strategies to maximize wealth, whereas managers tended to engage in diversification strategies to maximize their own utility. Chung and Yeh [17] studied the correlation between using different social capital and expansion strategies in Taiwan’s family-run business groups. They found that the internal family capital mobilized by family-run business groups and their acquired external political capital had significant effects on the direction and degree of the diversification undertaken by the family-run business groups.
Tai et al. [18] used GRA and an analytic hierarchy process to explore firms’ limited data core product development and competitiveness. Wang et al. [19] combined entropy weighting and the GRA to evaluate the CSR of eight airlines in China. Focusing on 216 trade policies, Kang et al. [20] employed structural equation modeling to develop a trade strategy control system to identify attitudes toward using trade policies. The results encourage companies to adopt trade policies, and provide a practical model for resource allocation and policy administration.
Xue et al. [21] proposed a factor analysis evaluation model to explore seven potential factors: management index, construction dissipation index, productivity index, design efficiency index, transportation dissipation index, material increment index, and depreciation amortization index. The results showed that cooperative management has a significant impact on prefabricated capital costs, and increases in material and labor costs significantly impact production costs. These findings can help managers evaluate prefabricated cost management and identify the key incentives for high capital costs.
Finally, Chen and Ren [22] employed fuzzy grey relational analysis to evaluate four sustainable alternative aviation fuels in a comprehensive assessment program that generated the following ranking: algae-based fuel, soybean-based fuel, petroleum refining, and natural gas.
3. Grey Relational Evaluation Model
Deng [23] proposed the grey system theory, which includes the GRA, grey prediction, and grey decision-making. It focuses on a system model construction for cases wherein information is uncertain and insufficient, and the operational status is unclear. Especially in the context of uncertain systems with few data points and poor information, Liu et al. [24] compared probability statistics, fuzzy mathematics, grey system, and the rough set theory that the grey systems theory can deal with known partial information and unknown partial information.
This study adopts GRA to conduct an operational assessment of the TSC’s diversified business units. GRA explores the degree of correlation between two sequences using discrete measures to measure the distance between them. The calculation steps are as follows [25].
Step 1: Convert the data into a raw sequence
The relational degree between the reference data sequence X0 with K number of evaluation criteria and N number of comparative data sequences X1, X2, …, XN is expressed as follows:
X0 = {x0(1), x0(2), …, x0(j), …, x0(k)},
X1 = {x1(1), x1(2), …, x1(j), …, x1(k)},
…
Xi = {xi(1), xi(2), …, xi(j), …, xi(k)},
…
XN = {xN (1), xN (2), …, xN (j), …, xN (k)}.
X1 = {x1(1), x1(2), …, x1(j), …, x1(k)},
…
Xi = {xi(1), xi(2), …, xi(j), …, xi(k)},
…
XN = {xN (1), xN (2), …, xN (j), …, xN (k)}.
Step 2: Normalize the data
Data normalization can be divided into three components:
- Efficiency index—the higher, the betterwhere max[Xi(j)] denotes the maximum value of a certain index.
- Cost index—the lower, the betterwhere min[Xi(j)] denotes the minimum value of a certain index.
- Target index—when the target value is between the maximum value and the minimum value, set the target value as follows (ob):where max[Xi(j)] and min[Xi(j)] are defined in Equations (1) and (2), and Xob(j) is the target value of the jth number.
Step 3: Calculate the difference in the sequences
Calculate the absolute value of the kth difference between x0 and xi:
Step 4: Calculate the grey relational coefficient
Calculate the relational coefficient between reference data sequence X0 and comparative data sequence Xi at point j:
where is the absolute value of the jth difference between data sequence X0 and data sequence Xi:
Step 5: Calculate the grey relational degree
where wj is the weighted value of the evaluated jth attribute.
4. Case Analysis
Chen [26] argued that the TSC must change in order to survive. Privatizing SOEs is a global trend. Only through the review and liberalization of regulations on state-owned businesses can we smoothly promote privatization and improve operational performance in order to provide greater benefits to Taiwanese citizens. Over the past 60 years, many TSC factories have closed, generating redundant manpower that cannot be laid off because of legal restrictions. Therefore, the TSC began to diversify its operations. Although it followed the right direction, the TSC’s diversified operations “were all operating at a loss” because of legal restrictions binding state-owned businesses.
Diversification has resulted in substantial losses over the past 10 years. To address its dilemma, the TSC has continued to change its diversification policy, transforming its coverage to include food, clothing, housing, transportation, education, and recreation, which are all related to people’s daily lives.
Table 1 shows the 13 business units of the TSC and their related business items after diversification. However, the key question is whether diversification really supports the TSC’s sustainable development. Based on the TSC’s financial and operating data, this study uses GRA to objectively calculate the grey relational degree between the 13 business units after diversification. Then, it constructs a BCG assessment matrix using the grey relational degree and income before tax to position the 13 business units.

Table 1.
Operating status of the Taiwan Sugar Corporation’s (TSC) diversified business units.
Step 1: Data conversion into raw sequence
The TSC’s financial index [28] averages for 2011 to 2017 include operating expense, operating cost, non-operating expense, non-operating revenue, operating revenue, gross profit, non-operating income, and income before tax, as shown in Table 2. A grey relational matrix for evaluating operation performance is constructed using the data in Table 2.
Table 2.
The TSC’s financial averages for 2011–2017 (in NT $100 million).
Step 2: Data normalization
Three indices are related to cost: operating expense, operating cost, and non-operating expense. Five indices are related to effectiveness: non-operating revenue, operating revenue, gross profit, non-operating income, and income before tax. The reference sequences of these eight indices are X0 = (0.4986, 6.2251, 0.2319, −2.5132, 13.4392, −5.6894, −2.4568, −28.6452). Equations (1) and (2) are adopted for normalization. The calculation results are shown in Table 3.
Table 3.
Data normalization.
Step 3: Calculation of the differences among sequences
Equation (4) is adopted to calculate the differences among sequences . The calculation results are shown in Table 4.
Table 4.
Calculation of differences among sequences .
Step 4: Calculation of grey relational coefficients
Equation (5) is adopted to calculate the grey relational coefficients of the 13 business units, as shown in Table 5.
Table 5.
Calculation of grey relational coefficients .
Step 5: Calculation of grey relational degree
Equation (6) is adopted to calculate the grey relational degree of the 13 business units, as shown in Table 6. The 13 business units are ranked in the rightmost column in Table 6.
Table 6.
Grey relational degree of the 13 business units.
Step 6: Finding the optimal business unit(s)
As shown in the rightmost column in Table 5, land development is the best business unit, and property management is the second best.
Step 7: Position mapping of the 13 business units on the BCG matrix
The horizontal axis of the BCG matrix is the relative market share (divided by the market share of the company’s business divided by the highest market share in the industry), and the vertical axis is the market growth rate. The TSC is an SOE and is not suitable for composing a BCG matrix with relative market share and market growth rate. Therefore, this study changes the income before tax of each unit of the TSC to calculate the grey correlation degree as the operating performance in order to compose the BCG matrix.
The horizontal axis represents the grey relational degree, and the vertical axis represents income before tax. The average grey relational degree and the average income before tax of the 13 business units are at the intersection point (0.6722, 22.5497) of the two axes. The 13 business units are grouped into “high” and “low” categories, and the BCG management matrix is drawn to show the four Star, Cow, Question, and Dog quadrants, as shown in Figure 1. Based on the definition of the BCG matrix shown in the figure, the implementation results for the TSC’s diversification strategy are analyzed as follows:
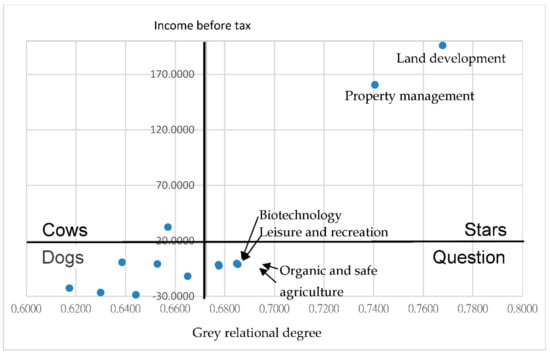
Figure 1.
The Boston Consulting Group (BCG) matrix of profit efficiency.
- Star: Land development and property management are the two TSC business units with relatively high efficiency and profits. In an industrial product life cycle, these two units own large national lands, which translate into nearly zero operating costs. Therefore, these two units can continue following the ongoing or growth strategy to increase their profitability and marketability.
- Cow: General management is the TSC decision-making unit with relatively high efficiency, but low profits. In terms of industrial product life cycle, this unit may possess a wealth of management experience and sophisticated technology, but its management style and resource allocation may not be optimal. Coupled with the applicable legal restrictions, there is not much room left for improved efficiency. Therefore, downsizing and cost-cutting are recommended.
- Question: Leisure and recreation, biotechnology, environmental protection, and organic and safe agriculture are the TSC business units with relatively high profits and low efficiency. In terms of industrial product life cycle, the operational efficiency of these four units is poor. They should devote more attention to improving operational efficiency or pursuing privatization to lower the TSC’s cost burden.
- Dog: Hypermarket, livestock and breeding, marketing, sugar, petroleum, and fine agriculture are the TSC business units with relatively low efficiency and profits, but that have incurred serious losses. The business units in this quadrant rely on the national budget for operational support. However, they are still unable to lower their operating costs to generate a surplus. In terms of industrial product life cycle, these six business units may have been exposed to issues related to their internal or external environment, leading to long-term losses, and thus no longer provide any value to the TSC. A thorough review of these six units is necessary in order to make improvements or pursue privatization to lower the TSC’s cost burden.
5. Conclusions
Diversification that enhances firm performance is an important strategy for business sustainability. However, the TSC is an SOE with a rigid personnel system that is handicapping efforts to use talent efficiently. This problem is coupled with an unsound performance evaluation system for SOEs, low employee morale, and poor work efficiency. The investment plan for diversification was miscalculated because of structural deficiency, resulting in an increased financial burden on the country. Product market predictions were inaccurate, resulting in high product costs and low competitiveness. The analysis of the positioning of the 13 business units revealed that the TSC faces three major issues since the implementation of its diversification strategy:
- The higher the number of business units, the more difficult it is for management to maintain an ongoing understanding of the units. This leads to inefficient resource allocation.
- Bureaucratic costs increase as the number of business units increases, creating restrictions on the diversification strategy. If such restrictions are not resolved while diversification continues, operational costs will increase and performance will decrease. This further burdens the company.
- Entering diversification is as important as exiting it. Business units with unsound operational performance may try to hide their costs, making the units vulnerable to budget overruns. The timely exit from or sale of financially unsound business units is the best strategy for preventing further financial burdens on the country.
Author Contributions
L.-H.H. conceived and designed the study; C.-C.T. performed the experiments; L.-H.H. analyzed the data; and C.-C.T. contributed the BCG analysis tool and wrote the paper.
Funding
This research received no external funding.
Acknowledgments
We thank the Taiwan Sugar Corporation for providing us with case studies.
Conflicts of Interest
The authors declare no conflict of interest.
References
- Uchida, K.; Mitachi, T. The BCG Way: The Art of Focusing on the Central Issue, the BCG Way—The Art of Hypothesis-driven Management. In The BCG Way—The Art of Strategic Insight; Economic News Agency: Taipei, Taiwan, 2014. [Google Scholar]
- Osegowitsch, T.; Madhok, A. Vertical integration is dead, or is it? Bus. Horiz. 2003, 46, 25–34. [Google Scholar] [CrossRef]
- Stigler, G.J. The division of labor is limited by the extent of the market. J. Polit. Econ. 1951, 3, 185–193. [Google Scholar] [CrossRef]
- Harrigan, K.R. Vertical integration and corporate strategy. Acad. Manag. J. 1985, 28, 397–425. [Google Scholar]
- Kotler, P. Marketing Management: Analysis, Planning, and Control; Prentice-Hall: Englewood Cliffs/Upper Saddle River, NJ, USA, 1996; ISBN 0132435101. [Google Scholar]
- Chan, L.Y.; Chang, M.C.; Hsu, C.C. Vertical disintegration and industry agglomeration in Taiwan’s manufacturing sector. Taiwan Econ. Rev. 2004, 32, 483–511. [Google Scholar] [CrossRef]
- Rumelt, R.P. Strategy, Structure, and Economic Performance; Harvard Business School Press: Boston, MA, USA, 1986; ISBN 0875841260. [Google Scholar]
- Dundas, K.N.M.; Richardson, P.R. Implementing the unrelated product strategy. Strateg. Manag. J. 1982, 3, 287–301. [Google Scholar] [CrossRef]
- Leutert, W. The political mobility of China’s central state-owned enterprise leaders. China Q. 2018, 233, 1–21. [Google Scholar] [CrossRef]
- Shawtari, F.A.; Mohamad, M.H.S.; Rashid, H.M.A.; Ayedh, A.M. Board characteristics and real performance in Malaysian state-owned enterprises (SOEs). Int. J. Prod. Perform. Manag. 2017, 66, 1064–1086. [Google Scholar] [CrossRef]
- Sánchez, R.G. Corporate and managerial characteristics as drivers of social responsibility disclosure by state-owned enterprises. Rev. Manag. Sci. 2017, 11, 633–659. [Google Scholar] [CrossRef]
- Tkachenko, A.; Yakovlev, A.; Kuznetsova, A. ‘Sweet deals’: State-owned enterprises, corruption and repeated contracts in public procurement. Econ. Syst. 2017, 41, 52–67. [Google Scholar] [CrossRef]
- Tang, M. Redefining Diversification Strategy, Global Views Monthly. Available online: https://www.gvm.com.tw/article.html?id=8990 (accessed on 1 December 2003).
- Zheng, X.; Liu, Y. Bank size, degree of diversification and operational efficiency analysis: An application of data envelopment analysis. J. Hum. Soc. Sci. 2000, 12, 103–148. [Google Scholar]
- Su, Y. The Diversification Change of Taiwan Business Group. Master’s Thesis, Graduate Institute of International Business, National Cheng Kung University, Tainan, Taiwan, 2002. [Google Scholar]
- Hung, J.H.; Chen, H.J.; Lin, H.C. The impact of corporate governance mechanisms on innovation and diversification strategies as well as on performance: R&D-intensive industry. Sun Yat Sen Manag. Rev. 2007, 15, 37–60. [Google Scholar]
- Chung, H.M.; Yeh, C.H. The role of family linkage and political linkage on diversification decision over time: An empirical study in Taiwan's family business groups. Organ. Manag. 2010, 3, 67–106. [Google Scholar]
- Tai, Y.Y.; Lin, J.Y.; Chen, M.S.; Lin, M.C. A grey decision and prediction model for investment in the core competitiveness of product development. Technol. Forecast. Soc. Chang. 2011, 78, 1254–1267. [Google Scholar] [CrossRef]
- Wang, Q.; Wua, C.; Sun, Y. Evaluating corporate social responsibility of airlines using entropy weight and grey relation analysis. J. Air Transp. Manag. 2015, 42, 55–62. [Google Scholar] [CrossRef]
- Kang, I.; Jee, H.S.; Shin, M.M. Affective policy performance evaluation model: A case of an international trade policy implementation. Sustainability 2018, 10, 232. [Google Scholar] [CrossRef]
- Xue, H.; Zhang, S.; Su, Y.; Wu, Z. Capital cost optimization for prefabrication: A factor analysis evaluation model. Sustainability 2018, 10, 159. [Google Scholar] [CrossRef]
- Chen, L.; Ren, J. Multi-attribute sustainability evaluation of alternative aviation fuels based on fuzzy ANP and fuzzy grey relational analysis. J. Air Transp. Manag. 2018, 68, 176–186. [Google Scholar] [CrossRef]
- Deng, J.L. Introduction to Grey System Theory. J. Grey Syst. 1989, 1, 1–24. [Google Scholar]
- Liu, S.; Forrest, J.; Yang, Y. A brief introduction to grey systems theory. Grey Syst. Theory Appl. 2012, 2, 89–104. [Google Scholar] [CrossRef]
- Deng, J.L. Grey Systems Theory and Applications; Gaoli Press: Taipei, Taiwan, 2000. [Google Scholar]
- Chen, S.-B. The President Attended the Celebration Activities of “Taiwan Sugar Corporation 60th Anniversary Fills the Towns and Cities of Taiwan with Joy”. Available online: https://www.president.gov.tw/NEWS/10391 (accessed on 29 April 2006).
- Taiwan Sugar Corporation. Sugar Business. Available online: https://www.taisugar.com.tw/english/CP2.aspx?n=10957 (accessed on 25 June 2018).
- Goodinfo! Taiwan Stock Market Information Network. 1237 Taiwan Sugar Company Cumulative Quarterly Profit and Loss. Available online: https://goodinfo.tw/StockInfo/StockFinDetail.asp?RPT_CAT=IS_QUAR_ACC&STOCK_ID=1237#top (accessed on 25 June 2018).
© 2018 by the authors. Licensee MDPI, Basel, Switzerland. This article is an open access article distributed under the terms and conditions of the Creative Commons Attribution (CC BY) license (http://creativecommons.org/licenses/by/4.0/).