Article

Millets for Food Security in the Context of Climate Change: A Review

Department of Bioresource Engineering, Faculty of Agricultural & Environmental Sciences, McGill University, 21 111 Lakeshore Rd, Sainte-Anne-de-Bellevue, QC H9X 3V9, Canada
*
Author to whom correspondence should be addressed.
Sustainability 2018, 10(7), 2228; https://doi.org/10.3390/su10072228
Submission received: 8 June 2018 / Revised: 25 June 2018 / Accepted: 26 June 2018 / Published: 28 June 2018
(This article belongs to the Section Sustainable Agriculture)

Abstract

:
A growing population means an ever-increasing demand for food. This global concern has led to antagonism over resources such as water and soil. Climate change can directly influence the quality and availability of these resources, thereby adversely affecting our food systems and crop productivity, especially of major cereals such as rice, wheat and maize. In this review, we have looked at the availability of resources such as water and soil based on several modeling scenarios in different regions of the world. Most of these models predict that there will be a reduction in production rates of various cereal crops. Furthermore, all the major cereal crops are known to have a higher contribution to global warming than alternative crops such as millets which should be considered in mitigating global food insecurity. In this study, we have used the data to predict which regions of the world are most adversely affected by climate change and how the cultivation of millets and other crops could aid in the reduction of stress on environmental resources.

1. Introduction

Tackling hunger and feeding the world population are two of the biggest challenges of the modern world. Reasons contributing to this issue range from deficiencies in the supply of micro- and macronutrients, shortage in production of foods leading to supply–demand imbalances, and conflicts destabilizing various parts of the world. Although several of these triggers for hunger can be addressed leading to a slight reduction in the population suffering from hunger and malnutrition from almost one billion in 1990–1992 to 850 million in 2010–2012, the threat of climate change and global warming still lingers [1]. Estimates show that the reduction in food production rates along with the added pressure of feeding a population exceeding 9 billion by 2050 could lead to 2–3 billion people suffering from hunger, food and nutritional insecurities [2,3].
Climate change and increasing global average temperatures are reported to have a direct impact on crop yields, crop productivity and overall sustainability of our food systems. Although some estimates show that a few regions could benefit from climate change due to increased productivity and yields, this will not be sufficient to feed the higher number of inhabitants globally [4]. Furthermore, most of the scientific community agrees that the current rates of global warming and emissions of greenhouse gas would significantly reduce the overall crop productivity. Thus, reducing the greenhouse gas emissions to control global temperatures plays a crucial role in achieving food security. However, the agricultural sector is one of the primary contributors to greenhouse gases such as methane into the atmosphere. Higher emissions are generally caused by intensive agricultural practices which are being followed in different locations around the world [5,6].
Over the course of the last few decades, various researchers have used different models to predict the outlook of soil conditions and water resources around the world, 50–100 years from now, which have been summarized and presented. Although there have been previous attempts to review the modeling data, they are generally limited to a specific region or a limited aspect of climate change. However, in this paper, the modeling data are presented in three broad categories: soil conditions, water resources and agricultural productivity. The criteria for selecting a study for this review are mentioned below in a dedicated section. Combining the information from these studies from select regions around the world could provide us with an insight on how to tackle the issue of climate change. Furthermore, millet has been discussed as an alternative cereal due to its inherent ability to grow in adverse conditions which include low-quality soils and lack of irrigation facilities.

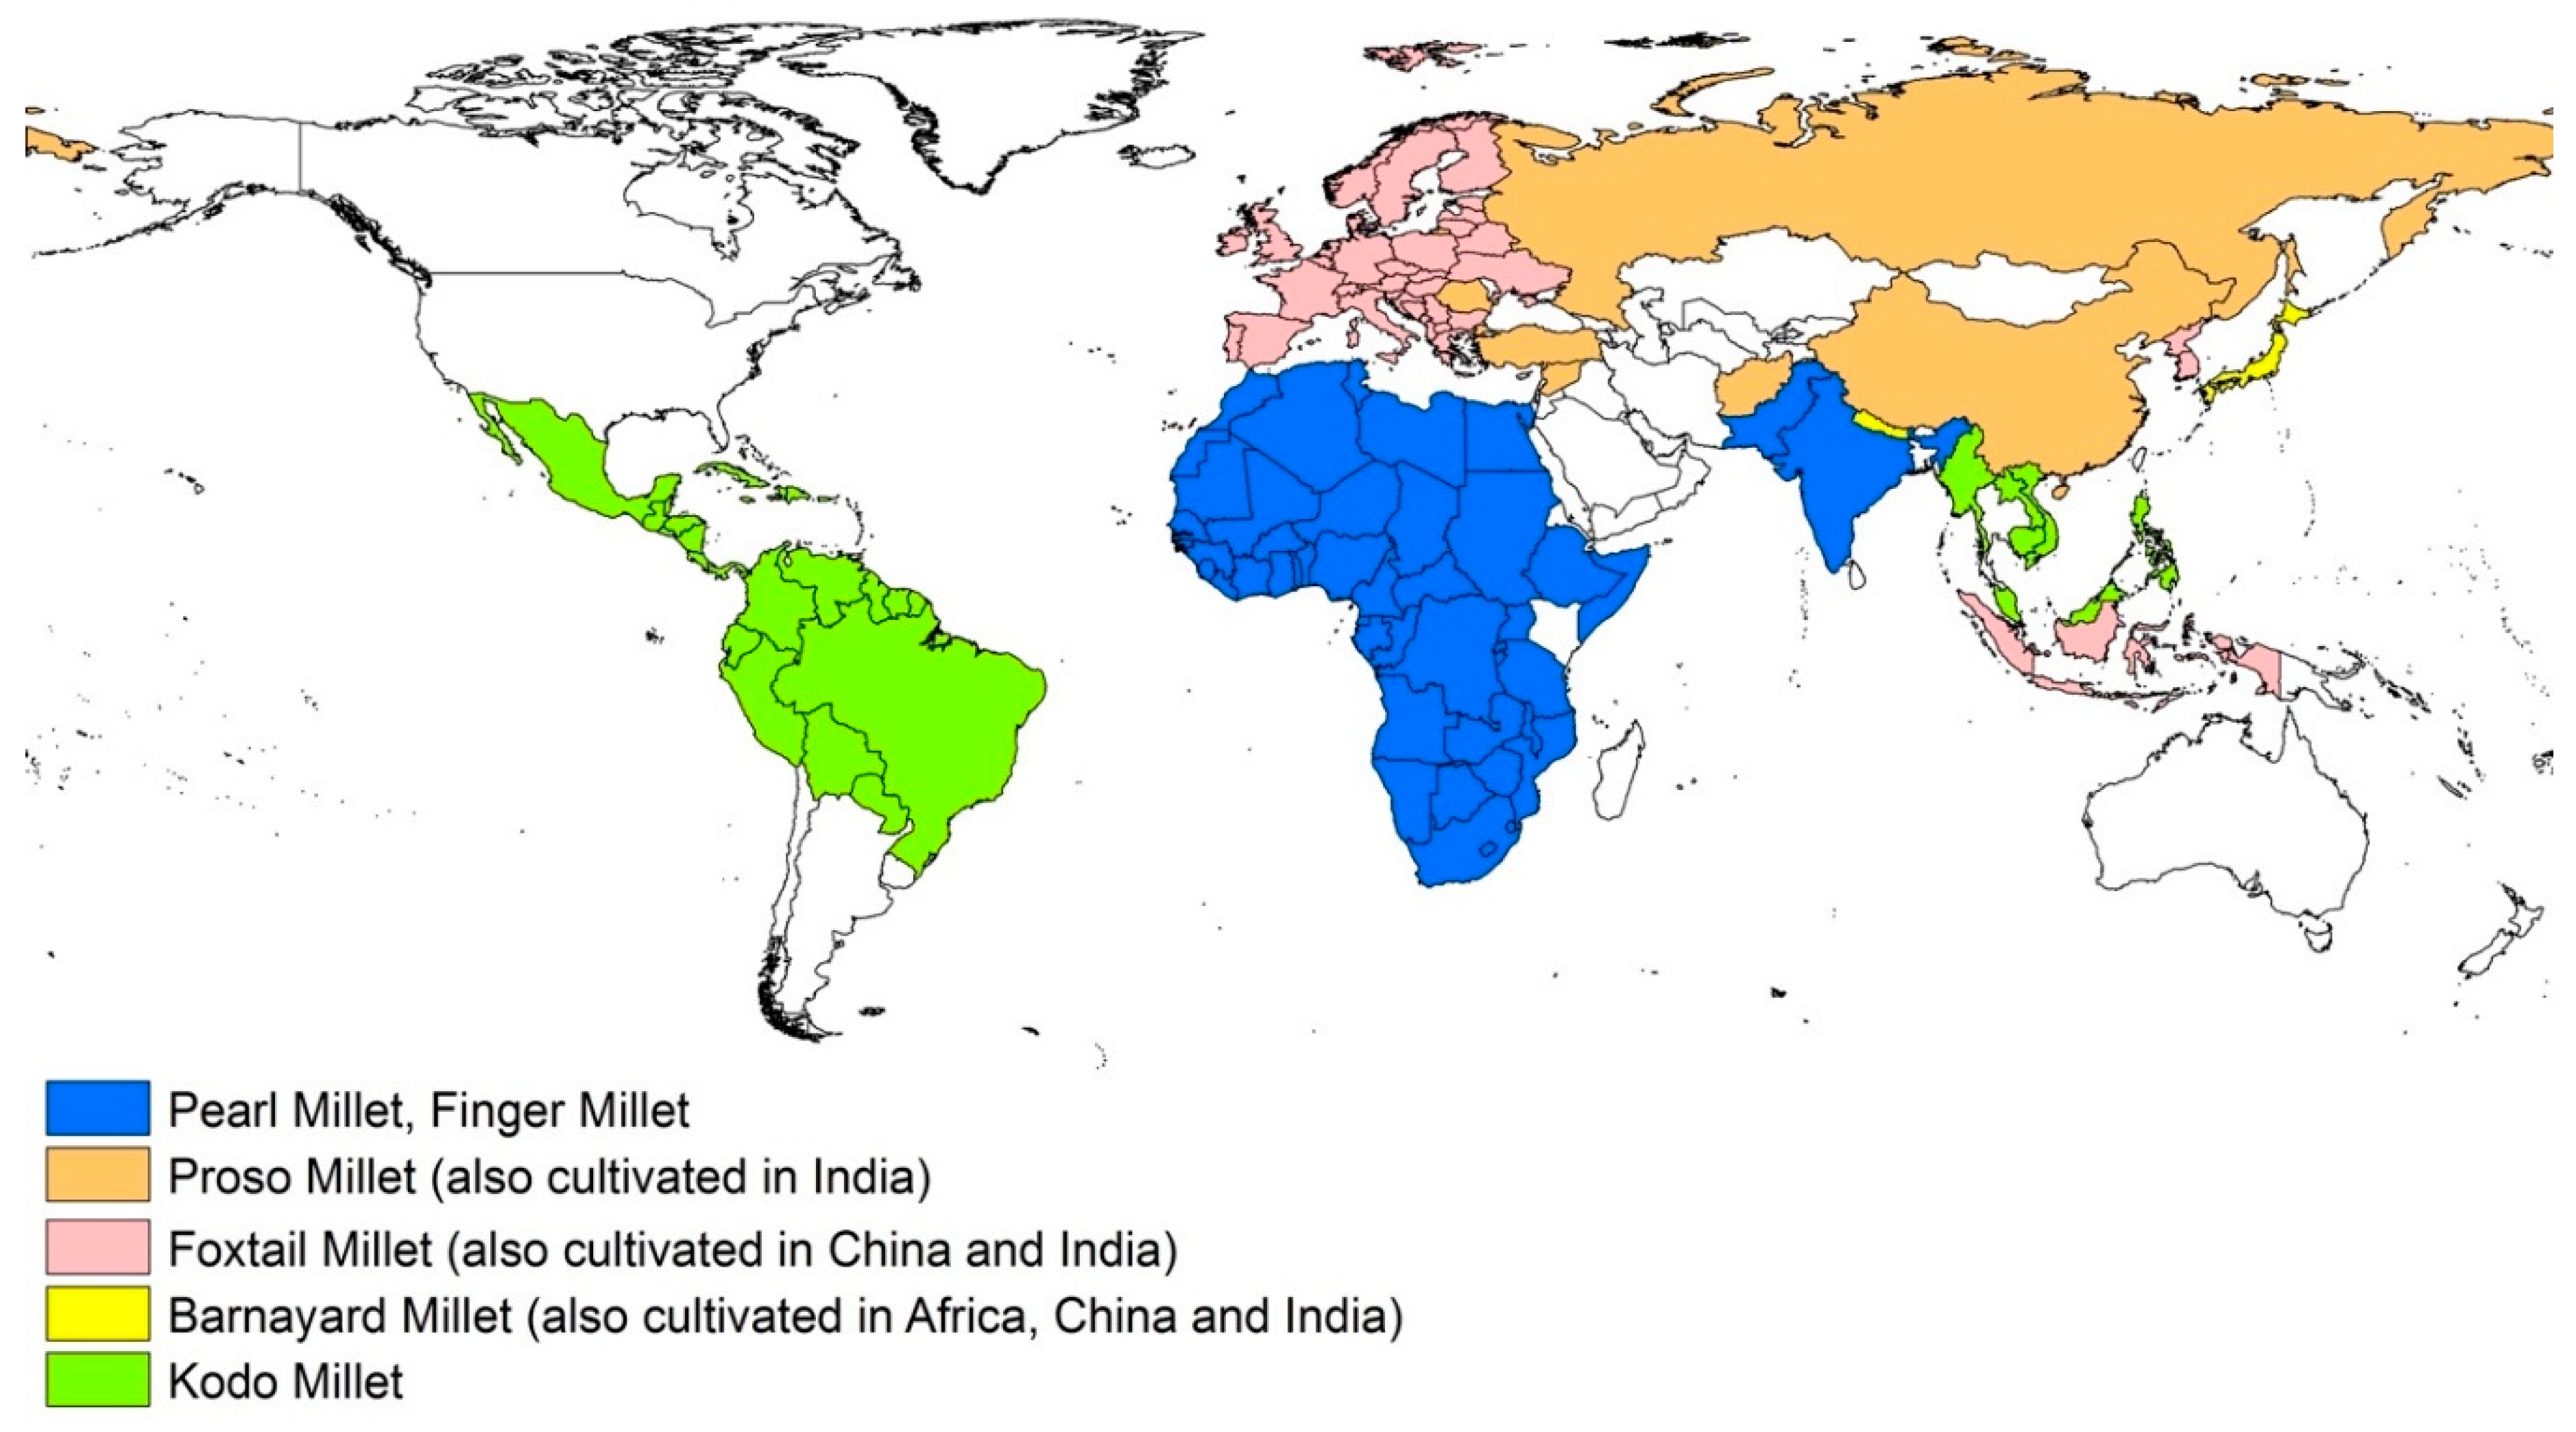
2. Millets Cultivation

Cereal crops are not only a major source of macronutrients such as carbohydrates, fats and proteins but also have a significant global warming potential. Among all the major cereal crops, wheat has the highest global warming potential of around 4 tons CO2 eq/ha followed by rice and maize (around 3.4 tons CO2 eq/ha). These crops also have a high carbon equivalent emission of 1000, 956 and 935 kg C/ha for wheat, rice and maize, respectively [7]. Despite their higher emission rates, they are widely cultivated and are primary sources of nutrition for the global population. However, the carbon footprints of other minor cereal crops such as millets and sorghum are comparatively lower. This is one of the primary reasons millets can be one of the crops that could reduce carbon footprint in the world [8]. According to the FAO (2014), the most cultivated varieties of millet are Pearl, Proso, Foxtail, Japanese Barnyard, Finger and Kodo and are cultivated across the globe (Figure 1). Different types of millets have different scientific names as well as common name based on the region in which they are cultivated, and these millets are cultivated in different regions of the world and require different growing conditions (Table 1). Rice, wheat, maize and to a lesser extent millet are consumed daily as primary sources of nutrition by billions of people around the globe. Temperature and water availability dictate the growth pattern of these crops. Rice and maize are grown in areas with ample supply of water, whereas cultivation of wheat is done largely in areas with limited water resources and appropriate temperatures. Sorghum and millets are grown in areas where water resources are scarce. Furthermore, millets can be cultivated in semi-arid and arid regions because of their tolerance to biotic and abiotic stresses and their substantial yield in low-quality lands with minimal input [8,9].
Millets are generally thermophilic (thriving at relatively higher temperatures) and xerophilic (can reproduce with limited water input). A wide variety of millets are found in different regions of the world that require different soil types for their normal growth (Table 1). Pearl millet can grow on poor sandy soils and is well suited for dry climates due to its ability to use moisture efficiently compared to sorghum or maize. Pearl millets are thus generally grown in areas having marginal soil with low annual rainfall in the range of 200–500 mm [10]. According to the FAO (2014), pearl millet is the sixth most important cereal grown worldwide. Pearl millet is a traditional crop in Central, Eastern and Southern Africa; in Western Africa, particularly in the Sahel; in India and Pakistan; and along the southern coast of the Arabian peninsula [11]. It is considered to be an important crop to ensure food security in regions of Africa and India [12].
Finger millet, also known as Eleusine coracana L., is grown in parts of India and Africa. Taking production statistics into account, it secures the sixth position in India among major cereal grains following wheat, rice, maize, sorghum and bajra [13]. It can thrive at higher temperatures and in soils with higher salinity compared to other cereal crops. Optimum conditions for growing finger millet are temperatures ranging from 11 to 27 °C, soil pH of 5 to 8.2, and medium rainfall [14].
Proso millet is cultivated in China, India and Russia. It is believed that Proso millet originated in Central and Eastern Asia, and later spread to India, Russia, the Middle East and Europe [15,16]. It is a vital crop in Central and Southern India, Afghanistan, Kazakhstan, Northwest China, Australia, Eastern Europe, Russia, USA and the Middle East including Iran, Iraq, Syria, and Turkey [17]. Proso millet is a short-seasoned crop usually cultivated for 60–75 days, requires an average annual rainfall of less than 600 mm and an average temperature of 17 °C during daytime is considered optimum [18].
Seeds of foxtail millets have been found in various sites in Europe, the Middle East, and Eastern and Central Asia dated to the Neolithic and Bronze ages. Today, this millet is widely cultivated in Europe, China, India, Indonesia, the Korean peninsula, and the former U.S.S.R. Foxtail millet has a fast ripening mechanism and a high photosynthetic efficiency; hence, it is perfectly suited to be used as a catch crop [19]. Moreover, it is rich in nutrition and has good resistance to pests and diseases [20]. This crop has a good yield with only single pre-sowing precipitation [21]. Furthermore, Zhang, et al. [22] suggested that foxtail millet is more water efficient compared to maize and sorghum.
Echniochloa utilis and E. frumentacea are two cultivated species of barnyard millet [23]. Echniochloa utilis is also called Japanese barnyard millet, whereas E. frumentacea has several names such as Indian barnyard millet, sawa millet, and billion-dollar grass. This type of millet is considered a minor cereal and is grown widely in India, China, Japan, Pakistan, Africa, and Nepal [24]. Barnyard millet ranks second in terms of production (87,000 tons per annum) and productivity (857 kg/ha) after finger millet in India [25]. It is a drought-tolerant crop with a rapid maturation rate and possesses high nutritional qualities [26].
Kodo millet originated in India. It is assumed that domestication of this millet took place about 3000 years ago [27,28]. Kodo millet is well suited for tropical and sub-tropical regions [28,29]. Kodo millet is said to possess the highest drought resistance among all minor millets and believed to give good yield with a growing period lasting 80–135 days [30].

3. Methodology Adopted

It can be observed that most of the millets are grown in parts of South America, Europe, Africa, South Asia, Southeast Asia and China (Figure 1). It indicates that these are the regions with suitable climatic conditions to grow millets. This is used as the first criteria for selecting these specific regions in this study. It can be understood that there has been an increase in harvested area for millet in Africa, whereas China, South America, Southern Asia and Europe have shown a downfall in the cultivated area for millet (Figure 2). However, the cultivated area is almost constant for South Asia for the duration of 1961–2016. A higher millet yield (hg/ha) for China, South America, South Asia, Southeastern Asia and Europe can be observed whereas Africa showed almost a constant yield throughout the period (Figure 3). Hence, it can be inferred that though the area under millet cultivation is decreasing in Europe and China, the yield is increasing which suggests a possibility that a consumption demand still exists in these regions. The second criteria were to limit the studies selected to 2012–2018 which can provide updated information. The third criteria for consideration were that each study selected must cover a large geographical area in the selected regions.

4. Predicted Climate Changes and Crop Productivity

4.1. Change in Soil Condition

Soil security can be defined as maintaining and improving the world’s soil resources to provide food, fiber and freshwater [31]. It has been estimated that 97% of our food comes from the soil and 98% of terrestrial biodiversity exists within the soil. Today, the quality of the world’s soil is decaying gradually, and little is being done to address this issue. An initiative by the United Nations Convention to Combat Desertification (UNCCD) garnered attention as it addresses the issues which can help tackle biodiversity loss and climate change [32].
The current human population of 7.4 billion is estimated to increase to 9.1 billion people by 2050 [3]. Hence, to satisfy the demand of the increasing population of nutritious food, the production rates of food, feed, and fiber must rise drastically. The estimated production rates required to feed a population of 9.1 billion were found to be higher than what they were in the last 5000 years combined [33]. Despite these demands on the ecosystem, an estimated 20-million-acres of arable land in the USA have been lost to development, and the country lost at least one-half of its topsoil (rich in organic matter) over the last two decades [34]. Stott and Moebius-Clune [33] reported that there would be a further decline in ecosystem services resulting in a considerable impact on physical and biological functions in field soils. Over the last two centuries, the organic matter of the soil (containing 58% of carbon) has been degraded by microbes. During plowing, the soil structure which protects the organic carbon of the soil from microbial attack and erosion is broken apart. Moreover, almost 66% of the topsoil (A horizon) has been lost which also contributes to the previously mentioned conditions.
Soil erosion is one of the primary cause for the loss of soil quality around the world [35,36,37]. Factors contributing to soil erosion are soil structure, the role of vegetative cover, land topography and soil disturbances. The soil is eroded gradually but its cumulative impact on soil quality over the years is considerable [38]. The erosion rates vary widely from 0.001 t/ha/year on flat land having grass or forest cover to 1–5 t/ha/year in mountainous regions having natural vegetation [39]. It is important to note that, even though the rates of soil erosion are low, they recur over many years and, hence, erosion has an enormous potential to shift a considerable amount of soil [40]. It is estimated that world agricultural systems are losing approximately 75 billion tons of fertile soils every year [41,42]. The data for the world’s arable land for land quality classes I–VI show that almost 67 billion tons of soil are eroded by water every year [38,43].
Prediction of soil erosion rates in future are made with the help of soil erosion models. Although it is possible to analyze few catchments and farms to evaluate the current soil erosion rates and project the best management practices, it is nearly impossible to execute such a large-scale study in each specific location to propose future soil erosion rates. Hence, to resolve this problem, soil erosion models are used provided they are robust and used in the right manner [44]. There are multiple models used for erosion modeling such as The European Soil Erosion Model (EUROSEM) [45], Griffith University Erosion System Template (GUEST) [46], The LImburg Soil Erosion Model (LISEM) [47], Revised Universal Soil Loss Equation (RUSLE) [48], Système Hydrologique Européen TRANsport (SHETRAN) [49] and so on. The various scenarios predicted are summarized in Table 2.

4.2. Depletion of Water Resources

Most of the studies conducted on the future of the world’s water resources are concentrated on “blue water” found in lakes, reservoirs, rivers and aquifers [72,73,74,75]. To assess the actual water resources available for the population, it is important to consider “green water” [76]. Green water is defined as rainwater that infiltrates the soil [77] and is responsible for the sustainable growth of all terrestrial ecosystems and is used in the majority of agricultural activities [78,79]. It was also assumed by Rockström et al. [80] that countries having less than 1300 cubic meters per capita per year of total green and blue waters would not be able to produce a balanced diet of 3000 kCal per capita per day. This value was also endorsed by the FAO (Food and Agricultural Organization) as the goal that all developing countries are supposed to reach by 2030 [81].
Almost 2 billion people across the world do not have access to water and henceforth food production, economic development, human health and ecosystem services are hampered. Water scarcity can cause groundwater depletion which might lead to irreversible land subsidence, urban water shutoffs, wildfires and crop failure. Factors such as an increase in population and climate change contribute to water scarcity [82]. MacDonald [83] suggests that climate models projected an increase in the number of droughts in the 21st century in South Western United States which will be more arid, severe and remain for longer periods of time. The increase in population demands more food but the food production would remain the same. This will lead to food insecurity in the future [84].
A hydrological model is defined as a system or a prototype which represents the whole world in a simplified form. These models are used to analyze system behavior and to understand the hydrological processes. The parameters involved define the characteristics of the model. Rainfall data and area of drainage are the two necessary inputs needed for all models. The other important factors considered for modeling are groundwater aquifer characteristics, the topography of the watershed, soil moisture content, and watershed characteristics such as vegetation cover and soil properties. Hydrological models are thus considered as a vital tool to manage water, and environmental resources [85,86] and the summarized predictions of water scenario are presented in Table 3.

4.3. Effect of Climate Change on Agricultural Productivity

Food consumption represented by kcal/person/day acts as a criterion to analyze the status of the food situation around the world. The food consumption has increased from 2360 kcal/ person/day in 1960 to 2800 kcal/person/day currently. To date, seven developing countries around the world have a population of more than 100 million. Among them, Bangladesh is the only country which remains to have a low food consumption rate. Other countries on the list such as Brazil, China and Indonesia have consumption rates in the range of 2900–3000 kcal, whereas India, Nigeria and Pakistan have also made a good transition to improve their consumption rates. Moreover, almost 30 developing countries around the world have food consumption rates of less than 2200 kcal/person/day [114]. According to FAO (2015), in recent years, one fourth of the disasters occurring from climate changes have affected the agricultural sector badly in these developing countries. The predicted changes in the agricultural productivity are summarized in Table 4.
Lesk et al. [115] reported that, during recent years, the production of cereal crops has been affected by 9–10% due to adverse climatic conditions such as drastic increase in temperature, drought and so on. The South Asia and Sub-Saharan Africa regions will be accommodating additional 2.4 billion people by the end of 2050. Majority of the population living in these areas depends on the agricultural sector for their survival and livelihood. Right now, more than 20% of the population living in these regions barely have enough food to meet their demands and the situation will be even worse in coming years. It is recommended that agricultural production should be increased by 60% by 2050 to meet the food demand of the increasing population. Hence, the focus should be on improving agricultural productivity which in turn will increase income in developing countries [116].

5. Outlook

From the analysis presented in the previous sections, it is evident that not only developing countries but also developed countries will also have to cope with changing climatic conditions. There are a handful of options that can reduce the stress in India, China, and Sub-Saharan Africa which are most affected by climate change. First, they can import food commodities from countries with enough water resources and fertile lands that are producing surpluses. However, this may cause a trade imbalance and negatively affect the GDP and economy of the country. Furthermore, the exporting countries will have to increase crop yields thereby causing additional stress on resources available leading to accelerated depletion. Looking at some predictions, climate change could cause an increase in yields in a few countries; however, this would not be substantial enough to ensure global food security. Countries such as India and China, where a significant proportion of the population relies on agriculture for their livelihood, the loss of income would cause further poverty which would affect the GDP.
The second option is to change the policy of the governments in how they manage the resources that are currently available. Support for water-intensive crops such as rice should be phased out, and the cultivation of alternatives that require less resource should be encouraged. The transition may be gradual as the population slowly changes its diet with proper inputs from the markets as governments push for consumer education and the establishment of a commitment to conservation of resources for future generations. As the population comes to understand that continuing the current agricultural practices, dietary habits, and lifestyles will threaten the survival of the coming generations in many aspects, this will help to encourage change as a viable alternative.
The question arises: What can be done to mitigate such adverse effects? There are many answers to this crucial question. It can be observed that production of major crops such as maize, wheat and rice is increasing around the world (with few exceptions), whereas other crops such as barley, millet, rye and sorghum show increasing or decreasing trends depending on the region (Figure 4). This Figure clearly shows that millets or other low-resource intensive crops can be grown in almost every part of the world. Millet is a drought-resistant crop, requires less water for its growth and possesses high nutritional value compared to other cereal crops such as rice and wheat [9,20]. It is difficult for the present population to adopt millets as a food in their diet but if proper initiatives are taken by governments through workable policies considering the seriousness of the situation, it can emerge as a crop having enormous potential to feed the growing population. Millets can be grown in adverse conditions and thus will be able to save farmers and the agri-food industry from losses. It is not a water-intensive crop, and hence a lack of irrigation infrastructure in poor economies of Asia and Africa is not a hurdle to adopt cultivation of this crop. It can be grown in the drier soil. Thus, tillage practices can be avoided reducing the duration of cultivation [10,18].
Millet has an excellent nutritional profile and is a non-glutinous food. This makes them easily digestible and non-allergenic foods. Polished rice produces a high percentage of glucose which is not beneficial for diabetic patients, whereas millet as a food commodity releases low volume of glucose, thus making it safer for consumption by diabetic patients. Millets are rich in phosphorous, potassium, iron, and magnesium. Finger millet has a calcium content that is ten times higher than in rice or wheat [139]. India is the larger producer of millet globally [140]. Small millets such as finger millet and Kodo millet can be grown in adverse climatic and soil conditions. Varieties of millets with short growing duration can be incorporated in multiple cropping systems under irrigated and dry farming conditions [14,30]. Moreover, millets can be stored for a considerable amount of time under appropriate storage conditions, therefore making them “famine reserves” [141].
In India, 15.48 million hectares is dedicated to the production of millet with a crop yield of 1111 kg/ha, producing around 17.2 million tons of millet. The contributions of this crop to overall food grain production has reduced significantly from 22.17% to 6.94% between 1950–1951 and 2011–2012 [141,142]. Malathi, Appaji, Reddy, Dattatri and Sudhakar [142] studied the growth pattern of millets in India. The study concluded that there had been a significant decline in the area allotted for the cultivation of millets over the last few decades. The primary reason for this decline could be the government policies favoring production of major cereals such as rice and wheat, and of crops such as oilseeds, cotton, fruits and vegetables. However, despite these issues, the area-wise production of finger millets rose by 47.41% with crop yields increasing by 147.49%, whereas productivity of pearl millet increased by 247.48% with an increase in crop yield of 255.61%. Thes data suggest that, even though the area under production of millets has been significantly reduced, crop yield has been increasing.
From the outlook of this review, the regions that will face adverse effects in terms of soil degradation, water scarcity and climate change are India; China; Western, Middle and Southern Africa; parts of South America; and USA. These countries will face situations that will seriously threaten crop production and food security and may not be able to cope with such adverse effects. Widespread hunger and poverty may result due to the inability of farmers to grow crops because of water shortage which will affect the countries’ economy. If proper initiatives are taken at an early stage, these adverse effects can be mitigated and. perhaps, a healthy atmosphere could be created where there will be food security so that the coming generation will feel more safe and secure. There is no doubt that a rapid shift in the cropping pattern and eating habits incorporating millets in today’s population is vital. This would allow a projected population of 9.1 billion by 2050 to lead a healthy lifestyle, in a world having enough water resources for its subsistence.

Author Contributions

The paper was conceptualized by S.K.V., V.O. and V.R. The methodology, formal analysis and the investigation were carried out by R.S., S.K.V. and J.W. The data curation and analysis were carried out by R.S. and S.K.V. The original draft was prepared by R.S., S.K.V. and J.W. The draft prepared was reviewed and edited by V.R. and V.O. Project administration and the funding for the project were secured by V.R. and V.O.

Funding

The authors would like to thank International Development Research Centre (IDRC), Global Affairs Canada (GAC), and Natural Sciences and Engineering Research Council (NSERC) for funding the study.

Acknowledgments

We would like to acknowledge Darwin Lyew, McGill University and Ashutosh Sharma, IIT Guwahati for their help and support in completing the manuscript.

Conflicts of Interest

The authors do not have any conflict of interests to report.

References

  1. Food and Agriculture Organization of the United Nations. Technical Note: FAO Methodology to Estimate the Prevalence of Undernourishment; FAO: Rome, Italy, 2012. [Google Scholar]
  2. Wheeler, T.; Von Braun, J. Climate change impacts on global food security. Science 2013, 341, 508–513. [Google Scholar] [CrossRef] [PubMed]
  3. Godfray, H.C.J.; Beddington, J.R.; Crute, I.R.; Haddad, L.; Lawrence, D.; Muir, J.F.; Pretty, J.; Robinson, S.; Thomas, S.M.; Toulmin, C. Food security: The challenge of feeding 9 billion people. Science 2010, 327, 812–818. [Google Scholar] [CrossRef] [PubMed]
  4. Kang, Y.; Khan, S.; Ma, X. Climate change impacts on crop yield, crop water productivity and food security—A review. Prog. Nat. Sci. 2009, 19, 1665–1674. [Google Scholar] [CrossRef]
  5. Downing, T.E.; Barrow, E.M.; Brooks, R.J.; Butterfield, R.E.; Carter, T.R.; Harrison, P.A.; Hulme, M.; Olesen, J.E.; Porter, J.R.; Schellberg, J.; et al. Quantification of uncertainty in climate change impact assessment. In Climate Change, Climatic Variability and Agriculture in Europe; Environmental Change Institite: Oxford, UK, 2000; pp. 415–434. [Google Scholar]
  6. Olesen, J.E.; Bindi, M. Consequences of climate change for European agricultural productivity, land use and policy. Eur. J. Agron. 2002, 16, 239–262. [Google Scholar] [CrossRef]
  7. Jain, N.; Arora, P.; Tomer, R.; Mishra, S.V.; Bhatia, A.; Pathak, H.; Chakraborty, D.; Kumar, V.; Dubey, D.; Harit, R.; et al. Greenhouse gases emission from soils under major crops in northwest India. Sci. Total Environ. 2016, 542, 551–561. [Google Scholar] [CrossRef] [PubMed]
  8. Prasad, P.V.; Staggenborg, S.A. Growth and production of sorghum and millets. In Soils, Plant Growth and Crop Production; EOLSS Publishers Co., Ltd.: Oxford, UK, 2009; Volume 2. [Google Scholar]
  9. Awika, J.M. Major cereal grains production and use around the world. In Advances in Cereal Science: Implications to Food Processing and Health Promotion; ACS Publications: Washington, DC, USA, 2011; pp. 1–13. [Google Scholar]
  10. Guigaz, M. Memento Del’agronome; CIRAD-GRETand Ministère desAffairesÉtrangères: Montpellier, France, 2002. [Google Scholar]
  11. International Crops Research Institute for the Semi-Arid Tropics; Food and Agriculture Organization of the United Nations. The World Sorghum and Millet Economies: Facts, Trends, and Outlook; International Crops Research Institute for the Semi-Arid Tropics; Food and Agriculture Organization of the United Nations: Patancheru, India; Rome, Italy, 1996. [Google Scholar]
  12. Passot, S.; Gnacko, F.; Moukouanga, D.; Lucas, M.; Guyomarc’h, S.; Ortega, B.M.; Atkinson, J.A.; Belko, M.N.; Bennett, M.J.; Gantet, P.; et al. Characterization of pearl millet root architecture and anatomy reveals three types of lateral roots. Front. Plant Sci. 2016, 7, 829. [Google Scholar] [CrossRef] [PubMed] [Green Version]
  13. Devi, P.B.; Vijayabharathi, R.; Sathyabama, S.; Malleshi, N.G.; Priyadarisini, V.B. Health benefits of finger millet (Eleusine coracana L.) polyphenols and dietary fiber: A review. J. Food Sci. Technol. 2014, 51, 1021–1040. [Google Scholar] [CrossRef] [PubMed]
  14. Upadhyaya, H.; Reddy, V.G.; Sastry, D. Regeneration Guidelines Finger Millet; CGIAR System-Wide Genetic Resource Programme: Rome, Italy, 2008. [Google Scholar]
  15. Roshevits, R.Y. Grasses: An Introduction to the Study of Fodder and Cereal Grasses; NTIS: Alexandria, VA, USA, 1980. [Google Scholar]
  16. Baltensperger, D.D. Foxtail and proso millet. In Progress in New Crops; Janick, J., Ed.; ASHS Press: Alexandria, VA, USA, 1996; pp. 182–190. [Google Scholar]
  17. Zarnkow, M.; Mauch, A.; Burberg, F.; Back, W.; Arendt, E.K.; Kreisz, S.; Gastl, M. Proso millet (Panicum miliaceum L.) a sustainable raw material for the malting and brewing process: A review. Brew. Sci. 2009, 62, 119–140. [Google Scholar]
  18. Zarnkow, M.; Keßler, M.; Back, W.; Arendt, E.K.; Gastl, M. Optimisation of the mashing procedure for 100% malted proso millet (Panicum miliaceum L.) as a raw material for gluten-free beverages and beers. J. Inst. Brew. 2010, 116, 141–150. [Google Scholar] [CrossRef]
  19. Léder, I. Sorghum and millets. Cultiv. Plants Primarily Food Sources 2004, 1, 66–84. [Google Scholar]
  20. Vetriventhan, M.; Upadhyaya, H.; Anandakumar, C.; Senthilvel, S.; Parzies, H.; Bharathi, A.; Varshney, R.; Gowda, C. Assessing genetic diversity, allelic richness and genetic relationship among races in icrisat foxtail millet core collection. Plant Genet. Resour. 2012, 10, 214–223. [Google Scholar] [CrossRef]
  21. Dwivedi, S.U.H.; Senthilvel, S.; Hash, C.T.; Fukunaga, K.; Diao, X.; Santra, D.B.D.; Prasad, M. Genetic and genomic resources. Plant Breed. Rev. 2012, 35, 246–375. [Google Scholar]
  22. Zhang, J.-P.; Liu, T.-S.; Zhang, J.-P.; Liu, T.-S.; Zheng, J.; Zhang, J.-P.; Liu, T.-S.; Zheng, J.; Jin, Z. Cloning and characterization of a putative 12-oxophytodienoic acid reductase cdna induced by osmotic stress in roots of foxtail millet: Full length research paper. DNA Seq. 2007, 18, 138–144. [Google Scholar] [CrossRef] [PubMed]
  23. Yabuno, T. Japanese barnyard millet (Echinochloa Utilis, Poaceae) in Japan. Econ. Bot. 1987, 41, 484–493. [Google Scholar] [CrossRef]
  24. Gomashe, S.S. Barnyard millet: Present Status and Futurethrust Areas. In Millets and Sorghum: Biology and Genetic Improvement; John Wiley & Sons: Hoboken, NJ, USA, 2016; pp. 184–198. [Google Scholar]
  25. Padulosi, S.; Mal, B.; Bala Ravi, S.; Gowda, J.; Gowda, K.; Shanthakumar, G.; Yenagi, N.; Dutta, M. Food security and climate change: Role of plant genetic resources of minor millets. Indian J. Plant Genet. Resour. 2009, 22, 1. [Google Scholar]
  26. Wallace, J.G.; Upadhyaya, H.D.; Vetriventhan, M.; Buckler, E.S.; Tom Hash, C.; Ramu, P. The genetic makeup of a global barnyard millet germplasm collection. Plant Genome 2015, 8. [Google Scholar] [CrossRef]
  27. House, L.R.; Osmanzai, M.; Gomez, M.I.; Monyo, E.S.; Gupta, S.C. Agronomic Principles. In Sorghum and Millets: Chemistry and Technology; American Association for Cereal Chemist: St. Paul, MN, USA, 1995; pp. 27–67. [Google Scholar]
  28. Arendt, E.; Dal Bello, F. Gluten-Free Cereal Products and Beverages; Academic Press: Cambridge, MA, USA, 2011. [Google Scholar]
  29. Hulse, J.H.; Laing, E.M.; Pearson, O.E. Sorghum and the Millets: Their Composition and Nutritive Value; Academic Press: Cambridge, MA, USA, 1980. [Google Scholar]
  30. Ravi, S.B. Neglected millets that save the poor from starvation. LEISA India 2004, 6, 1–8. [Google Scholar]
  31. Koch, A.; McBratney, A.; Adams, M.; Field, D.; Hill, R.; Crawford, J.; Minasny, B.; Lal, R.; Abbott, L.; O′Donnell, A. Soil security: Solving the global soil crisis. Glob. Policy 2013, 4, 434–441. [Google Scholar] [CrossRef]
  32. McBratney, A.B.; Field, D.J.; Morgan, C.L.; Jarrett, L.E. Soil security: A rationale. In Global Soil Security; Springer: Berlin, Germany, 2017; pp. 3–14. [Google Scholar]
  33. Stott, D.E.; Moebius-Clune, B.N. Soil health: Challenges and opportunities. In Global Soil Security; Springer: Berlin, Germany, 2017; pp. 109–121. [Google Scholar]
  34. U.S. Department of Agriculture, NRCS. Soil Health: Unlock the Secrets of the Soil; U.S. Department of Agriculture, NRCS: Washington, DC, USA, 2012.
  35. Lal, R. Soil degradation by erosion. Land Degrad. Dev. 2001, 12, 519–539. [Google Scholar] [CrossRef]
  36. Pimentel, D.; Harvey, C.; Resosudarmo, P.; Sinclair, K.; Kurz, D.; McNair, M.; Crist, S.; Shpritz, L.; Fitton, L.; Saffouri, R. Environmental and economic costs of soil erosion and conservation benefits. Science 1995, 267, 1117–1122. [Google Scholar] [CrossRef] [PubMed]
  37. Troeh, F.R.; Hobbs, J.A.; Donahue, R.L. Soil and water conservation for productivity and environmental protection. Soil Sci. 1981, 132, 189. [Google Scholar] [CrossRef]
  38. Pimentel, D.; Burgess, M. Soil erosion threatens food production. Agriculture 2013, 3, 443–463. [Google Scholar] [CrossRef]
  39. Patric, J.H. Soil erosion in the eastern forest. J. For. 1976, 74, 671–677. [Google Scholar]
  40. DeVere Burton, L. Agricscience: Fundamentals and Applications; Delmar Cengage Learning: Clifton Park, NY, USA, 2010. [Google Scholar]
  41. Myers, N.; Nath, U.R.; Westlake, M.; Pearson, J. Gaia: An Atlas of Planet Management; Anchor Books: New York, NY, USA, 1984. [Google Scholar]
  42. Eswaran, H.; Lal, R.; Reich, P. Land Degradation: An Overview. Responses to Land Degradation; Oxford Press: New Delhi, India, 2001; pp. 20–35. [Google Scholar]
  43. Reich, P.; Eswaran, H.; Beinroth, F. Global Dimensions of Vulnerability to Wind and Water Erosion, Sustaining the Global Farm. In Proceedings of the 10th International Soil Conservation Organization Meeting, West Lafayette, Indiana, 24–29 May 1999; pp. 838–846. [Google Scholar]
  44. Morgan, R.P.C.; Nearing, M. Handbook of Erosion Modelling; John Wiley & Sons: Hoboken, NJ, USA, 2016. [Google Scholar]
  45. Morgan, R.; Quinton, J.; Smith, R.; Govers, G.; Poesen, J.; Auerswald, K.; Chisci, G.; Torri, D.; Styczen, M. The European soil erosion model (EUROSEM): A dynamic approach for predicting sediment transport from fields and small catchments. Earth Surf. Process. Landf. 1998, 23, 527–544. [Google Scholar] [CrossRef]
  46. Misra, R.; Rose, C. Application and sensitivity analysis of process-based erosion model guest. Eur. J. Soil Sci. 1996, 47, 593–604. [Google Scholar] [CrossRef]
  47. Jetten, V.G.; de Roo, A.P. Spatial analysis of erosion conservation measures with lisem. In Landscape Erosion and Evolution Modeling; Springer: Berlin, Germany, 2001; pp. 429–445. [Google Scholar]
  48. Renard, K.G. Predicting Soil Erosion by Water: A guide to Conservation Planning with the Revised Universal Soil Loss Equation (RUSLE); United States Department of Agriculture: Washington, DC, USA, 1997.
  49. Ewen, J.; Parkin, G.; O’Connell, P.E. Shetran: Distributed river basin flow and transport modeling system. J. Hydrol. Eng. 2000, 5, 250–258. [Google Scholar] [CrossRef]
  50. Ochoa-Cueva, P.; Fries, A.; Montesinos, P.; Rodríguez-Díaz, J.A.; Boll, J. Spatial estimation of soil erosion risk by land-cover change in the andes of southern ecuador. Land Degrad. Dev. 2015, 26, 565–573. [Google Scholar] [CrossRef]
  51. Borrelli, P.; Robinson, D.A.; Fleischer, L.R.; Lugato, E.; Ballabio, C.; Alewell, C.; Meusburger, K.; Modugno, S.; Schütt, B.; Ferro, V. An assessment of the global impact of 21st century land use change on soil erosion. Nat. Commun. 2017, 8, 2013. [Google Scholar] [CrossRef] [PubMed] [Green Version]
  52. Anache, J.A.; Flanagan, D.C.; Srivastava, A.; Wendland, E.C. Land use and climate change impacts on runoff and soil erosion at the hillslope scale in the Brazilian cerrado. Sci. Total Environ. 2018, 622, 140–151. [Google Scholar] [CrossRef] [PubMed]
  53. Costa, C.W.; Lorandi, R.; de Lollo, J.A.; Imani, M.; Dupas, F.A. Surface runoff and accelerated erosion in a peri-urban wellhead area in southeastern Brazil. Environ. Earth Sci. 2018, 77, 160. [Google Scholar] [CrossRef]
  54. Steinhoff-Knopp, B.; Burkhard, B. Soil erosion by water in northern germany: Long-term monitoring results from lower saxony. CATENA 2018, 165, 299–309. [Google Scholar] [CrossRef]
  55. Panagos, P.; Borrelli, P.; Poesen, J.; Ballabio, C.; Lugato, E.; Meusburger, K.; Montanarella, L.; Alewell, C. The new assessment of soil loss by water erosion in Europe. Environ. Sci. Policy 2015, 54, 438–447. [Google Scholar] [CrossRef] [Green Version]
  56. Panagos, P.; Ballabio, C.; Borrelli, P.; Meusburger, K.; Klik, A.; Rousseva, S.; Tadić, M.P.; Michaelides, S.; Hrabalíková, M.; Olsen, P. Rainfall erosivity in Europe. Sci. Total Environ. 2015, 511, 801–814. [Google Scholar] [CrossRef] [PubMed]
  57. Panagos, P.; Meusburger, K.; Ballabio, C.; Borrelli, P.; Alewell, C. Soil erodibility in Europe: A high-resolution dataset based on lucas. Sci. Total Environ. 2014, 479, 189–200. [Google Scholar] [CrossRef] [PubMed] [Green Version]
  58. Panagos, P.; Meusburger, K.; Van Liedekerke, M.; Alewell, C.; Hiederer, R.; Montanarella, L. Assessing soil erosion in Europe based on data collected through a European network. Soil Sci. Plant Nutr. 2014, 60, 15–29. [Google Scholar] [CrossRef] [Green Version]
  59. de Hipt, F.O.; Diekkrüger, B.; Steup, G.; Yira, Y.; Hoffmann, T.; Rode, M. Modeling the impact of climate change on water resources and soil erosion in a tropical catchment in burkina faso, west Africa. CATENA 2018, 163, 63–77. [Google Scholar] [CrossRef]
  60. Diwediga, B.; Le, Q.B.; Agodzo, S.K.; Tamene, L.D.; Wala, K. Modelling soil erosion response to sustainable landscape management scenarios in the mo river basin (Togo, West Africa). Sci. Total Environ. 2018, 625, 1309–1320. [Google Scholar] [CrossRef]
  61. Fenta, A.A.; Yasuda, H.; Shimizu, K.; Haregeweyn, N.; Kawai, T.; Sultan, D.; Ebabu, K.; Belay, A.S. Spatial distribution and temporal trends of rainfall and erosivity in the eastern africa region. Hydrol. Process. 2017, 31, 4555–4567. [Google Scholar] [CrossRef]
  62. Panagos, P.; Borrelli, P.; Meusburger, K.; Yu, B.; Klik, A.; Lim, K.J.; Yang, J.E.; Ni, J.; Miao, C.; Chattopadhyay, N. Global rainfall erosivity assessment based on high-temporal resolution rainfall records. Sci. Rep. 2017, 7, 4175. [Google Scholar] [CrossRef] [PubMed]
  63. Wang, Y.; Cheng, C.; Xie, Y.; Liu, B.; Yin, S.; Liu, Y.; Hao, Y. Increasing trends in rainfall-runoff erosivity in the source region of the three rivers, 1961–2012. Sci. Total Environ. 2017, 592, 639–648. [Google Scholar] [CrossRef] [PubMed]
  64. Giang, P.Q.; Giang, L.T.; Toshiki, K. Spatial and temporal responses of soil erosion to climate change impacts in a transnational watershed in southeast Asia. Climate 2017, 5, 22. [Google Scholar] [CrossRef]
  65. Jat, M.L.; Stirling, C.M.; Jat, H.S.; Tetarwal, J.P.; Jat, R.K.; Singh, R.; Lopez-Ridaura, S.; Shirsath, P.B. Soil processes and wheat cropping under emerging climate change scenarios in south asia. Adv. Agron. 2017. [Google Scholar] [CrossRef]
  66. Kisan, M.V.; Khanindra, P.; Narayan, T.K.; Kumar, T.S. Remote sensing and gis based assessment of soil erosion and soil loss risk around hill top surface mines situated in saranda forest, jharkhand. J. Water Clim. Chang. 2016, 7, 68–82. [Google Scholar] [CrossRef]
  67. Mondal, A.; Khare, D.; Kundu, S.; Meena, P.K.; Mishra, P.; Shukla, R. Impact of climate change on future soil erosion in different slope, land use, and soil-type conditions in a part of the narmada river basin, India. J. Hydrol. Eng. 2014, 20, C5014003. [Google Scholar] [CrossRef]
  68. Thomas, J.; Joseph, S.; Thrivikramji, K. Assessment of soil erosion in a tropical mountain river basin of the Southern Western Ghats, India using rusle and GIS. Geosci. Front. 2017. [Google Scholar] [CrossRef]
  69. Bao, Y.; He, X.; Wei, J.; Tang, Q.; Guo, F. Soil erosion under different land uses in the riparian zone of the three-gorge reservoir, China. IAHS Publ. 2012, 356, 198–201. [Google Scholar]
  70. Su, Z.; Xiong, D.; Dong, Y.; Yang, D.; Zhang, S.; Zhang, B.; Zheng, X.; Zhang, J.; Shi, L. Influence of bare soil and cultivated land use types upstream of a bank gully on soil erosion rates and energy consumption for different gully erosion zones in the dry-hot valley region, Southwest China. Nat. Hazards 2015, 79, 183–202. [Google Scholar] [CrossRef]
  71. Jin, X.; Cheng, G.; Xu, C.; Fan, J.; Ma, Z. Estimation of the spatial distribution of soil erosion in the hilly area of Sichuan, China. IAHS-AISH Publ. 2012, 356, 228–234. [Google Scholar]
  72. Vörösmarty, C.J.; Green, P.; Salisbury, J.; Lammers, R.B. Global water resources: Vulnerability from climate change and population growth. Science 2000, 289, 284–288. [Google Scholar] [CrossRef] [PubMed]
  73. Islam, M.S.; Oki, T.; Kanae, S.; Hanasaki, N.; Agata, Y.; Yoshimura, K. A grid-based assessment of global water scarcity including virtual water trading. Water Resour. Manag. 2007, 21, 19–33. [Google Scholar] [CrossRef]
  74. Alcamo, J.; Flörke, M.; Märker, M. Future long-term changes in global water resources driven by socio-economic and climatic changes. Hydrol. Sci. J. 2007, 52, 247–275. [Google Scholar] [CrossRef] [Green Version]
  75. Arnell, N.W. Climate change and global water resources: Sres emissions and socio-economic scenarios. Glob. Environ. Chang. 2004, 14, 31–52. [Google Scholar] [CrossRef]
  76. Gerten, D.; Heinke, J.; Hoff, H.; Biemans, H.; Fader, M.; Waha, K. Global water availability and requirements for future food production. J. Hydrometeorol. 2011, 12, 885–899. [Google Scholar] [CrossRef]
  77. Falkenmark, M.; Rockström, J.; Karlberg, L. Present and future water requirements for feeding humanity. Food Secur. 2009, 1, 59–69. [Google Scholar] [CrossRef]
  78. Rost, S.; Gerten, D.; Bondeau, A.; Lucht, W.; Rohwer, J.; Schaphoff, S. Agricultural green and blue water consumption and its influence on the global water system. Water Resour. Res. 2008, 44. [Google Scholar] [CrossRef] [Green Version]
  79. Liu, J.; Zehnder, A.J.; Yang, H. Global consumptive water use for crop production: The importance of green water and virtual water. Water Resour. Res. 2009, 45. [Google Scholar] [CrossRef] [Green Version]
  80. Rockström, J.; Falkenmark, M.; Karlberg, L.; Hoff, H.; Rost, S.; Gerten, D. Future water availability for global food production: The potential of green water for increasing resilience to global change. Water Resour. Res. 2009, 45. [Google Scholar] [CrossRef] [Green Version]
  81. Food and Agriculture Organization. World Agriculture: Towards 2015/2030—An FAO Perspective; Earthscan: London, UK, 2003; 432p. [Google Scholar]
  82. Jaeger, W.K.; Amos, A.; Bigelow, D.P.; Chang, H.; Conklin, D.R.; Haggerty, R.; Langpap, C.; Moore, K.; Mote, P.W.; Nolin, A.W. Finding water scarcity amid abundance using human–natural system models. Proc. Natl. Acad. Sci. USA 2017, 114, 11884–11889. [Google Scholar] [CrossRef] [PubMed] [Green Version]
  83. MacDonald, G.M. Water, climate change, and sustainability in the southwest. Proc. Natl. Acad. Sci. USA 2010, 107, 21256–21262. [Google Scholar] [CrossRef] [PubMed] [Green Version]
  84. Porkka, M.; Gerten, D.; Schaphoff, S.; Siebert, S.; Kummu, M. Causes and trends of water scarcity in food production. Environ. Res. Lett. 2016, 11, 015001. [Google Scholar] [CrossRef] [Green Version]
  85. Devia, G.K.; Ganasri, B.; Dwarakish, G. A review on hydrological models. Aquat. Procedia 2015, 4, 1001–1007. [Google Scholar] [CrossRef]
  86. Sorooshian, S.; Hsu, K.-L.; Coppola, E.; Tomassetti, B.; Verdecchia, M.; Visconti, G. Hydrological Modelling and the Water Cycle: Coupling the Atmospheric and Hydrological Models; Springer Science & Business Media: Berlin, Germany, 2008; Volume 63. [Google Scholar]
  87. Getirana, A. Extreme water deficit in Brazil detected from space. J. Hydrometeorol. 2016, 17, 591–599. [Google Scholar] [CrossRef]
  88. Hirata, R.; Conicelli, B.P. Groundwater resources in Brazil: A review of possible impacts caused by climate change. Anais da Academia Brasileira de Ciências 2012, 84, 297–312. [Google Scholar] [CrossRef] [PubMed]
  89. Murtinho, F.; Tague, C.; de Bievre, B.; Eakin, H.; Lopez-Carr, D. Water scarcity in the andes: A comparison of local perceptions and observed climate, land use and socioeconomic changes. Hum. Ecol. 2013, 41, 667–681. [Google Scholar] [CrossRef]
  90. Seiler, C.; Hutjes, R.W.; Kabat, P. Likely ranges of climate change in Bolivia. J. Appl. Meteorol. Climatol. 2013, 52, 1303–1317. [Google Scholar] [CrossRef]
  91. Feng, S.; Fu, Q. Expansion of global drylands under a warming climate. Atmos. Chem. Phys 2013, 13, 14637–14665. [Google Scholar] [CrossRef]
  92. Montaña, E.; Diaz, H.P.; Hurlbert, M. Development, local livelihoods, and vulnerabilities to global environmental change in the south american dry andes. Reg. Environ. Chang. 2016, 16, 2215–2228. [Google Scholar] [CrossRef]
  93. Terrado, M.; Acuña, V.; Ennaanay, D.; Tallis, H.; Sabater, S. Impact of climate extremes on hydrological ecosystem services in a heavily humanized mediterranean basin. Ecol. Indic. 2014, 37, 199–209. [Google Scholar] [CrossRef]
  94. Marquès, M.; Bangash, R.F.; Kumar, V.; Sharp, R.; Schuhmacher, M. The impact of climate change on water provision under a low flow regime: A case study of the ecosystems services in the francoli river basin. J. Hazard. Mater. 2013, 263, 224–232. [Google Scholar] [CrossRef] [PubMed]
  95. Lutter, S.; Pfister, S.; Giljum, S.; Wieland, H.; Mutel, C. Spatially explicit assessment of water embodied in European trade: A product-level multi-regional input-output analysis. Glob. Environ. Chang. 2016, 38, 171–182. [Google Scholar] [CrossRef]
  96. Liuzzo, L.; Noto, L.V.; Arnone, E.; Caracciolo, D.; La Loggia, G. Modifications in water resources availability under climate changes: A case study in a sicilian basin. Water Resour. Manag. 2015, 29, 1117–1135. [Google Scholar] [CrossRef]
  97. Maestre-Valero, J.F.; Martínez-Granados, D.; Martínez-Alvarez, V.; Calatrava, J. Socio-economic impact of evaporation losses from reservoirs under past, current and future water availability scenarios in the semi-arid segura basin. Water Resour. Manag. 2013, 27, 1411–1426. [Google Scholar] [CrossRef]
  98. Koop, S.H.A.; van Leeuwen, C.J. The challenges of water, waste and climate change in cities. Environ. Dev. Sustain. 2017, 19, 385–418. [Google Scholar] [CrossRef]
  99. Aich, V.; Liersch, S.; Vetter, T.; Huang, S.; Tecklenburg, J.; Hoffmann, P.; Koch, H.; Fournet, S.; Krysanova, V.; Müller, E. Comparing impacts of climate change on streamflow in four large african river basins. Hydrol. Earth Syst. Sci. 2014, 18, 1305. [Google Scholar] [CrossRef] [Green Version]
  100. Brinkmann, K.; Schumacher, J.; Dittrich, A.; Kadaore, I.; Buerkert, A. Analysis of landscape transformation processes in and around four west african cities over the last 50 years. Landsc. Urban Plan. 2012, 105, 94–105. [Google Scholar] [CrossRef]
  101. Schmitz, C.; Lotze-Campen, H.; Gerten, D.; Dietrich, J.P.; Bodirsky, B.; Biewald, A.; Popp, A. Blue water scarcity and the economic impacts of future agricultural trade and demand. Water Resour. Res. 2013, 49, 3601–3617. [Google Scholar] [CrossRef] [Green Version]
  102. Jemmali, H. Mapping water poverty in africa using the improved multidimensional index of water poverty. Int. J. Water Resour. Dev. 2017, 33, 649–666. [Google Scholar] [CrossRef]
  103. Prasch, M.; Mauser, W.; Weber, M. Quantifying present and future glacier melt-water contribution to runoff in a central himalayan river basin. Cryosphere 2013, 7, 889. [Google Scholar] [CrossRef]
  104. Máñez, K.S.; Husain, S.; Ferse, S.C.; Costa, M.M. Water scarcity in the spermonde archipelago, sulawesi, indonesia: Past, present and future. Environ. Sci. Policy 2012, 23, 74–84. [Google Scholar] [CrossRef]
  105. Riadi, L. Water sustainability: Emerging trends for water quality management. KnE Life Sci. 2017, 3, 118–130. [Google Scholar] [CrossRef]
  106. Mekonnen, M.M.; Hoekstra, A.Y. Four billion people facing severe water scarcity. Sci. Adv. 2016, 2, e1500323. [Google Scholar] [CrossRef] [PubMed] [Green Version]
  107. Wang, K.; Sun, D.-W.; Pu, H.; Wei, Q. Principles and applications of spectroscopic techniques for evaluating food protein conformational changes: A review. Trends Food Sci. Technol. 2017, 67, 207–219. [Google Scholar] [CrossRef]
  108. Ramkar, P.; Yadav, S. Spatiotemporal drought assessment of a semi-arid part of middle tapi river basin, India. Int. J. Disaster Risk Reduct. 2018, 28, 414–426. [Google Scholar] [CrossRef]
  109. Hejazi, M.; Edmonds, J.; Clarke, L.; Kyle, P.; Davies, E.; Chaturvedi, V.; Wise, M.; Patel, P.; Eom, J.; Calvin, K. Long-term global water projections using six socioeconomic scenarios in an integrated assessment modeling framework. Technol. Forecast. Soc. Chang. 2014, 81, 205–226. [Google Scholar] [CrossRef]
  110. Ahammed, S.J.; Chung, E.-S.; Shahid, S. Parametric assessment of pre-monsoon agricultural water scarcity in bangladesh. Sustainability 2018, 10, 819. [Google Scholar] [CrossRef]
  111. Quinteiro, P.; Rafael, S.; Villanueva-Rey, P.; Ridoutt, B.; Lopes, M.; Arroja, L.; Dias, A.C. A characterisation model to address the environmental impact of green water flows for water scarcity footprints. Sci. Total Environ. 2018, 626, 1210–1218. [Google Scholar] [CrossRef] [PubMed]
  112. Feng, K.; Siu, Y.L.; Guan, D.; Hubacek, K. Assessing regional virtual water flows and water footprints in the yellow river basin, China: A consumption based approach. Appl. Geogr. 2012, 32, 691–701. [Google Scholar] [CrossRef]
  113. Feng, K.; Hubacek, K.; Pfister, S.; Yu, Y.; Sun, L. Virtual scarce water in China. Environ. Sci. Technol. 2014, 48, 7704–7713. [Google Scholar] [CrossRef] [PubMed]
  114. Bruinsma, J. World Agriculture: Towards 2015/2030: An FAO Study; Routledge: Abingdon, UK, 2017. [Google Scholar]
  115. Lesk, C.; Rowhani, P.; Ramankutty, N. Influence of extreme weather disasters on global crop production. Nature 2016, 529, 84–87. [Google Scholar] [CrossRef] [PubMed]
  116. Lipper, L.; Thornton, P.; Campbell, B.M.; Baedeker, T.; Braimoh, A.; Bwalya, M.; Caron, P.; Cattaneo, A.; Garrity, D.; Henry, K. Climate-smart agriculture for food security. Nat. Clim. Chang. 2014, 4, 1068–1072. [Google Scholar] [CrossRef]
  117. de Vrese, P.; Stacke, T.; Hagemann, S. Exploring the biogeophysical limits of global food production under different climate change scenarios. Earth Syst. Dyn. 2018, 9, 393–412. [Google Scholar] [CrossRef] [Green Version]
  118. Levis, S.; Badger, A.; Drewniak, B.; Nevison, C.; Ren, X. Clmcrop yields and water requirements: Avoided impacts by choosing rcp 4.5 over 8.5. Clim. Chang. 2018, 146, 501–515. [Google Scholar] [CrossRef]
  119. Wang, Q.; Wu, J.; Lei, T.; He, B.; Wu, Z.; Liu, M.; Mo, X.; Geng, G.; Li, X.; Zhou, H. Temporal-spatial characteristics of severe drought events and their impact on agriculture on a global scale. Quat. Int. 2014, 349, 10–21. [Google Scholar] [CrossRef]
  120. Geng, G.; Wu, J.; Wang, Q.; Lei, T.; He, B.; Li, X.; Mo, X.; Luo, H.; Zhou, H.; Liu, D. Agricultural drought hazard analysis during 1980–2008: A global perspective. Int. J. Clim. 2016, 36, 389–399. [Google Scholar] [CrossRef]
  121. Thaler, S.; Eitzinger, J.; Trnka, M.; Dubrovsky, M. Impacts of climate change and alternative adaptation options on winter wheat yield and water productivity in a dry climate in central Europe. J. Agric. Sci. 2012, 150, 537–555. [Google Scholar] [CrossRef]
  122. Eitzinger, J.; Trnka, M.; Semerádová, D.; Thaler, S.; Svobodová, E.; Hlavinka, P.; Šiška, B.; Takáč, J.; Malatinská, L.; Nováková, M. Regional climate change impacts on agricultural crop production in central and eastern Europe–hotspots, regional differences and common trends. J. Agric. Sci. 2013, 151, 787–812. [Google Scholar] [CrossRef]
  123. Knox, J.; Daccache, A.; Hess, T.; Haro, D. Meta-analysis of climate impacts and uncertainty on crop yields in Europe. Environ. Res. Lett. 2016, 11, 113004. [Google Scholar] [CrossRef]
  124. Bakker, A.M.; Bessembinder, J.J.; de Wit, A.J.; van den Hurk, B.J.; Hoek, S.B. Exploring the efficiency of bias corrections of regional climate model output for the assessment of future crop yields in Europe. Reg. Environ. Chang. 2014, 14, 865–877. [Google Scholar] [CrossRef]
  125. Parkes, B.; Defrance, D.; Sultan, B.; Ciais, P.; Wang, X. Projected changes in crop yield mean and variability over west africa in a world 1.5 k warmer than the pre-industrial era. Earth Syst. Dyn. 2018, 9, 119–134. [Google Scholar] [CrossRef]
  126. Sultan, B.; Guan, K.; Kouressy, M.; Biasutti, M.; Piani, C.; Hammer, G.; McLean, G.; Lobell, D.B. Robust features of future climate change impacts on sorghum yields in west africa. Environ. Res. Lett. 2014, 9, 104006. [Google Scholar] [CrossRef] [Green Version]
  127. Knox, J.; Hess, T.; Daccache, A.; Wheeler, T. Climate change impacts on crop productivity in Africa and South Asia. Environ. Res. Lett. 2012, 7, 034032. [Google Scholar] [CrossRef] [Green Version]
  128. Hoffman, A.L.; Kemanian, A.R.; Forest, C.E. Analysis of climate signals in the crop yield record of sub-saharan Africa. Glob. Chang. Biol. 2018, 24, 143–157. [Google Scholar] [CrossRef] [PubMed]
  129. Yuliawan, T.; Handoko, I. The effect of temperature rise to rice crop yield in indonesia uses shierary rice model with geographical information system (GIS) feature. Procedia Environ. Sci. 2016, 33, 214–220. [Google Scholar] [CrossRef]
  130. Kurniasih, E. Use of Drought Index and Crop Modelling for Drought Impacts Analysis on Maize (Zea Mays L.) Yield Loss in Bandung District; IOP Conference Series: Earth and Environmental Science; IOP Publishing: Bristol, UK, 2017; p. 012036. [Google Scholar]
  131. Prabnakorn, S.; Maskey, S.; Suryadi, F.; de Fraiture, C. Rice yield in response to climate trends and drought index in the mun river basin, thailand. Sci. Total Environ. 2018, 621, 108–119. [Google Scholar] [CrossRef] [PubMed]
  132. Chen, Y.; Lu, C. A comparative analysis on food security in Bangladesh, India and Myanmar. Sustainability 2018, 10, 405. [Google Scholar] [CrossRef]
  133. Arshad, M.; Amjath-Babu, T.; Aravindakshan, S.; Krupnik, T.J.; Toussaint, V.; Kächele, H.; Müller, K. Climatic variability and thermal stress in pakistan’s rice and wheat systems: A stochastic frontier and quantile regression analysis of economic efficiency. Ecol. Indic. 2018, 89, 496–506. [Google Scholar] [CrossRef]
  134. Dar, M.U.D.; Aggarwal, R.; Kaur, S. Effect of climate change scenarios on yield and water balance components in rice-wheat cropping system in Central Punjab, India. J. Agrometeorol. 2017, 19, 226–229. [Google Scholar]
  135. Zhang, T.; Huang, Y. Impacts of climate change and inter-annual variability on cereal crops in China from 1980 to 2008. J. Sci. Food Agric. 2012, 92, 1643–1652. [Google Scholar] [CrossRef] [PubMed]
  136. Ye, L.; Xiong, W.; Li, Z.; Yang, P.; Wu, W.; Yang, G.; Fu, Y.; Zou, J.; Chen, Z.; Van Ranst, E.; et al. Climate change impact on China food security in 2050. Agron. Sustain. Dev. 2013, 33, 363–374. [Google Scholar] [CrossRef] [Green Version]
  137. Tao, F.; Zhang, Z. Climate change, wheat productivity and water use in the north China plain: A new super-ensemble-based probabilistic projection. Agric. For. Meteorol. 2013, 170, 146–165. [Google Scholar] [CrossRef]
  138. Lv, Z.; Liu, X.; Cao, W.; Zhu, Y. Climate change impacts on regional winter wheat production in main wheat production regions of China. Agric. For. Meteorol. 2013, 171, 234–248. [Google Scholar] [CrossRef]
  139. Wang, J.; Vanga, S.K.; Saxena, R.; Orsat, V.; Raghavan, V. Effect of climate change on the yield of cereal crops: A review. Climate 2018, 6, 41. [Google Scholar] [CrossRef]
  140. Khapre, A.P. Studies on Development of Value Added Products from Finger Millet (Eleusine Coracana) and Foxtail Millet (Setaria Italica) for Nutritional Security; Vasantrao Naik Marathwada Krishi Vidyapeeth: Parbhani, India, 2017. [Google Scholar]
  141. Michaelraj, P.; Shanmugam, A. A study on milletsbased cultivation and consumption in India. Int. J. Mark. Financ. Serv. Manag. Res. 2013, 2, 49–58. [Google Scholar]
  142. Malathi, B.; Appaji, C.; Reddy, G.R.; Dattatri, K.; Sudhakar, N. Growth pattern of millets in India. Indian J. Agric. Res. 2016, 50, 382–386. [Google Scholar] [CrossRef]
Figure 1. Cultivation of different types of millets around the world.
Sustainability 10 02228 g001
Figure 2. Area under cultivation of Millets in different regions of the world.
Sustainability 10 02228 g002
Figure 3. Yield of Millets in different regions of the world.
Sustainability 10 02228 g003
Figure 4. Production of top seven cereal crops in different regions of the world (primary axis represents Maize, Rice and Wheat production in million tons and secondary axis represents Barley, Millet, Rye and Sorghum production in million tons).
Sustainability 10 02228 g004aSustainability 10 02228 g004bSustainability 10 02228 g004c
Table 1. Scientific names, common names, regions and conditions required for cultivation of different types of Millet around the world.
Type of MilletsScientific
Name
Common
Name
Cultivated RegionsGrowing ConditionsReferences
Pearl MilletPennisetum typhoidesBulrush milletCentral, Eastern and Southern Africa; in Western Africa, (Sahel), India and Pakistan along the southern coast of the Arabian Peninsula *Dry climates, marginal soils, Rainfall 200–500 mm *** [11]
** [10]
Finger milletEleusine coraconaBirds food millet or African milletParts of India and Africa *Resist higher temperatures and salinity, temperature 11 to 27 °C, soil pH of 5 to 8.2 and a medium rainfall environment *** [13]
** [14]
Proso MilletPanicum miliaceumCommon millet, hog millet, broom corn, yellow hog, hershey and white milletChina, India, Russia, in the Middle East including Iran, Iraq, Syria, Turkey Afghanistan and Romania *Less water, Rainfall less than 600 mm, average temperature 17 °C during daytime *** [15,16,17]
** [18]
Foxtail MilletSetaria italicaItalian millet, German millet, or hay milletEurope, China, India, Indonesia, the Korean peninsula and the former U.S.S.R. *Less water **, short duration **** [19]
** [20]
*** [22]
Barnyard MilletEchinochloa crusgalli var. Frumentacea or E. colona (Sawa)-India, China, Japan, Pakistan, Africa and Nepal *Drought tolerant, rapid maturation rate *** [24]
** [26]
Kodo MilletPaspalum scorbiculatum-Tropical and sub-tropical regions *High drought resistance, Good yields, period of 80–135 days *** [28,29]
** [30]
Note: *, **, *** represent the corresponding reference.
Table 2. Summary of soil erosion predictions from select studies.
Regions or CountriesModel/MethodologyMajor FindingsReferences
South America
  • Ecuador
Revised Universal Soil Loss Equation
  • Maximum erosion rates are estimated for cropland area and pasture (936 Mg/ha/year) where precipitation rates and slopes have a higher value
  • By 2040, the soil erosion rates will increase to 2021 Mg/ha/year when the deforestation is maximum in the watershed
[50]
  • South America
Soil erosion model (combination of remote sensing, GIS modeling and census data)
  • Increase in soil erosion worldwide due to the expansion of croplands
  • During 2001–2012, the estimated increase in soil erosion was 8% due to deforestation and huge cropland expansion in Argentina (41.6%), Brazil (19.8%), Bolivia (37.8%) and Peru (5.9%)
[51]
  • Brazil
Water Erosion Prediction Project (WEPP) and climate generator (CLIGEN)
Geographic Information system (GIS)
  • Increase in soil erosion rates and runoff rates due to increase in depths and intensities of rainfall
[52]
Universal Transverse Mercator (UTM) and Brazil Geodesic referencing system (SIRGAS2000)
  • A significant part of the regions shows low potential for surface runoff and moderate potential for soil erosion rates
  • Changes in soil cover accelerate soil erosion
[53]
Europe
  • Germany
Monitoring of 86 agricultural fields
  • Average mapped soil loss accounts for 0.85 t/ha/a
  • Maximum yearly soil loss on an individual field was 53.07 t/ha/a
  • Agricultural practices have a positive influence on soil erosion rates
[54]
  • Europe
Revised Universal Soil Loss Equation (RUSLE)
  • Average soil loss in agricultural, forest and semi-arid lands accounts for 2.46 t/ha/year
  • Annual total soil loss is estimated to 970 Mt
[55]
Rainfall Erosivity Database
  • Estimated rainfall erosivity in Europe and Switzerland is 722 MJ mm/ha h year
  • Erosivity density reported were higher in Mediterranean regions indicating the possibility of soil erosions and floods in the future
[56]
Cubist Regression Model
  • K-factor (an indicator of susceptibility to soil erosion) was 0.032 t ha h/ha MJ mm
  • Decrease in the soil erosivity up to 15% caused by a stone cover surface over the soil
[57]
European Environment Information and Observation Network for soil (EIONET-SOIL)
  • Austria, Belgium, Bulgaria, Germany, Italy, Netherlands, Poland and Slovakia have a soil erosion rate of 2.32 t/ha/year
  • Soil erosion rates were higher for Italy (6.60 t/ha/year) and lowest for The Netherlands (0.25 t/ha/year)
[58]
Africa
  • West Africa
Six Regional and Global climate models
  • Ambiguity in the prediction of temperature increase and precipitation
  • Soil erosion rates might increase or decrease depending on the temperature and precipitation
[59]
Land Management and Planning Tool
  • Net soil losses in the years 1972, 1987, 2000 and 2014 were 26, 23, 27 and 44 t/ha/year and the soil loss was higher than the tolerable limits for the tropics
  • Management practices such as identifying erosion hotspots could decrease soil loss in future
[60]
  • East Africa
5 km × 5 km resolution multisource rainfall product (Climate Hazards Group InfraRed Precipitation with Stations)
  • Mean annual rainfall in the region during 1981–2016 was 810 mm; 300 mm being in the lowland areas and 1100 mm in highlands
  • 55% of the region will face rainfall erosivity above the moderate level
  • This region will face potential high-water erosion risk in the future
[61]
  • Sub-Saharan Africa
Soil erosion model (combination of remote sensing, GIS modeling and census data)
  • Less developed economies such as Sub Saharan Africa has erosion rates three times more than the developed economies
  • The African territories along the equator are the hot spots for soil erosion (soil erosion rates higher than 20 Mg /ha/year)
[51]
  • Africa
Global Rainfall Erosivity Database (GloREDa)
  • Global mean rainfall erosion rates are estimated to be 2190 MJ mm/ha h year
  • The highest value of erosivity are found in Central east Africa whereas lower values are present in Northern Africa
  • Soil erosion is predicted more in Western Africa, Central Africa
[62]
Southeastern Asia
  • Southeast Asia
Soil erosion model (combination of remote sensing, GIS modeling and census data)
  • Prediction of increase in soil erosion in the region
  • Erosion hot spots are present in Indonesia (0.076 million km2; 5% of the country)
[51]
Mann-Kendall statistical test and Theil and Sen’s approach
  • Increase in rainfall erosivity during 1961–2012 with a significant increase observed in last two decades
  • High precipitation rates and high warming rates pose a higher risk of soil erosion during the period
[63]
  • Southeast Asia (Laos-Vietnam transnational Upper Ca River Watershed)
Soil and Water Assessment Tool (SWAT)
  • Climate change will cause more soil erosion in downstream compared to upstream due to more precipitation
  • Increase in soil erosion in wet climates of the wet season due to high-intensity rainfall
[64]
South Asia
  • South Asia
Review of various articles
  • This region will be hit hard by climate change by the end of the 21st century
  • Increase in temperature by at least 2 °C compared to 20th century
  • Adverse climate conditions will affect soil properties and will increase the soil erosion rates
[65]
Soil erosion model (combination of remote sensing, GIS modeling and census data)
  • India showed a slight decrease in erosion rates up to 2%
  • Hot spots of soil erosion are present in India (soil erosion greater than 20 Mg/ha/year)
  • India is in the red zone of high rainfall erosivity (>4500 MJ mm/ha h year)
[51]
  • India
Geographic Information system (GIS)
  • Annual soil loss increased by 16% and 61% as estimated by two different models during 2001–2008
  • Anthropogenic activities increased soil erosion in the region during the period
[66]
Least-square support vector machine (LS-SVM), Statistical downscaling model (SDSM) models and the Universal soil loss equation (USLE) model
  • Climate change will affect the soil erosion rates
  • Increase in future precipitation by 18.09% in 2050 and 58.9% by 2080
  • The rate of change of soil erosion will be 18.09% in 2050 and 58.9% in 2080 with a decrease of 8.51% in 2020
[67]
  • Muthirapuzha River Basin, (India)
Revised Universal Soil Loss Equation (RUSLE) model coupled and transport limited sediment delivery (TLSD)
  • Average gross soil erosion is 14.36 t/ha/year and average net soil erosion is 3.60 t/ha/year
  • A major part of the basin has slightly less erosion rates (<5 t/ha/year)
  • Annual soil organic carbon (SOC) content loss sums to 0.42 t
[68]
China
Analysis of soil erosion rates in fifteen experimental plots
  • The maximum rate for soil erosion for different lands was: Conventional tillage farmland (94,887 t/km2/year), bare land (92,423 t/km2/year), bunch planting (64,670 t/km2/year), natural grassland (37,794 t/km2/year).
  • Minimum soil erosion rates were observed for artificial grassland (21,340 t/km2/year)
[69]
In situ bank gully field flume experiment
  • Intensive Land-use tends to accelerate the soil erosion rates in the upstream catchment area
  • Reduction in tillage practices and increase in vegetation cover could help in reducing soil erosion in upstream catchment areas
[70]
Universal Soil Loss Equation (USLE)
  • The mean yearly soil erosion rates for river basins Weichenghe and Lizixi is 706 t/km2/year and 3040 t/km2/year
  • High erosion rates are due to high altitudes and intensive use of agricultural land
[71]
Table 3. Summary of predicted water resources in the future based on selected studies.
Regions or CountriesModelMajor FindingsReferences
South America
  • Brazil
CLM, Mosaic, Noah, VIC
  • Detection of water loss rate of −6.1 cm/year over Southeastern Brazil
  • The precipitation rates will lower due to extreme droughts in the region
  • Persistent reduction in precipitation rates to 20-23% over three years could lead to water scarcity conditions
[87]
Review of various research articles
  • Reduction in value of recharge in Northeast region aquifers by 70% by 2050 compared to 2010. This value will vary from 30 to 70% in North region
  • South and the southeastern region will have an increase in recharge of aquifers from 30% to 100%
  • Increase in population and demand for water availability will make aquifers as a main source of water supply and hence leading to water scarcity in future
[88]
  • Andean Region
Collection of rainfall data from various resources
  • Regions having variability in seasonal rainfall will face water scarcity but not those where annual rainfall is lower
[89]
  • Bolivia
Global Circulation Model (GCM)
  • Increase in temperature (2.5–5.9 °C) and short-wave radiations predicted for duration 2070–2099
  • Less rainfall (−19%) in drier months with some variations in inter-annual rainfall
[90]
  • South American region
27 Global climate models
  • Major expansion of arid lands in Southern America
  • Increase in the population affected by land degradations and water scarcity
[91]
  • Central and Southern Andes of South America
Data collection from research projects between 2004 and 2012
  • Hundreds of millions of people will face water crisis by 2020 due to climate change. The reason being melting of glaciers, reduction in snowpack and precipitation
[92]
Europe
  • Mediterranean region (Llobregat River basin, Spain)
InVEST (Integrated Valuation of Ecosystem Services and Tradeoffs)
  • Hydrological ecosystem services are in the red zone due to increase in population and extreme climate changes
[93]
  • Mediterranean region (Francoli River basin, Spain)
InVEST (Integrated Valuation of Ecosystem Services and Tradeoffs)
  • Water yield will reduce to up to 44%, and total drinking water availability will decrease up to 50% by 2100
[94]
  • European Union
EXIOBASE
  • The Indus and Mississippi watersheds (the watersheds responsible for water consumption in Europe) will cause significant environmental impacts because of water scarcity in both the watersheds
  • More stress on water resources in the future (by 2100) due to a decrease in precipitation.
[95]
  • Southern Area of Italy
TOPDM (Topography based probability distribution model)
  • Water management practices should be addressed adequately to avoid water scarcity
  • The probability of reduction in water availability by 40% in the worst case with an economic impact ranging 32–36%
[96]
  • Semi-arid Segura basin (Southeast Spain)
Energy balance models
  • Evaporation loss from reservoir account for 6.5 to 11.7% and evaporation from the small basin is more compared to large basins.
[97]
  • European Cities
City Blueprint Methodology
  • Most European cities fall into the category of water-efficient cities and resource efficient and adaptive cities. However, proper planning is required to make cities water-wise and to avoid water scarcity in the future
[98]
Africa
  • North and South Africa
Global Climate Models
  • Expansion of arid regions in future and semi-arid regions in North side of the Mediterranean, Southern Africa
[91]
  • Four sizeable African river basins (the Niger, the Upper Blue Nile, the Oubangui and the Limpopo)
SWIM (Soil and water integrated model)
  • Increase in discharge and high flows in Upper Blue Nile Basin which indicates frequent flooding in future
  • Flood threat in the African region
[99]
  • Sub-Saharan Africa
Sequential Maximum A Posteriori Classifier’ (SMAPC)
  • The implication of monitoring strategies and land use planning as there will be an increase in water scarcity in African region in future
[100]
  • North Africa
MAgPIE (model of agricultural production and its impact on world)
  • Rise in water scarcity in the region by 2045. Even new made policies would not be able to retain water scarcity
[101]
  • Africa
Water Poverty mapping
  • Water scarce and developed countries are in North and South Africa whereas water-rich and lower income countries are in Sub-Saharan Africa
[102]
Southeastern Asia
  • Lhasa River basin
PROMET (Processes of Radiation, Mass and Energy transfer) and SURGES (Subscale Regional Glacier Extension Simulator)
  • Ice melt contribution to total runoff will be stable with small variations by 2080
  • Decrease in contribution to runoff by snowmelt due to global climate change
[103]
  • South Asia
MAgPIE (model of agricultural production and its impact on world)
  • Increase temperature with increase in evaporation will reduce water availability
  • Rise in water scarcity in the region by 2045
[101]
  • South Sulawesi, Indonesia
Review of various documents
  • Water scarcity will be a major problem for local communities in future
  • Several factors such as increasing no. of wells, rise in population and unavailability of water management institutes will affect water scarcity
[104]
IndonesiaWater sustainability hierarchy model
  • 37 million people do not have access to safe water due to issues in water quality
[105]
Southern Asia
  • South Asia
Assessment of blue water scarcity globally on a monthly basis
  • Pakistan faces moderate to severe water scarcity during at least half of the year
  • India faces high water scarcity
  • Depletion of ground water resources in India Pakistan
  • SDI (streamflow drought index) shows a declining trend during 1981–2013
[106]
Literature review of various policies and documents
  • 70% of the population depends on agriculture for livelihood and agriculture contributes to 22% of GDP (Gross domestic product)
  • Reduction in arable land due to water scarcity, rise in sea level, flooding, increased intensity and frequency of storm
[107]
  • India (Tapi river basin)
Temporal analysis and spatial mapping
  • Quality of water was deteriorated in the same period and in turn lead to water scarcity for the nearby population
  • Water scarcity is anticipated to increase by 2095
[108]
  • India
GCAM (Global Change Assessment Model)
  • The increasing population will never be able to meet water demands in the future
  • Dependency on water reuse, desalinated water
  • High-risk water scarcity in the agricultural area of 6.3%, high water scarcity in 19.1% area and moderate water risk in 37.2% area
[109]
  • Bangladesh
Catastrophe-theory based multi-criteria decision
  • Water unavailability in Northwest region and degraded water quality in Southwest region are responsible for water scarcity in these regions.
[110]
China
LCA (Life cycle assessment)
  • Significant change in green water flow occurring in Central regions of China
[111]
MRIO (Multi-Regional input-output model)
  • Perturbations occurring in surface blue water in Central China
  • The three reaches of Yellow River basin are net exporter of virtual blue water and hence putting pressure on the basin activities
[112]
MRIO (Multi-Regional input-output model)
  • Lower reach is the scarcest water region
  • Coastal provinces are dependent on Northern province for consumption of water and hence causing water scarcity in Northern region
  • Highly developed province is net importer of water which causes an imbalance of distribution of water resources.
[113]
Table 4. Effect of climate change on agricultural productivity by 2050.
Regions or CountriesModel/MethodologyMajor FindingsReferences
South America
  • South America
Earth system model
  • The possibility of expansion of total cropland area
  • With CO2 fertilization effect, few agricultural areas have to be abandoned due to low productivity
  • Without the CO2 fertilization effect, no effect on the expansion of cropland
[117]
CLM (community land model)
  • A decline in the crop yield
  • Declining yield crop by 3 t/ha
  • Increase in irrigation requirements up to 23% for C4 crops without CO2 fertilization and 3% for C4 crops with CO2 fertilization
[118]
Global Standardized Precipitation Evapotranspiration Index dataset
  • Increase in the global drought-prone area from 16.19% in 1902–1949 to 41.09% in 950–2008
  • South America is one of the regions where agricultural lands are predicted to be drought-prone
[119]
Agricultural drought hazard index (DHI)
  • 23.57% and 27.19% of the total agricultural area in the world comes under high and very high agricultural drought hazard zones
  • These regions are also present in South America
  • High agricultural drought hazard zone for crops such as maize, wheat, soybean and sorghum
[120]
Europe
  • Central Europe
CERES-Wheat crop-growth simulation model
  • Crop-growing period will be cut short by 20 days with an increase in temperature of 2 °C
  • Decrease in yield of winter wheat irrespective of the soil types in all regions
  • Prediction of high yield reductions in light textured crops
[121]
  • Central and Eastern Europe
Different crop models and pest models
  • Increase in yield potential in wetter and cooler regions compared to drier and warmer regions
  • Crop yield will be limited by factors such as availability of crop water and drastic increase in temperature
  • Variation in crop yield but it will increase by end of 21st century
[122]
  • Europe
Systematic review and meta-analysis of data
  • Extensive impact of climate change on crop yield for crops such as maize, potato, sugar beet and wheat while limited impact on barley, rice and wheat
  • There will be a reduction in crop yield drastically for maize and potato in Central and Southern Europe by 2080
[123]
RCM (Regional Climate Models)
  • Deterioration of length of growing season and potential crop yield due to excessive summer drying
  • Projected decrease in average crop yield
[124]
Africa
  • West Africa
Crop Models
  • Decrease in yields of Millets and sorghum in the future
  • Increase in the variability of the crop yield
  • Frequency of crop failure will be increased due to increase in variability of crop yield
  • Fall in return time for crop failure for maize, millets and sorghum
[125]
CMIP5 climate models and two crop models (SARRA-H and APSIM)
  • The projected increase in mean temperature by +2.8 °C during 2031–2060 compared to 1961–1990
  • Yields will decrease up to 20% without CO2 fertilization and up to 10% with CO2 fertilization
  • Overall, the negative impact of climate on crop yield even with CO2 fertilization
[126]
  • Africa
CLM (community land model)
  • Decrease in crop yield up to 3 t/ha in parts of tropical and sub-tropical Africa due to increase in temperature
  • Possibility of mitigation of yield loss by irrigation and CO2 fertilization effect
  • Increase in global irrigation requirements for C4 crops is 23% (without CO2 fertilization) and 3% (with CO2 fertilization)
[118]
Systematic review and meta-analysis of data
  • Crop yield will show a decline by −8% by 2050
  • The average yields for wheat, maize, sorghum and millet will change by −17%, −5%, −15% and −10%, respectively
[127]
  • Sub-Saharan Africa
Random Forest (a diagnostic machine learning technique)
  • Increase in temperature reduce yields of groundnut, maize and sorghum whereas precipitation helped in elevating the crop yield rate from 1962–2014
  • Improvement in technology helped in increasing maize yields by 1% whereas an increase in temperature reduced the yields by 0.8%
  • Future yield would be affected by increasing temperature and drier climates, but improvement in technology might help in increasing the crop yield rate
[128]
Southeastern Asia
  • Indonesia
Model of Shierary rice with Geographical Information system (GIS)
  • Increase in temperature would make age of rice shorter and have negative impact on the rice yields
  • Irrigated farm (11.1%/°C) showed less reduction in crop yield compared to rainfed farms (14.4%/°C)
[129]
Aqua crop
  • Droughts occurring at reproductive stages of maize caused highest maize yield loss
[130]
  • Thailand
(SPEI) Standardized Precipitation and Evapotranspiration Index
  • Yield loss are in the range of less than 50 kg/ha per decade
  • Interference of increasing temperatures during crop growing season will negatively affects the crop yield
[131]
  • Myanmar
Food security Index and food decomposition method
  • The increase in production in the region during 1990–2013 was due to increase in production area and increase in consumption growth was mainly due to high requirement of growth per area
  • Improvement in irrigation facilities should be needed to avoid food insecurity in future decades
[132]
Southern Asia
  • South Asia
Systematic review and meta-analysis of data
  • Yield reduction of −8% by 2050 for major crops
  • Prediction in reduction of yield of maize by −16% and sorghum by −11%
  • No concrete predictions for cassava, sugarcane and yams
[127]
Earth system model
  • Crop yield will decrease without CO2 fertilization effect
  • Ensuring food security in South Asia will be highly difficult
[117]
  • Pakistan
Stage stochastic production frontier (SPF) models, second-stage ordinary least square (OLS) and quantile regression models
  • Increase in temperature up to 34 °C will significantly decrease the economic efficiency of wheat production
  • Increase in temperature more than 35.5 °C will have adverse effects on the production of rice
[133]
  • India and Bangladesh
Food security Index and food decomposition method
  • Increase in production during 1990–2013 was due to increase in crop yield and increase in consumption of grains was due to population growth
  • Advancement of irrigation technologies to ensure food security in the region in future decades
[132]
  • India
Decision Support System for Agrotechnology Transfer (DSSAT)
  • Increase in reduction in crop yield and shortening of crop growing period due to rise in temperature
  • Increase in rainfall might decrease requirement of irrigation water but would not be able to compensate the negative effect of rising temperature
[134]
China
Study of different regions and crops and collection of data from China’s Agricultural statistics
  • Increase in temperature resulted in lower yields of both rice and wheat between 1980 and 2008
  • Higher temperature in turn lower precipitation in Northern parts of China suggesting reduced yields due to paucity of water resources
[135]
CERES crop models along with the IPCC SRES A2 and B2 scenarios considering CO2 fertilization effect
  • Increase in food yield up to + 11% (A2 scenario) and +4% (B2 scenario)
  • Crop production will be 572 (A2 scenario) and 615 MT (B2 scenario) by 2030 and 635 (A2 scenario) and 646 MT ((B2 scenario) by 2050
  • Food security index (FSI) will show an increment of +7.1% (A2 scenario) and +20% (B2 scenario)
[136]
Five global climate models and A1F1 and B1 (greenhouse gases emission scenarios)
  • Increase in wheat yield up to 34.4% by 2080 irrespective of CO2 fertilization effect in North China Plain
  • Climate change would have positive impact on the productivity of winter wheat
[137]
Global Climate Model (GCM) and WheatGrow Model
  • Reduction in wheat yield in Northern part of China and increase in wheat yield in South part of China under rainfed conditions
  • Increase in wheat yields in all regions under full-irrigation conditions
  • Improvement in irrigation facilities would help alleviating food insecurity issues
[138]

