Quantitative Assessment of Regional Debris-Flow Risk: A Case Study in Southwest China


Abstract
1. Introduction
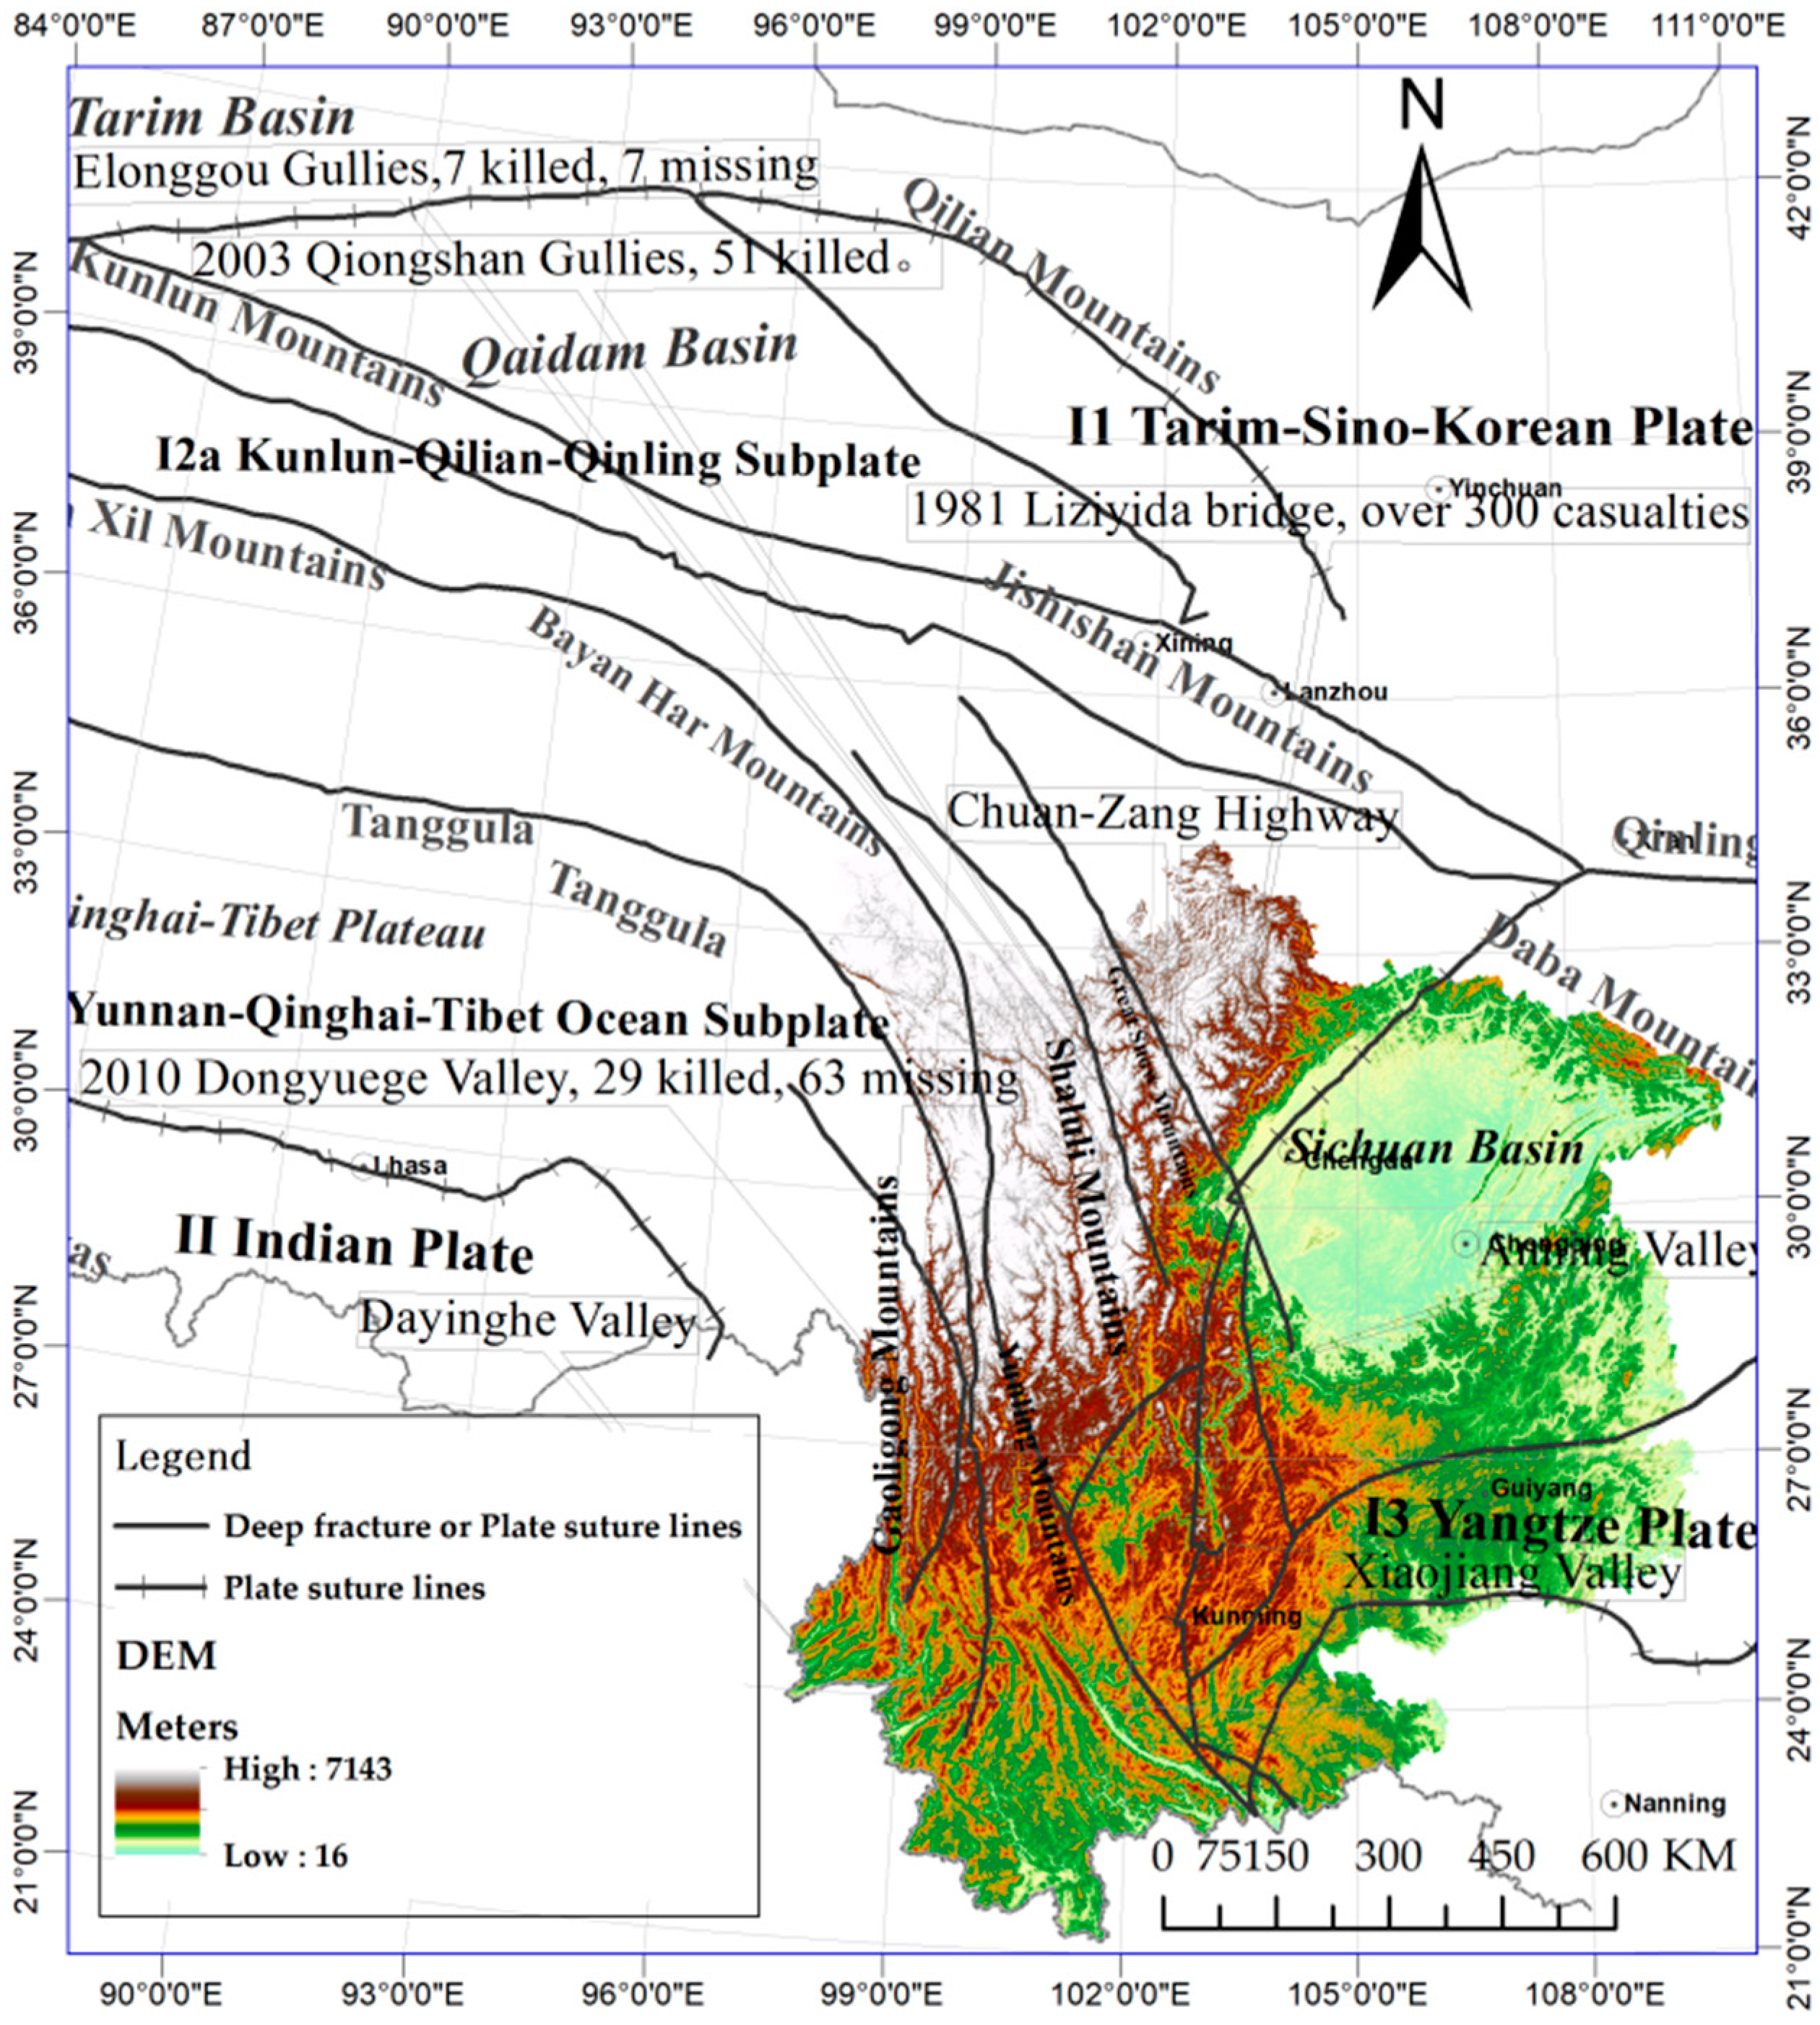
2. Study Area
3. Data and Materials
3.1. Records of Debris-Flow Disasters
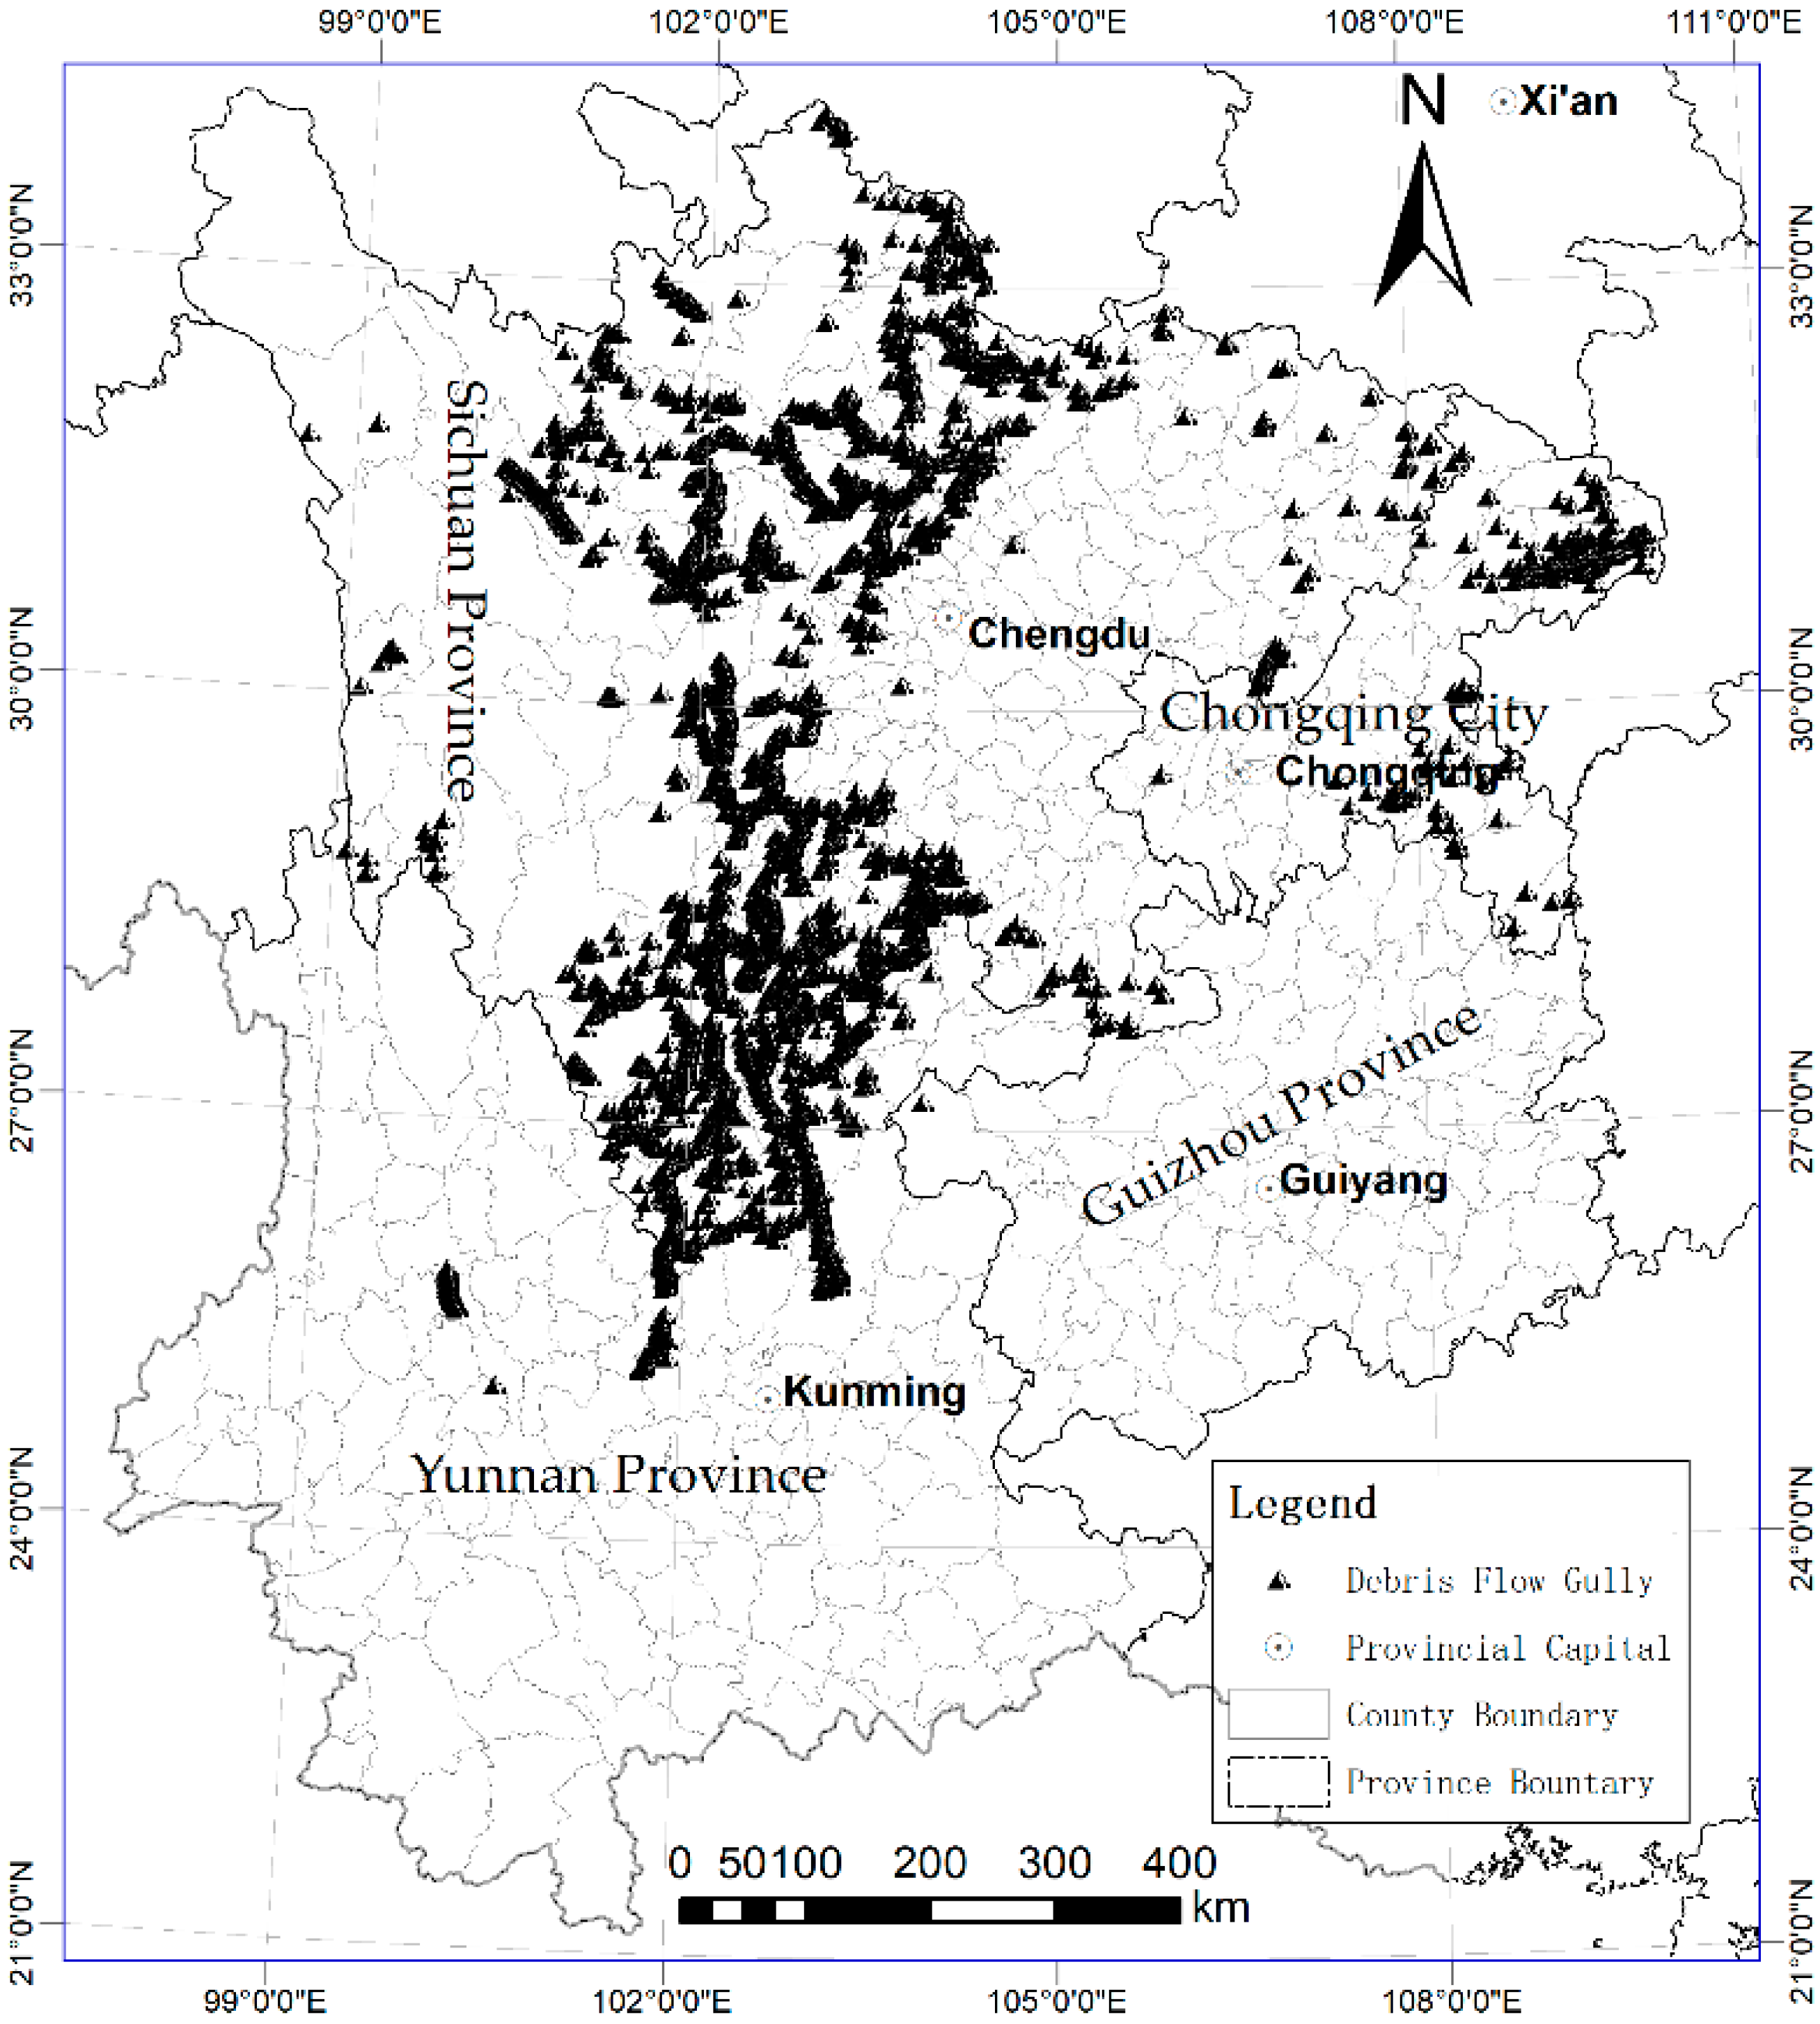
3.2. Spatial Distribution of Debris-Flow Gullies
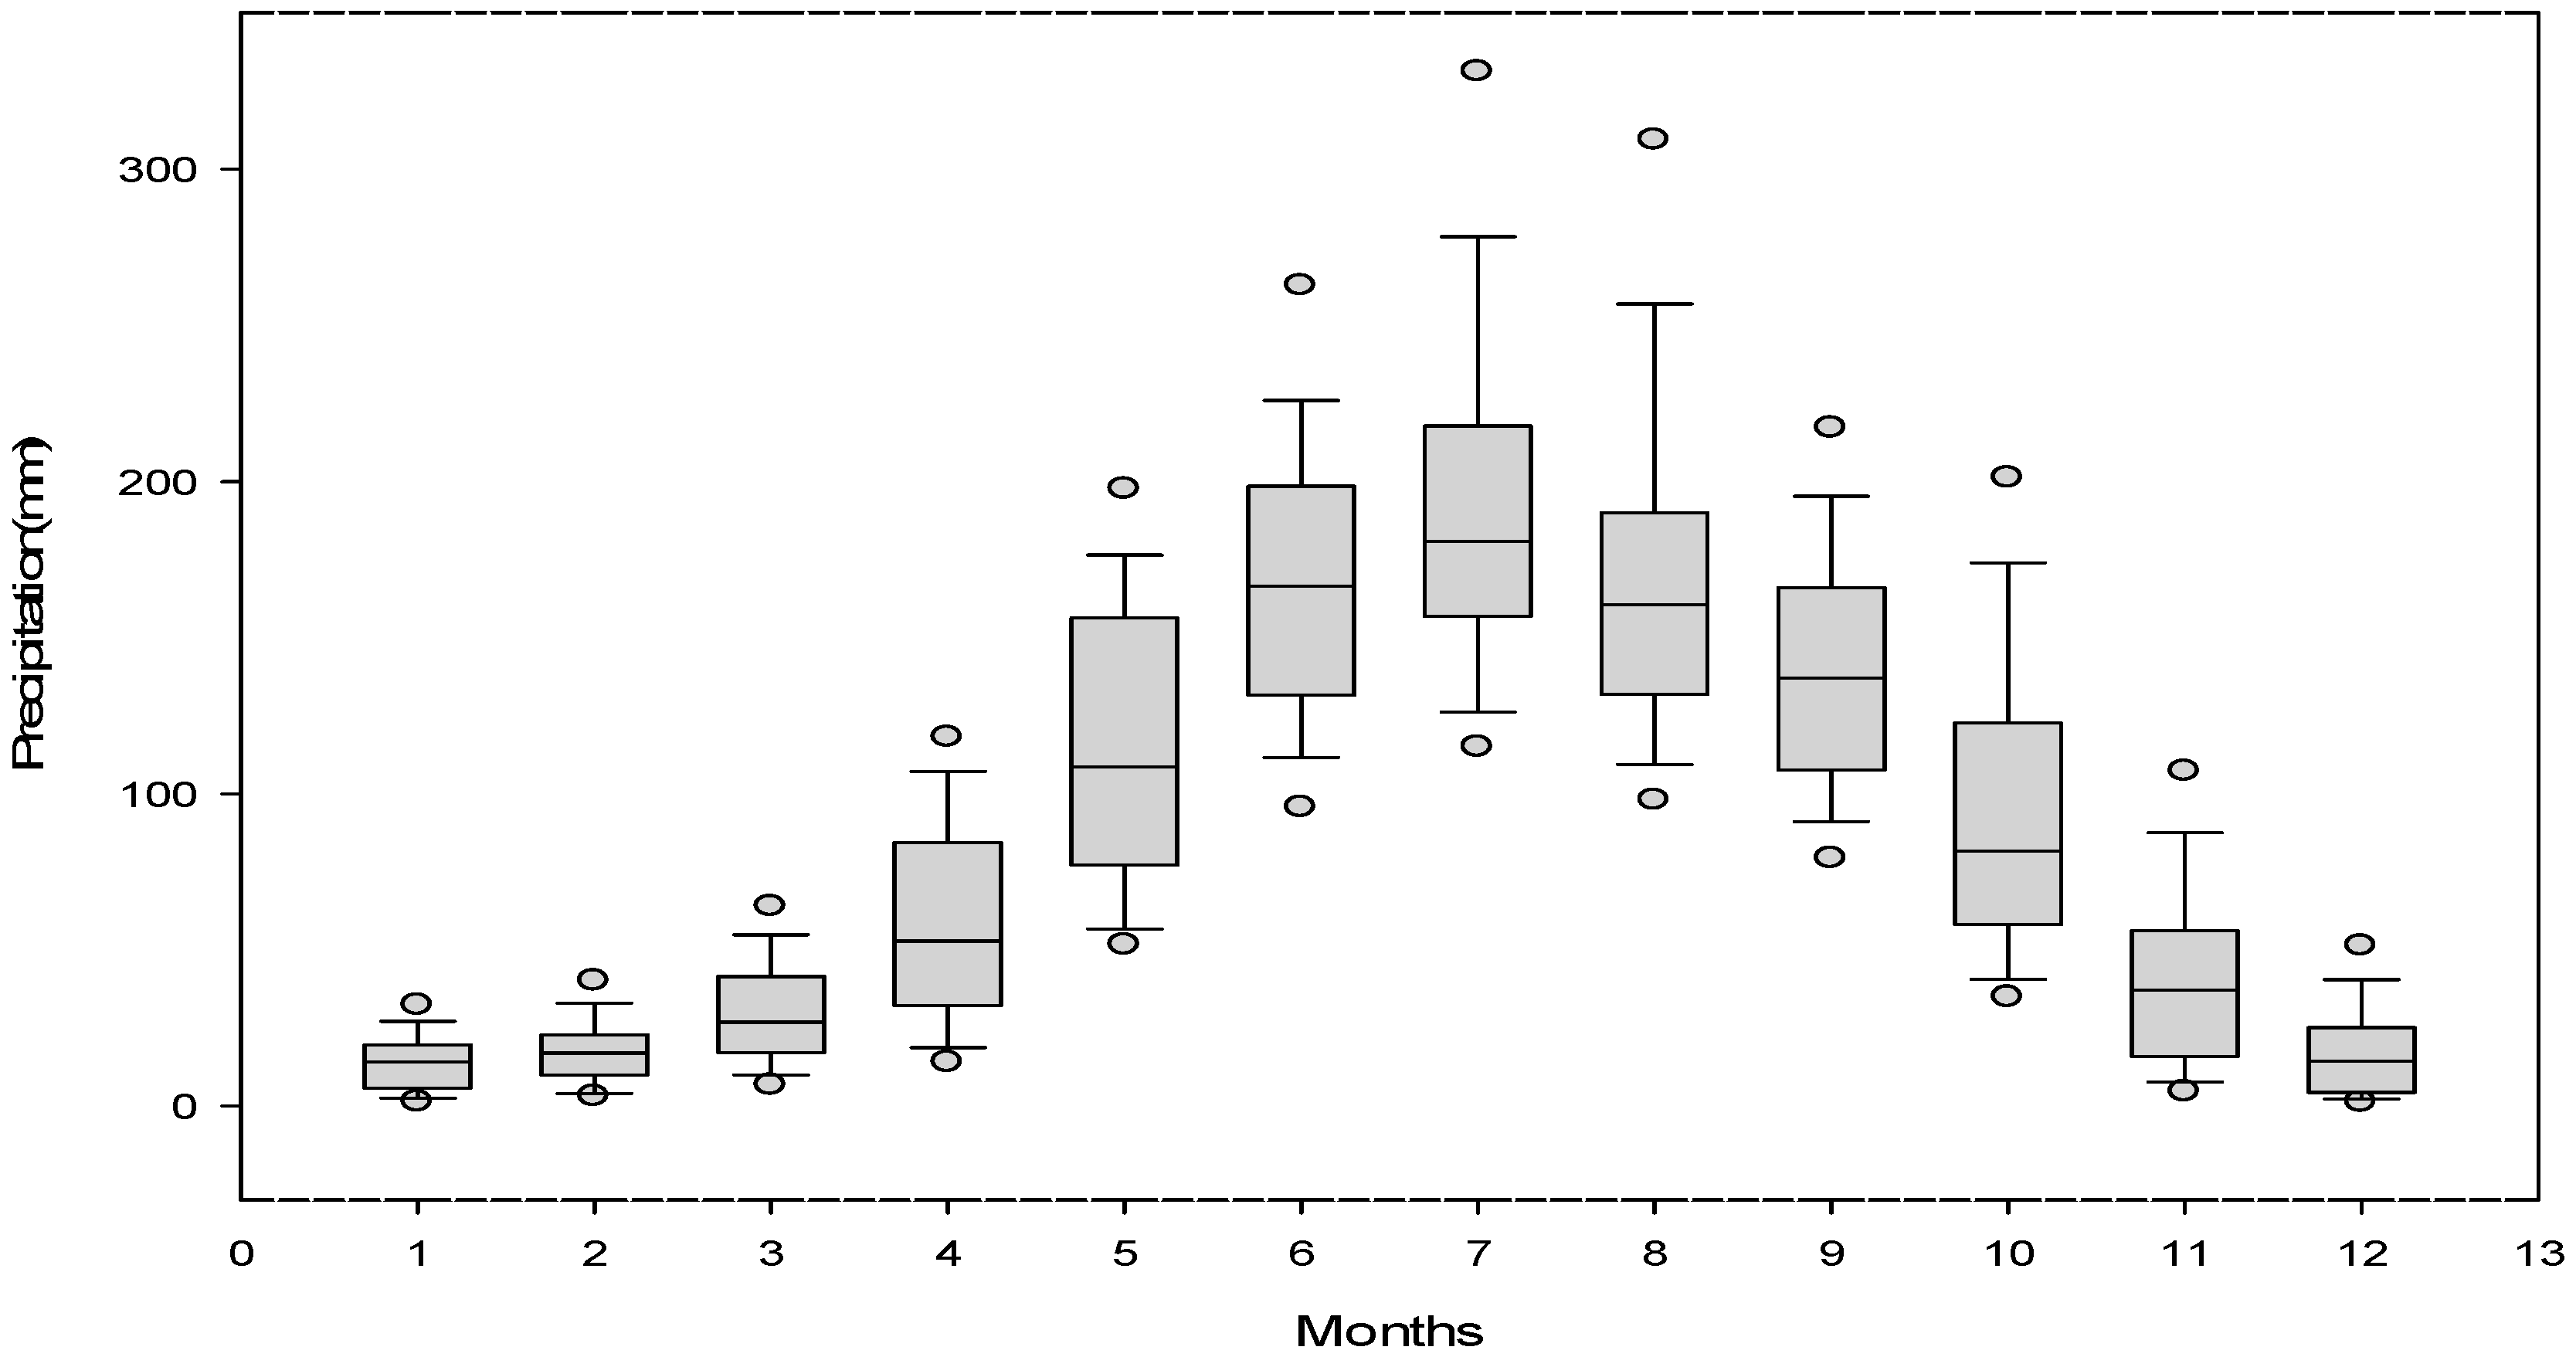
3.3. Disaster-Forming Environmental Data
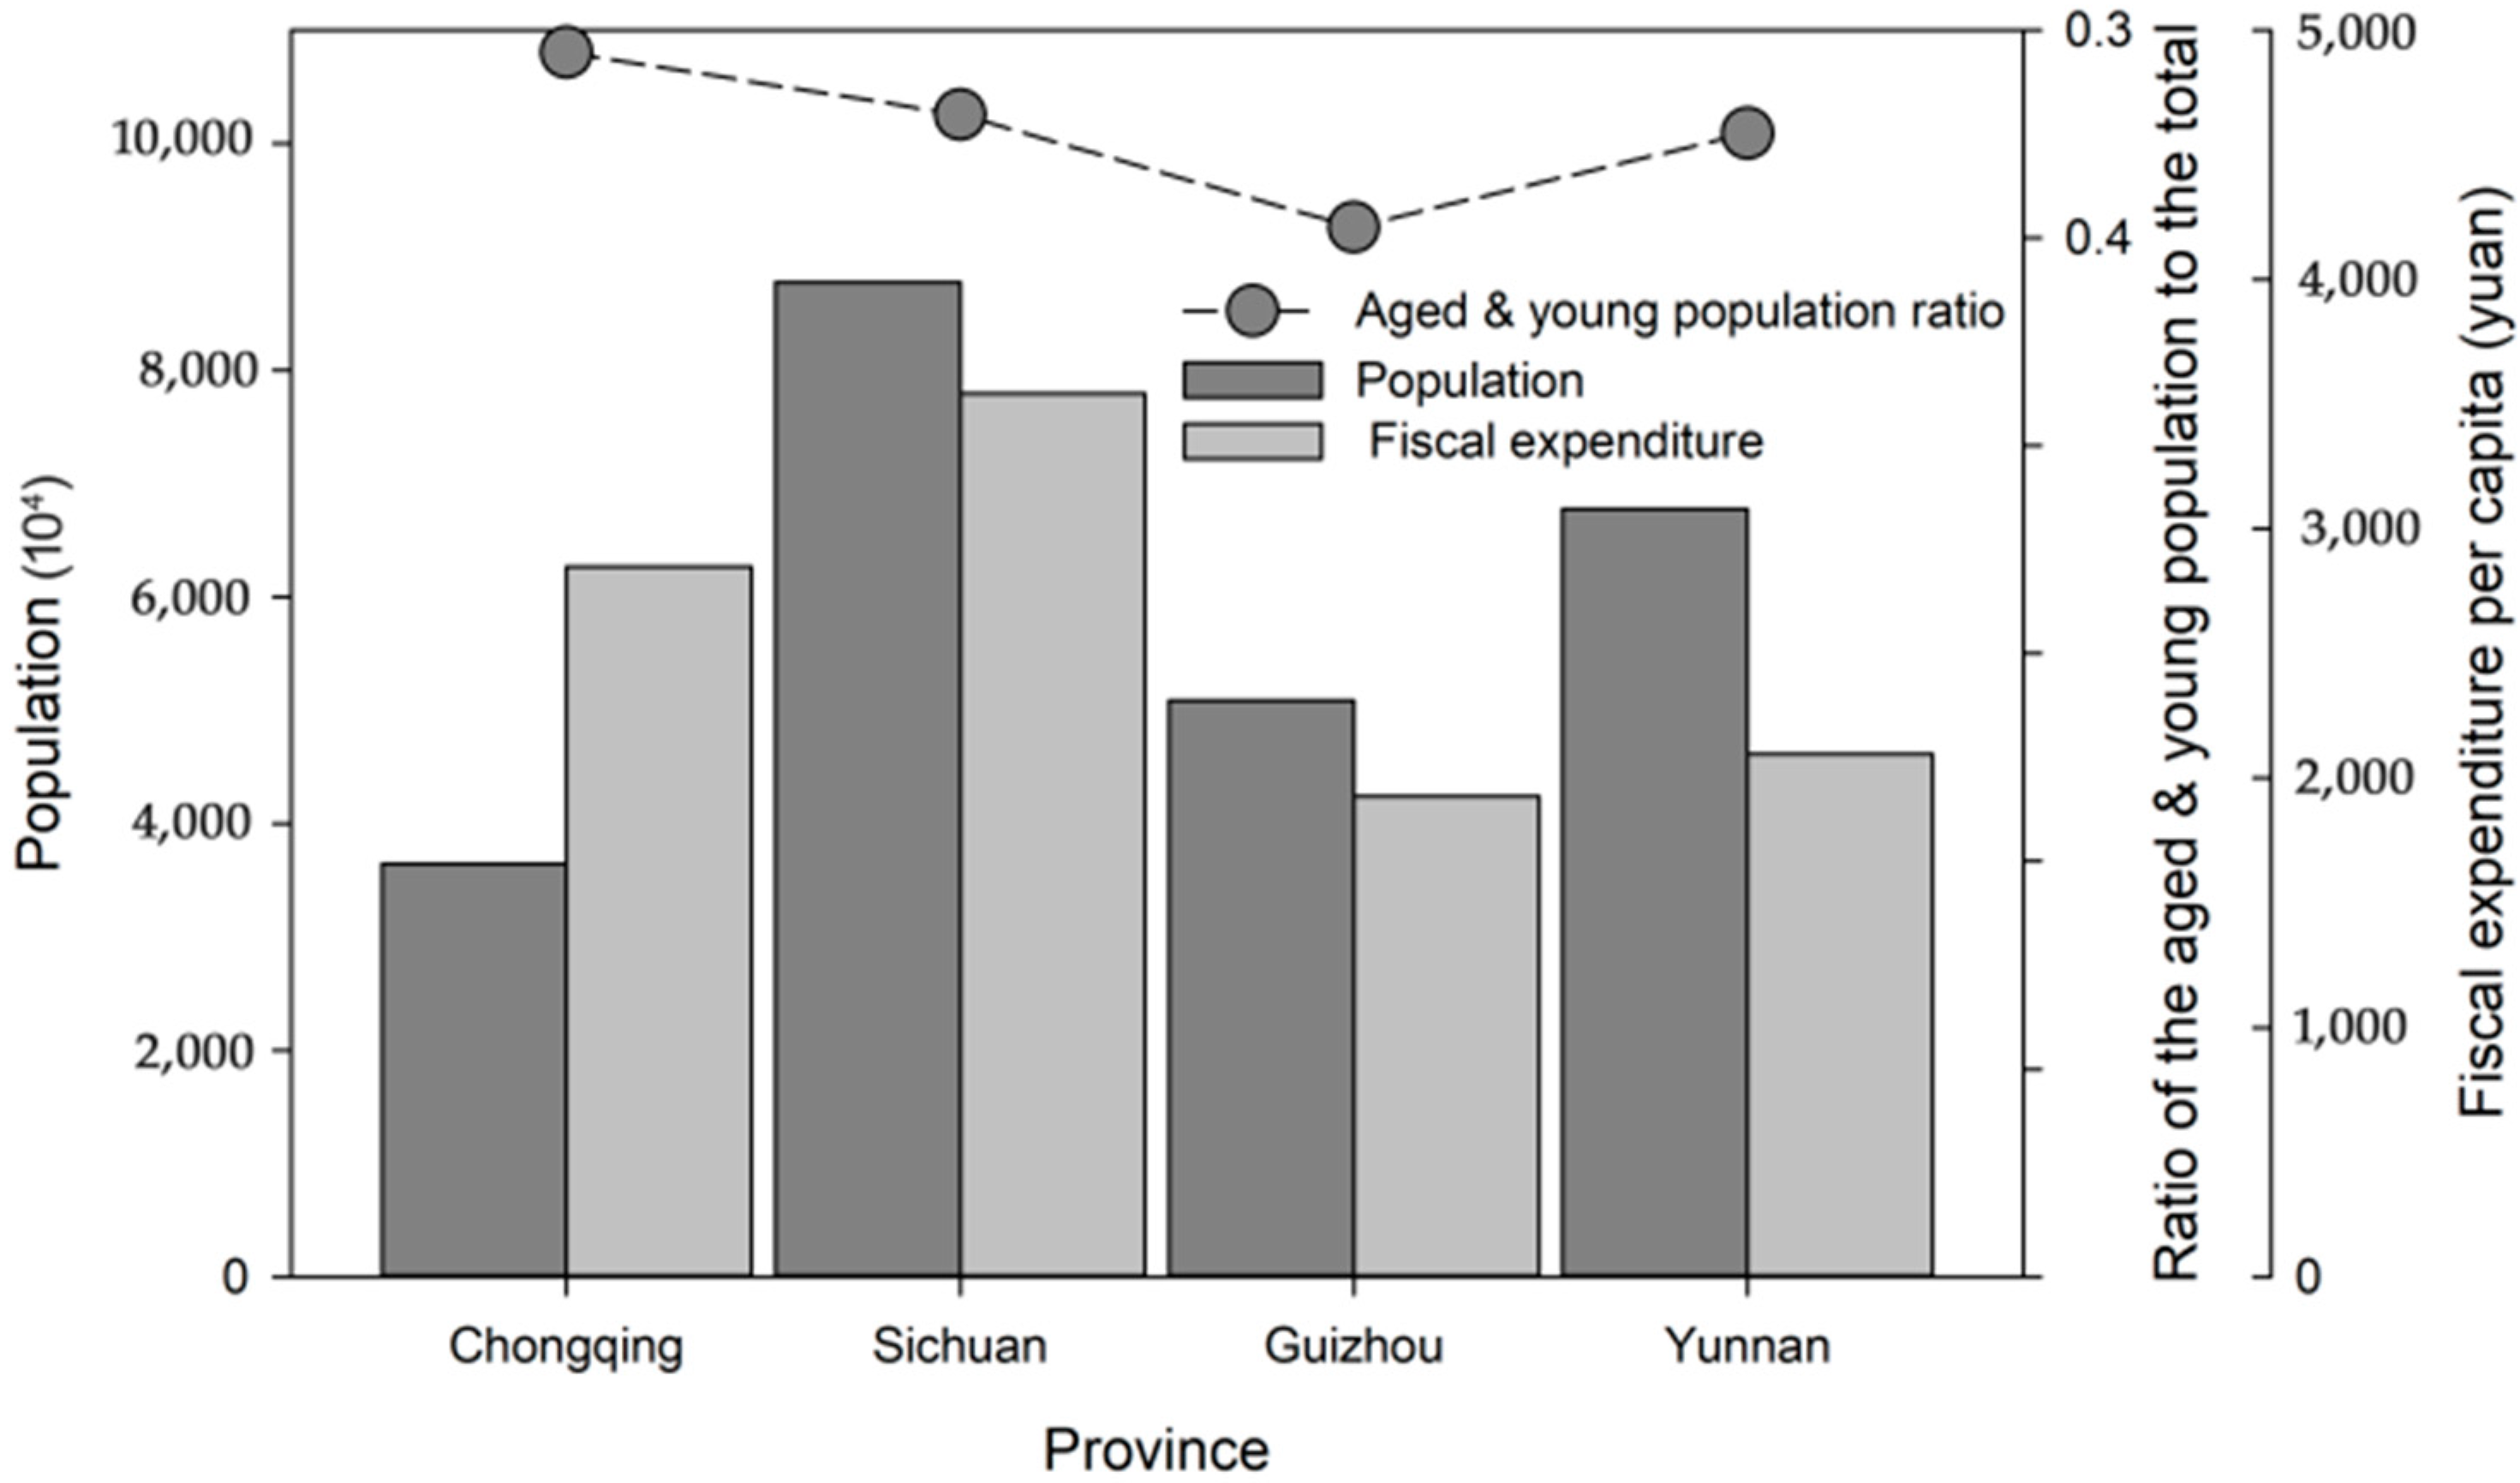
3.4. Demographic Data
4. Methodology
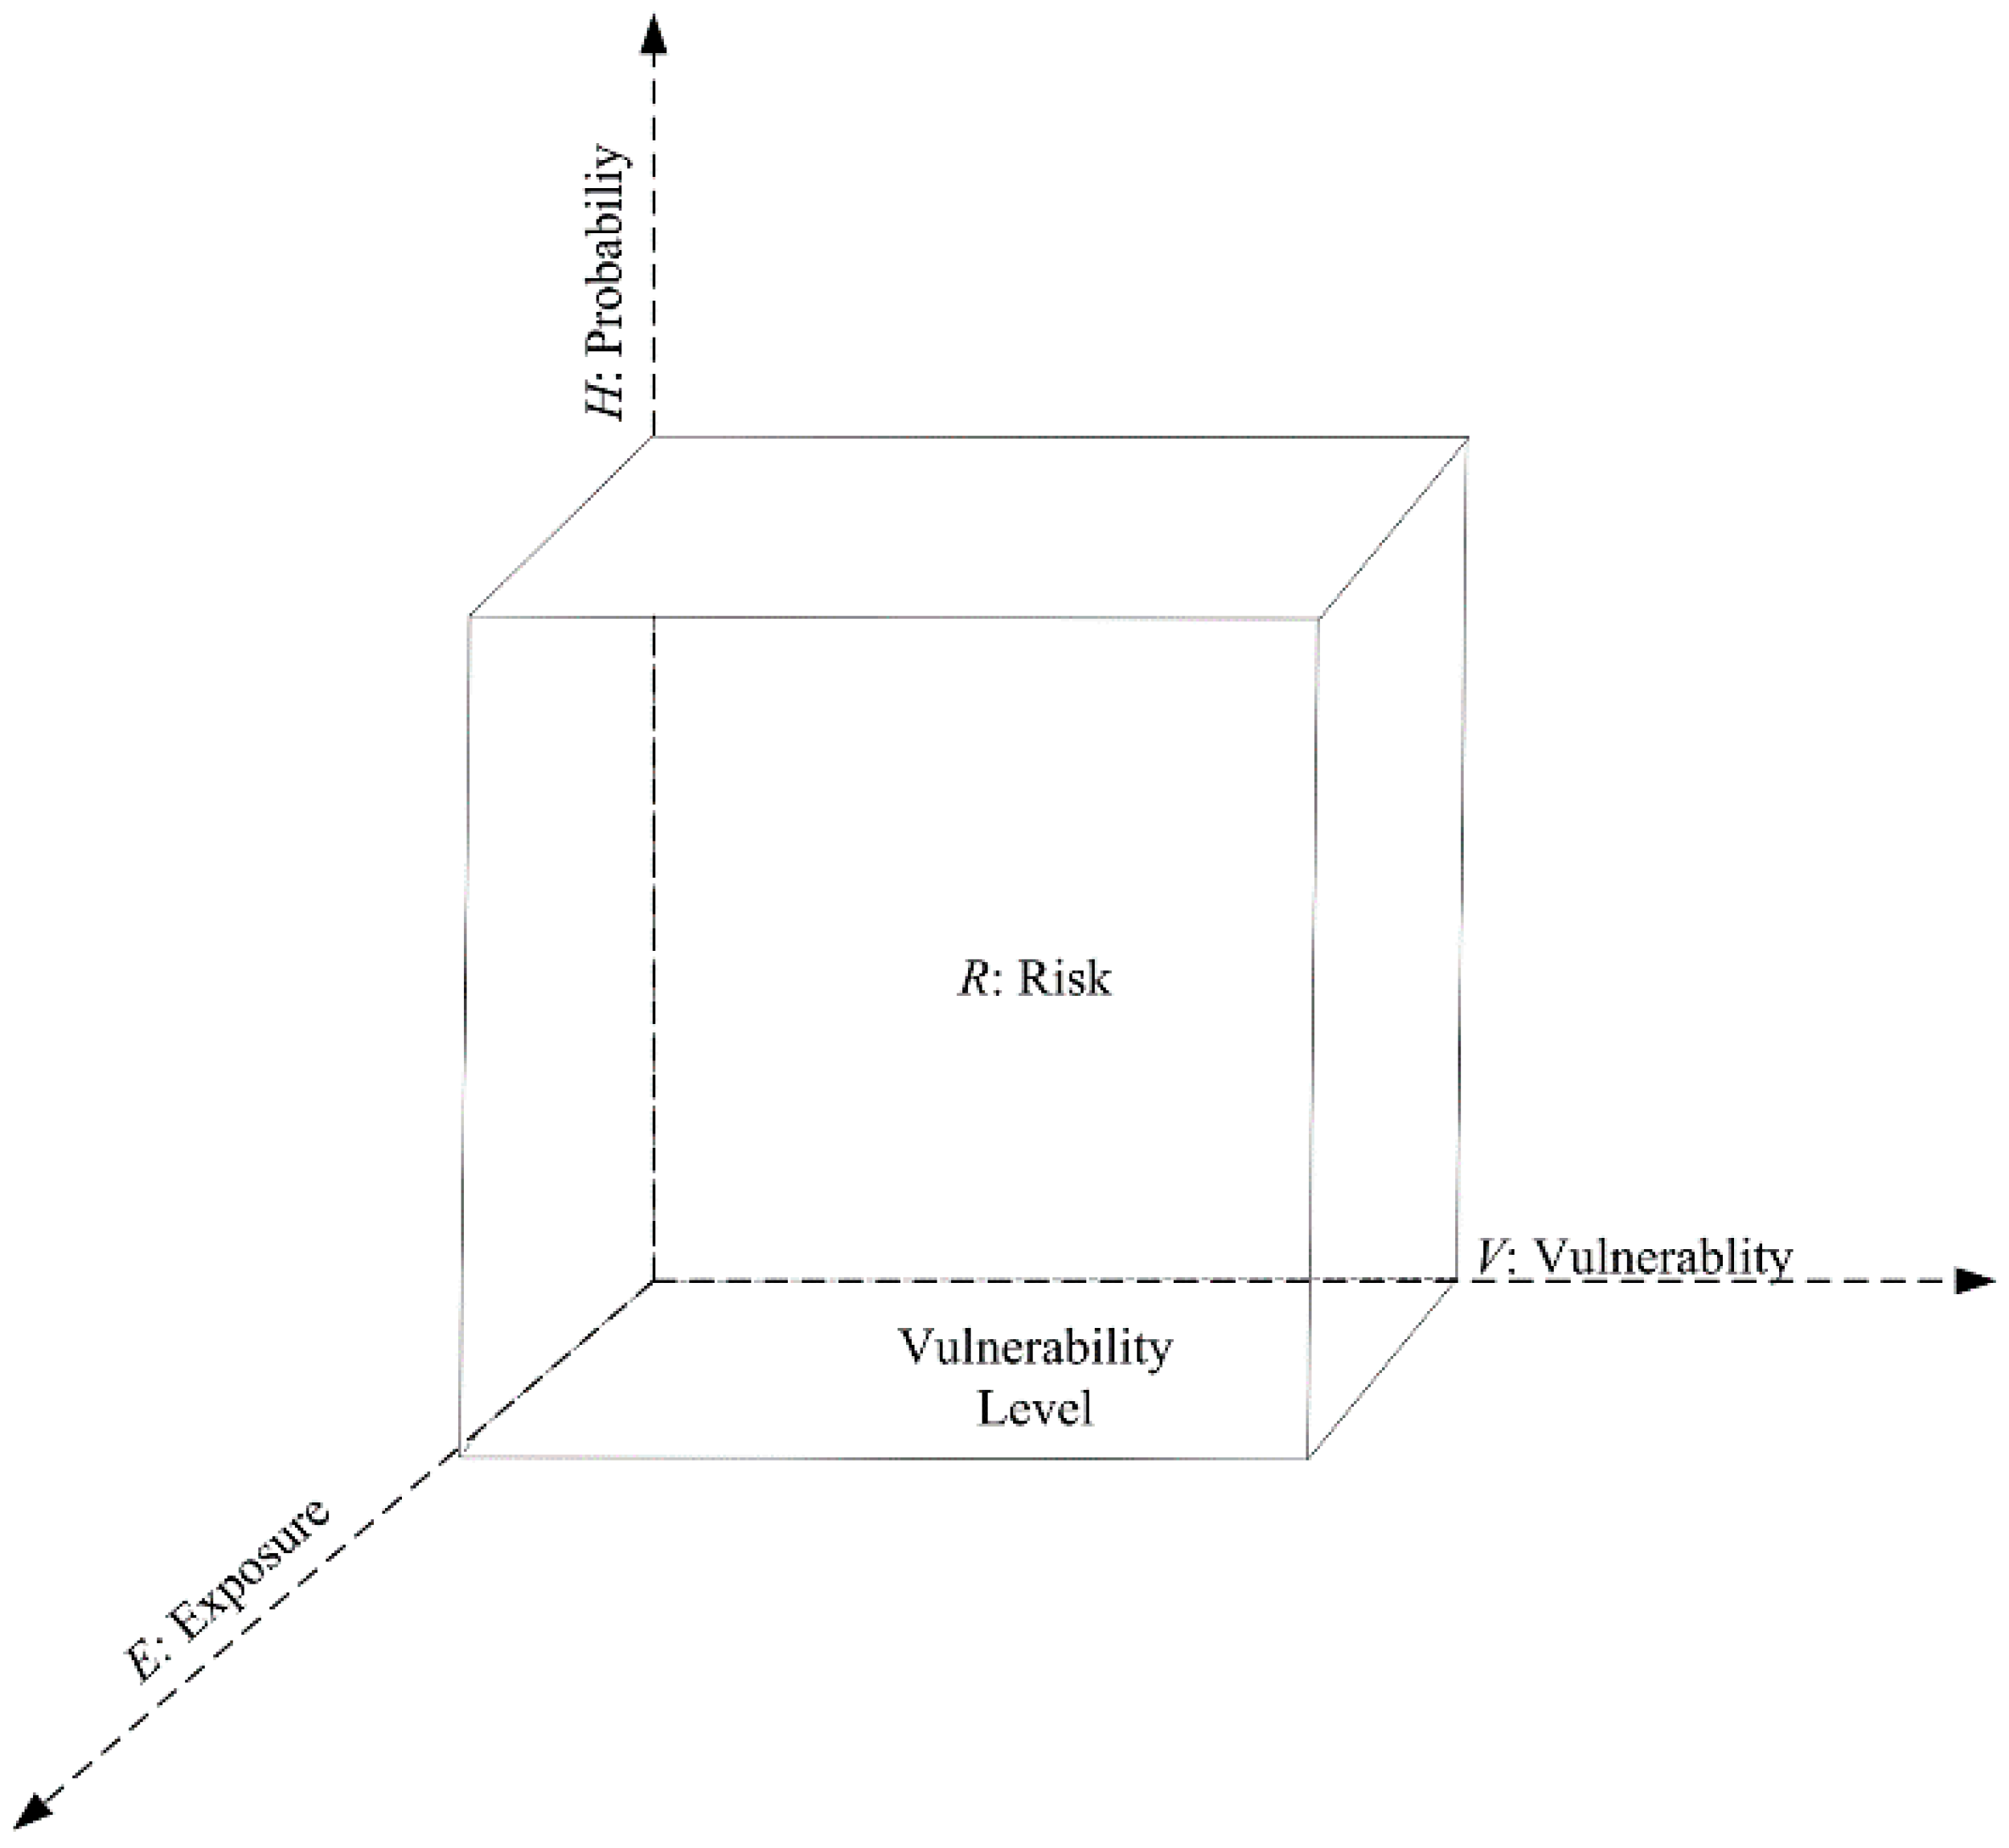
4.1. Risk Estimation Model
4.2. Hazard Evaluation Method
4.2.1. Factors for Debris-Flow Hazard Zoning
4.2.2. Intensity–Frequency Calculation
4.3. Vulnerability Evaluation Model
4.3.1. Vulnerability Zoning Model
- (1)
- Social and economic factors that affect population vulnerability: population (X1), population density (X2), fiscal expenditure per capita (X3), GDP per capita (X5), ratio of the employed population in a rural area to the total population (X6), ratio of the peasant population to the total population (X7), popularized rate of senior high school education (X8), ratio of the population younger than 16 or older than 60 to the total population (X9), urbanization rate (X10), and numbers of beds in hospitals or clinics (X11).
- (2)
- Environmental factors for population vulnerability: annual precipitation (X15), monthly precipitation variation coefficient (X16), number of days with precipitation ≥25 mm (X17), area percentage of land with slopes ≥25° (X18), gully density (X19), and area percentage of cultivated land with slopes ≥25° (X20).
- (3)
- Debris-flow hazard (X21), which is obtained from the results in Section 4.2.
4.3.2. Exposure Calculation Model
4.3.3. Fragility-Rate Statistical Model
5. Results and Discussion
5.1. Hazard Evaluation
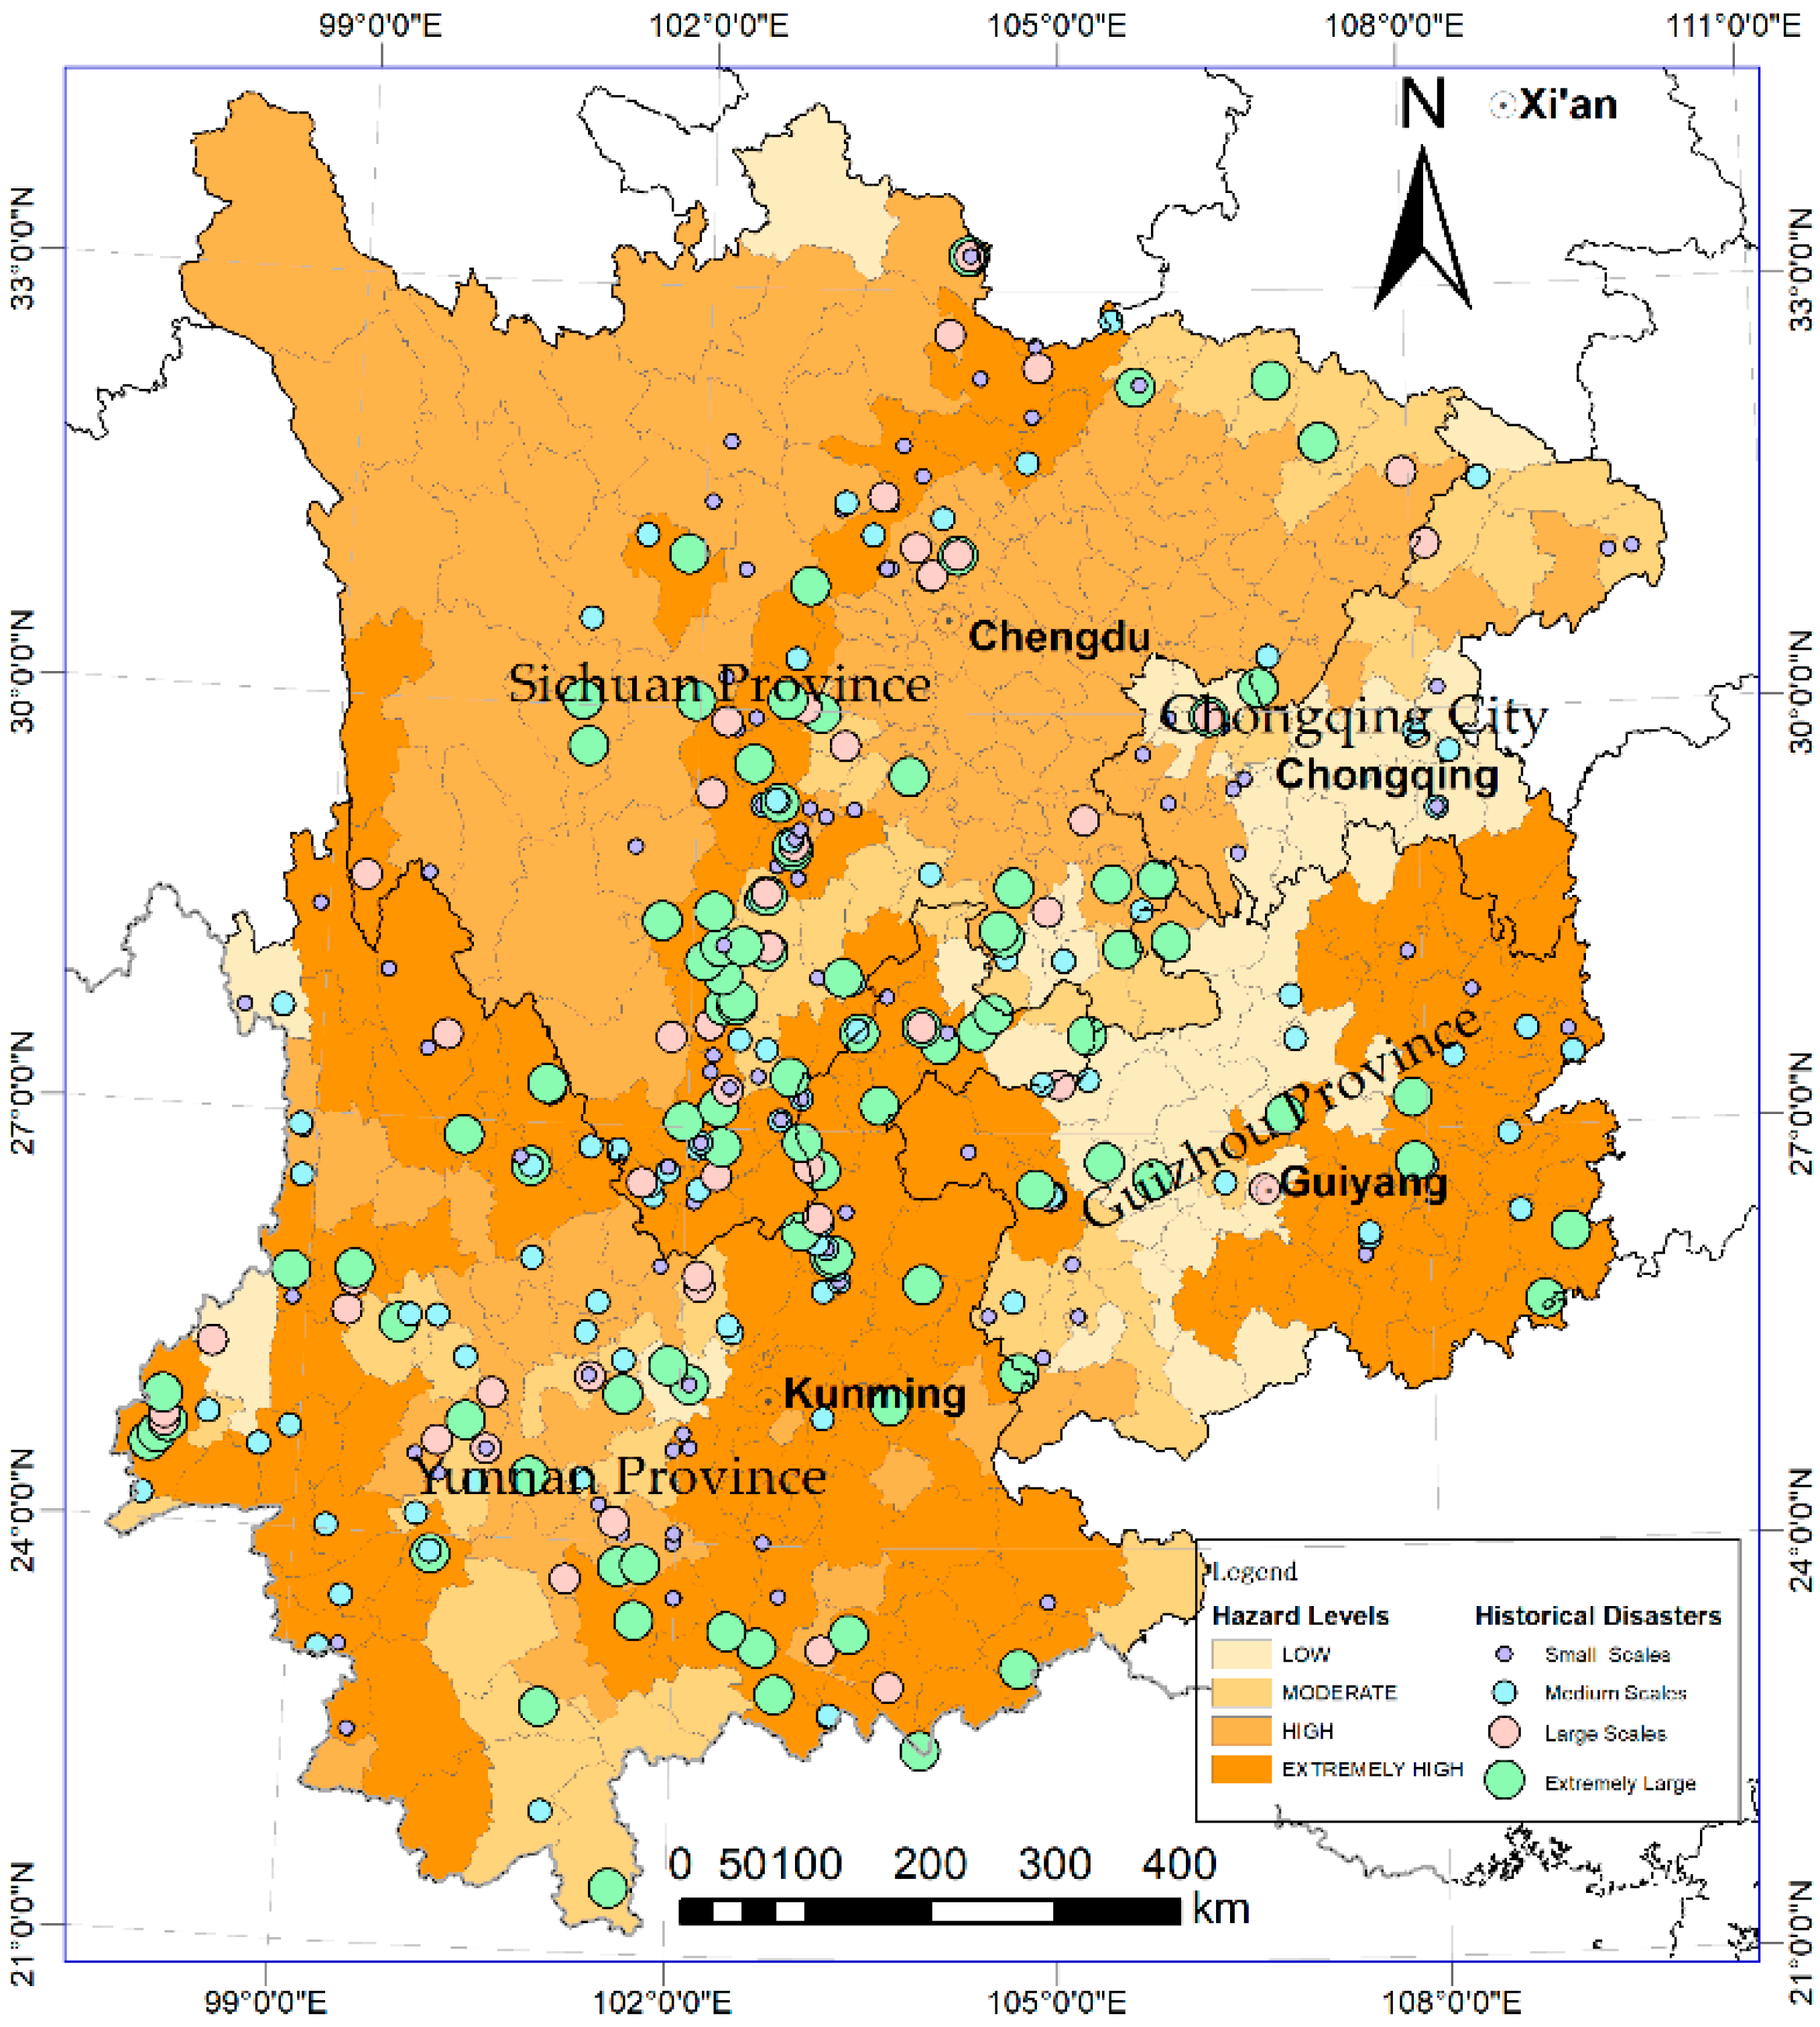
5.1.1. Hazard Zoning
5.1.2. Frequency Calculation
5.2. Vulnerability Estimation
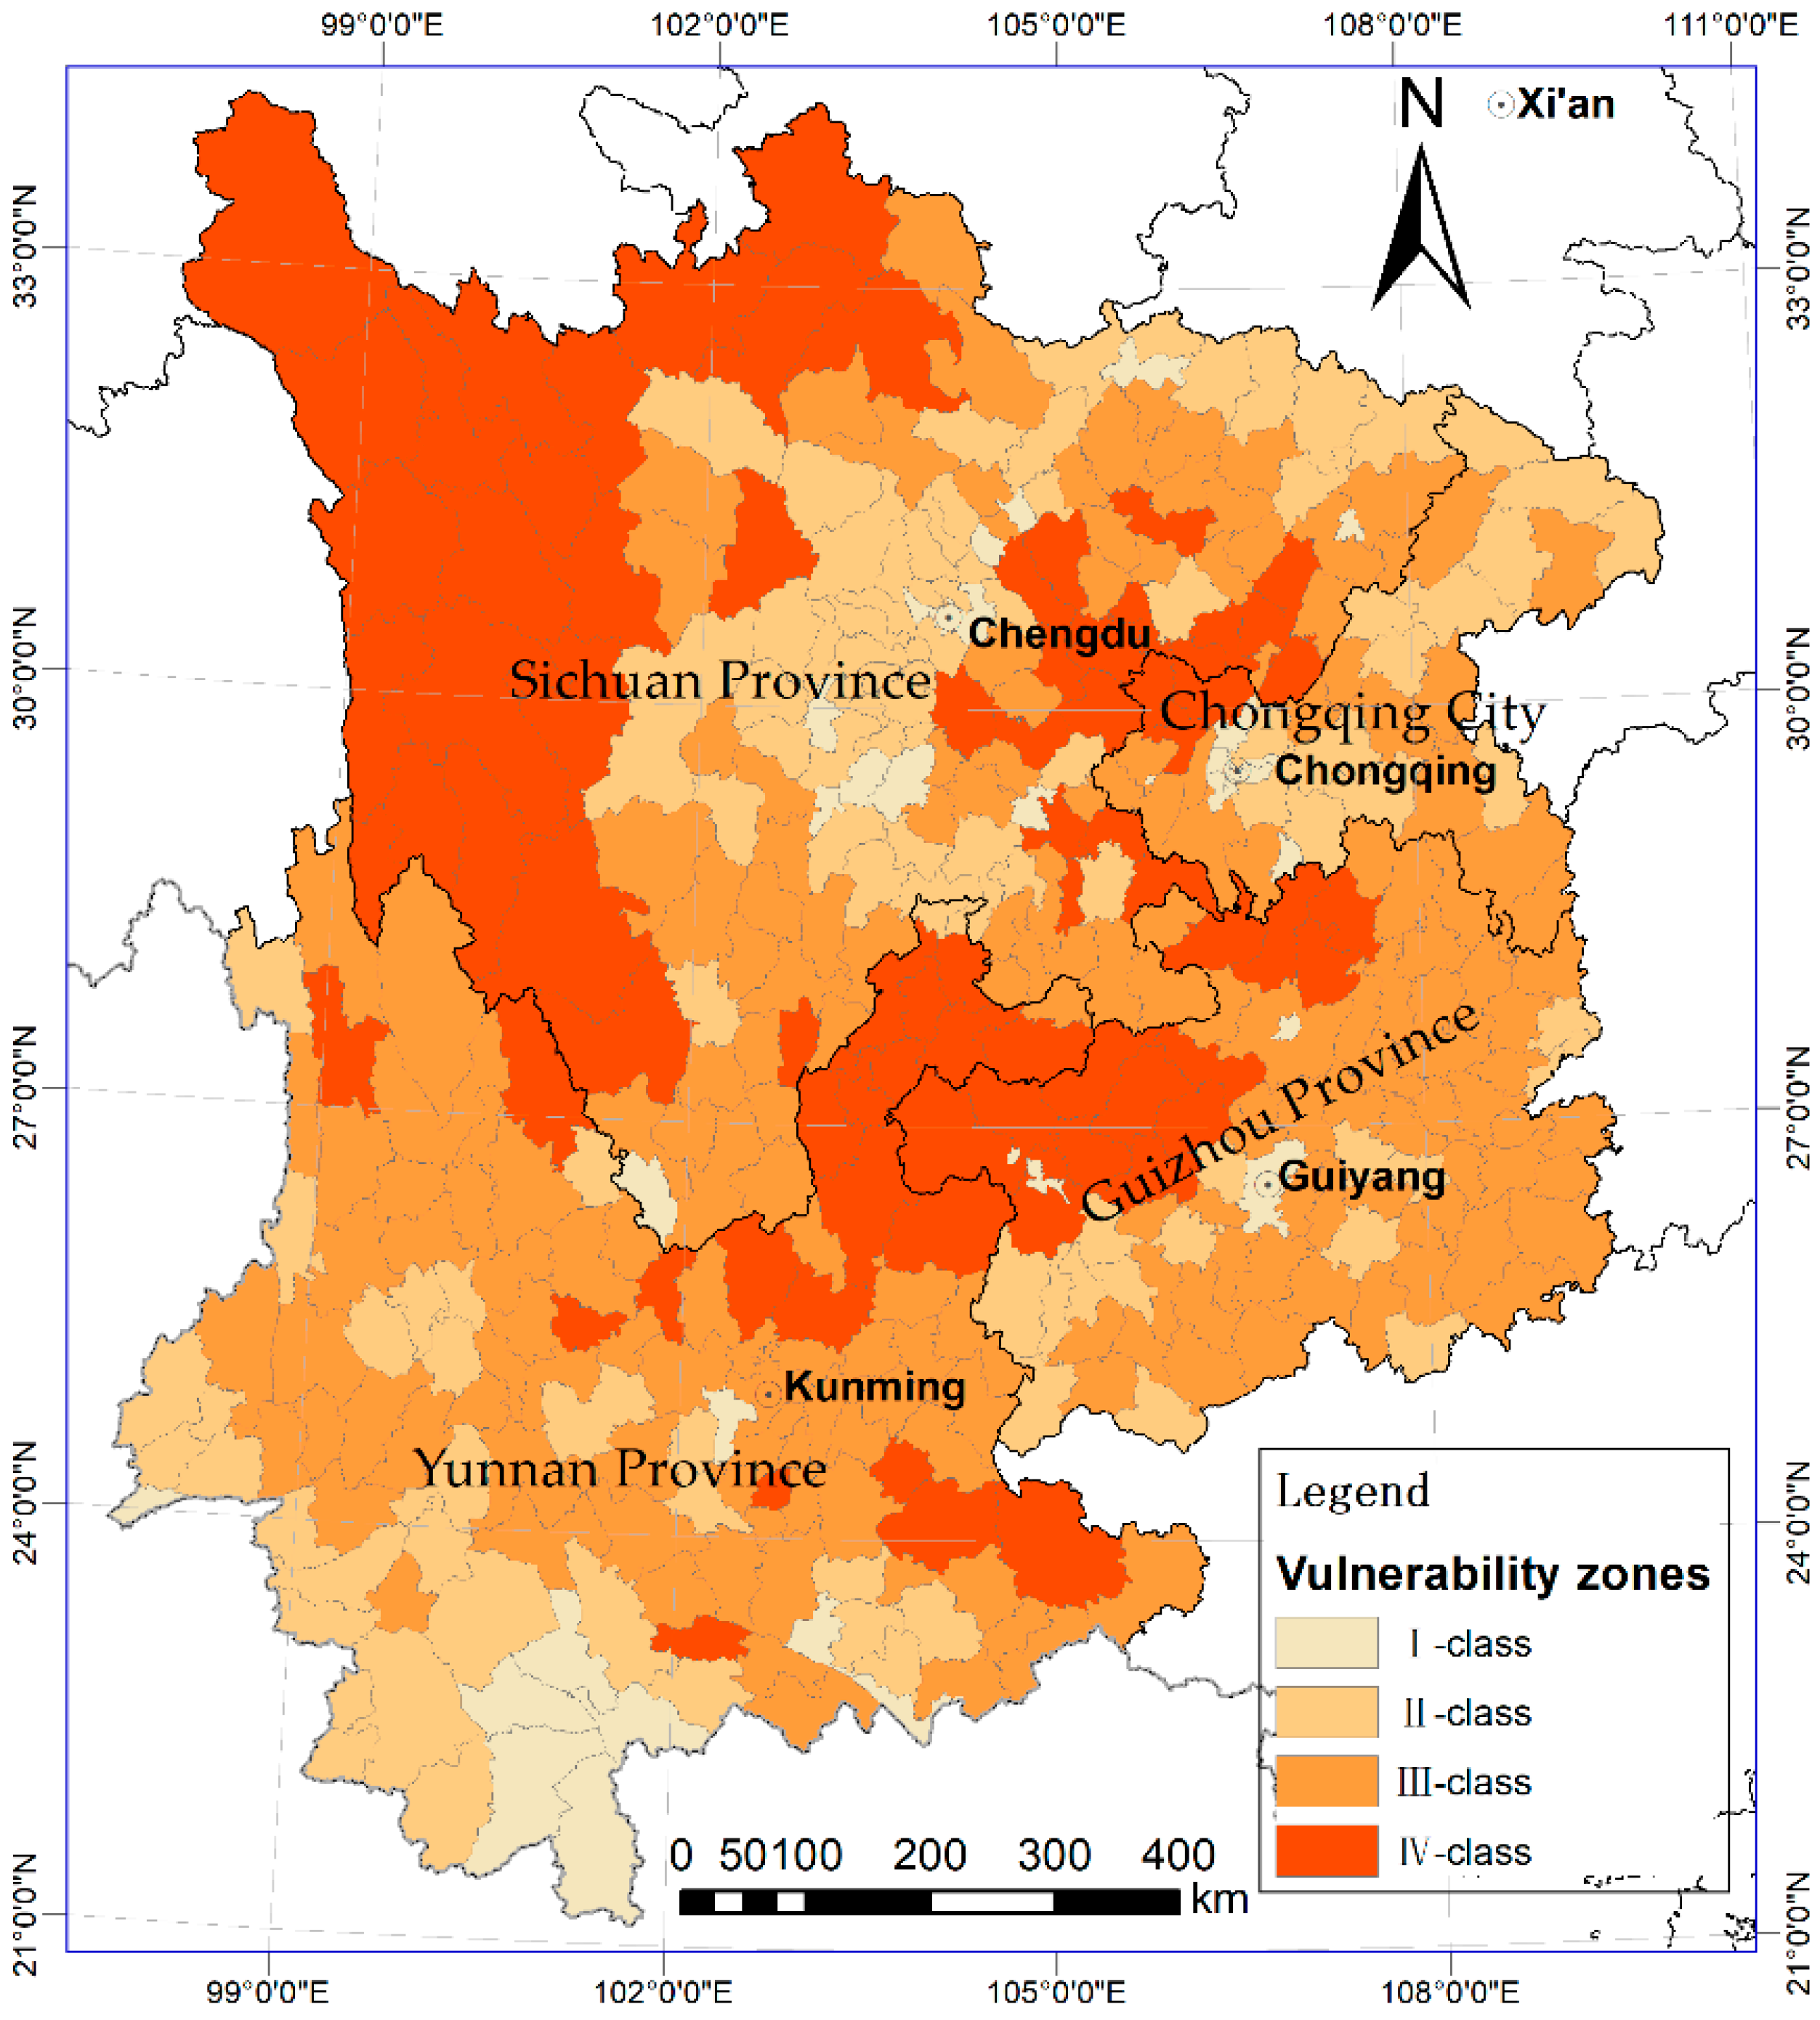
5.2.1. Vulnerability Zoning
5.2.2. Fragility Rate Calculation
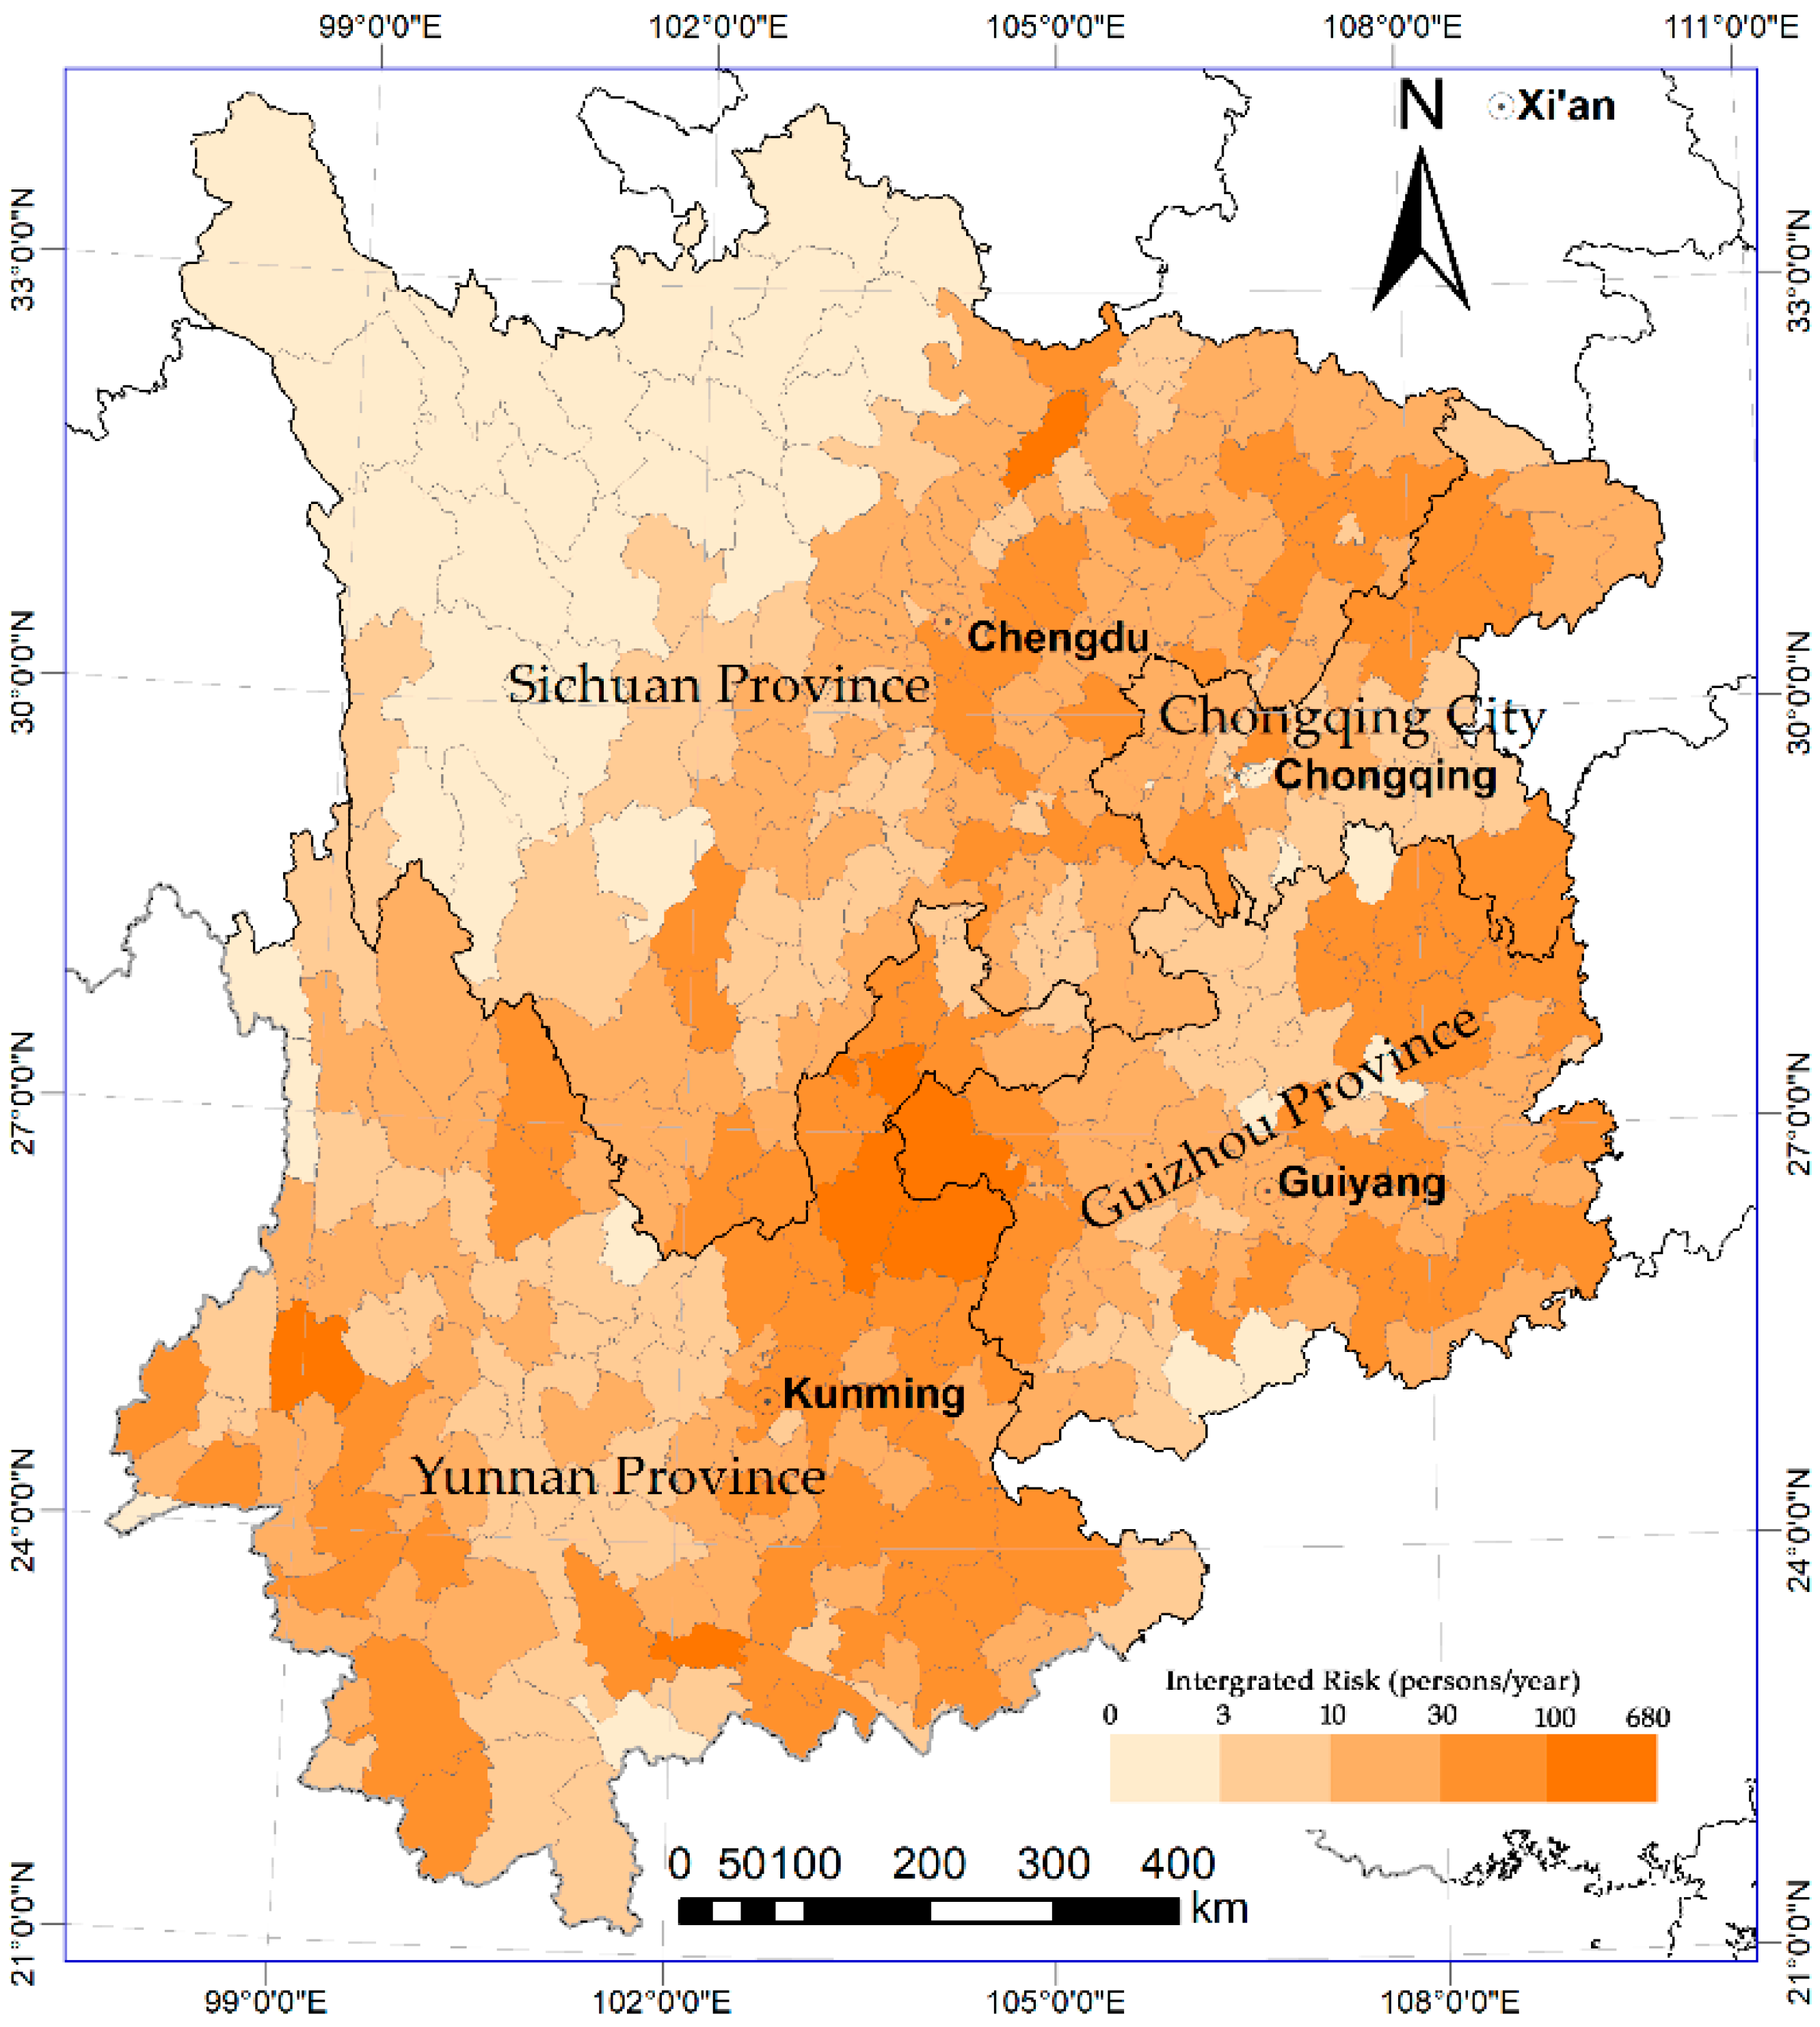
5.3. Risk Estimation
5.4. Discussion
6. Conclusions
- (1)
- Debris flows are mainly spread across the mountainous areas around the Sichuan Basin, the border area between Sichuan and Yunnan, eastern and southern Yunnan Province, and eastern Guizhou Province. More than 200 counties were classified as extremely high- or high-density areas of debris-flow gullies, which cover an area of 580,000 km2 and contain a population of 89.97 million people. An analysis of historical records showed that the hazard level is not exactly consistent with the regional debris-flow gully density. The hazard level is highest in the high-density counties and not in the extremely high-density areas; in the high-density areas, the annual frequency of extremely large-scale debris flows reaches 0.36 and small- and medium-scale events occur almost every year.
- (2)
- The vulnerability of the at-risk population was assessed with a factor analysis model. The results showed that extremely highly vulnerable zones are distributed in 79 counties, including counties to the west and southwest of Sichuan Province, Zhaotong in Yunnan Province, and Bijie in Guizhou Province, which cover an area of approximately 349,000 km2 and have a population of 55,350,000. Their comprehensive fragility rate is 3.89 persons per 10,000 people. In some cases, extremely large debris-flow disasters could result in 14 casualties per 10,000 exposed people. The highly vulnerable zones include 111 counties around the Sichuan Basin, southwestern Yunnan Province and the central and southern regions of Guizhou Province. This area spans 264,000 km2 and contains a population of approximately 48,960,000 people. The comprehensive fragility rate is 3.77 persons per 10,000 people, which is slightly less than that of the extremely high vulnerability zone.
- (3)
- Comprehensive population risk gradually increases from the southeastern region to the central region of SWC, reaches its highest on the Jiangyou–Zhaotong–Baoshan Line, and then gradually reduces to its lowest in the northwestern region. Specifically, the extremely high-risk counties with extremely large-scale disasters include Zhaotong, Honghe, Baoshan, and Xuanwei in Yunnan Province and Weining in Guizhou Province. These regions are scattered throughout the central region of SWC, with population risks of up to 100 persons/year. The counties around the extremely high-risk zones—such as Wanzhou, Youyang, Xiushan, Yunyang, and Jiangjin in Chongqing City, Huize and Guangnan in Yunnan Province, Jiaoyou and Xichang in Sichuan Province, and Shuicheng and Hezhang in Guizhou Province—are characterized by a high annual frequency of debris-flow disasters. Their population risk is over 30 persons/year.
Author Contributions
Funding
Conflicts of Interest
References
- Iverson, R.M. Debris flows: Behaviour and hazard assessment. Geol. Today 2014, 30, 15–20. [Google Scholar] [CrossRef]
- Santi, P.; Hewitt, K.; VanDine, D.; Cruz, E.B. Debris-flow impact, vulnerability, and response. Nat. Hazards 2011, 56, 371–402. [Google Scholar] [CrossRef]
- Takahashi, T. Debris Flow: Mechanics, Prediction and Countermeasures; CRC Press: Boca Raton, FL, USA, 2014. [Google Scholar]
- Glade, T. Linking debris-flow hazard assessments with geomorphology. Geomorphology 2005, 66, 189–213. [Google Scholar] [CrossRef]
- Dieter, R. Debris-flow hazard assessment and methods applied in engineering practice. Int. J. Eros. Control Eng. 2016, 9, 81–90. [Google Scholar]
- He, Y.P.; Xie, H.; Cui, P.; Wei, F.Q.; Zhong, D.L.; Gardner, J.S. GIS-based hazard mapping and zonation of debris flows in xiaojiang basin, Southwestern China. Environ. Geol. 2003, 45, 286–293. [Google Scholar] [CrossRef]
- Cardona, O.-D.; van Aalst, M.K.; Birkmann, J.; Fordham, M.; McGregor, G.; Mechler, R. Determinants of risk: Exposure and vulnerability. In Managing the Risks of Extreme Events and Disasters to Advance Climate Change Adaptation; Field, C.B., Barros, V., Stocker, T.F., Qin, D., Dokken, D.J., Ebi, K.L., Mastrandrea, M.D., Mach, K.J., Plattner, G.-K., Allen, S.K., et al., Eds.; Cambridge University Press: Cambridge, UK; New York, NY, USA, 2012; pp. 65–108. [Google Scholar]
- Alexander, D. Natural disasters: A framework for research and teaching. Disasters 1991, 15, 209–226. [Google Scholar] [CrossRef] [PubMed]
- Xu, W.; Jing, S.; Yu, W.; Wang, Z.; Zhang, G.; Huang, J. A comparison between bayes discriminant analysis and logistic regression for prediction of debris flow in Southwest Sichuan, China. Geomorphology 2013, 201, 45–51. [Google Scholar] [CrossRef]
- Jeffers, J.M. Integrating vulnerability analysis and risk assessment in flood loss mitigation: An evaluation of barriers and challenges based on evidence from Ireland. Appl. Geogr. 2013, 2013, 44–51. [Google Scholar] [CrossRef]
- Liang, W.; Zhuang, D.; Jiang, D.; Pan, J.; Ren, H. Assessment of debris flow hazards using a bayesian network. Geomorphology 2012, 171, 94–100. [Google Scholar] [CrossRef]
- Tsao, T.C.; Hsu, W.K.; Cheng, C.T.; Lo, W.C.; Chen, C.Y.; Chang, Y.L.; Ju, J.P. A preliminary study of debris flow risk estimation and management in Taiwan. In Proceedings of the Interpraevent 2010—International Symposium in Pacific Rim, Taibei, Taiwan, 26–30 April 2010; pp. 930–939. [Google Scholar]
- Calvo, B.; Savi, F. A real-world application of Monte Carlo procedure for debris flow risk assessment. Comput. Geosci. 2009, 35, 967–977. [Google Scholar] [CrossRef]
- Stancanelli, L.M.; Peres, D.J.; Cancelliere, A.; Foti, E. A combined triggering-propagation modeling approach for the assessment of rainfall induced debris flow susceptibility. J. Hydrol. 2017, 550, 130–143. [Google Scholar] [CrossRef]
- Liu, G.; Dai, E.; Ge, Q.; Wu, W.; Xu, X. A similarity-based quantitative model for assessing regional debris-flow hazard. Nat. Hazards 2013, 69, 295–310. [Google Scholar] [CrossRef]
- Procter, E.; Bollschweiler, M.; Stoffel, M.; Neumann, M. A regional reconstruction of debris-flow activity in the Northern Calcareous Alps, Austria. Geomorphology 2011, 132, 41–50. [Google Scholar] [CrossRef]
- Kappes, M.; Malet, J.-P.; Remaître, A.; Horton, P.; Jaboyedoff, M.; Bell, R. Assessment of debris-flow susceptibility at medium-scale in the Barcelonnette basin, France. Nat. Hazards Earth Syst. Sci. 2011, 11, 627–641. [Google Scholar] [CrossRef]
- Yang, Z. Relationship between geomorphology and plate tectonics movement in Southwest China. J. Southwest China Norm. Univ. (Nat. Sci. Ed.) 1982, 4, 34–40. [Google Scholar]
- Dilley, M.; Chen, R.S.; Deichmann, U. Natural Disaster Hotspots: A Global RISK Analysis; Hazard Management Unit, World Bank: Washington, DC, USA, 2005; pp. 1–132. [Google Scholar]
- Fell, R.; Corominas, J.; Bonnard, C.; Cascini, L.; Leroi, E.; Savage, W.Z. Guidelines for landslide susceptibility, hazard and risk zoning for land use planning. Eng. Geol. 2008, 102, 85–98. [Google Scholar] [CrossRef]
- IUGS Working Group on Landslides, Committee on Risk Assessment. Quantitative risk assessment for slopes and landslides: State of the art. In Proceedings of the International Workshop on Landslides Risk Assessment, Honolulu, HI, USA, 19–21 February 1997; Cruduen, D.M., Fell, R., Eds.; Balkema: Rotterdam, The Netherlands, 1997; pp. 3–12. [Google Scholar]
- Gentile, F.; Bisantino, T.; Trisorio, L.G. Debris-flow risk analysis in south Gargano watersheds (Southern-Italy). Nat. Hazards 2008, 44, 1–17. [Google Scholar] [CrossRef]
- UNISDR. Terminology of Disaster Risk Reduction. Available online: http://www.unisdr.org/eng/library/lib-terminology-eng%20home.htm (accessed on 12 November 2012).
- Chan, J.; Tong, T. Multi-criteria material selections and end-of-life product strategy: Gray relational analysis approach. Mater. Des. 2007, 28, 1539–1546. [Google Scholar] [CrossRef]
- UNISDR. 2009 UNISDR Terminology on Disaster Risk Reduction. Available online: http://www.unisdr.org/we/inform/publications/7817 (accessed on 18 June 2017).
- Cutter, S.L.; Mitchell, J.T.; Scott, M.S. Revealing the vulnerability of people and places: A case study of Georgetown County, South Carolina. Ann. Assoc. Am. Geogr. 2004, 90, 713–737. [Google Scholar] [CrossRef]
- Du, X.; Lin, X. Conceptual model on regional natural disaster risk assessment. Procedia Eng. 2012, 45, 96–100. [Google Scholar] [CrossRef]
- Cutter, S.L.; Boruff, B.J.; Shirley, W.L. Social vulnerability to environmental hazards. Soc. Sci. Q. 2003, 84, 242–261. [Google Scholar] [CrossRef]
- Huang, J.; Liu, Y.; Ma, L.; Su, F. Methodology for the assessment and classification of regional vulnerability to natural hazards in China: The application of a DEA model. Nat. Hazards 2013, 2013, 115–134. [Google Scholar] [CrossRef]
- Kellenberg, D.K.; Mobarak, A.M. Does rising income increase or decrease damage risk from natural disasters? J. Urban Econ. 2008, 63, 788–802. [Google Scholar] [CrossRef]
- Bartholomew, D.; Steele, F.; Galbraith, J.; Moustaki, I. Analysis of Multivariate Social Science Data; Taylor & Francis: Abingdon, UK, 2008. [Google Scholar]
- Di, B.F.; Chen, N.S.; Cui, P.; Li, Z.L.; He, Y.P.; Gao, Y.C. GIS-based risk analysis of debris flow: An application in Sichuan, Southwest China. Int. J. Sediment Res. 2008, 23, 138–148. [Google Scholar] [CrossRef]


| Provinces/Cities | Extremely-Large | Large | Medium | Small 1 |
|---|---|---|---|---|
| Guizhou | 10 | 4 | 18 | 10 |
| Sichuan | 44 | 31 | 37 | 62 |
| Yunan | 46 | 22 | 45 | 56 |
| Chongqing | 1 | 1 | 3 | 9 |
| Total | 101 | 58 | 103 | 137 |
| Types of Debris-Flow Hazard | Numbers of Counties | Classification Criterion: Debris Flow Gully Density (Gullies/103 km2) | Average Debris Flow Gully Density (Gullies/103 km2) |
|---|---|---|---|
| I-type | 22 | ≤2 | 0.87 |
| II-type | 16 | (2, 5) | 3.25 |
| III-type | 16 | (5, 10) | 7.26 |
| IV-type | 20 | ≥10 | 13.94 |
| Category | Indicators 1 | Gray Correlation Degrees Associated with Debris-Flow Gully Density |
|---|---|---|
| Geology | Fault density | 0.7506 |
| Topography | Area percentage of sloping land between 10° and 25° | 0.7506 |
| Precipitation | Number of days with precipitation ≥25 mm | 0.7504 |
| Precipitation | Monthly precipitation variation department | 0.7445 |
| Geology | Weathering coefficient of rocks | 0.7444 |
| Geomorphy | Gully density | 0.7404 |
| Human activities | Area percentage of sloped cultivated land ≥25° | 0.7337 |
| Hazard Zones | Small | Moderate | Large | Extremely-Large | Aggregative Index 1 | Hazard Levels |
|---|---|---|---|---|---|---|
| I-type | 0.03 | 0.06 | 0.01 | 0.04 | 4.61 | Low |
| II-type | 0.13 | 0.03 | 0.04 | 0.11 | 13.22 | High |
| III-type | 0.71 | 0.54 | 0.10 | 0.36 | 46.59 | Extremely high |
| IV-type | 0.09 | 0.26 | 0.02 | 0.09 | 12.23 | Moderate |
| Original Variables | Common Factors | ||||
|---|---|---|---|---|---|
| F1 | F2 | F3 | F4 | F5 | |
| X1 | 0.113 | −0.054 | −0.760 | 0.018 | −0.163 |
| X2 | 0.613 | 0.018 | −0.076 | −0.069 | −0.260 |
| X7 | −0.945 | −0.036 | −0.024 | 0.105 | 0.015 |
| X6 | −0.817 | 0.103 | 0.131 | −0.153 | 0.087 |
| X3 | 0.212 | −0.418 | 0.711 | −0.037 | −0.057 |
| X9 | −0.776 | 0.096 | −0.045 | 0.133 | −0.304 |
| X8 | 0.952 | 0.034 | −0.004 | −0.099 | −0.064 |
| X10 | 0.908 | 0.076 | −0.073 | −0.137 | −0.089 |
| X11 | 0.823 | −0.056 | 0.062 | −0.060 | 0.102 |
| X5 | 0.849 | −0.021 | −0.025 | −0.178 | 0.032 |
| X15 | −0.014 | 0.920 | −0.088 | 0.126 | −0.005 |
| X16 | 0.080 | −0.535 | −0.137 | 0.185 | 0.636 |
| X17 | 0.026 | 0.915 | −0.227 | 0.112 | 0.041 |
| X18 | −0.192 | −0.336 | 0.624 | 0.449 | −0.055 |
| X20 | −0.161 | 0.004 | −0.018 | 0.814 | −0.161 |
| X19 | −0.073 | 0.118 | 0.139 | −0.073 | 0.717 |
| X21 | −0.111 | 0.264 | 0.075 | 0.718 | 0.200 |
| Original Variables | Common Factors | ||||
|---|---|---|---|---|---|
| F1 | F2 | F3 | F4 | F5 | |
| X1 | 0.006 | −0.185 | −0.549 | 0.103 | −0.104 |
| X2 | 0.105 | −0.005 | −0.020 | 0.018 | −0.209 |
| X7 | −0.167 | −0.041 | −0.054 | −0.010 | 0.005 |
| X6 | −0.162 | 0.079 | 0.110 | −0.205 | 0.068 |
| X3 | 0.044 | −0.057 | 0.438 | −0.048 | −0.098 |
| X9 | −0.134 | 0.004 | −0.027 | 0.022 | −0.255 |
| X8 | 0.168 | 0.032 | 0.035 | 0.018 | −0.045 |
| X10 | 0.156 | 0.039 | −0.002 | −0.009 | −0.061 |
| X11 | 0.149 | 0.005 | 0.051 | 0.031 | 0.086 |
| X5 | 0.141 | 0.010 | 0.011 | −0.043 | 0.034 |
| X15 | 0.020 | 0.418 | 0.108 | 0.036 | 0.040 |
| X16 | 0.026 | −0.268 | −0.251 | 0.179 | 0.513 |
| X17 | 0.024 | 0.392 | 0.007 | 0.043 | 0.085 |
| X18 | 0.013 | −0.072 | 0.336 | 0.260 | −0.096 |
| X20 | 0.045 | −0.064 | −0.087 | 0.561 | −0.144 |
| X19 | −0.012 | 0.121 | 0.096 | −0.087 | 0.600 |
| X21 | 0.053 | 0.103 | 0.025 | 0.468 | 0.167 |
| Vulnerability Zones | Extremely-Large | Large | Moderate | Small | Comprehensive Rate 1 | Vulnerability Levels |
|---|---|---|---|---|---|---|
| Class I | 1.16 | 0.25 | 0.09 | 0.00 | 1.49 | Low |
| Class II | 2.69 | 0.60 | 0.40 | 0.07 | 3.77 | High |
| Class III | 1.80 | 0.57 | 0.25 | 0.08 | 2.69 | Medium |
| class IV | 2.25 | 1.02 | 0.38 | 0.23 | 3.89 | Extremely High |
© 2018 by the authors. Licensee MDPI, Basel, Switzerland. This article is an open access article distributed under the terms and conditions of the Creative Commons Attribution (CC BY) license (http://creativecommons.org/licenses/by/4.0/).
Share and Cite
Liu, G.; Dai, E.; Xu, X.; Wu, W.; Xiang, A. Quantitative Assessment of Regional Debris-Flow Risk: A Case Study in Southwest China. Sustainability 2018, 10, 2223. https://doi.org/10.3390/su10072223
Liu G, Dai E, Xu X, Wu W, Xiang A. Quantitative Assessment of Regional Debris-Flow Risk: A Case Study in Southwest China. Sustainability. 2018; 10(7):2223. https://doi.org/10.3390/su10072223
Chicago/Turabian StyleLiu, Guangxu, Erfu Dai, Xinchuang Xu, Wenxiang Wu, and Aicun Xiang. 2018. "Quantitative Assessment of Regional Debris-Flow Risk: A Case Study in Southwest China" Sustainability 10, no. 7: 2223. https://doi.org/10.3390/su10072223
APA StyleLiu, G., Dai, E., Xu, X., Wu, W., & Xiang, A. (2018). Quantitative Assessment of Regional Debris-Flow Risk: A Case Study in Southwest China. Sustainability, 10(7), 2223. https://doi.org/10.3390/su10072223