Article

Scenario-Based Simulation of Tianjin City Using a Cellular Automata–Markov Model

1
Graduate School of Life and Environmental Science, University of Tsukuba, 1-1-1 Tennodai, Tsukuba City, Ibaraki 305-8572, Japan
2
Institute of Remote Sensing and Earth Sciences, Hangzhou Normal University, Yuhangtang Road No. 2318, Hangzhou 311121, China
3
Faculty of Life and Environmental Science, University of Tsukuba,1-1-1 Tennodai, Tsukuba City, Ibaraki 305-8572, Japan
*
Authors to whom correspondence should be addressed.
Sustainability 2018, 10(8), 2633; https://doi.org/10.3390/su10082633
Submission received: 9 July 2018 / Revised: 20 July 2018 / Accepted: 24 July 2018 / Published: 26 July 2018

Abstract

:
Rapid urbanization is occurring throughout China, especially in megacities. Using a land use model to obtain future land use/cover conditions is an essential method to prevent chaotic urban sprawl and imbalanced development. This study utilized historical Landsat images to create land use/cover maps to predict the land use/cover changes of Tianjin city in 2025 and 2035. The cellular automata–Markov (CA–Markov) model was applied in the simulation under three scenarios: the environmental protection scenario (EPS), crop protection scenario (CPS), and spontaneous scenario (SS). The model achieved a kappa value of 86.6% with a figure of merit (FoM) of 12.18% when compared to the empirical land use/cover map in 2015. The results showed that the occupation of built-up areas increased from 29.13% in 2015 to 38.68% (EPS), 36.18% (CPS), and 47.94% (SS) in 2035. In this context, current urbanization would bring unprecedented stress on agricultural resources and forest ecosystems, which could be attenuated by implementing protection policies along with decelerating urban expansion. The findings provide valuable information for urban planners to achieve sustainable development goals.

1. Introduction

Land use/cover change has widespread impacts on many fields, including city planning, economics, agriculture, land surface temperature, and climate change [1,2,3]. With the acceleration of the urbanization process and industrialization, urban structures have significantly transformed and this phenomenon has attracted the attention of the government and the public, especially in developing countries [4,5]. By using remote sensing (RS) and geographic information system (GIS) methods, many land use/cover models have been established and developed on complicated and developed urban environments, fully presenting the dynamics and problems of land use/cover changes [6]. To discover the system and development of urban spatial structures, scenario-based simulations have been widely applied [7,8,9]. Predicting future land use/cover changes under extensive scenarios is significant for urban planners to better grasp the trend of urbanization.
Recent works have shown that future urban structure can be predicted through the urban growth model with historical trends from spatiotemporal land use/cover changes under different scenarios [10]. Clarke et al. (1997) predicted urban growth in the San Francisco bay area by using a cellular automata model [11]. Clarke and Gaydos (1998) calibrated the cellular automata model and predicted the land use/cover changes in San Francisco and Washington/Baltimore until 2100 [12]. Seto et al. (2011) simulated the urban area around the world in 2030 based on the special report on emissions and scenarios [13]. Seto and Fragkias (2005) analyzed the dynamic land use/cover changes between four developing cities in China and illustrated that under the different economic and policy histories, the four cities showed consistent urban growth [14].
As a Marxist–Leninist nation, China has a distinctive developmental pattern compared to Western countries. Since the foundation of the People’s Republic of China in 1949, it has initiated the sinicization of Western socialism patterns. The strategy of development was based on self-reliance [15]. In that period, not only was urban construction backwards but urban civilization was also at a low ebb. Since the reforming and opening policy released in 1978, Western economics and its values, including globalization, has widely influenced the development of China. At the same time, significant changes have taken place in big cities. Beijing, Shanghai, and Tianjin, as the top three largest industrialized cities, have kept a rapid and stable urban development. Among them, Tianjin experienced an extraordinary developing process because of its character as both an industrialized city and as the largest seaport city in the northern area. Owing to the increase in foreign trade, from 2005 to 2015, the gross domestic product (GDP) of Tianjin has increased from 58.44 billion to 247.45 billion, with an annual increase of 9.3% [16].
With rapid urbanization and industrialization, many environmental problems have occurred in Tianjin city, China. Similar to other municipalities, its development has led to enormous changes in land use/cover [17]. From the observation of Landsat images of the study area, there were 57.06 km2 of forest cover reduction from 1995 to 2015 [18]. According to the national forest census in China, the forest coverage rate in Tianjin city ranked last among all the four centrally administered municipalities in 2012 [19]. The loss of forest imposes huge pressure on the environment and ecosystem. One of the consequences is the deterioration of air quality. From the report of the Air Quality Index, the compliance rate for air quality in Tianjin reached 35.2% in 2015, making it one of the top 10 most polluted cities in China [20]. In addition, Tianjin is one of the most water-scarce cities in northern China [21]. Moreover, Tianjin has experienced dramatic biodiversity loss during the last few decades [22]. For example, inland aquatic animal species have decreased by 40% and aquatic plant species by 20% since the 1980s [23]. Forest and grassland could effectively improve air quality, conserve water, and secure biodiversity [24]. Therefore, environmental protection is essential for sustainable urban development in Tianjin city.
Occupation of cropland has also been observed under the rapid urban expansion process. With the largest population on earth, China keeps a high and increasing food demand. Although some of the food is imported, China still insists on maintaining a high level of self-sufficiency, especially for grain [25]. Therefore, farmland preservation is a high priority to ensure national food security. Measures, from central to local governments, have been introduced to protect cropland [26]. Such measures are especially required in the eastern and coastal regions, such as Zhejiang Province, because of the high threat of cropland conversion to built-up areas [27]. Arable land in Tianjin also decreased by 14.01% from 1990 to 2000 [28]. Further, farmland preservation policy also plays an important role in terms of reducing cropland loss in China [29]. Since the beginning of the 21st century, China has implemented a stringent cropland policy [30], and this policy is expected to show its outcomes in the near future. Such restrictions will drastically alter the amount and direction of urban expansion.
All of these lead up to an extreme imbalance between urbanization and sustainable development. Scenario-based simulations not only provide alternative land use/cover distributions under different scenarios but also incorporate government policy into land use/cover prediction [31]. In recent years, the cellular automata–Markov (CA–Markov) model has been validly applied in land use/cover simulations by virtue of its spatiotemporal attributes and accurate predictions [32,33,34]. Wang et al. (2018) used the CA–Markov model to simulate future land use/cover conditions in the Tokyo metropolitan area under the subregion development, green space improvement, and spontaneous scenarios [35]. Kamusoko et al. (2009) simulated future land use/cover changes in Bindura district in 2020 and 2030 by employing the CA–Markov model [36].
Although scenario-based simulation is common in land use/cover prediction, few studies have emphasized the importance of keeping a balance between urban expansion and cropland protection. Our previous study analyzed the spatiotemporal patterns of land use/cover change in Tianjin city from 1995 to 2015. However, that study predicted the landscape of Tianjin in the future regardless of the related forest preservation and cropland preservation policies. In this research, we employed the land use/cover classification results which were collected from the previous study and considered forest and cropland protection policies to simulate future land use/cover spatiotemporal distribution under three alternative scenarios.
The objective of this study is to use RS data and GIS methods to simulate future growth scenarios in Tianjin city. To achieve this, three steps have been conducted. First, based on the historical development trend of land use/cover changes, we identified modeling variables to determine position, direction, and tendency using GIS tools. Second, we used the Markov model to calculate the transition probability matrix from land use/cover maps in 2005 and 2015. Third, we simulated the land use/cover maps in 2025 and 2035 under multiple scenarios in the CA–Markov model.

2. Materials and Methods
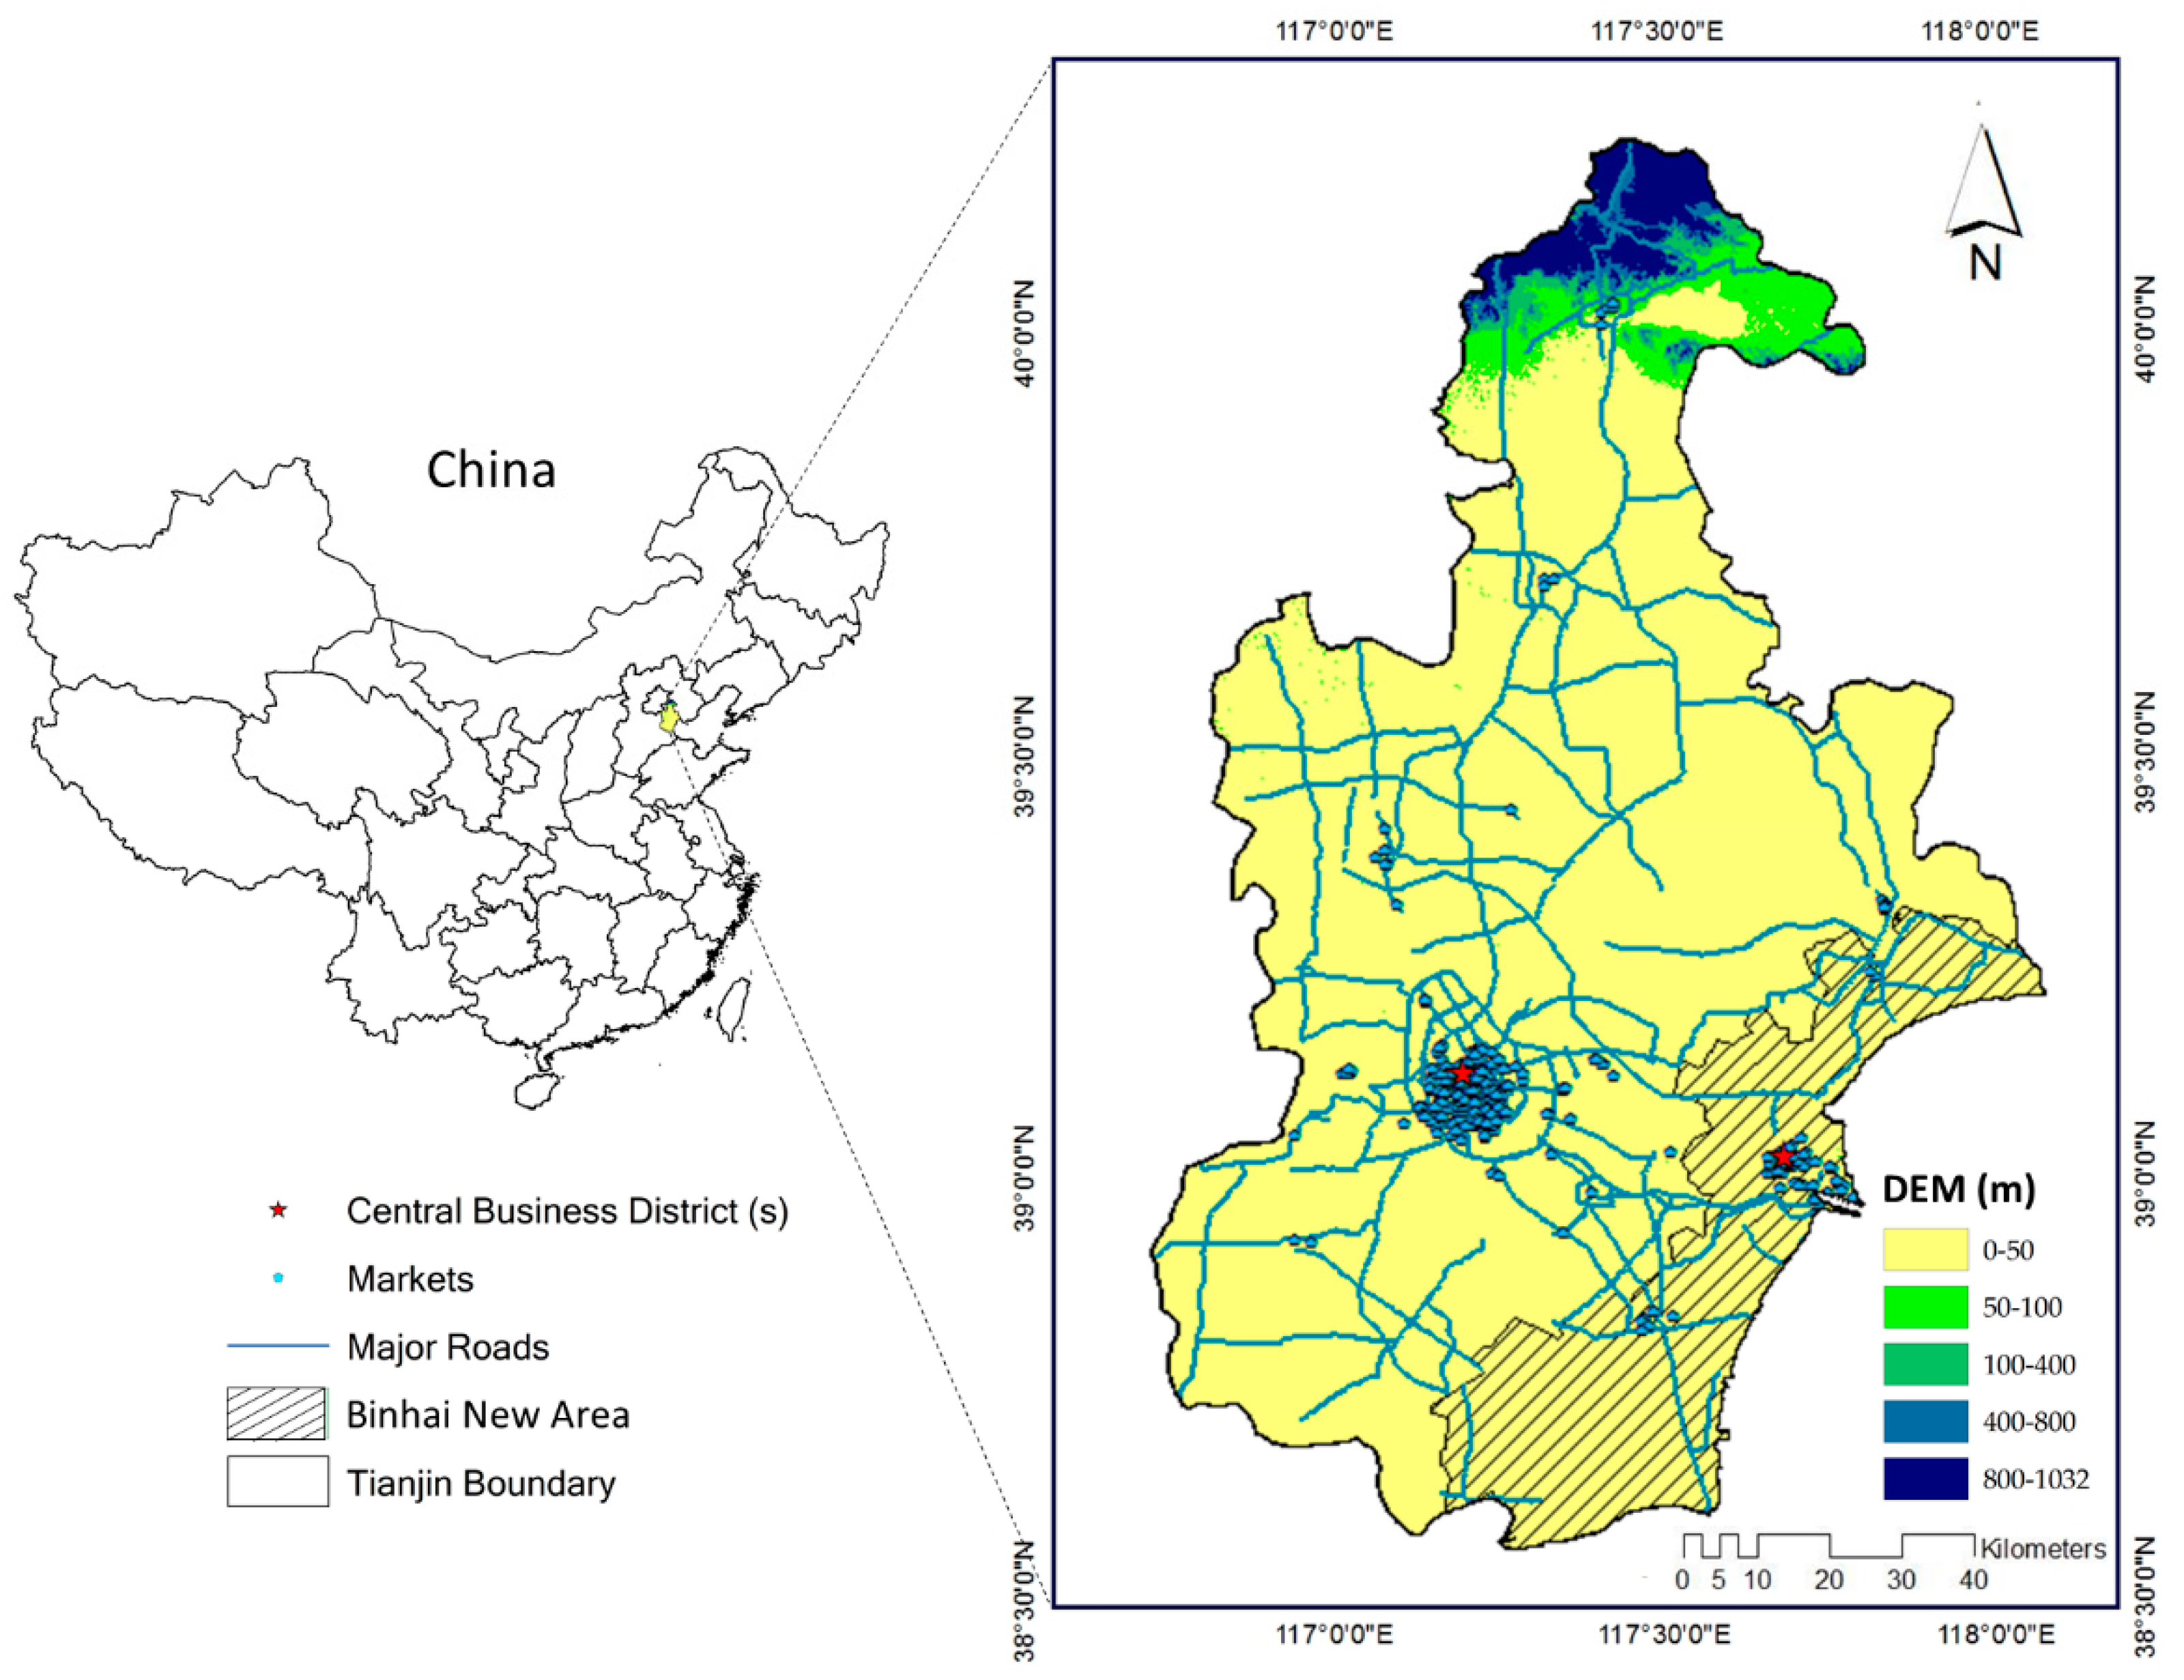
2.1. Study Area

Tianjin is one of the four municipalities (Beijing; Shanghai; Tianjin; Chongqing) directly under the central government of China, located in between 38°34′ N to 40°15′ N and 116°43′ E to 118°04′ E, covering an area of 11,860 km2 in northern China (Figure 1). Tianjin city consists of 16 districts (Binhai, Hedong, Heping, Hexi, Nankai, etc.) and 2 central business districts (CBDs). One CBD is situated in the central area, and the other is situated in the Binhai district. According to the National Bureau of Statistics (NBS) of China in 2015, the population in the Tianjin metropolitan area grew from 12.29 million in 2010 to 15.46 million in 2015, with an average annual increase of 0.49 million people [16].
Tianjin city is the third largest center of urban internationalism after Beijing and Shanghai, with a 10% annual GDP increase rate since 2000 [37]. In 2005, the government framed a set of new policies for the Binhai district. As a result of these policies, the industrial center moved from the city center to the Binhai district and it became the most extensive international port in northern China. Tianjin was selected as the study area since it is a typical Chinese megacity undergoing rapid urbanization and thus faces all of the problems associated with this process. From 2003 to 2011, in Tianjin city, 34,734 ha of cropland has been occupied by urbanization and 6547 ha of the green area was lost due to urban expansion [38].

2.2. Data Used

Satellite images are widely used in recording landscapes in different years [39]. In this study, the land use/cover maps in 1995, 2005, and 2015 were collected from our previous study [18]. The classification method was the maximum likelihood supervised classification algorithm. To reflect the trend of urban growth, land use/cover maps were reclassified as built-up, non-built-up, and water. The built-up category includes constructed areas, such as buildings and roads. Forest area, cropland, and grass area have been classified into the non-built-up category. Reservoirs, lakes, and rivers belong to water. The reclassified land use/cover maps were employed for simulating scenarios.
The vector data, including the locations of the CBDs, markets, and major roads, were obtained for analysis and modeling as ancillary spatial data. The digital elevation model (DEM) data, used as one variable in the modeling process, was downloaded from the United States Geological Survey (USGS) website [40]. The slope date was derived from DEM data. To achieve scenario-based modeling, the wetland nature reserve was set as the protection area in this study.

2.3. Land Use/Cover Change Model

In this study, a hybrid model that combined the Markov model and the CA model was employed to simulate future land use/cover maps. TerrSet 18.31 software was used to run the CA–Markov model and other related modules.

2.3.1. Computation of Transition Area Matrix Using the Markov Model

The Markov model is a random process transforming one state to another in a state space [41]. The process of the Markov model is characterized as memorylessness. This means that in a time series, the probability distribution in the next state is only dependent on the current state, not on previous states [42,43]. The Markov model can be used with different statistical or artificial intelligent models to predict land use/cover changes, such as the cellular automata model, logistic model, multilayer perception/neural networks, and hybrid models [44,45,46]. According to the non-aftereffect, the Markov model can simulate the changing trend between two time points [47]. The relationship between the condition in time t and t + 1 can be expressed by Equation (1) [48]:
N t + 1 = P m a t r i x · N t
where N t + 1 is the state vector at the future time, P m a t r i x is a transition probability matrix, and N t is the state vector at the initial time.
When the transition probability matrix is obtained, the transition area matrix can be easily calculated, which is expressed as follows:
A = [ A 11 A 1 n A n 1 A n n ]
where A is the transition area matrix from time t to t + 1 and n is the number of land use/cover categories.
In this study, land use/cover maps in 1995, 2005, and 2015 were selected as the study years to calculate the transition area matrix. All of them have been reclassified into three land use/cover types (built-up, non-built-up, and water) to reflect the built-up distribution in each year. The transition probability matrix with a one-decade unit was calculated by land use/cover maps in 2005 and 2015 with the Markovian transition estimator module shown in Table 1. The result of the transition probability matrix can be settled as the foundation for further calculation on the transition area matrix.

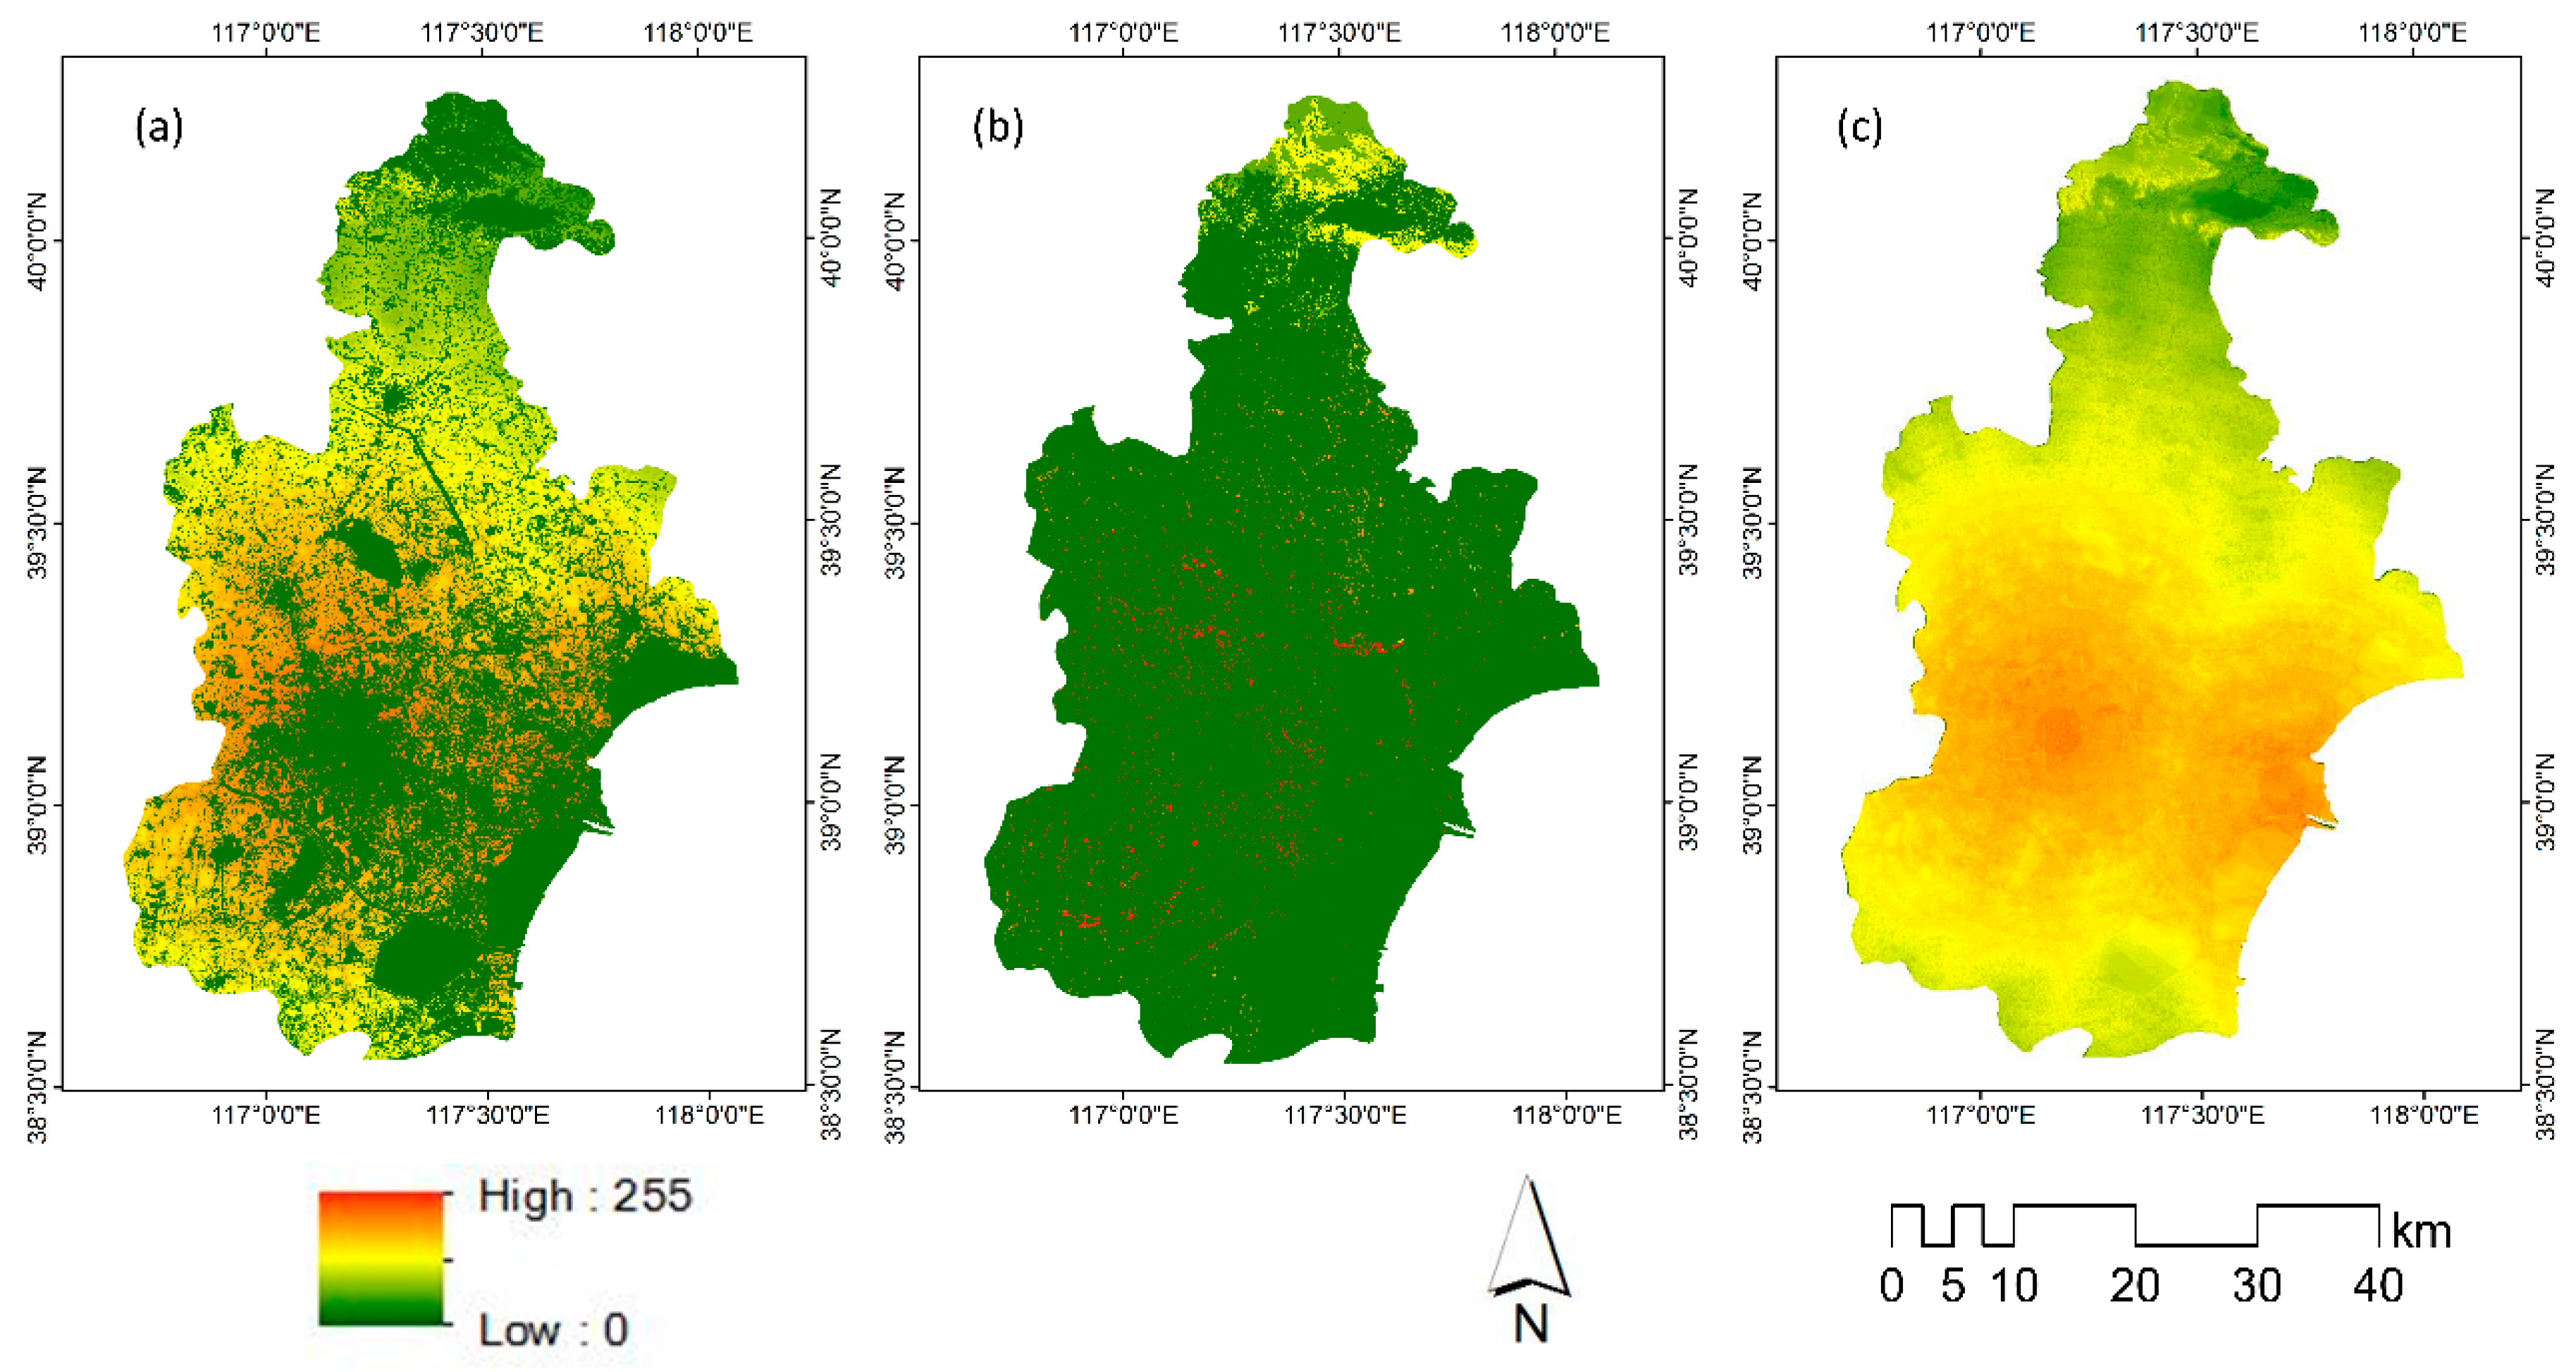
2.3.2. Generation of Transition Suitability Maps

Transition suitability maps are employed to the allocated spatial distribution of land use/cover [49]. Modeling variables are also important data sources to concentrate on the interaction between cells for the simulation [50]. Natural and socioeconomic factors, including elevation, slope, distance to the city center, and distance to the nearest subway, are essential to generate transition suitability maps. Some restrictions are also considered in the transition suitability maps. For example, the grass areas which were in the national conservation park cannot be occupied by built-up areas.
To standardize the influence of the modeling variables, we used the fuzzy module to keep them in the same range. With the fuzzy module, we evaluated the possibility of suitable areas for land use/cover categories on each of the modeling variables. The suitable values ranged from 0 to 255, with 0 representing an unsuitable area and 255 representing the most suitable area. After that, all the modeling variables were weighted by the analytical hierarchy process weight derivation module for their relative importance during urbanization. In order to make modeling variables more reliable, the logistic regression model was employed to eliminate the effect of collinearity. In this study, six modeling variables were selected, namely, distance to CBD, distance to roads, distance to built-up areas, distance to markets, DEM, and slope. Finally, all the modeling variables which were extracted by the fuzzy module were used in the multicriteria evaluation (MCE) module to establish the suitable transition layers of all the land use/cover categories.

2.3.3. Combination of the Markov and CA Models

Since it only employs the transition probability matrix to model land use/cover change, the Markov model failed to catch the spatial distribution in the near future [51]. To overcome this limitation, the CA–Markov model was used to simulate spatiotemporal land use/cover changes. Alan Turing and John von Neumann pioneered the cellular automata model at first to analyze the interaction of cells [52]. Gradually, the cellular automata model has been used to simulate land use/cover changes [53]. There are some rules in the CA model to assign the distribution of each cell. For example, the CA model has a discrete spatial layout and a specified time interval, and each cell can only take one state [54]. In the CA model, the condition of the central cell is not only decided by the information from the previous state but also complies with its surrounding cells [55]. If the cell is surrounded by class “A”, it has a high probability of changing into class “A”. The interaction of cells can be expressed in a standard 5 × 5 contiguity filter:
0 0 1 0 0 0 1 1 1 0 1 1 1 1 1 0 1 1 1 0 0 0 1 0 0
This model combines the advantages of the Markov model and the cellular automata model to provide the statistical and spatial analysis of land use/cover changes. Spatiotemporal dynamic change rules were combined with the rules of the Markov model and the CA model [56]. Equation (4) illustrates the principle of CA–Markov model and explains the process of the condition in the cell (i, j) change from time t to time t + 1 [57]:
C ( i , j ) t + 1 = f ( C ( i , j ) t · T S ( i , j ) t · T P ( i , j ) t · N I ( i , j ) t )
where C ( i , j ) t + 1 is the condition of cell (i, j) at time t + 1, C ( i , j ) t is the condition of cell (i, j) at time t, T S ( i , j ) t is the transition suitability of cell (i, j) at time t, T P ( i , j ) t is transition probability of cell (i, j) at time t, and N I ( i , j ) t is the interaction by surrounding cells based on the transition rules of the CA.
In this study, the future land use/cover map was determined by four elements: (1) the land use/cover map in 2015, which is the basis land cover map for simulation; (2) the transition area matrix from 2005 to 2015, which was calculated by the Markov model; (3) the transition suitability maps in 2015, which were obtained from the MCE module; and (4) a standard 5 × 5 contiguity filter, which is integral to assign the neighborhood interaction of land use/cover cells.

2.4. Modeling Variables

Based on the literature and local development patterns, “distance to CBDs”, “distance to markets”, “distance to roads”, and “distance to built-up areas” were selected as the input variables [38]. Long et al. suggests that from 2006, at which time the Binhai district was established, urbanization development was shifted to the Binhai district [58]. Considering this, the distance to CBDs was used as a modeling variable in this study. The markets also have an interaction with built-up areas. The established markets can stimulate the development of surrounding areas. As a result, we determined the distance to the markets in the simulation. A road is a basic item for most of the transportation models. In this context, the distance to roads was selected as another factor. Considering that the distribution of current built-up areas will influence future conditions, the distance to built-up areas in 2015 was set as the modeling variable. Due to the high elevation area not being suitable to establish built-up areas, the DEM and slope were selected as modeling variables. In general, we used CBDs, markets, roads, and built-up areas (extracted from the land use/cover map in 2015) data to compute “distance to CBDs”, “distance to markets”, “distance to roads”, and “distance to built-up areas” using the Euclidean distance procedures available in ArcGIS 10.5 (Figure 2a–d), and the DEM and slope are shown in Figure 2e,f.

2.5. Model Validation

To confirm the effectiveness of the CA–Markov model in Tianjin city, model validation was performed. Considering the limitation of Cohen’s kappa in providing sufficient proof of the quantity and the location value, we employed the Map Comparison Kit 3 software to calculate the value of the kappa histogram, kappa location, and kappa simulation [59]. The previous research illustrated that the Map Comparison Kit 3 software could provide the error of quantity and location to validate the model [60]. Since the governmental policy is different in each time period, we only tested the simulation under the spontaneous scenario. Validation tests for the simulation results of Tianjin city achieved the values of 0.861, 0.998, and 0.860 for the kappa histogram, kappa location, and kappa simulation, respectively.

2.6. Scenario Assumptions

By referring to the circumstance of urban growth and government policy in Tianjin city, the environmental protection scenario (EPS), cropland protection scenario (CPS), and spontaneous scenario (SS) were designed for prediction.
According to the notice published by the state council on issuing the outline of the national overall planning of forest land conservation, the status of the forest should be protected to promote land afforestation and sustained forest growth (revised in 2011) [61]. Based on this circumstance, we set the forest area as a constrained area to prevent it from changing into a built-up area during urbanization under EPS. On the other hand, other land use/cover categories were not limited to be transformed to forest area. Further, the grass area in the wetland nature reserve was prohibited to change in EPS. Under EPS, the direction of urbanization was bounded by environmental protection [62]. Because of rapid urbanization in developing countries, Tianjin city, similar to other municipalities, has experienced enormous changes in land use/cover [17]. When other land use types change into built-up areas, the total area of forest will correspondingly decrease. If these changes continue, air pollution and biodiversity loss will happen, having a severe influence on human beings. Based on these reasons, EPS should be considered. The objective of EPS is emphasizing the improvement of the regional ecological environment, protecting ecologically sensitive areas, and ensuring a reasonable layout in Tianjin city.
Benefiting from the stable increase in economy, China is undergoing a fast urbanization process, especially in Tianjin city. With rapid urbanization and economic growth, the imbalance between urban development and agricultural policy is becoming increasingly acute [63]. Resulting from the need for urbanization, croplands have been progressively occupied by built-up areas year by year [64]. Since China’s per capita cultivated land area is 40% less than the world’s standard level, the Chinese government issued a policy to protect agriculture to guarantee self-sufficient food production. According to the regulation on the implementation of the land administration law of the People’s Republic of China (revised in 2011), agricultural areas should be protected to cope with population increase and to promote balanced development among regions [65]. Tianjin city has been regarded as the primary area to implement the cropland protection policy. Therefore, we include a CPS in our analysis. In CPS, cropland areas are limited to be changed into built-up areas during urbanization.
We also provided an SS as the benchmark. In SS, the transition of urbanization follows the historical trend regardless of policies or other social effects [66].

3. Results and Model Assessment

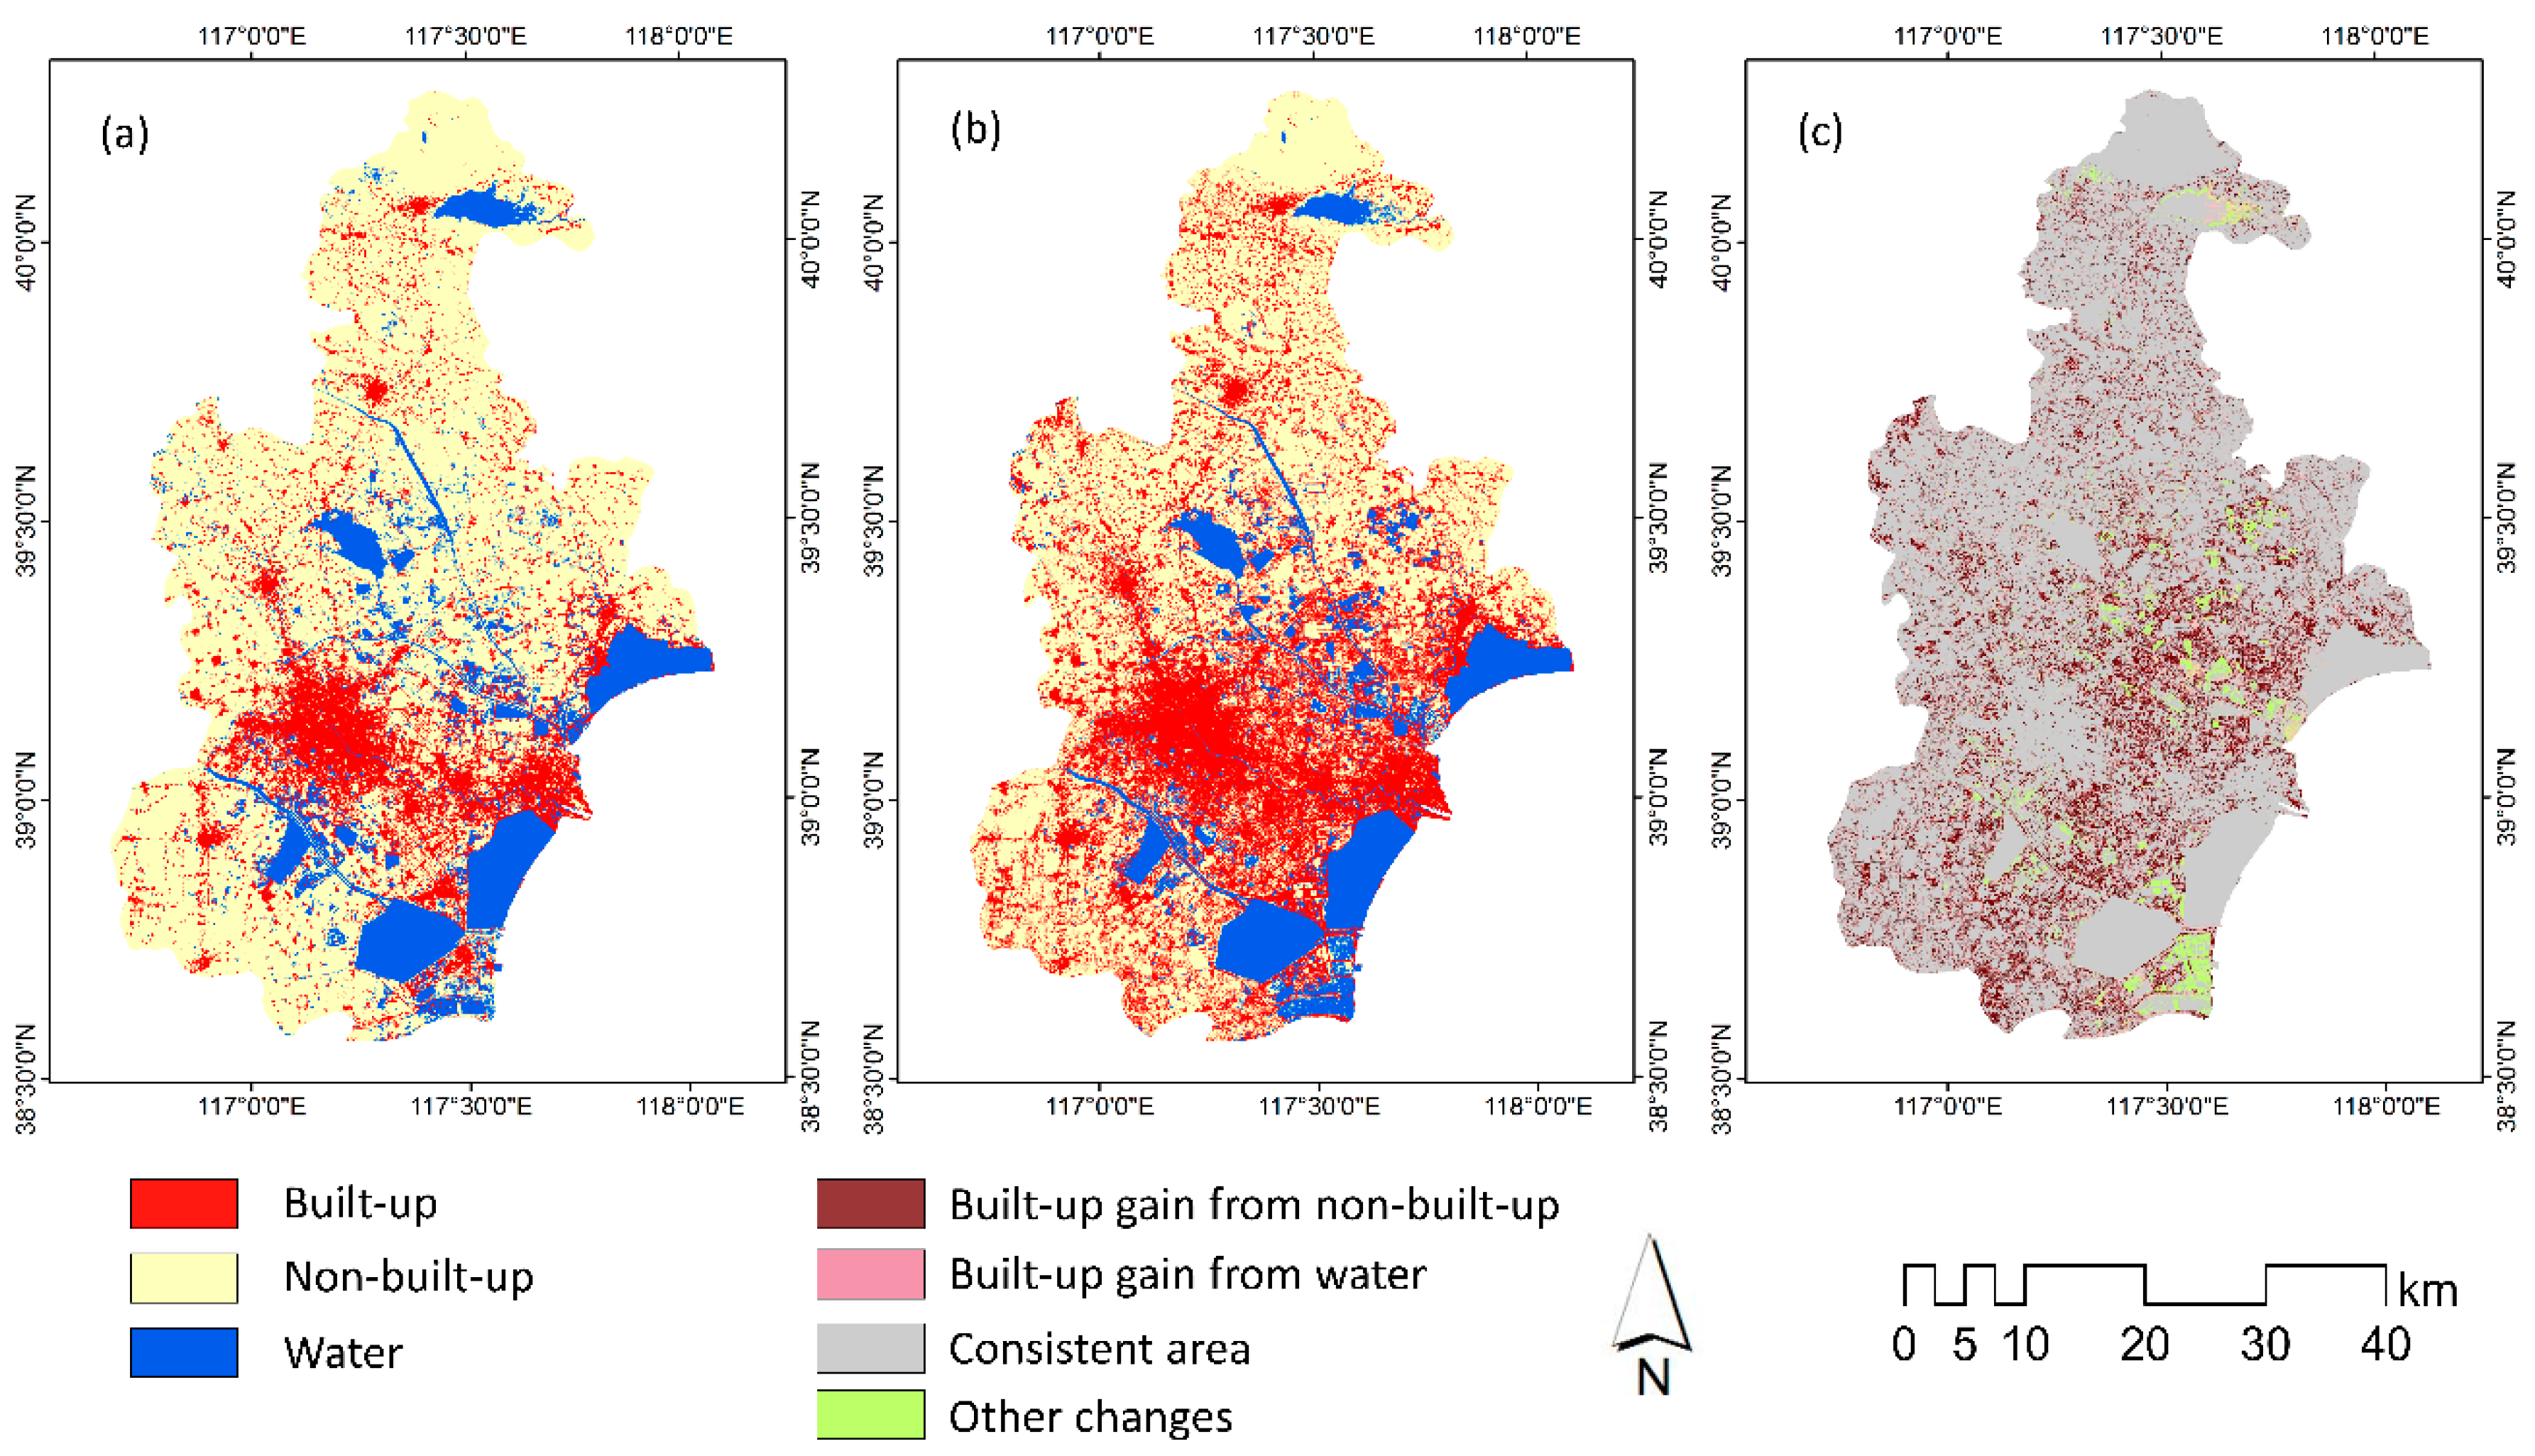
3.1. Land Use/Cover Maps

Figure 3 shows the land use/cover maps of Tianjin city in 2005 and 2015 and the change map from 2005 to 2015. The built-up area increased from 2021.7 km2 to 3404.3 km2 and expanded from the central area to the surrounding areas. From 2005 to 2015, a total area of 1382.6 km2 changed from other land use types into built-up areas. Correspondingly, 1092.8 km2 has changed from built-up to other land use types. Since water areas included paddy fields, the total area of water decreased. Figure 3c highlights the changing area by comparing the land use/cover maps in 2005 and 2015. To emphasize the urbanization process, four categories were designed, namely built-up gain from non-built-up, built-up gain from water, consistent areas, and other changes. The gain in built-up area is shown in deep red and mainly distributed in the central part. The pink color represents the built-up area that changed from paddy fields from 2005 to 2015 and was primarily located in the east of Tianjin city. The consistent area is shown in gray. A small change in water was also observed because of the conversion between cropland and paddy land.

3.2. Transition Matrix

Table 1 presents the transition probability matrix that was calculated by land use/cover maps in 2015 and 2025. From 2005 to 2015, 32.43% of the non-built-up area changed into built-up area. Additionally, 2.3% of the total non-built-up area transformed into water. This transition was due to the mutual conversion between water and non-built-up areas since paddy fields were classified as water in this study. This transition probability matrix was employed in all three scenarios as a historical trend.

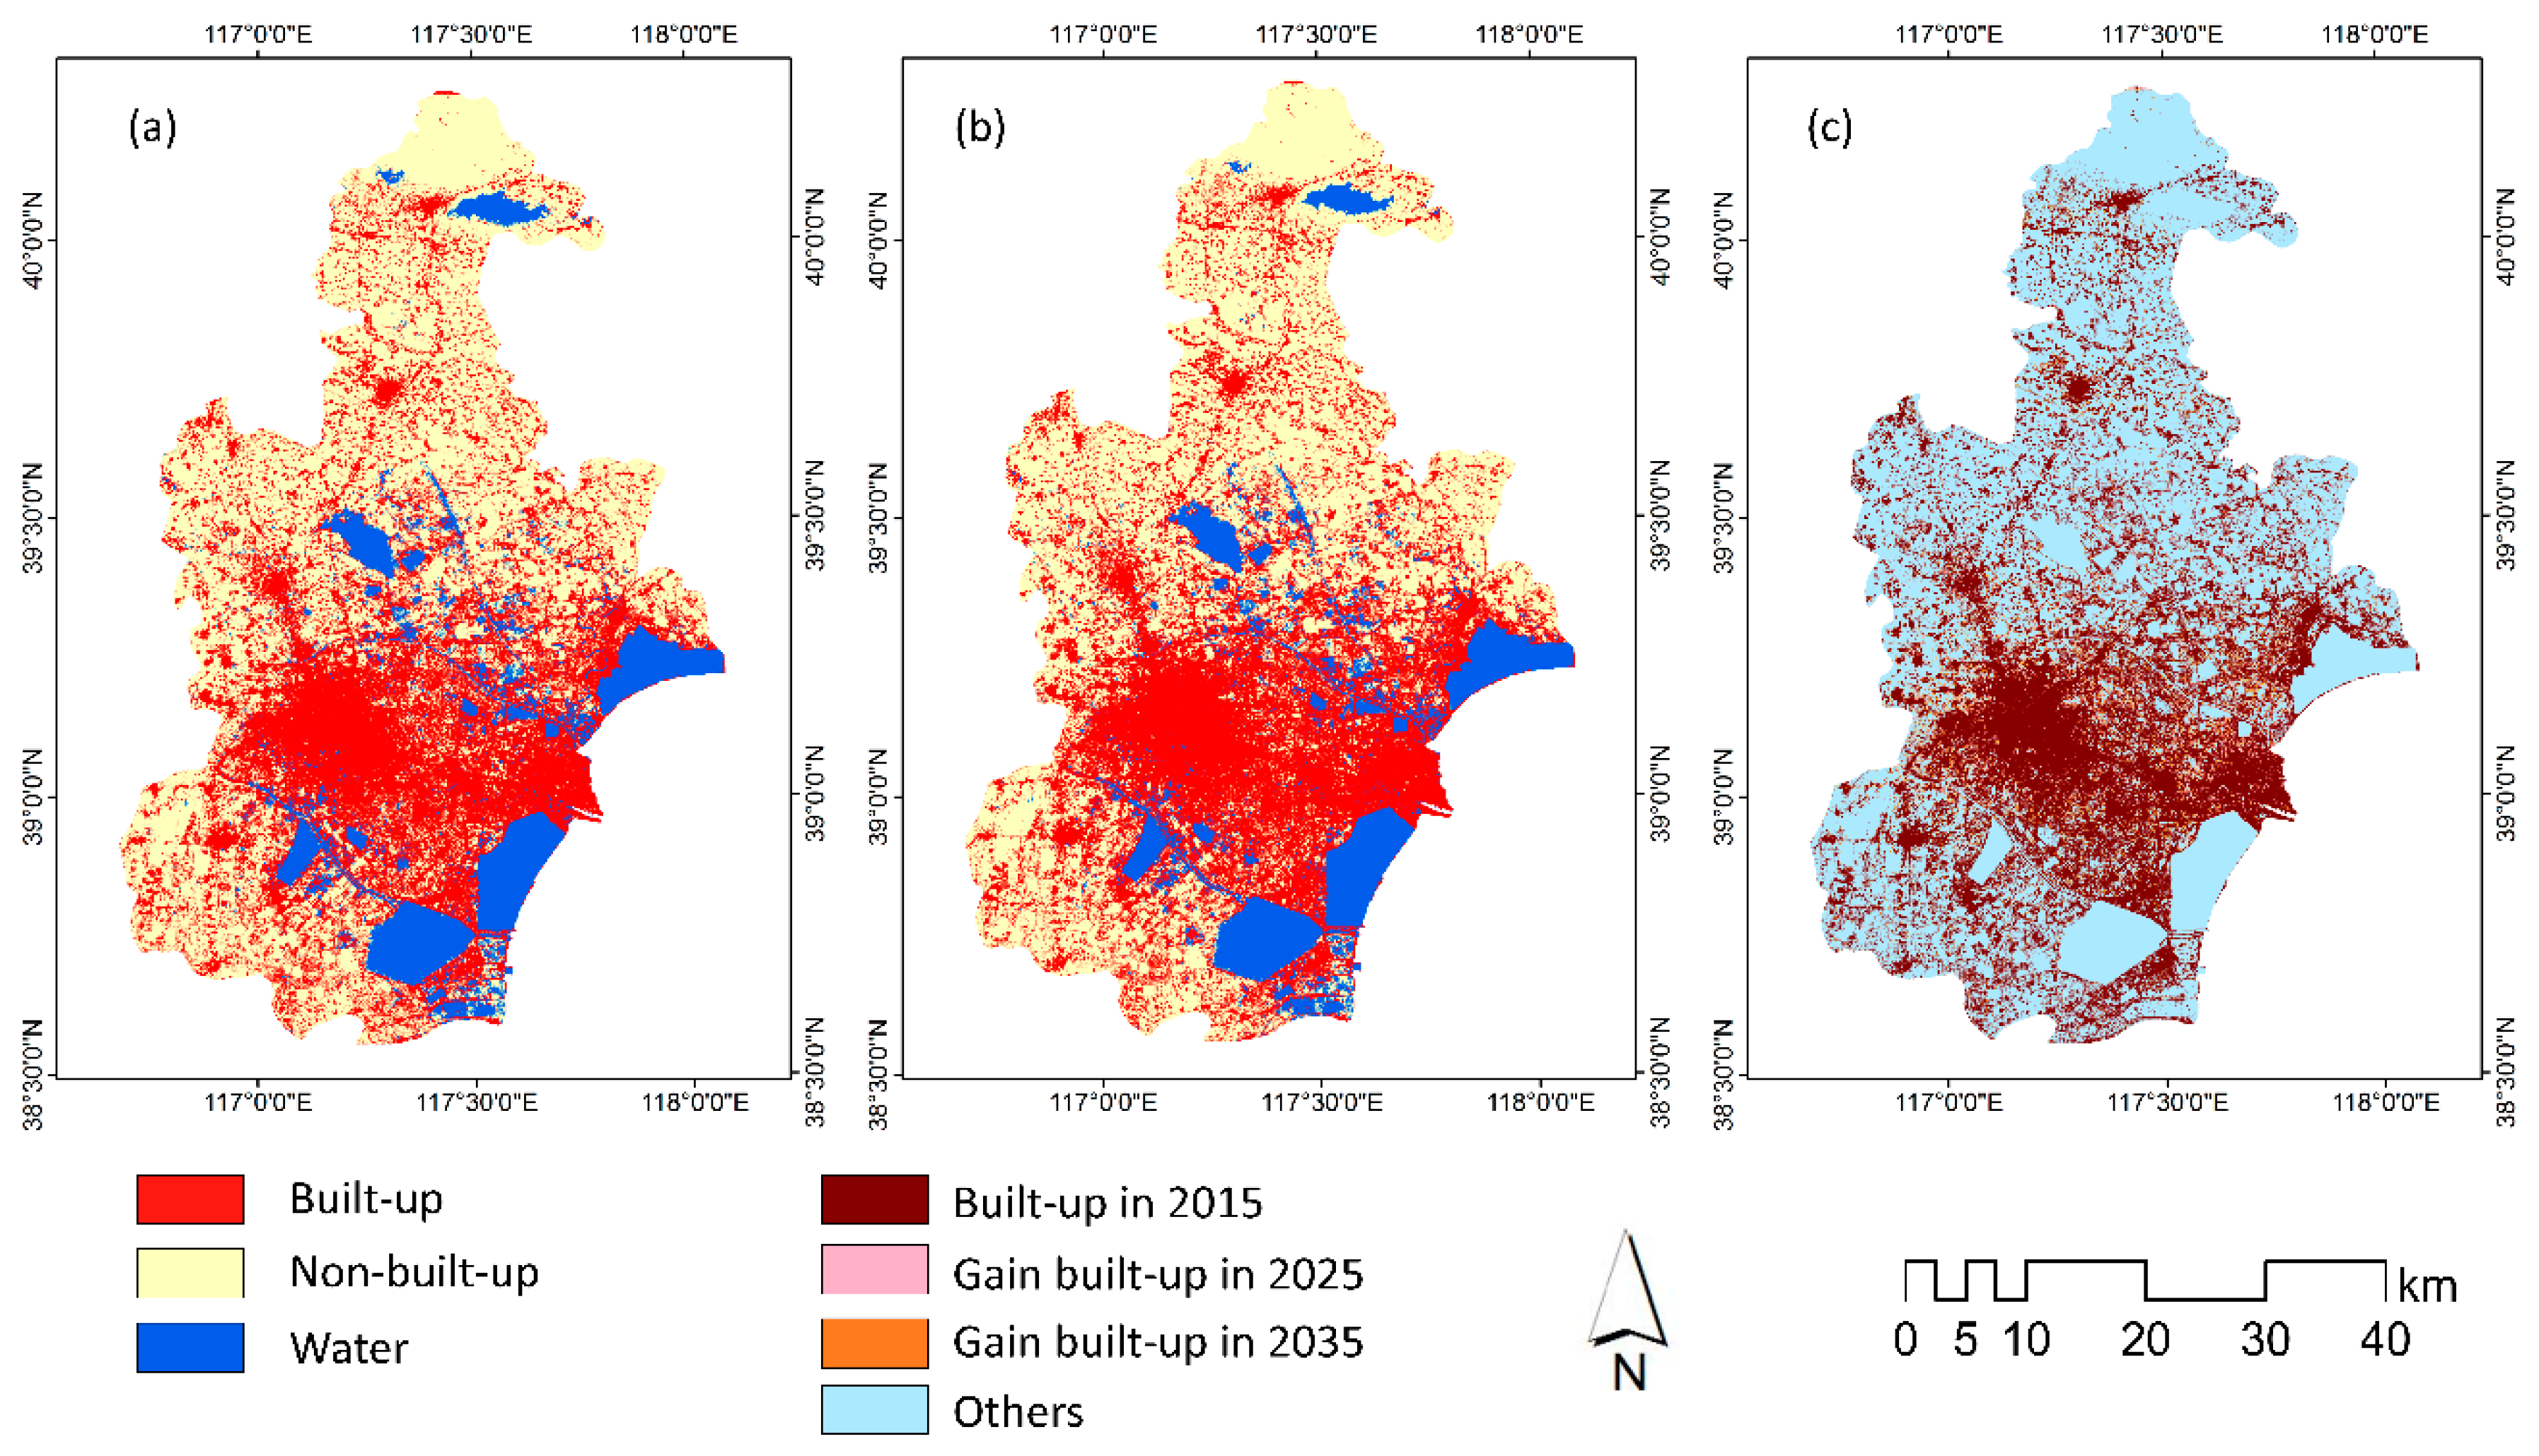
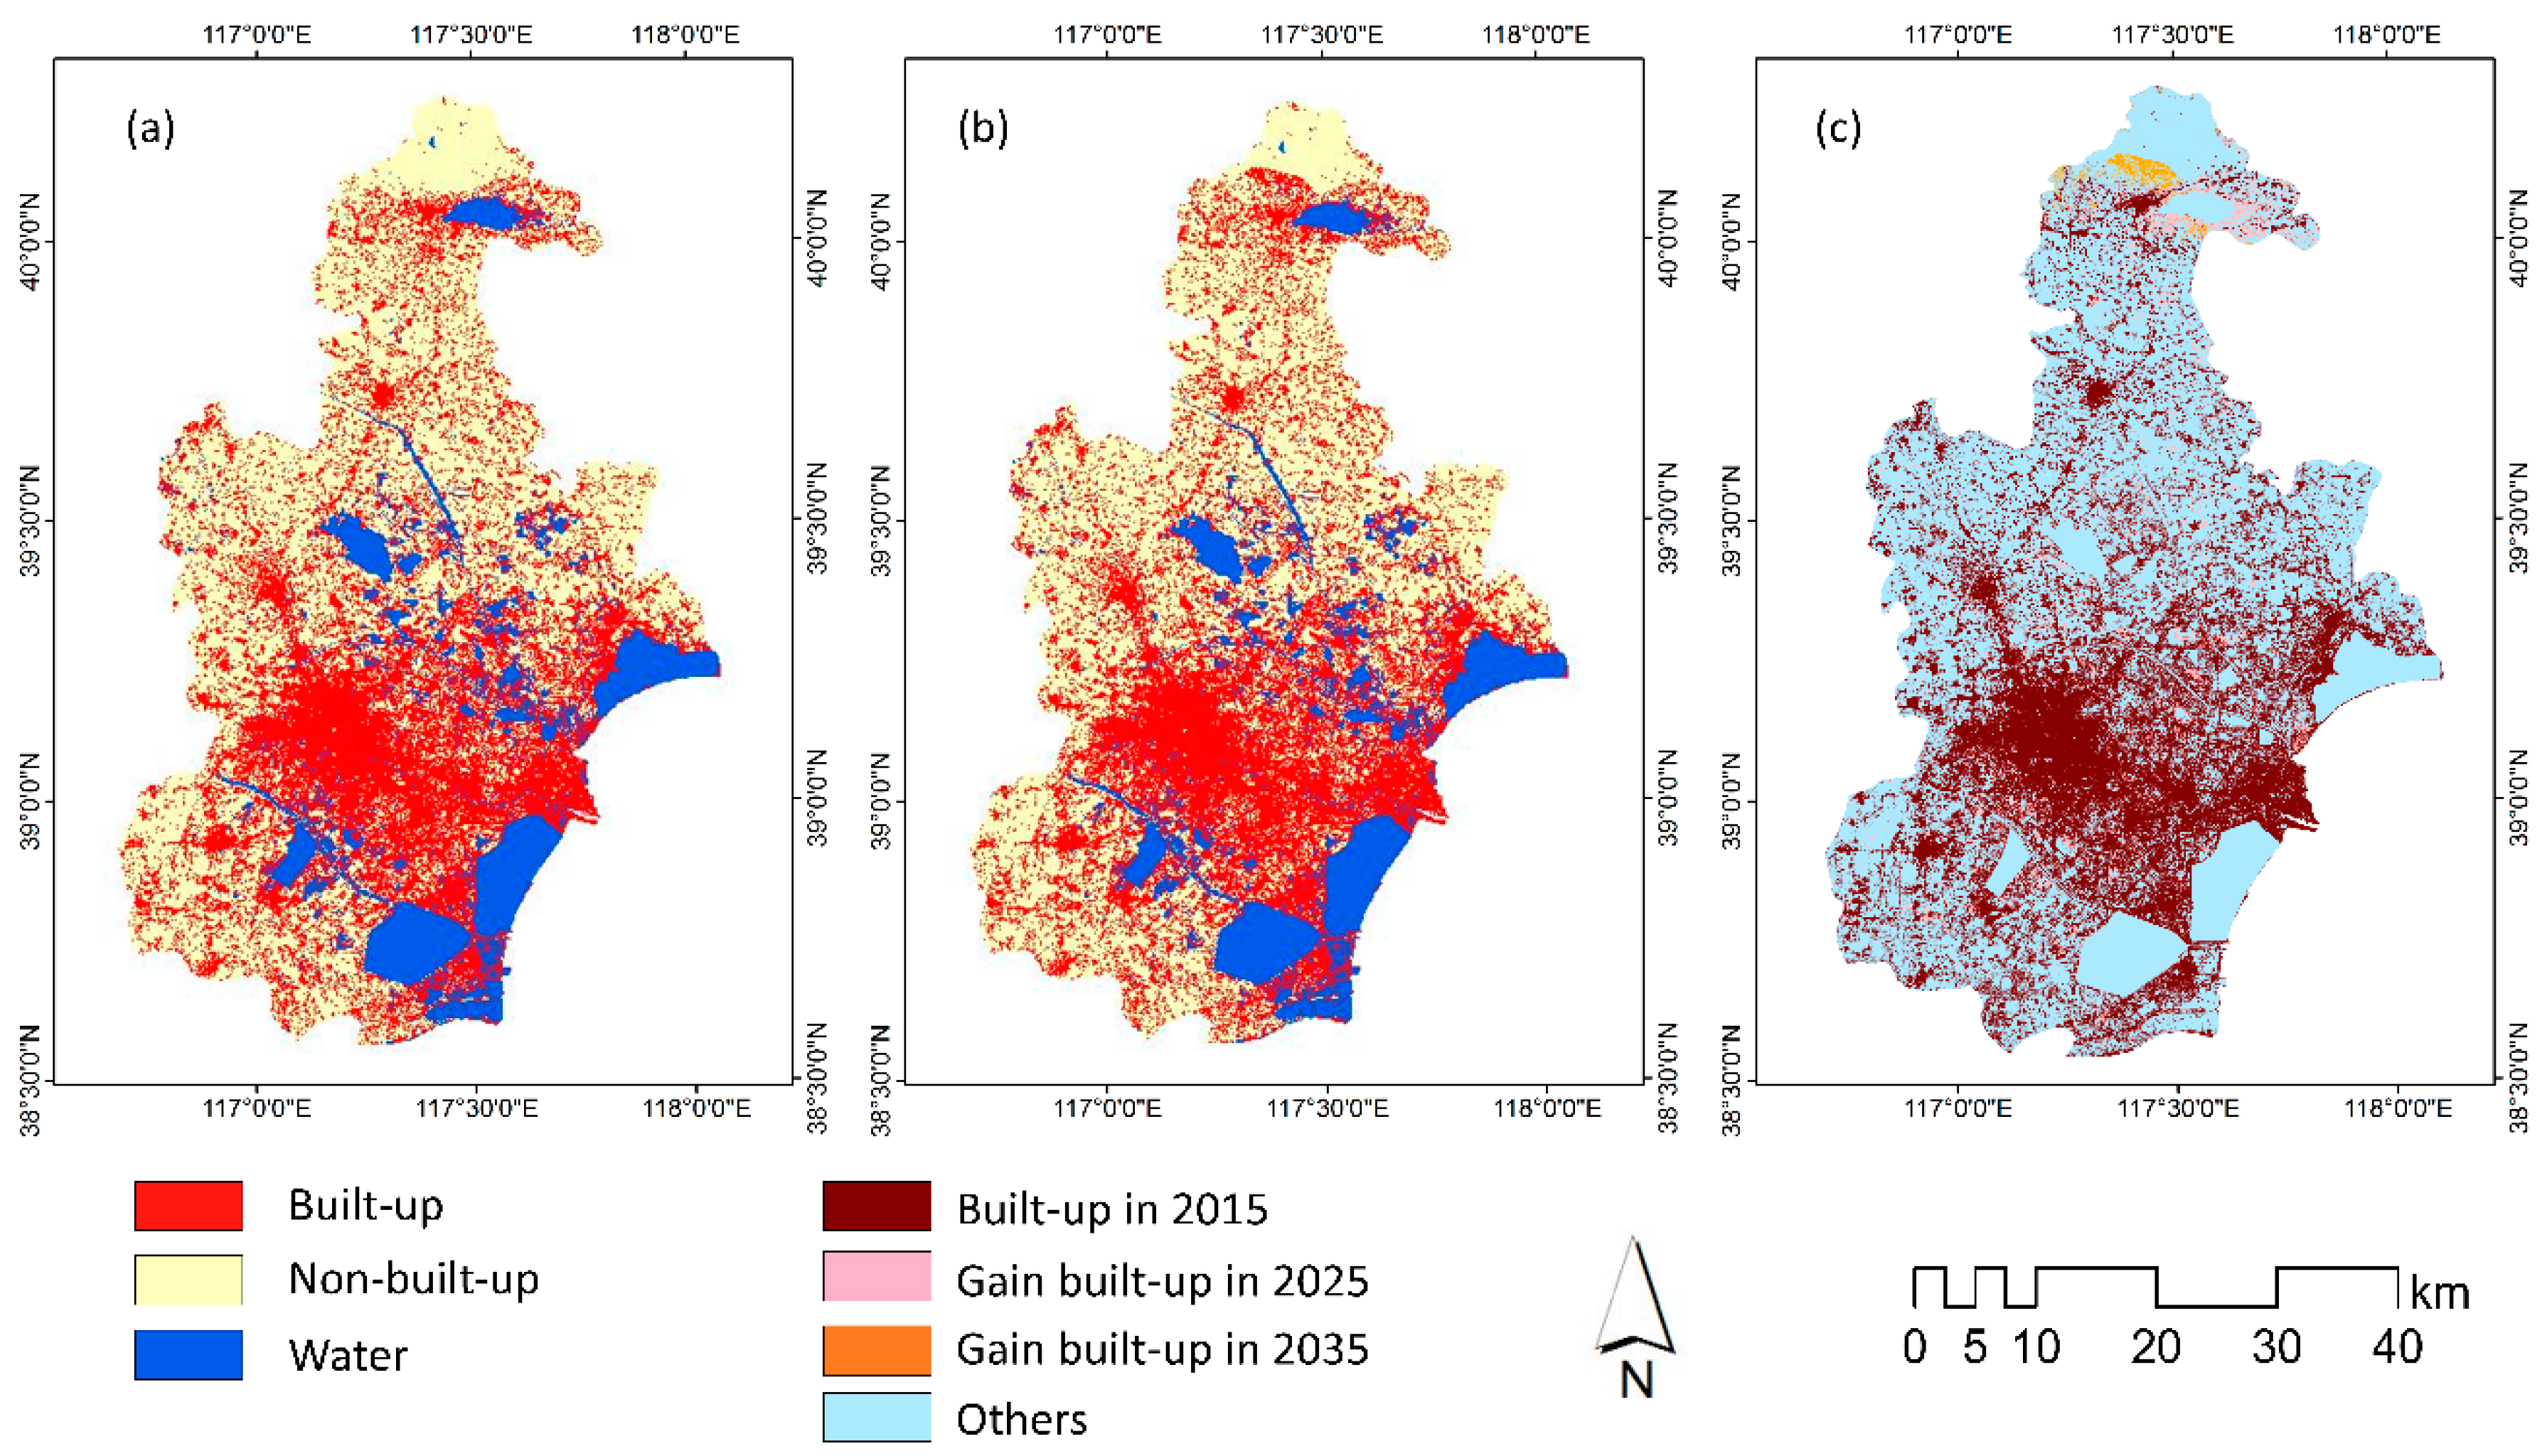
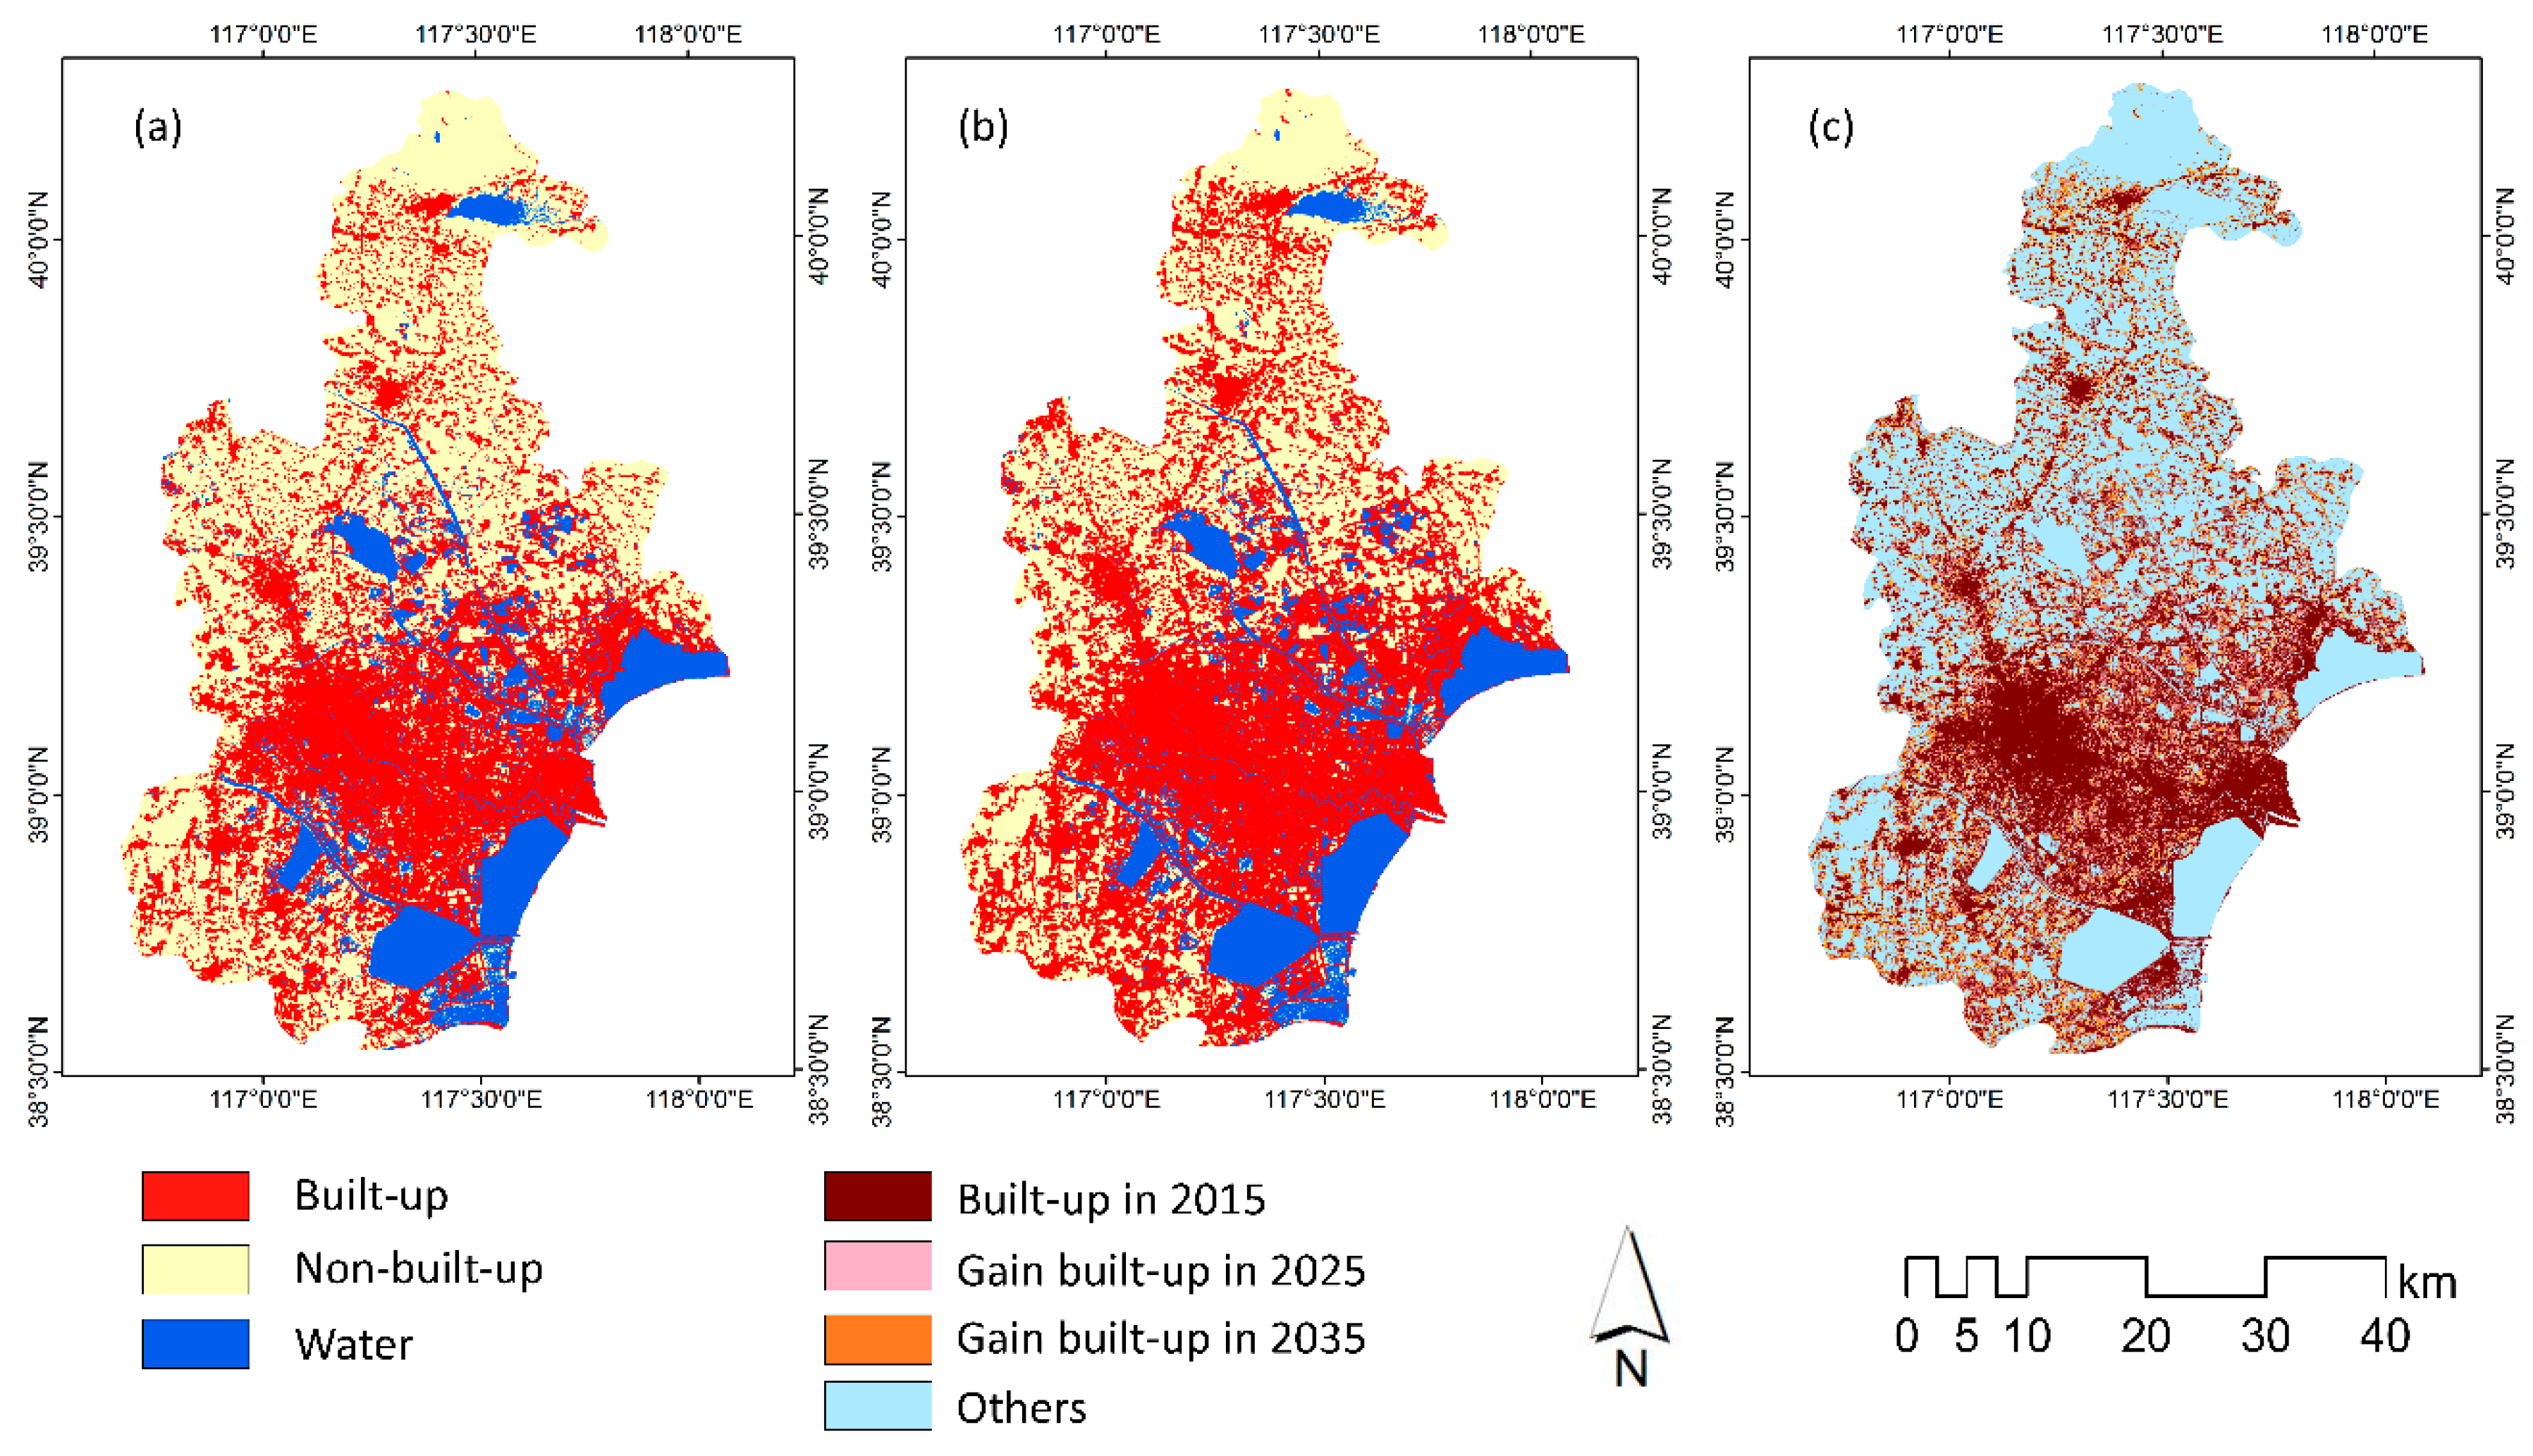
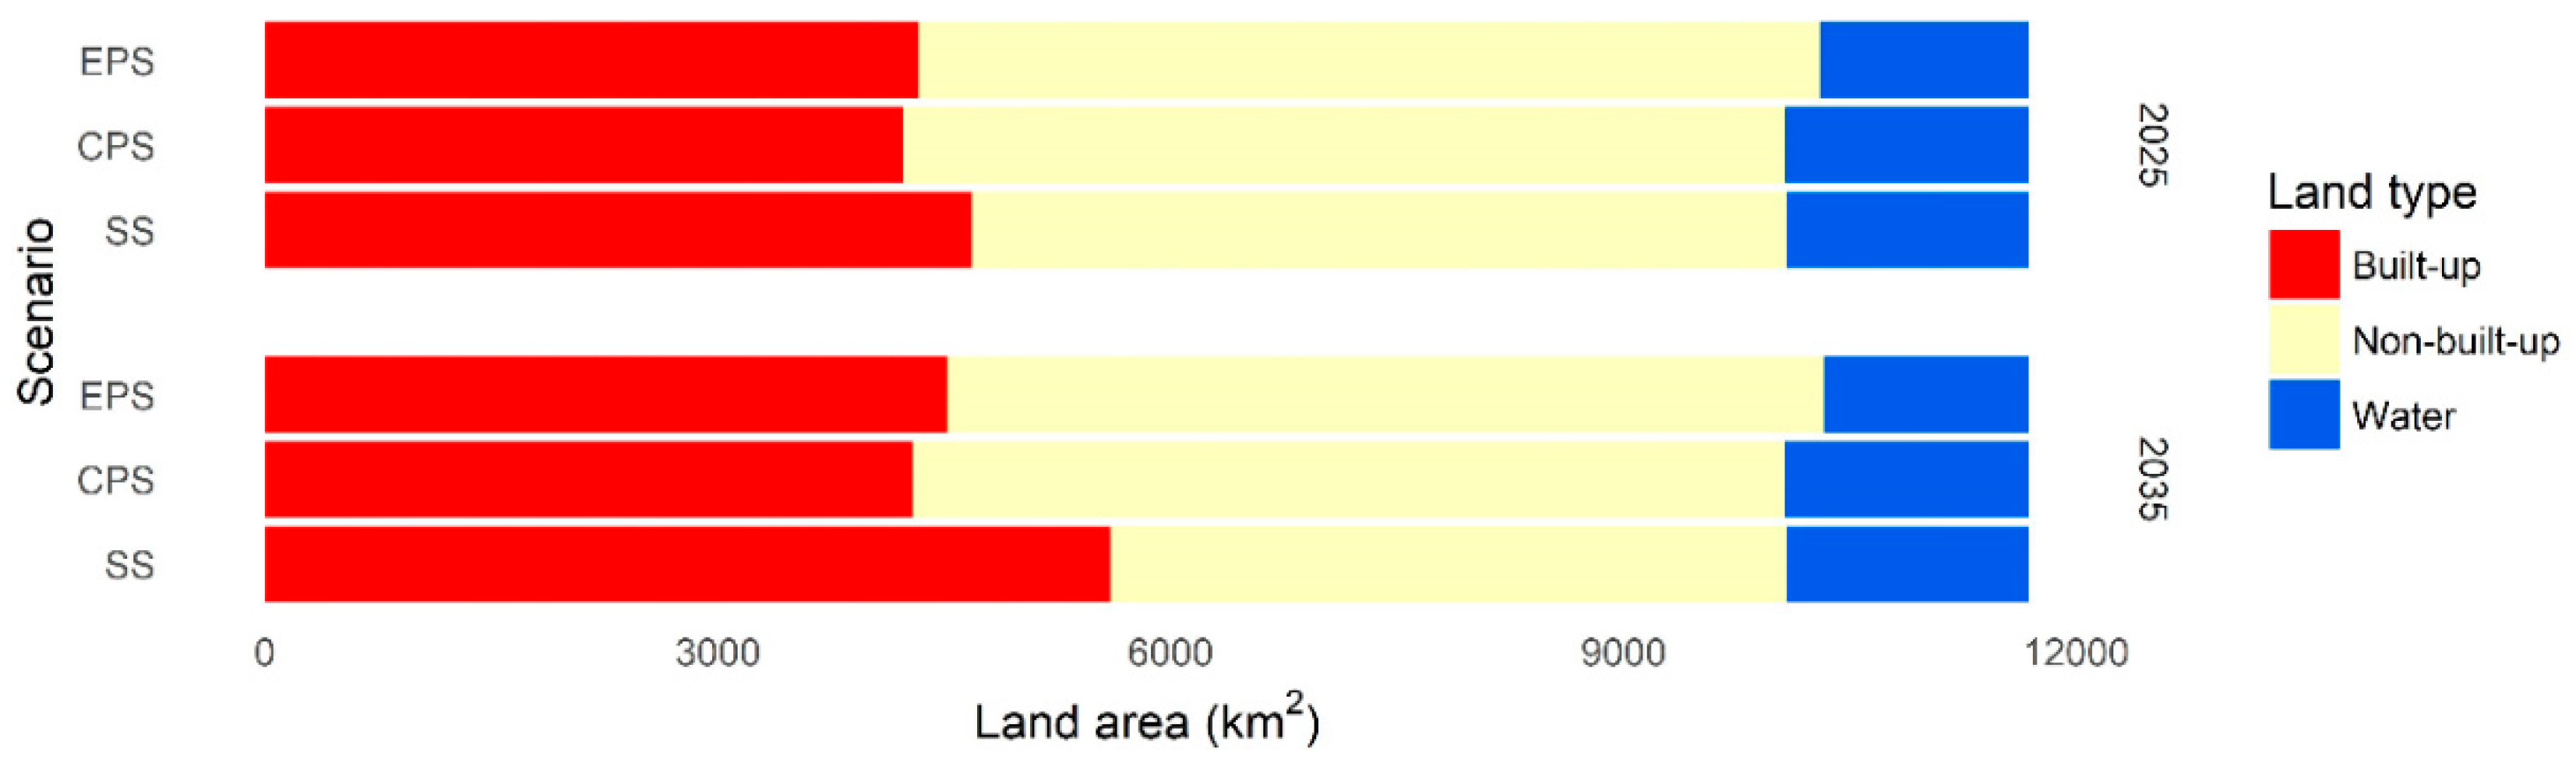
3.3. Simulation in Three Scenarios

Figure 4 shows the transition suitability maps for urbanization in the three scenarios. The red color in Figure 4a, situated at the areas surrounding the city center, represents a high probability of converting from other land use/cover types into built-up area in EPS. The green color represents a lower probability of changing from the current condition into other types. From the transition suitability map in Figure 4b, we found that all the red parts in the city center had a high transition probability into built-up area under CPS, in which cropland was forced to be protected. In addition, a part of the forest area in the north with low slope also has a high potential to change into a built-up area in CPS. Figure 4c shows the transition suitability map for urbanization in SS, and the red color area expanded from two CBDs to surrounding areas, suggesting that these areas had a higher potential for urbanization under SS. The northern part of the Tianjin metropolitan area is covered by green, which means the land use/cover condition cannot easily be changed in this scenario.
Different spatial allocations can be seen in Figure 5, Figure 6 and Figure 7. The red color shown in the simulation map represents the built-up area together with non-built-up area in yellow and water in blue. In all three scenarios, the built-up area showed a clear trend of expansion. In particular, EPS and SS shared a similar expansion pattern. In contrast, built-up sprawl is found to be much slower in CPS.

3.3.1. Environmental Protection Scenario

Figure 5 shows the spatial allocation of urban growth under EPS. The distributions of land use/cover in 2025 and 2035 are presented in Figure 5a,b. The change map from 2015 to 2035 is shown in Figure 5c. Table 2 shows that there is an area of 924.52 km2 changing from other land use types to built-up areas from 2015 to 2025. The total built-up area increased to 4328.81 km2 in 2025 and 4519.34 km2 in 2035 under EPS and occupied 38.68% of the total area in Tianjin city. In Figure 5c, the built-up area in 2015 is highlighted in dark red; the pink color represents the growth of built-up areas from 2015 to 2025; and the built-up gain area from 2025 to 2035 are represented in yellow. From Figure 5c, it can be detected that the built-up gain area was situated around the built-up area in 2015. The northern part covered by forest does not have a significant change. This means that EPS had a demonstrable effect on simulation progress.

3.3.2. Cropland Protection Scenario

Figure 6 presents the land use/cover maps in 2025 (a) and 2035 (b) under CPS and the change map from 2015 to 2035 (c). Table 3 shows the land use/cover change rate under CPS. Compared with the simulation maps in 2025 and 2035, the built-up area had a minimal change in the city center. In the northern part, around 150 km2 was transformed into built-up areas, as shown in Figure 6c. Normally, forest areas rarely change into built-up areas due to their high location and environmental policy. However, under CPS, feasible land is limited for urbanization, resulting in a change from forest into built-up areas. Different from the other two scenarios, the simulation maps in CPS showed that the built-up area was similar to that of 2015 and mainly spread around the two CBDs. From 2025 to 2035, there is only the change of a 125-km2 area, including 58.54 km2 of built-up area.

3.3.3. Spontaneous Scenario

Figure 7 presents the land use/cover maps in 2025 (a) and 2035 (b), and the change map (c) from 2015 to 2035 under SS. Table 4 shows the area change between two periods (2015–2025 and 2025–2035). By 2025, the built-up area increased to 40.08% of the total area in Tianjin city. The built-up area in 2035 expanded by 7% compared to the previous decade. In Figure 7c, the latest distribution of the built-up area was observed in the surrounding area of the previous built-up distribution. Additionally, the northern part was not covered by other land use/cover classes but only cropland. Unlike the other scenarios, between 2025 and 2035, an area of around 1800 km2 changed and half of it was gain of built-up area. By 2035, the proportion of built-up areas increased to 47.94%.

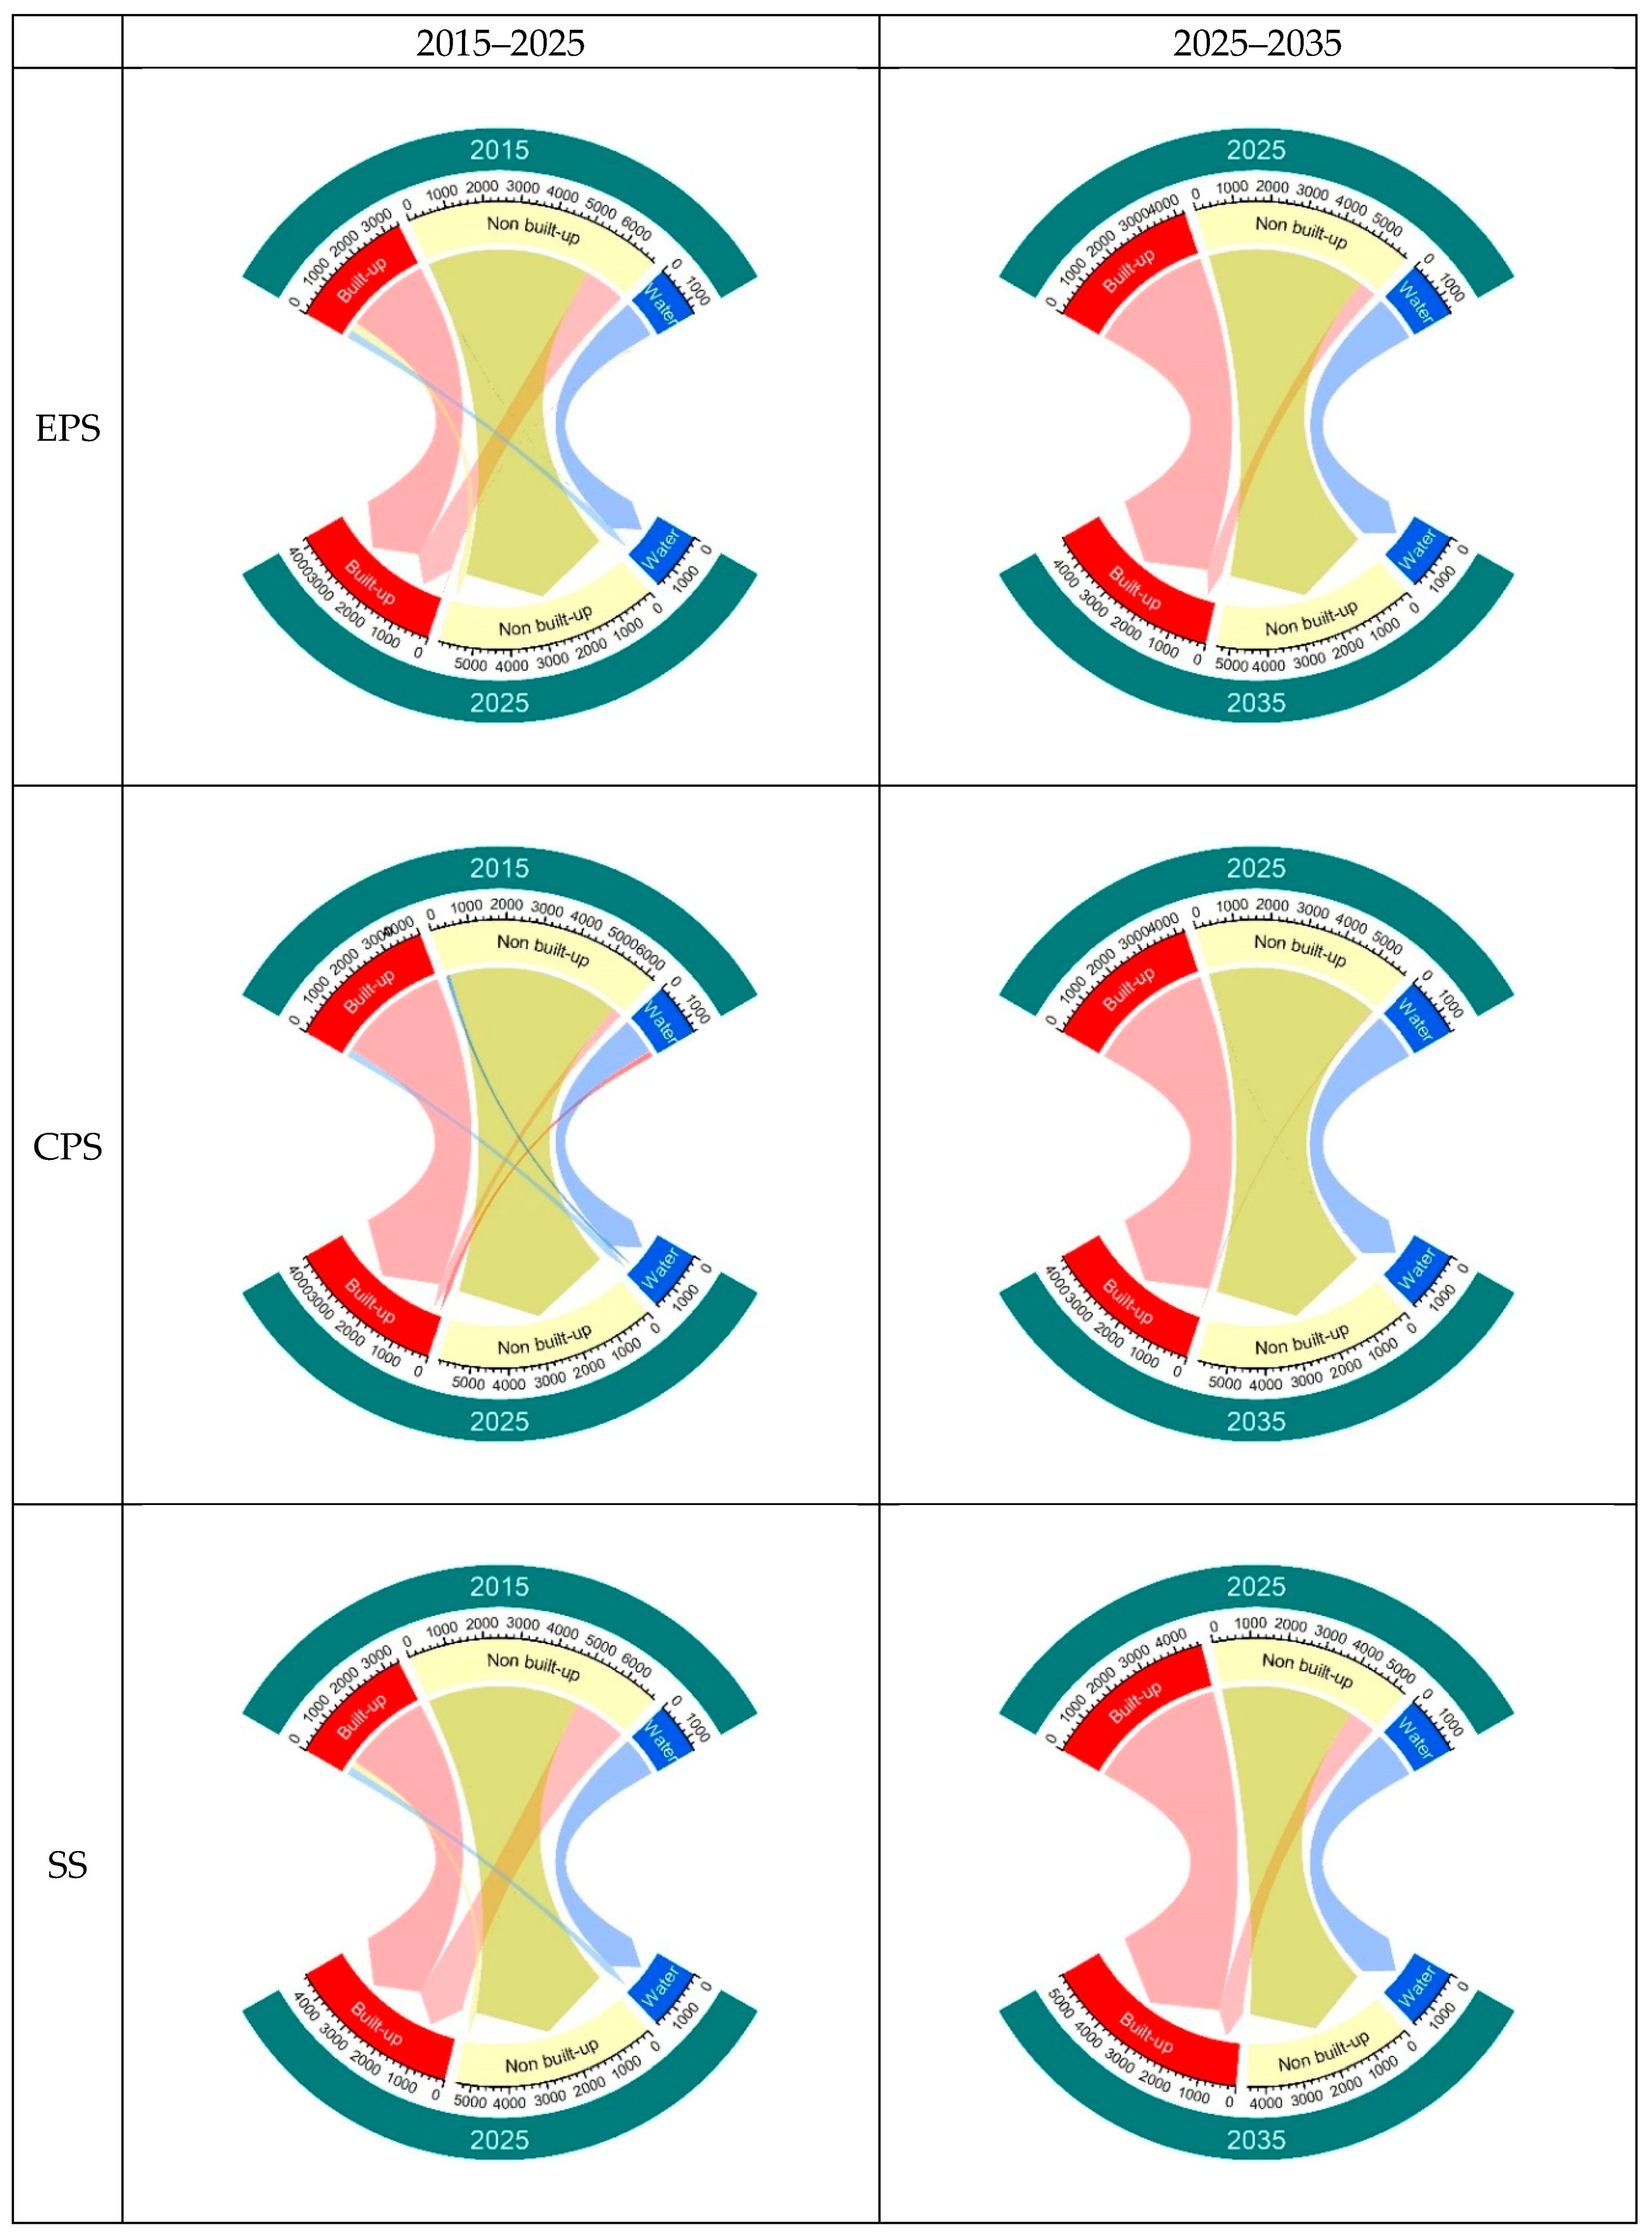
3.4. Land Use/Cover Transition

Figure 8 shows the quantity of land use/cover under EPS, CPS, and SS for 2025 and 2035. The coverage of built-up areas in CPS showed the least inventory compared with other scenarios for 2025. In the same year, the quantity of built-up areas under SS had a significant increase from 2015. In contrast, owing to the restriction to cropland, built-up areas in 2035 under CPS increased slowly. The built-up area under SS in 2035 occupied the first position and became larger than non-built-up areas. Figure 9 shows the quantity of mutual transition between the three land use/cover types under the three scenarios from 2015 to 2025 and 2025 to 2035. Around 25% of the non-built-up areas changed into built-up areas from 2015 to 2025, with the biggest transition found under SS. However, from 2025 to 2035, the proportion of built-up areas gained from non-built-up areas was decreasing under all the scenarios.

4. Discussion

4.1. Prediction of Urbanization under Different Scenarios and Its Impact

Under all three scenarios, the occupation of built-up areas grew between 2015 and 2035 and was mainly gained from cropland and grass, especially in SS. This phenomenon illustrates that, after 20 years, Tianjin city is still in the development phase.
EPS is essential for sustainable planning from the perspective of environmental protection. In this research, we implemented an EPS by considering the policies established by the Ministry of Environmental Protection (MEP) of the People’s Republic of China and the United Nations Environment Programme (UN Environment), which stress green area protection in the city center, forest protection in the countryside, and sustainable development overall. The simulated land use/cover results demonstrate that although the built-up area continues to grow rapidly and enlarges from CBD to suburban areas, the green area in the wetland nature reserve will not be covered by built-up areas. Additionally, the forest area in the northern part will also be protected under EPS.
Under CPS, built-up areas show a low level of growth. In 2025, the built-up area is slightly smaller than SS. However, it turns out to be the lowest in 2035 among the three scenarios and becomes significantly smaller than SS. From 2025 to 2035, built-up areas of both EPS and SS experience a certain amount of increase, whereas built-up areas under CPS remain almost unchanged. A related study reported that urban areas in China are mostly converted from cropland, and urbanization is responsible for more than 50% of cropland loss [67]. Consequently, restricting the transformation of cropland to built-up areas will greatly confine urban expansion [68]. Another study on Huangmei County of Hubei Province in China also confirmed that land preservation policies have inhibited urban expansion [69].
From a national perspective, cropland conservation is the key to ensure food security, as China is seeking to maintain a high level of self-sufficiency in grains. Although the loss of cropland may not be able to threaten the food security of grain in Tianjin city, it will reduce urban consumers’ welfare since vegetables and fruits are mainly produced by farmers in suburban areas. It is almost certain that the Chinese government will continue the cropland protection policy in the process of urbanization. Additionally, it is even possible that more stringent regulation may be imposed in the future, considering the increasing trend of cropland loss. Therefore, the adoption of CPS in urban sprawl prediction will provide insightful and comprehensive information for future planning.
SS serves as a benchmark for other scenarios to illustrate the effectiveness of the model and modeling variables [70]. Similar to the result from Thapa and Murayama (2012), the quantity of built-up areas under SS is definitely more than the other two scenarios and the distribution of built-up areas has been spread from the city center to surrounding areas [62]. The reason is that the study area in Thapa and Murayama’s paper is located in Nepal, which belongs to a developing country, same as China. In the past 30 years, the most rapid development of urbanization has occurred in developing countries [71]. However, SS is only based on the historical trend without other limitations, so that the same historical background causes the same result under SS.
As one of the major megacities in northern China, Tianjin city has experienced huge expansion in the last few decades. Along with this process, environmental and agricultural concerns have arisen, such as air pollution, water shortage, biodiversity loss, and food security. Recently, the municipal government of Tianjin city realized that sustainable development could not be achieved without proper policies and regulation. As a result, environmental protection and sustainability have been more frequently considered in urban planning. Moreover, all the scenarios were designed under the assumption of sustained and stable economic development. A continuous, stable, and coordinated development of the economic environment is critical in obtaining sustainable urban development [72]. From land use/cover maps in 1995, 2005, and 2015, urban development in Tianjin has presented a steady increasing trend and has met its economic background requirements. EPS and CPS scenarios simulated in this study provide a benchmark as a reference for the future layout of Tianjin city.

4.2. Advantages of Scenario-Based Modeling

In recent years, with developments in urbanization studies, scenario-based land use/cover simulations have been attracting increasing attention from urban planners [73]. Spatiotemporal models have been widely applied in urban areas under different scenarios [74]. For example, the spatial construction of land use/cover in Yuzhong county has been simulated by using the CLUE-S model under farmland protection, economic-oriented, and ecologically oriented scenarios [75]. Coupling a cellular automata model and a system dynamic model, He et al. (2006) simulated urban expansion scenarios in Beijing, China [76]. Regardless of the different scenarios, the advantage of scenario-based modeling is that the future condition has been considered in wide-ranging and varied perspectives. Owing to rapid land use/cover changes in developing countries, only applying historical trends to simulate future conditions cannot provide enough information for sustainable urban planning. Because urbanization is a complicated process, historical trends, environmental protection policy, urban development policy, and local policy are all critical criteria that should be considered in simulations for a more accurate and realistic prediction outcome.
Although the scenarios in our study were not complicated, they consisted of urban sprawl rules and policies. Additionally, the land use/cover distributions of Tianjin in 2025 and 2035 have been obtained by different scenarios and the results are considered to be valuable references for government and urban planners. The CA–Markov model acts as a significant cornerstone in the investigation. During the simulation, the spatiotemporal analysis of urban growth was established. However, there is a limitation of the CA–Markov model such that some regional drivers, such as population and GDP growth, technological progress, and market regulations, are not incorporated into the spatial analysis, and we should not overlook the land use/cover change quantitatively induced by these regional drivers [77]. For further studies, we suggest using other land use/cover change models such as complex hybrid models to derive more information related to urbanization.

5. Conclusions

EPS, CPS, and SS in our simulation are rooted in the environmental and agricultural concerns raised by urbanization in Tianjin city. Simulation results are derived from the connection of the spatiotemporal process and the planning objectives, which provide possible directions to balance urbanization, environmental protection, and food security.
This study contributes forward-looking knowledge on the process of urbanization in Tianjin, lending further support to urban planners for considering sustainable development plans of the city. In this study, EPS, CPS, and SS were framed based on official plans, policies, and historical trends. EPS was designed based on the national overall planning of forest land conservation released by the local government in 2011, which aimed to make a green barrier between the central districts of Tianjin and the newly developed Binhai district. CPS was designed based on a law named “Regulations on the Protection of Basic Farmland in Tianjin”, which marked protected farmlands and banned the change or abandonment of these farmlands. SS was based on historical trends, which are widely used in land use/cover prediction studies.
In general, considering the historical trend, the urbanization process will continue to 2035 with a significant increase in the built-up area. In contrast, the other land use/cover types show an inconsistent trend under three different scenarios designed in this study. Under EPS and CPS, the protected land use/cover type remained consistent, which resulted in a relatively larger decrease of the unprotected land use/cover types. At the same time, because of the spatial limitation on urban expansion, the speed of urbanization was also decelerated. On the other hand, all the land use/cover types, except built-up areas, decreased significantly under SS compared to the other two scenarios. The results illustrate that the current status of urban planning is in a significant stage to prevent chaotic urban sprawl and unsustainable development. In the case where the government policy was not well implemented, the land use/cover condition would follow SS in 2035, which shows an unprecedented loss of agriculture and forest resources. These results highlight the improvement of future simulations under different scenarios and illustrate the importance of proper policies related to the protection of the assigned land use/cover types for keeping a more sustainable environment under the high pressure from urbanization. Further, complex policies considering both development and environmental protection are in great need to guide the urbanization trend into a healthier direction for Tianjin.
The flexible scheme employed in this study enables users to have different inputs based on local conditions. Considering the transparent process and the available data, this study is useful for the analysis of urban growth and land cover changes in other similar study sites. However, it is worth noting that the approach fails to include socioeconomic data with precise spatial information because of limited data availability, although these data are highly related to the urban development process. Future studies are recommended to acquire more refined data to produce more accurate results for urban planners.

Author Contributions

R.W., H.H. and Y.M. conceived and designed the study. R.W. obtained and organized the data. R.W. conducted the scenario-based modeling. R.W. and H.H. processed the statistical analyses. R.W. and H.H. analyzed the results and wrote the manuscript. Y.M. leaded the research project and supervised the study. All coauthors helped discussing and reviewing the article.

Funding

This study was supported by the Japan Society for the Promotion of Science (JSPS) through Grant-in-Aid for Challenging Exploratory Research 16K12816, and Scientific Research (B) 18H00763.

Acknowledgments

The authors would like to thank the anonymous reviewers for their valuable comments and suggestions.

Conflicts of Interest

The authors declare no conflicts of interest.

References

  1. Li, Y.; He, C. Scenario simulation and forecast of land use/cover in northern China. Chin. Sci. Bull. 2008, 53, 1401. [Google Scholar] [CrossRef]
  2. Zhou, M. An interval fuzzy chance-constrained programming model for sustainable urban land-use planning and land use policy analysis. Land Use Policy 2015, 42, 479–491. [Google Scholar] [CrossRef]
  3. Zhang, R.; Matsushima, K.; Kobayashi, K. Can land use planning help mitigate transport-related carbon emissions? A case of Changzhou. Land Use Policy 2018, 74, 32–40. [Google Scholar] [CrossRef]
  4. Alqurashi, A.F.; Kumar, L.; Sinha, P. Urban land cover change modelling using time-series satellite images: A case study of urban growth in five cities of Saudi Arabia. Remote Sens. 2016, 8, 838. [Google Scholar] [CrossRef]
  5. Kindu, M.; Schneider, T.; Döllerer, M.; Teketay, D.; Knoke, T. Scenario modelling of land use/land cover changes in Munessa-Shashemene landscape of the Ethiopian highlands. Sci. Total Environ. 2018, 622–623, 534–546. [Google Scholar] [CrossRef] [PubMed]
  6. Geng, B.; Zheng, X.; Fu, M. Scenario analysis of sustainable intensive land use based on SD model. Sustain. Cities Soc. 2017, 29, 193–202. [Google Scholar] [CrossRef]
  7. Hu, Y.; Peng, J.; Liu, Y.; Tian, L. Integrating ecosystem services trade-offs with paddy land-to-dry land decisions: A scenario approach in Erhai Lake Basin, southwest China. Sci. Total Environ. 2018, 625, 849–860. [Google Scholar] [CrossRef] [PubMed]
  8. Wang, Y.-C.; Hu, B.K.H.; Myint, S.W.; Feng, C.-C.; Chow, W.T.L.; Passy, P.F. Patterns of land change and their potential impacts on land surface temperature change in Yangon, Myanmar. Sci. Total Environ. 2018, 643, 738–750. [Google Scholar] [CrossRef] [PubMed]
  9. Zhang, Q.; Ban, Y.; Liu, J.; Hu, Y. Simulation and analysis of urban growth scenarios for the Greater Shanghai Area, China. Comput. Environ. Urban Syst. 2011, 35, 126–139. [Google Scholar] [CrossRef]
  10. Tewolde, M.G.; Cabral, P. Urban sprawl analysis and modeling in Asmara, Eritrea. Remote Sens. 2011, 3, 2148–2165. [Google Scholar] [CrossRef]
  11. Clarke, K.C.; Hoppen, S.; Gaydos, L. A self-modifying cellular automaton model of historical urbanization in the San Francisco bay area. Environ. Plan. B Plan. Des. 1997, 24, 247–261. [Google Scholar] [CrossRef]
  12. Clarke, K.C.; Gaydos, L.J. Loose-coupling a cellular automaton model and GIS: Long-term urban growth prediction for San Francisco and Washington/Baltimore. Int. J. Geogr. Inf. Sci. 1998, 12, 699–714. [Google Scholar] [CrossRef] [PubMed]
  13. Seto, K.C.; Fragkias, M.; Güneralp, B.; Reilly, M.K. A meta-analysis of global urban land expansion. PLoS ONE 2011, 6, e23777. [Google Scholar] [CrossRef] [PubMed]
  14. Seto, K.C.; Fragkias, M. Quantifying spatiotemporal patterns of urban land-use change in four cities of China with time series landscape metrics. Landsc. Ecol. 2005, 20, 871–888. [Google Scholar] [CrossRef]
  15. Xue, F. A Review of Urbanization and Urban Development Since the Founding of New China. Available online: http://www.hprc.org.cn/gsyj/yjjg/zggsyjxh_1/gsnhlw_1/jjgslw/201110/t20111019_162379.html (accessed on 17 July 2018).
  16. National Bureau of Statistics of the People’s Republic of China. Available online: http://www.stats.gov.cn (accessed on 30 April 2018).
  17. Wang, M.; Zhang, X.; Yan, X. Modeling the climatic effects of urbanization in the Beijing–Tianjin–Hebei metropolitan area. Theor. Appl. Climatol. 2013, 113, 377–385. [Google Scholar] [CrossRef]
  18. Wang, R.; Murayama, Y. Change of land use/cover in Tianjin city based on the markov and cellular automata models. ISPRS Int. J. Geo-Inf. 2017, 6, 150. [Google Scholar] [CrossRef]
  19. National Forestry Census. Available online: http://www.forestry.gov.cn/gjslzyqc.html (accessed on 24 April 2018).
  20. Promote the Sustainable Development of Cities with Ecological Environment Construction (in CHINESE). Available online: http://www.tjszx.gov.cn/yzjy/system/2015/01/28/010001307.shtml (accessed on 25 April 2018).
  21. Tianjin Has Been One of the Most Water-Deficient Cities in the Northern China (in Chinese). Available online: http://env.people.com.cn/n/2014/0922/c1010-25706486-2.html (accessed on 28 April 2018).
  22. Dong, J.; Tang, T. The present situation of the species diversity in Tianjin and the reasons of its loss (in Chinese). In Proceedings of the Second National Symposium on the Conservation and Sustainable Use of Biological Diversity, Beijing, China, 20 November 1996. [Google Scholar]
  23. Tianjin Biodiversity Conservation Strategy Action Plan 2011–2030 (in Chinese). Available online: http://www.tjhb.gov.cn/root16/mechanism/the_natural_ecological_protection/201501/t20150120_13438.html (accessed on 27 April 2018).
  24. Reynolds, G.; Payne, J.; Sinun, W.; Mosigil, G.; Walsh, R.P.D. Changes in forest land use and management in Sabah, Malaysian Borneo, 1990–2010, with a focus on the Danum Valley region. Phil. Trans. R Soc. B 2011, 366, 3168–3176. [Google Scholar] [CrossRef] [PubMed]
  25. Liu, J.; Tian, H.; Liu, M.; Zhuang, D.; Melillo, J.M.; Zhang, Z. China’s changing landscape during the 1990s: Large-scale land transformations estimated with satellite data. Geophys. Res. Lett. 2005, 32, L02405. [Google Scholar] [CrossRef]
  26. Lichtenberg, E.; Ding, C. Assessing farmland protection policy in China. Land Use Policy 2008, 25, 59–68. [Google Scholar] [CrossRef]
  27. Skinner, M.W.; Kuhn, R.G.; Joseph, A.E. Agricultural land protection in China: A case study of local governance in Zhejiang Province. Land Use Policy 2001, 18, 329–340. [Google Scholar] [CrossRef]
  28. Tan, M.; Li, X.; Xie, H.; Lu, C. Urban land expansion and arable land loss in China—A case study of Beijing–Tianjin–Hebei region. Land Use Policy 2005, 22, 187–196. [Google Scholar] [CrossRef]
  29. Liang, C.; Penghui, J.; Wei, C.; Manchun, L.; Liyan, W.; Yuan, G.; Yuzhe, P.; Nan, X.; Yuewei, D.; Qiuhao, H. Farmland protection policies and rapid urbanization in China: A case study for Changzhou City. Land Use Policy 2015, 48, 552–566. [Google Scholar] [CrossRef]
  30. Kuang, W. Simulating dynamic urban expansion at regional scale in Beijing-Tianjin-Tangshan Metropolitan Area. J. Geogr. Sci. 2011, 21, 317. [Google Scholar] [CrossRef]
  31. Nunes de Oliveira, S.; Abílio de Carvalho Júnior, O.; Trancoso Gomes, R.A.; Fontes Guimarães, R.; McManus, C.M. Deforestation analysis in protected areas and scenario simulation for structural corridors in the agricultural frontier of Western Bahia, Brazil. Land Use Policy 2017, 61, 40–52. [Google Scholar] [CrossRef]
  32. Behera, M.D.; Borate, S.N.; Panda, S.N.; Behera, P.R.; Roy, P.S. Modelling and analyzing the watershed dynamics using Cellular Automata (CA)–Markov mode—A geo-information based approach. J. Earth Syst. Sci. 2012, 121, 1011–1024. [Google Scholar] [CrossRef]
  33. Mondal, P.; Southworth, J. Evaluation of conservation interventions using a cellular automata-Markov model. For. Ecol. Manag. 2010, 260, 1716–1725. [Google Scholar] [CrossRef]
  34. T Karst; Jan R Ritsema van Eck Evaluation of accessibility impacts of land-use scenarios: The implications of job competition, land-use, and infrastructure developments for the Netherlands. Environ. Plan. B Plan. Des. 2003, 30, 69–87. [CrossRef]
  35. Wang, R.; Derdouri, A.; Murayama, Y. Spatiotemporal simulation of future land use/cover change scenarios in the Tokyo metropolitan area. Sustainability 2018, 10, 2056. [Google Scholar] [CrossRef]
  36. Kamusoko, C.; Aniya, M.; Adi, B.; Manjoro, M. Rural sustainability under threat in Zimbabwe – Simulation of future land use/cover changes in the Bindura district based on the Markov-cellular automata model. Appl. Geogr. 2009, 29, 435–447. [Google Scholar] [CrossRef]
  37. Shi, H.; Chertow, M.; Song, Y. Developing country experience with eco-industrial parks: A case study of the Tianjin Economic-Technological Development Area in China. J. Clean. Prod. 2010, 18, 191–199. [Google Scholar] [CrossRef]
  38. Xue, M.; Luo, Y. Dynamic variations in ecosystem service value and sustainability of urban system: A case study for Tianjin city, China. Cities 2015, 46, 85–93. [Google Scholar] [CrossRef]
  39. Weng, Q. Remote sensing of impervious surfaces in the urban areas: Requirements, methods, and trends. Remote Sens. Environ. 2012, 117, 34–49. [Google Scholar] [CrossRef]
  40. U.S. Geological Survey. Available online: www.usgs.gov (accessed on 28 April 2018).
  41. Yen, P.; Ziegler, S.; Huettmann, F.; Onyeahialam, A.I. Change detection of forest and habitat resources from 1973 to 2001 in Bach Ma National Park, Vietnam, Using Remote Sensing Imagery. Available online: https://www.ingentaconnect.com/content/cfa/ifr/2005/00000007/00000001/art00001 (accessed on 12 July 2018).
  42. Nielsen, S.E.; Stenhouse, G.B.; Beyer, H.L.; Huettmann, F.; Boyce, M.S. Can natural disturbance-based forestry rescue a declining population of grizzly bears? Biol. Conserv. 2008, 141, 2193–2207. [Google Scholar] [CrossRef]
  43. Onyeahialam, A.; Huettmann, F.; Bertazzon, S. Modeling sage grouse: Progressive computational methods for linking a complex set of local, digital biodiversity and habitat data towards global conservation statements and decision-making systems. In Computational Science and Its Applications—ICCSA 2005; Lecture Notes in Computer Science; Springer: Berlin/Heidelberg, Germany, 2005; pp. 152–161. [Google Scholar]
  44. Wang, W.; Zhang, C.; Allen, J.M.; Li, W.; Boyer, M.A.; Segerson, K.; Silander, J.A. Analysis and prediction of land use changes related to invasive species and major driving forces in the state of connecticut. Land 2016, 5, 25. [Google Scholar] [CrossRef]
  45. Zhai, R.; Zhang, C.; Li, W.; Boyer, M.A.; Hanink, D. Prediction of land use change in long island sound watersheds using nighttime light data. Land 2016, 5, 44. [Google Scholar] [CrossRef]
  46. Gong, J.; Li, J.; Yang, J.; Li, S.; Tang, W. Land use and Land cover change in the qinghai lake region of the tibetan plateau and its impact on ecosystem services. Int. J. Environ. Res. Public. Health 2017, 14, 818. [Google Scholar] [CrossRef] [PubMed]
  47. Guan, D.; Li, H.; Inohae, T.; Su, W.; Nagaie, T.; Hokao, K. Modeling urban land use change by the integration of cellular automaton and Markov model. Ecol. Model. 2011, 222, 3761–3772. [Google Scholar] [CrossRef]
  48. Brown, D.G.; Pijanowski, B.C.; Duh, J.D. Modeling the relationships between land use and land cover on private lands in the Upper Midwest, USA. J. Environ. Manage. 2000, 59, 247–263. [Google Scholar] [CrossRef] [Green Version]
  49. Subedi, P.; Subedi, K.; Thapa, B. Application of a hybrid cellular automaton—Markov (CA-Markov) model in land-use change prediction: A case study of Saddle Creek Drainage Basin, Florida. Appl. Ecol. Environ. Sci. Appl. Ecol. Environ. Sci. 2013, 1, 126–132. [Google Scholar] [CrossRef]
  50. Irwin, E.G.; Geoghegan, J. Theory, data, methods: Developing spatially explicit economic models of land use change. Agric. Ecosyst. Environ. 2001, 85, 7–24. [Google Scholar] [CrossRef]
  51. Howard, D.M.; Howard, P.J.A.; Howard, D.C. A markov model projection of soil organic carbon stores following land use changes. J. Environ. Manag. 1995, 45, 287–302. [Google Scholar] [CrossRef]
  52. Batty, M.; Couclelis, H.; Eichen, M. Urban systems as cellular automata. Environ. Plan. B Plan. Des. 1997, 24, 159–164. [Google Scholar] [CrossRef]
  53. Kirik, E.; Vitova, T. Cellular automata pedestrian movement model SIgMA.CA: Model parameters as an instrument to regulate movement regimes. In Cellular Automata; Springer: Cham, Switzerland, 2014; pp. 501–507. [Google Scholar]
  54. Manneville, P.; Boccara, N.; Vichniac, G.Y.; Bidaux, R. Cellular Automata and Modeling of Complex Physical Systems. In Proceedings of the Winter School, Les Houches, France, 21–28 February 1989; Springer Science & Business Media: Berlin, Germany, 2012. ISBN 978-3-642-75259-9. [Google Scholar]
  55. Gaudreau, J.; Perez, L.; Drapeau, P. BorealFireSim: A GIS-based cellular automata model of wildfires for the boreal forest of Quebec in a climate change paradigm. Ecol. Inform. 2016, 32, 12–27. [Google Scholar] [CrossRef]
  56. Memarian, H.; Balasundram, S.K.; Talib, J.B.; Sung, C.T.B.; Sood, A.M.; Abbaspour, K. Validation of CA-Markov for simulation of land use and cover change in the Langat Basin, Malaysia. J. Geogr. Inf. Syst. 2012, 4, 542. [Google Scholar] [CrossRef]
  57. Samat, N.; Hasni, R.; Elhadary, Y.A.E. Modelling land use changes at the peri-urban areas using geographic information systems and cellular automata model. J. Sustain. Dev. 2011, 4, 72. [Google Scholar] [CrossRef]
  58. Long, H.; Liu, Y.; Hou, X.; Li, T.; Li, Y. Effects of land use transitions due to rapid urbanization on ecosystem services: Implications for urban planning in the new developing area of China. Habitat Int. 2014, 44, 536–544. [Google Scholar] [CrossRef]
  59. Jr, R.G.P.; Millones, M. Death to Kappa: Birth of quantity disagreement and allocation disagreement for accuracy assessment. Int. J. Remote Sens. 2011, 32, 4407–4429. [Google Scholar] [CrossRef]
  60. Ahmed, B.; Ahmed, R.; Zhu, X. Evaluation of model validation techniques in land cover dynamics. ISPRS Int. J. Geo-Inf. 2013, 2, 577–597. [Google Scholar] [CrossRef]
  61. The Outline of the National Overall Planning on Forest Land Conservation (in Chinese). Available online: http://www.forestry.gov.cn/uploadfile/main/2010-8/file/2010-8-25-782d45dbdeea41398ff31b1023814c13.pdf (accessed on 29 April 2018).
  62. Thapa, R.B.; Murayama, Y. Scenario based urban growth allocation in Kathmandu Valley, Nepal. Landsc. Urban Plan. 2012, 105, 140–148. [Google Scholar] [CrossRef]
  63. Liu, Y.; Fang, F.; Li, Y. Key issues of land use in China and implications for policy making. Land Use Policy 2014, 40, 6–12. [Google Scholar] [CrossRef]
  64. Singh, P.; Kikon, N.; Verma, P. Impact of land use change and urbanization on urban heat island in Lucknow city, Central India. A remote sensing based estimate. Sustain. Cities Soc. 2017, 32, 100–114. [Google Scholar] [CrossRef]
  65. The Regulation on the Implementation of the Land Administration Law of Peoples Republic of China (in Chinese). Available online: https://www.tuliu.com/read-32186.html (accessed on 29 April 2018).
  66. Dezhkam, S.; Amiri, B.J.; Darvishsefat, A.A.; Sakieh, Y. Simulating the urban growth dimensions and scenario prediction through sleuth model: A case study of Rasht County, Guilan, Iran. GeoJournal 2014, 79, 591–604. [Google Scholar] [CrossRef]
  67. Liu, J.; Liu, M.; Tian, H.; Zhuang, D.; Zhang, Z.; Zhang, W.; Tang, X.; Deng, X. Spatial and temporal patterns of China’s cropland during 1990–2000: An analysis based on Landsat TM data. Remote Sens. Environ. 2005, 98, 442–456. [Google Scholar] [CrossRef]
  68. Lambin, E.F.; Rounsevell, M.D.A.; Geist, H.J. Are agricultural land-use models able to predict changes in land-use intensity? Agric. Ecosyst. Environ. 2000, 82, 321–331. [Google Scholar] [CrossRef]
  69. He, J.; Liu, Y.; Yu, Y.; Tang, W.; Xiang, W.; Liu, D. A counterfactual scenario simulation approach for assessing the impact of farmland preservation policies on urban sprawl and food security in a major grain-producing area of China. Appl. Geogr. 2013, 37, 127–138. [Google Scholar] [CrossRef]
  70. Kusratmoko, E.; Albertus, S.D.Y.; Supriatna. Modelling land use/cover changes with Markov-cellular automata in Komering Watershed, South Sumatera. IOP Conf. Ser. Earth Environ. Sci. 2017, 54, 012103. [Google Scholar] [CrossRef]
  71. Cohen, B. Urban growth in developing countries: A review of current trends and a caution regarding existing forecasts. World Dev. 2004, 32, 23–51. [Google Scholar] [CrossRef]
  72. Daly, H.E.; Farley, J. Ecological Economics, Second Edition: Principles and Applications; Island Press: Washington, DC, USA, 2011; ISBN 978-1-59726-991-9. [Google Scholar]
  73. Yang, X.; Zheng, X.-Q.; Lv, L.-N. A spatiotemporal model of land use change based on ant colony optimization, Markov chain and cellular automata. Ecol. Model. 2012, 233, 11–19. [Google Scholar] [CrossRef]
  74. Pijanowski, B.C.; Tayyebi, A.; Doucette, J.; Pekin, B.K.; Braun, D.; Plourde, J. A big data urban growth simulation at a national scale: Configuring the GIS and neural network based land transformation model to run in a High Performance Computing (HPC) environment. Environ. Model. Softw. 2014, 51, 250–268. [Google Scholar] [CrossRef]
  75. Xu, Y.; Luo, D.; Guo, H.; Zhou, D. Multi-simulation of spatial distribution of land use based on CLUE-S model: A case study of Yuzhong County, Gansu Province. Beijing Daxue Xuebao Ziran Kexue BanActa Sci. Nat. Univ. Pekin. 2013, 49, 523–529. [Google Scholar]
  76. He, C.; Okada, N.; Zhang, Q.; Shi, P.; Zhang, J. Modeling urban expansion scenarios by coupling cellular automata model and system dynamic model in Beijing, China. Appl. Geogr. 2006, 26, 323–345. [Google Scholar] [CrossRef]
  77. Li, C.; Zhao, J.; Xu, Y. Examining spatiotemporally varying effects of urban expansion and the underlying driving factors. Sustain. Cities Soc. 2017, 28, 307–320. [Google Scholar] [CrossRef]
Figure 1. Location of the study area.
Sustainability 10 02633 g001
Figure 2. Spatial patterns of six variables: (a) distance to central business districts (CBDs); (b) distance to markets; (c) distance to roads; (d) distance to built-up areas; (e) digital elevation model (DEM); and (f) slope.
Sustainability 10 02633 g002
Figure 3. Land use/cover maps in (a) 2005, (b) 2015, and (c) the change map from 2005 to 2015.
Sustainability 10 02633 g003
Figure 4. Transition suitability maps for urbanization in three scenarios: (a) environmental protection scenario (EPS); (b) cropland protection scenario (CPS); and (c) spontaneous scenario (SS).
Sustainability 10 02633 g004
Figure 5. Spatial optimization of the urban growth allocations based on EPS: (a) land use/cover map in 2025; (b) land use/cover map in 2035; (c) change map from 2015 to 2035.
Sustainability 10 02633 g005
Figure 6. Spatial optimization of urban growth allocations based on CPS: (a) land use/cover map in 2025; (b) the land use/cover map in 2035; and (c) the change map from 2015 to 2035.
Sustainability 10 02633 g006
Figure 7. Spatial optimization of urban growth allocations based on SS: (a) the land use/cover map in 2025; (b) the land use/cover map in 2035; and (c) the change map from 2015 to 2035.
Sustainability 10 02633 g007
Figure 8. The quantity of land use/cover under three scenarios for 2025 and 2035.
Sustainability 10 02633 g008
Figure 9. Land use/cover transition under three scenarios for 2025 and 2035 (in km2).
Sustainability 10 02633 g009
Table 1. Transition probability matrix in land use/cover, 2005–2015.
Land Use/Cover Map 2015Land Use/Cover Map 2005
Built-UpNon-Built-UpWater
Built-up0.830.170
Non-built-up0.32430.65270.023
Water00.14580.8542
Table 2. Land use/cover change under EPS.
2015–202520252025–20352035
Area ChangeLand Use/CoverArea ChangeLand Use/Cover
Unit(Sq km)(Sq km)(%)(Sq km)(Sq km)(%)
Built-up924.524328.8137.05190.534519.3438.68
Non-built-up−921.015975.1251.14−162.345812.7949.75
Water−3.521380.8011.82−28.191352.6111.58
Table 3. Land use/cover change rate delineation analysis under CPS.
2015–202520252025–20352035
Area ChangeLand Use/CoverArea ChangeLand Use/Cover
Unit(Sq km)(Sq km)(%)(Sq km)(Sq km)(%)
Built-up214.354227.0734.3558.544285.6136.18
Non-built-up−411.005847.0353.56−61.995785.0450.05
Water195.431609.4212.103.431612.851378
Table 4. Land use/cover change under SS.
2015–202520252025–20352035
Area ChangeLand Use/CoverArea ChangeLand Use/Cover
Unit(Sq km)(Sq km)(%)(Sq km)(Sq km)(%)
Built-up1278.314682.6040.07918.815601.4147.94
Non-built-up−1500.025396.1146.18−917.844478.2738.33
Water221.711606.0313.74−0.971605.0613.74

