1. Introduction
The application of Battery Energy Storage Systems (BESSs) in power systems has increasingly gained attention over the last years. The reasons encompass functions, services and benefits that they can bring to power system operation [
1,
2,
3], e.g., peak shaving [
4,
5,
6,
7], voltage stability [
8], market functions [
9], frequency response [
10,
11,
12,
13]. BESSs are also recognized as a means to increase the level of security, reliability, flexibility and quality in power systems [
14,
15], especially in distribution grids: at distribution level, the spread of Dispersed Generation (DG), based on renewable energy sources (RES), has led to changes that are still hard to accurately forecast and manage.
In this framework, the installation of BESSs in High Voltage/Medium Voltage (HV/MV) stations has been recently regarded as a possible solution to many problems of the global power system (transmission and distribution). This has been favored by many Distribution System Operators (DSOs), including
e-distribuzione, the largest Italian DSO by extent [
16,
17,
18].
An additional driver for this application by
e-distribuzione has been financial funding by Governments and the European Community on pilot projects aimed at testing the real performance of BESSs in smart grids [
19,
20].
At the same time, in Italy, electricity market rules on the management of the power systems are evolving, according to different policies [
21,
22]; this evolution involves in particular DSOs and DG dispatching. In addition, a great impulse is given to investments towards smart distribution systems; i.e., distribution grids with a higher level of automation and control for guaranteeing higher level of security, reliability, flexibility and resilience of network to improve the quality of service. The Italian former regulatory Authority for electricity, gas and water system(AEEGSI), now regulatory Authority for energy, networks and the environment (ARERA) proposes these important features for development of a smart distribution system [
23]:
Observability of power flows and DG
Voltage regulation at MV level
Active power regulation at user level
Remote control for the prevention of the “unwanted island” phenomenon
Advanced operation of MV grids
The use of ESSs
In the same document, AEEG-SI defines the possible functionalities for BESS already installed in HV/MV stations for smart grid pilot projects:
Energy exchange profile levelling (active power control) with the HV network, for the reduction and better management of the variability of the DG
Power factor correction and/or the voltage control (reactive power control)
Back-up function for short interruption
Black-start function of limited portions of grid
Management and control of electric vehicles charging stations (if owned by the DSO)
Thus, among all the functionalities of BESSs, there is the support to power system restoration after a blackout or an interruption of a HV/MV station. Indeed, the BESS charging/discharging flexibility can help keep the balance between power supply and demand during the system restoration process, working as the slack bus in the absence of the main grid.
Given this background, the application of BESSs in power system restoration is worth investigation. In scientific literature, only few papers (e.g., [
24,
25,
26,
27,
28]) deal with this specific issue, while a large amount of research work has been focused on BESS charging/discharging control, mitigating the intermittent power generation of renewable energy sources. In [
29], the potential roles of BESSs in power system restoration are deeply discussed and a detailed control strategy for the BESSs during the restoration period is also developed, while mentioning pros and cons of the adopted approach. Restoration problems are generally addressed by adopting different mathematical techniques able to define a reconfiguration of the electric grid, while satisfying its constraints. In [
30], an overview of such techniques has been explained: from deterministic mathematical programming, to heuristics and knowledge-based systems. However, neither distribution system operator regulatory constraints nor real scale application of the proposed mathematical techniques have been taken into account, on the grounds that there is no experience on the matter.
The focus of this paper is the study of the use of a BESS in HV/MV station of a real active distribution grid to support the restoration of the system after a blackout on the HV side or an interruption, according to the actual regulation and technologies available on the physical system. As explained in the paper, the analyses have been carried out with reference to a specific real case study: the purpose is to verify if restoration network plans, developed according to the actual rules of operation of distribution grids and available controls resources, can ensure a more secure operation of a real distribution system and to improve the quality of service (i.e., reduction of time of outage and number of customers not supplied during the HV interruption). The validation has been performed in steady state operation, verifying power balance and compliance with voltage and current constraints in all the components of the system (including BESS). Issues related to the transients and frequency and voltage controls are neglected at this stage of the work.
2. Present Operation Procedure of Distribution Grids during a Blackout or Interruption (without BESS)
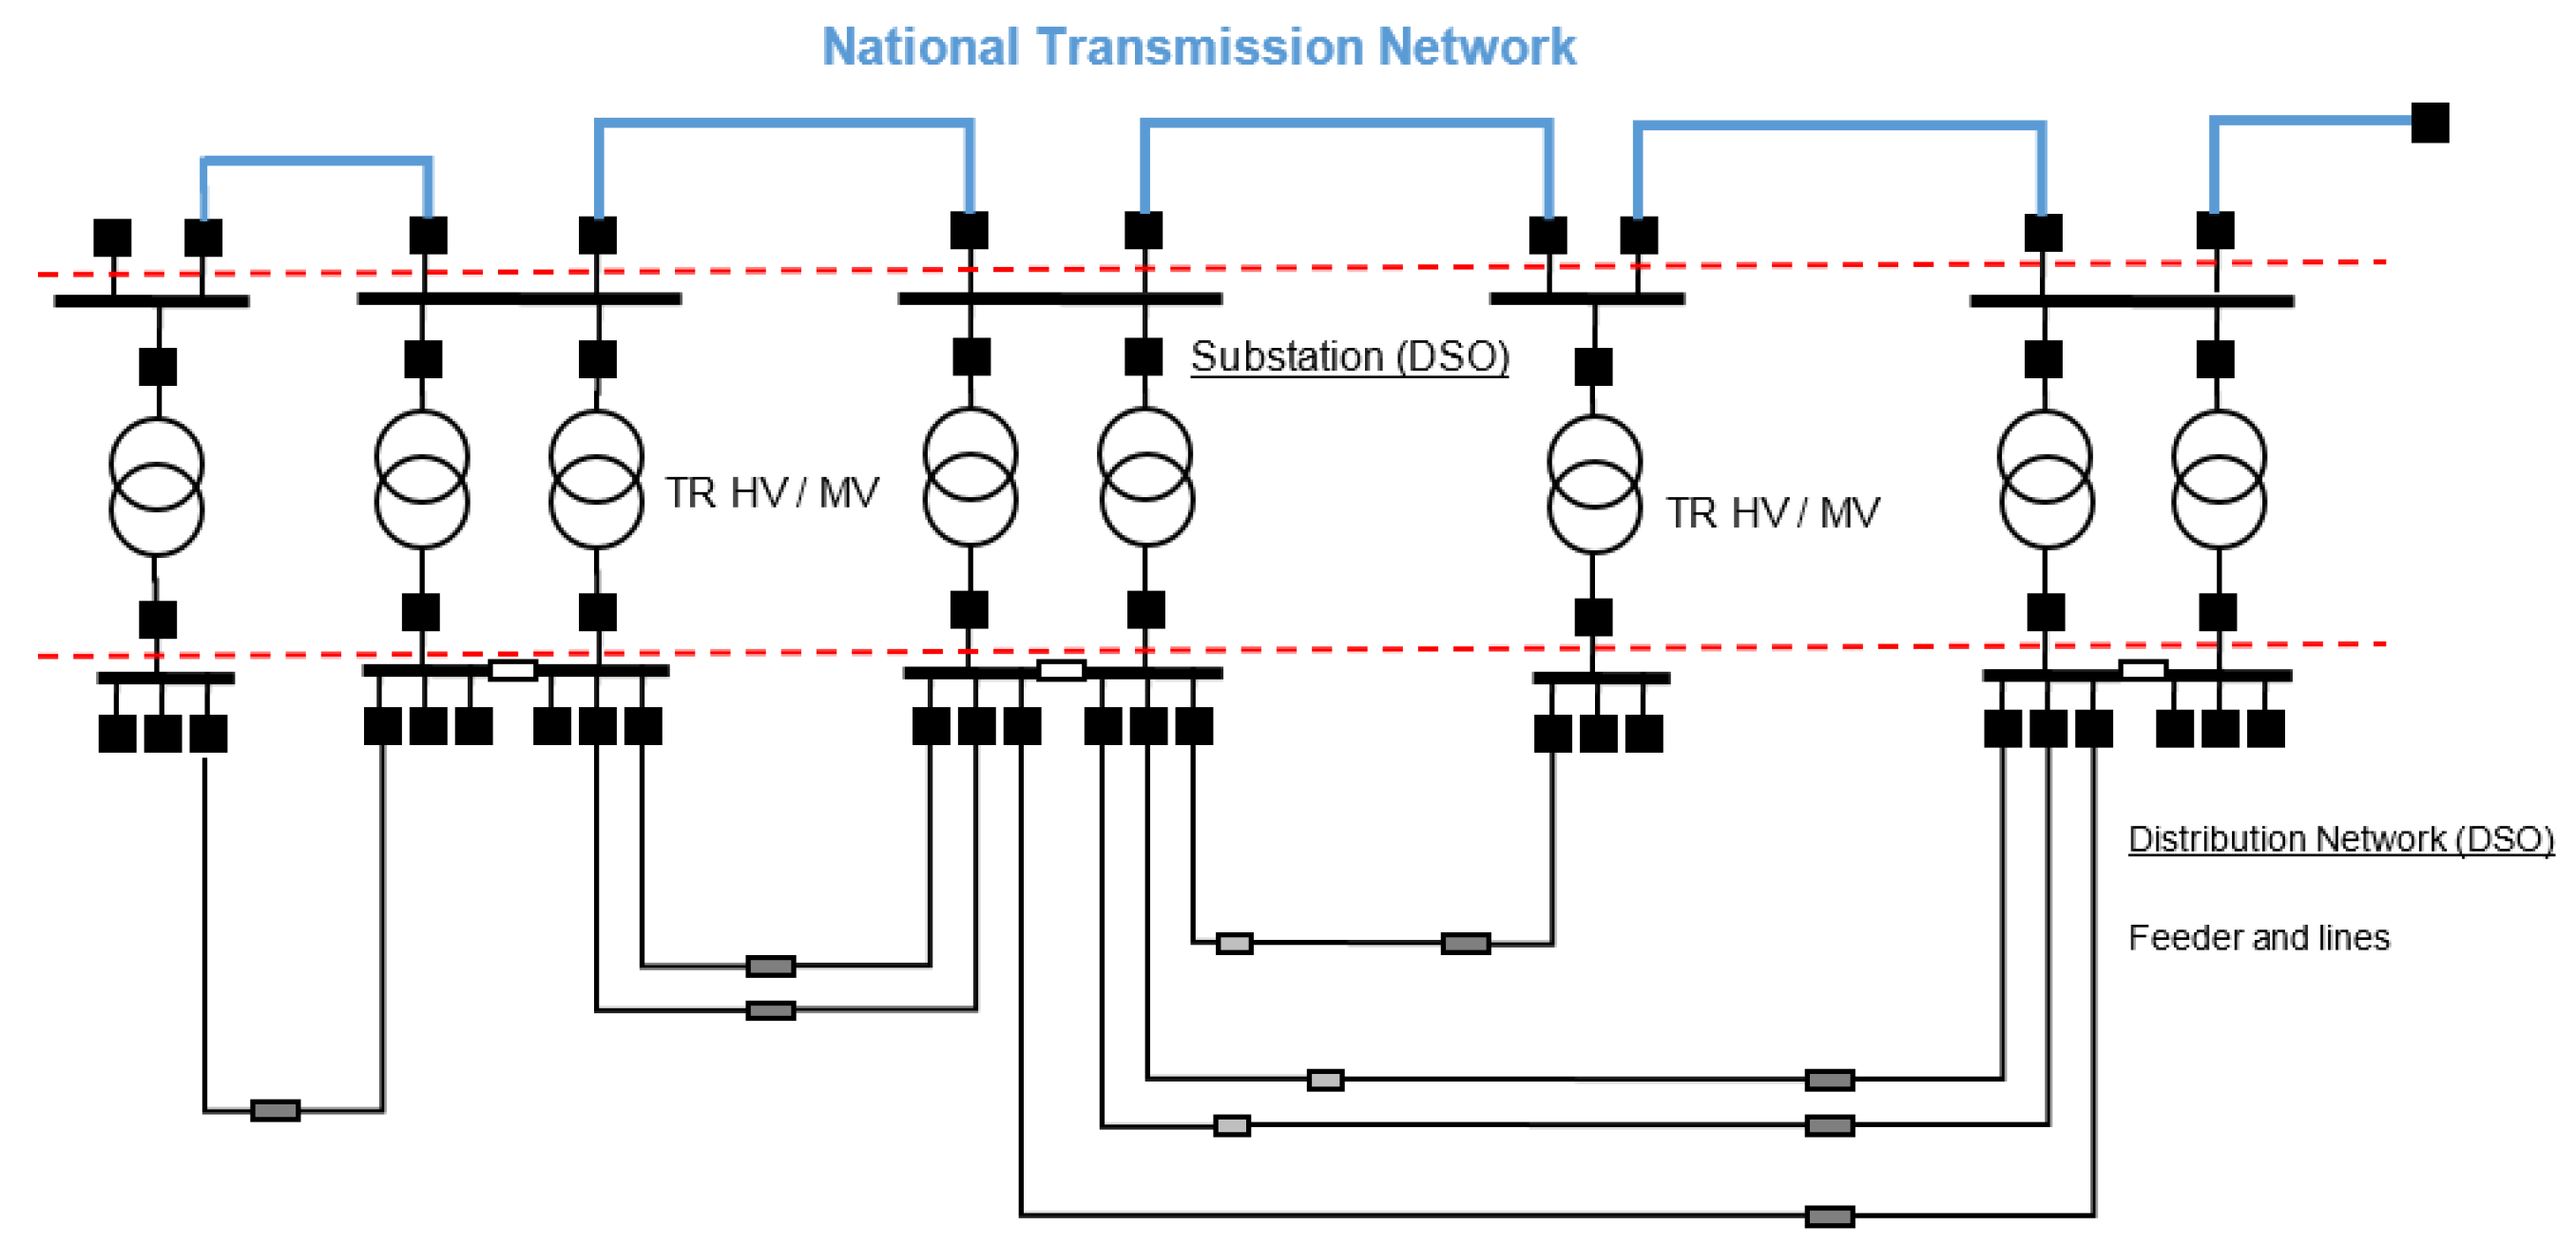
As is well known, the Italian MV distribution system is connected to National Transmission System via HV/MV stations owned by DSOs. The distribution network operates with a radial scheme, as shown in
Figure 1.
During a perturbation or fault, in case of intervention of HV protection systems, it is possible to have a consequent outage of one or more HV/MV stations. The interruptions or blackout due to an event on the transmission system determines a contribution to the Energy Not Supplied (
ENS) index, defined as:
where
is the mean power sampled value of the last 15 min at HV level at the time of interruption (this value is assumed constant for the duration of the event);
is the event ending time;
is the event starting time of HV interruption or blackout.
Considering the Italian Grid Code on the continuity of supply [
31], the share of
ENS, defined in (1), contributing to the continuity of supply index, has to be evaluated as a net value of Energy Not Supplied
given by:
where
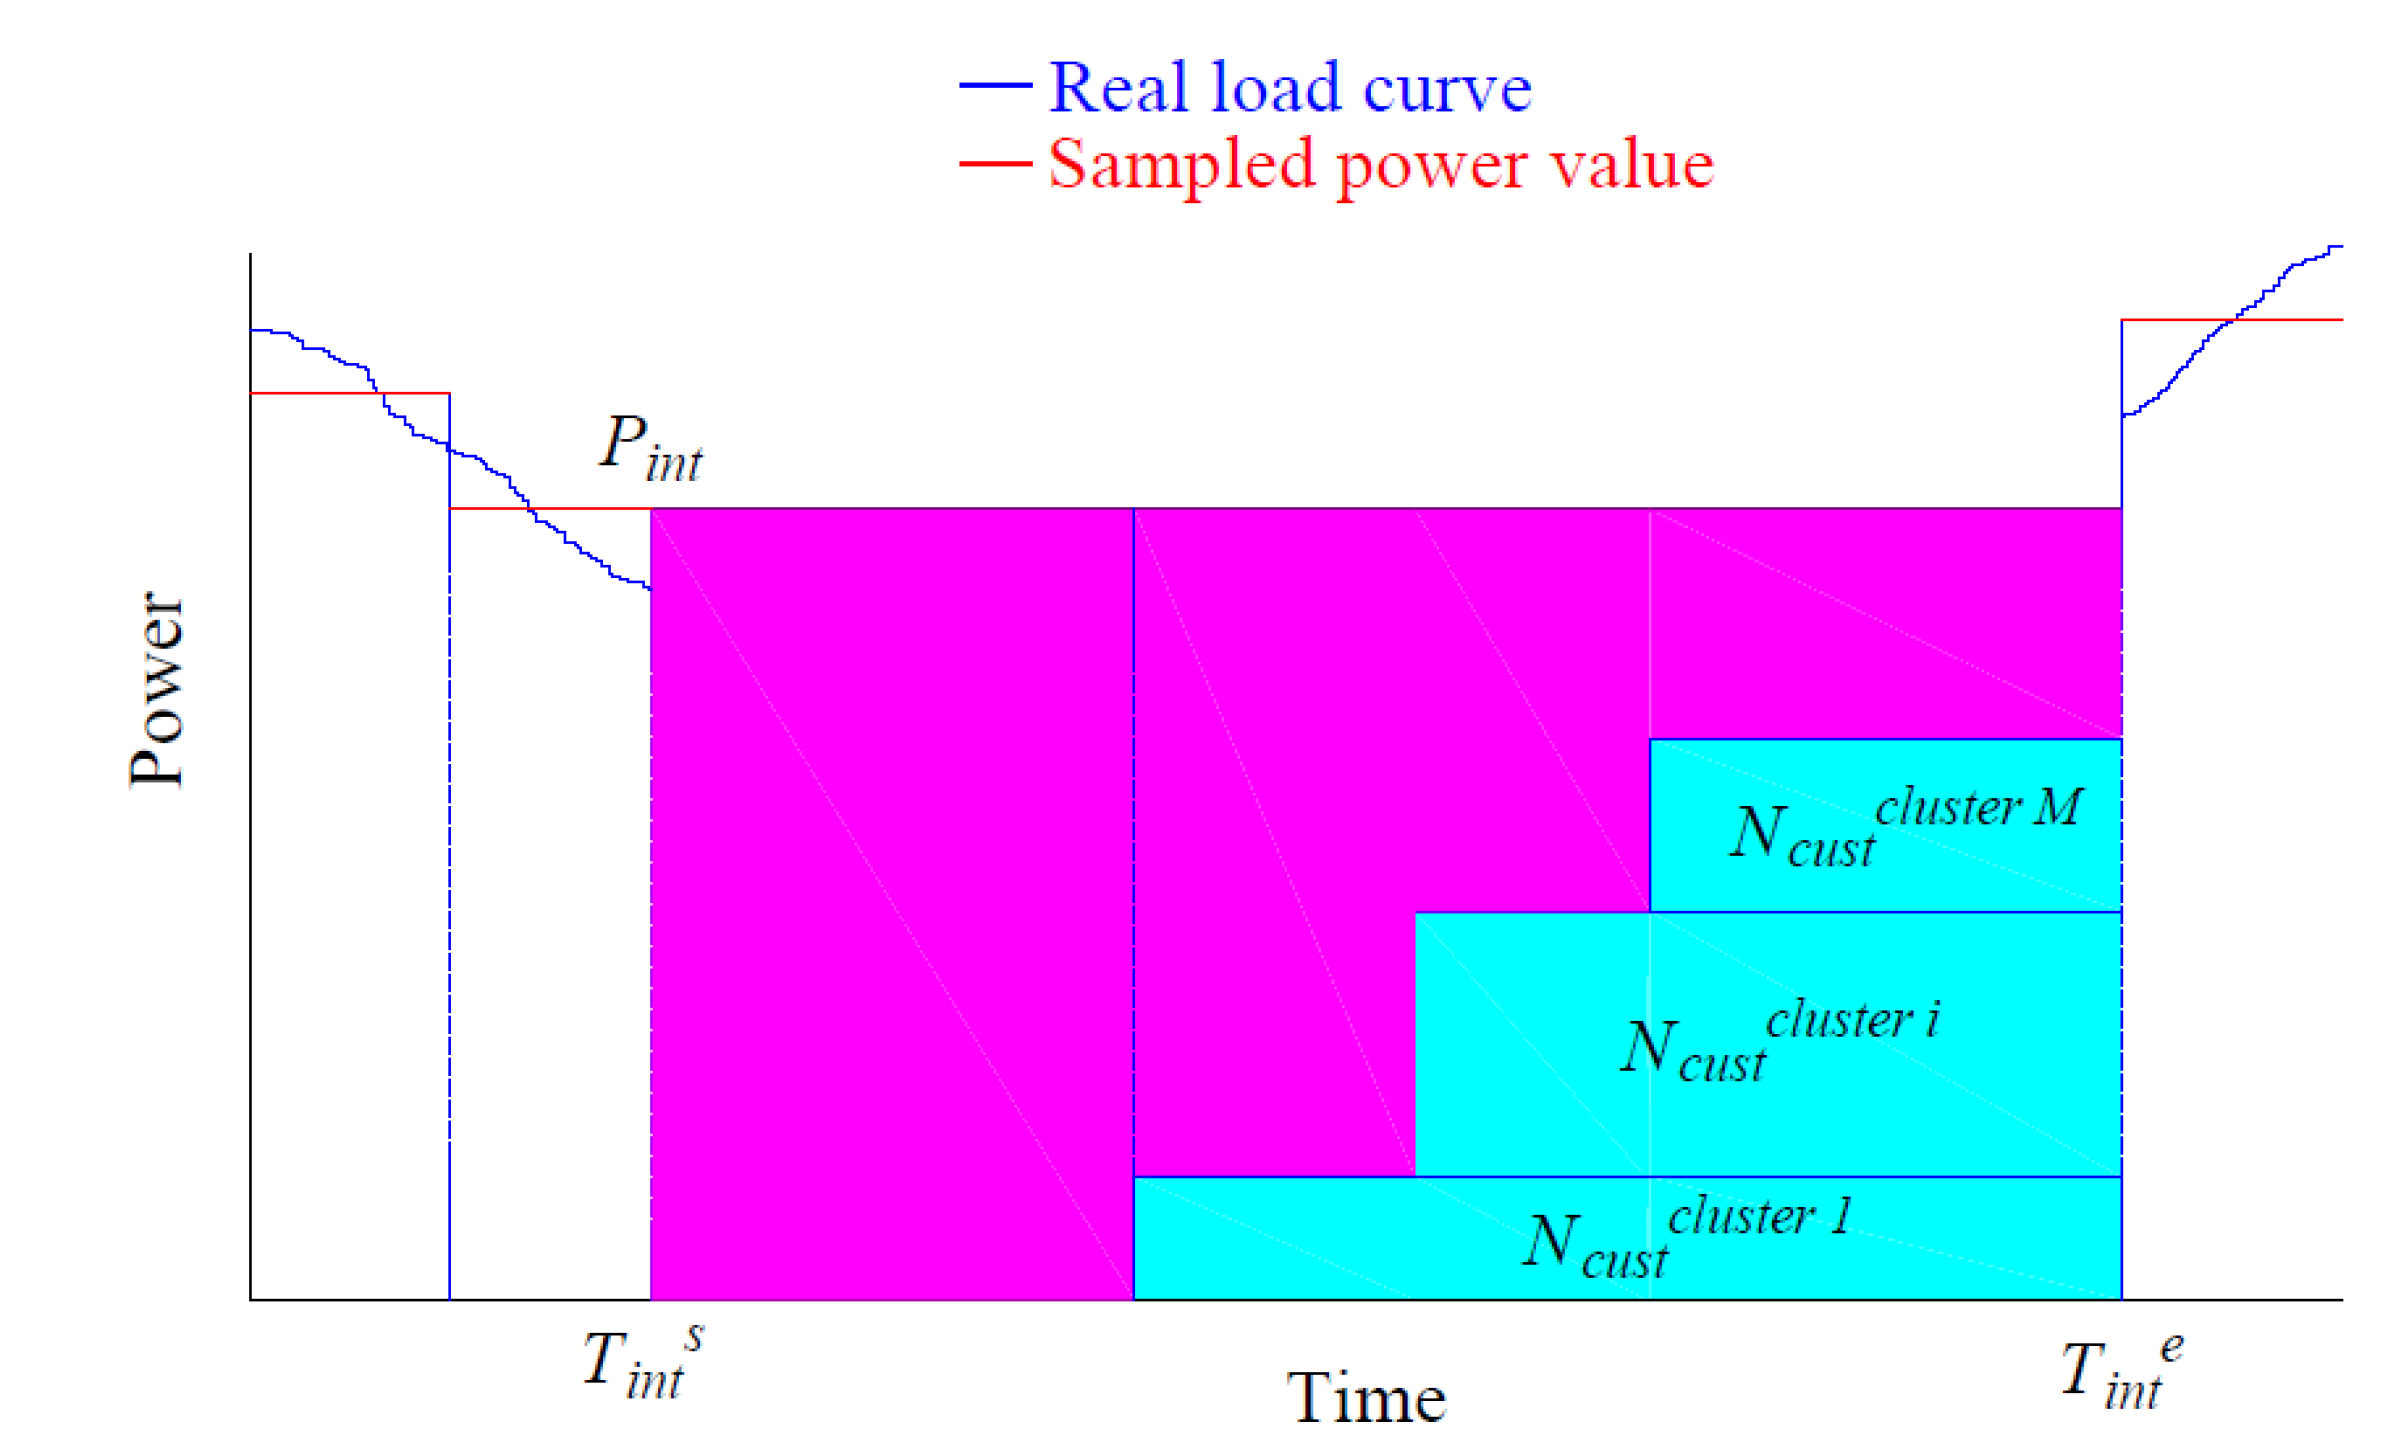
is the amount of energy that can be restored by the distribution system. This is calculated as:
where
is the total number of LV and MV customers resupplied during the restoration activities:
where
is the total number of cluster of customers restored,
is the number of the customers of
i-th cluster of restoration, with a
restoration starting time and
restoration ending time; this is equal, for each cluster of customers, to the interruption ending time
.
is defined in (1). In this way, the term in (3) expresses an equivalent time of interruption. Equations (2)–(4) are graphically illustrated in
Figure 2.
Due to the necessity of reducing the value of
ENS, the same Grid Code in [
31] foresees actions based on an interaction and cooperation between TSO and DSO, e.g.:
The evaluation of the entity of system involved by the event (line, power plants, HV substation, etc.); this action is a responsibility of the TSO
In case of fault, the localization of elements of HV network (line, pole, transformer, etc.); this action is a responsibility of TSO and DSO
The evaluation of the possibility of rearranging the HV network scheme, restoring the voltage for all plants and stations; this action is a responsibility of TSO and DSO
If it is not possible to restore shortly (within some minutes) the voltage at the HV station, the TSO can require the DSO to restart the MV network independently. The main actions executed by the DSO are:
Evaluation of network capacity to provide the restoring service, i.e., reserve of power on the same grid, considering the margin of current referred to the thermal limit of the feeders; flexibility in terms of remote control system of the same grid, considering the possibility to arrange a new scheme of distribution network
Application of restoration plans; this phase is carried out via the remote-control system
Monitoring and supervision of network, in case of evolution into critical states (overloads, faults, etc.)
This operation condition increases the risk for the DSO to have an interruption of service, with relevant contribution to the value of System Average Interruption Duration Index (SAIDI) and System Average Interruption Frequency Index (SAIFI), the regulated indexes for the assessment of continuity of the service for the distribution operator [
32,
33,
34].
As well known, the scheme of network operation, during supply restoration, is much different from the normal condition. The main factors to consider are:
The probability that a fault arises, due to the increasing of number of kilometers of grid subtended to the same breaker
The level of damage in case of interruption, due to the increasing of number of customers subtended to the same breaker
It is obvious that both mentioned parameters are higher with respect to the normal operating condition of the network, increasing the risk of a service interruption.
In this framework, a BESS in MV can help the restoration procedure, acting as a slack bus between electricity supply and demand and thus increasing the flexibility of the grid: it can drive the controlled power grid, sustaining the consumption and allowing, whenever possible, the synchronization of DG. Moreover, BESSs and DGs, possibly operate in coordination with each other, contribute to risk mitigation. As a matter of fact, in the traditional service restoration a fault occurred on portion of the network determines an outage on both the restored and restoring grids; on the other hand, adopting a BESS on the MV bus-bar, both grids are decoupled and independent of each other in terms of fault selection and service restoration.
On these grounds, an actual suitable case study of e-distribuzione’s MV active grid equipped with a BESS has been selected, in order to quantitatively verify how the involvement of a BESS in the restoration procedure can improve the quality of service. The case study here reported is just a first example of application, in order to have numerical evidence of the proposal in a real specific case, but it can be generalized in the future. In addition, it is worth to stress that the analyses deal with the steady state operation of the grid, disregarding any issue related to transients, frequency and voltage control.
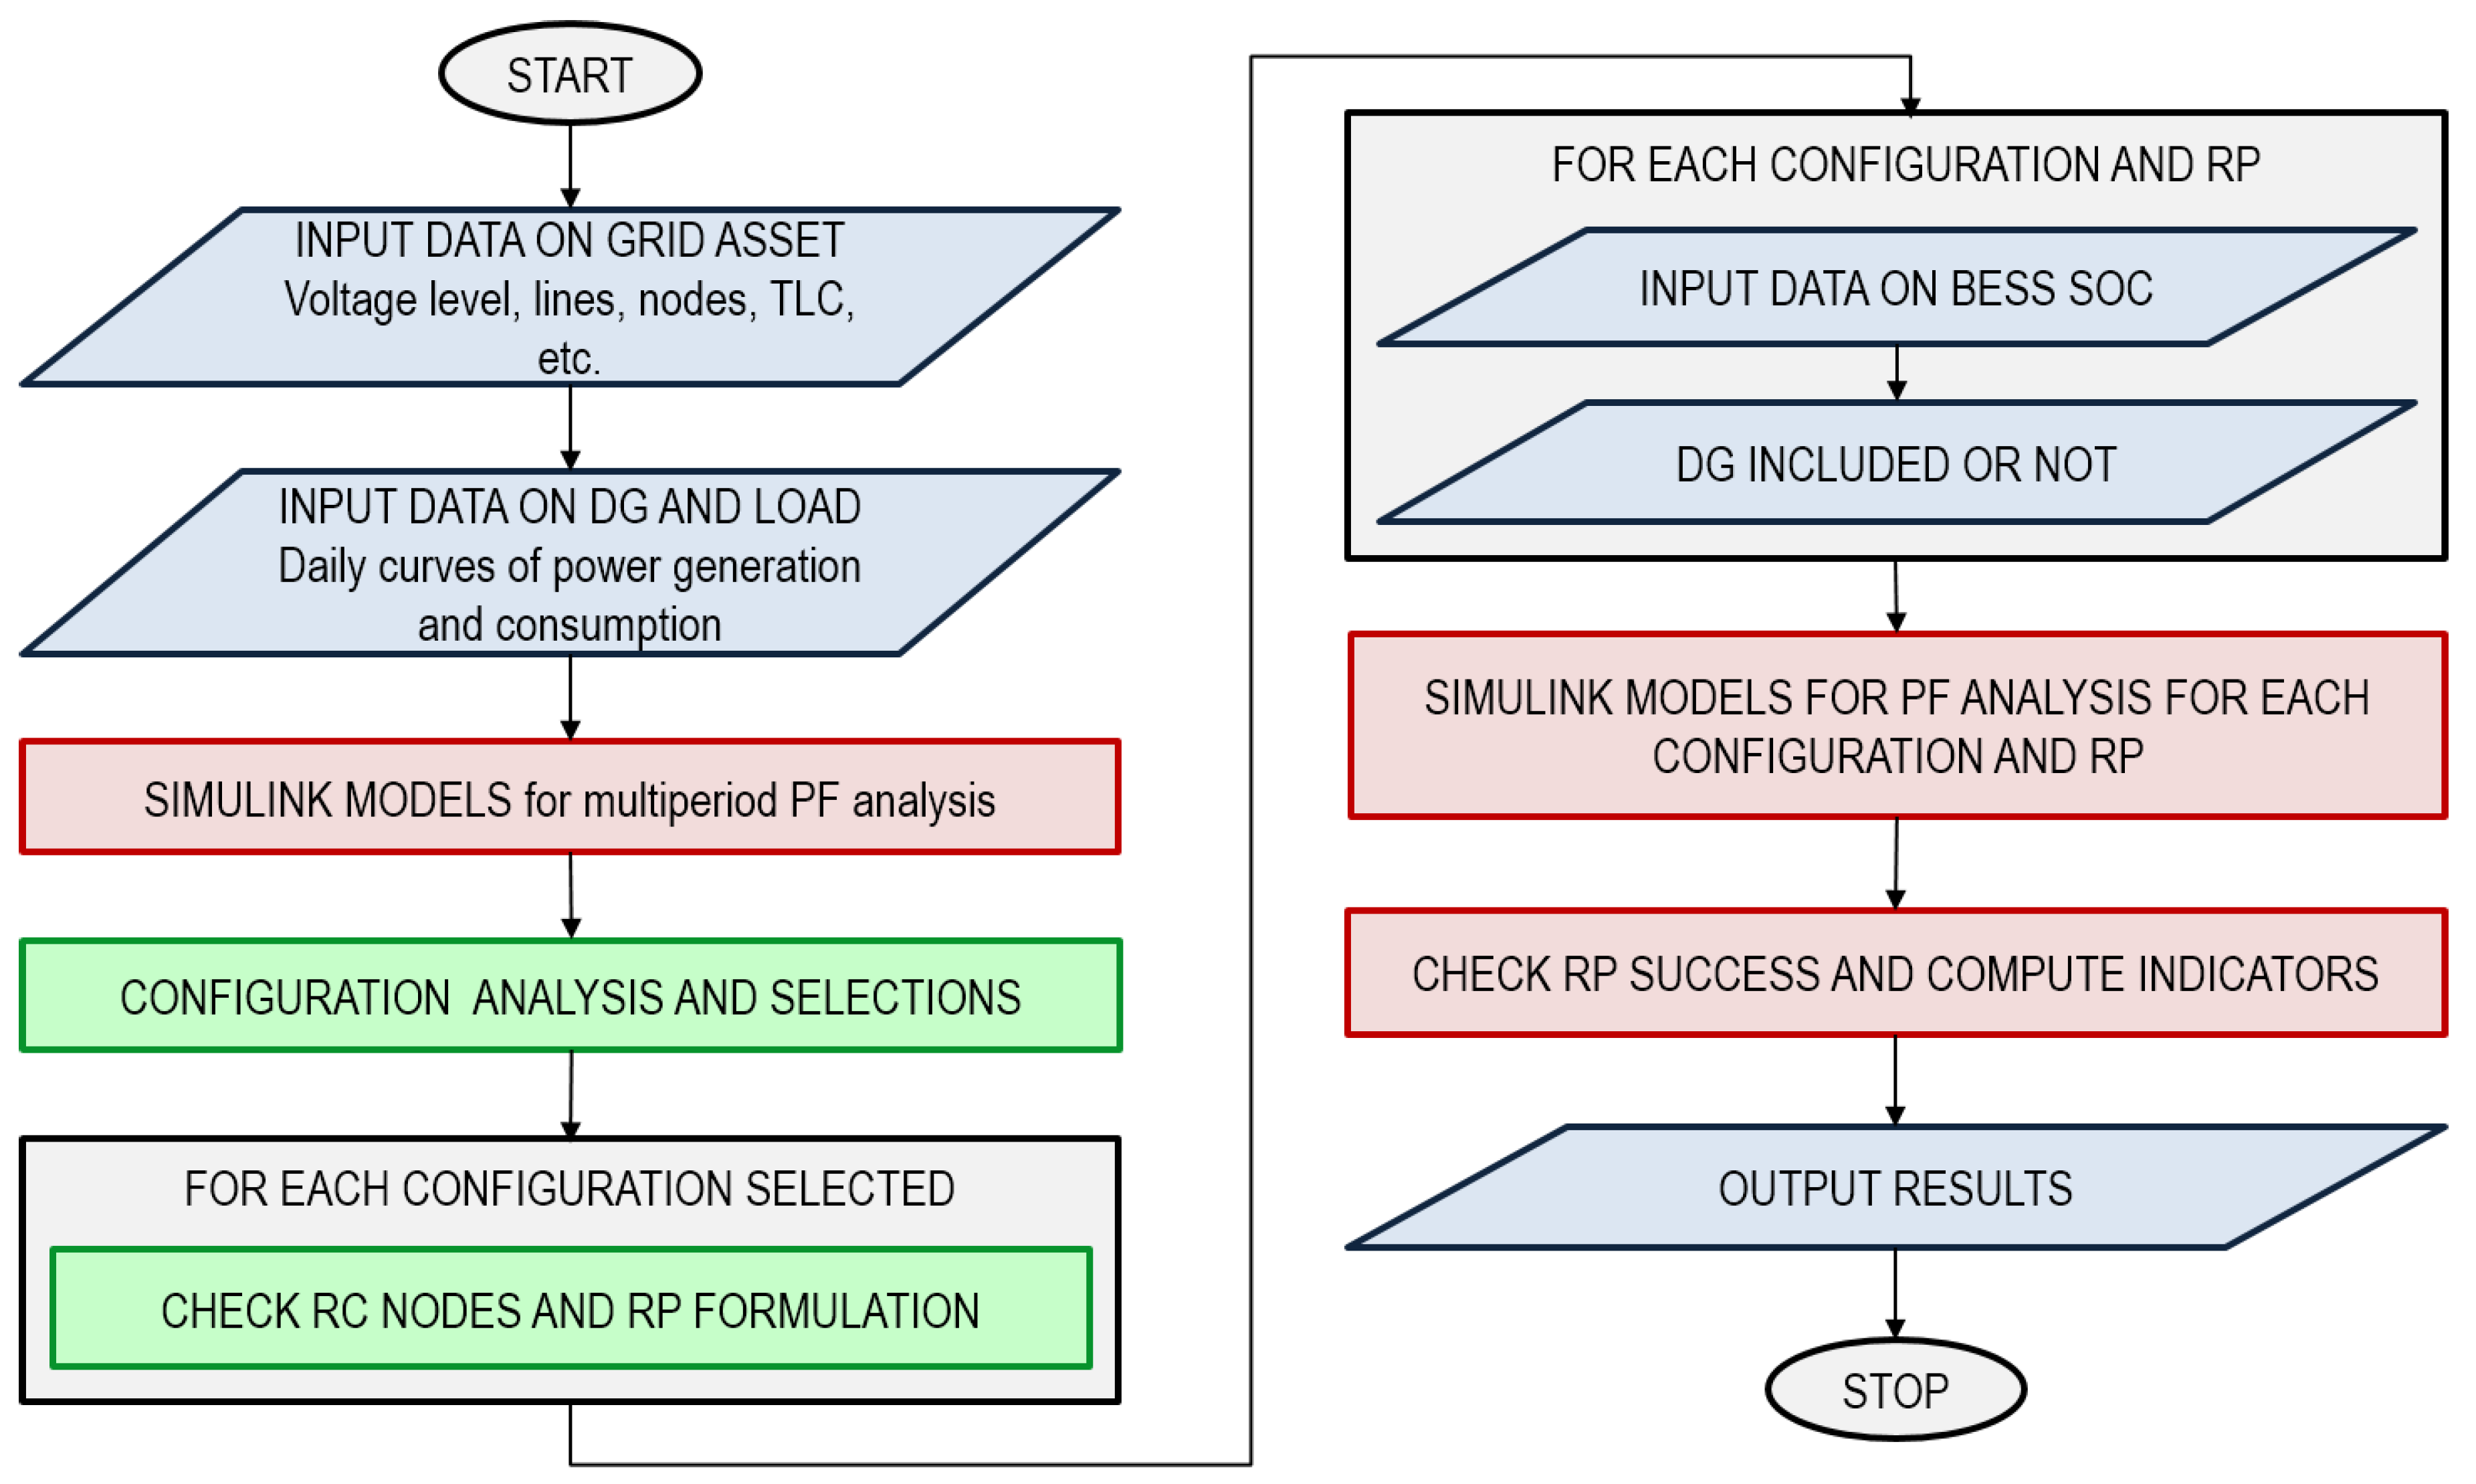
3. Simulation Process
The simulation of the Restoration Plans (RPs) was carried out via a MATLAB
®/Simulink
® program, developed for the purpose, consisting in a model of the network in steady-state and in a routine for the execution of multi-period PFA. In addition, a MATPOWER program was used for comparison for the validation of PFA [
35]. The simulations were carried out for the purpose of verifying if the RPs network proposed are able to ensure a secure operation of the distribution system. The validation in steady state has been performed, verifying the power balance and compliance with voltage and current constraints in all system components (including BESS). Issues related to the transients and to frequency and voltage control have been disregarded at this stage.
The developed MATLAB®/Simulink® program is linked to a spreadsheet (e.g. MS Excel®) with network data and operates as follows:
Imports network data from spreadsheet in MATLAB®
Runs a Power Flow Analysis (PFA) in the Simulink® network model for each time-step (15 min)
Outputs the results to MATLAB® and exports them to spreadsheet
For each of three RPs, the values and issues assessed in the procedure are:
The time of blackout (t′)
The active power demand in the HV/MV station at the time of the blackout (P′TOT)
The number of red LV and MV users (NLVcust(i), NMVcust(i)) with respective active power (PLVcust(i), PMVcust (i)) at stage i
The state of charge of the BESS in different stages (SOCBESS(i))
The percentage of re-fed network, defined as the ratio of the number of re-fed customers to the total number of customers to be re-fed:
The sequence, type and size of DG power plants reconnected at different stages
The power generated by the MV DG power plants at the stage i of reconnection, that can be injected in the distribution grid
It is obvious that the parameters listed, especially those defined in (5) and (6), are strongly related to the indicators of quality of service reported in
Section 2 and so they can be assumed as indicators of the effectiveness of the proposed RP. A schematic of the simulation process is reported in
Figure 3.
The charge and discharge process of the BESS has been modeled, in steady state, by considering the amount of energy charged or discharged in every stage, plus the energy losses in each stage, via the rated charging/discharging efficiency.
4. Case Study
4.1. MV Grid
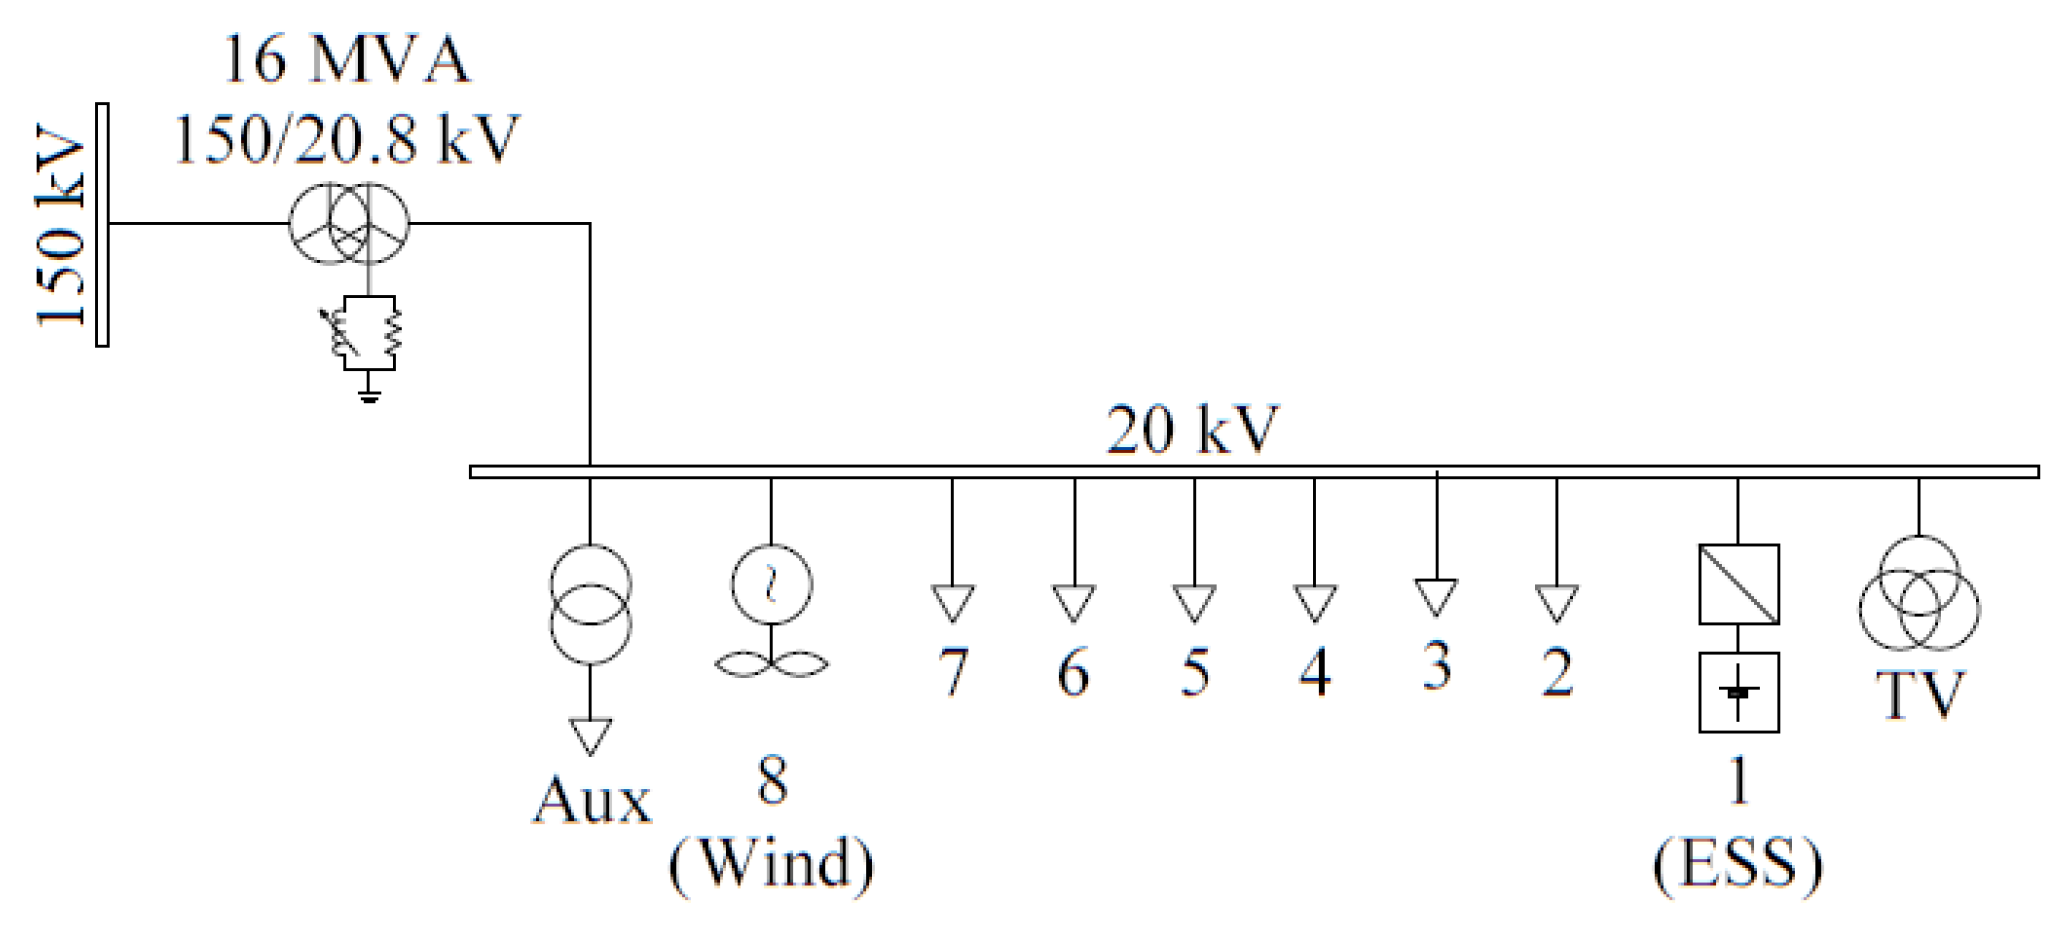
The reference case study is an active MV grid of
e-distribuzione, connected to the HV system and to the BESS, with the layout shown in
Figure 4.
The HV/MV station includes one 16 MVA YYn transformer, with the neutral conductor on the MV side grounded via mobile Petersen coil. The MV bus-bar feeds 8 MV lines operated radially, in accordance with Italian distribution grid practices. Details on the composition of the MV network are reported in
Table 1 and
Table 2. The 4 MV DG power plants are characterized in
Table 3.
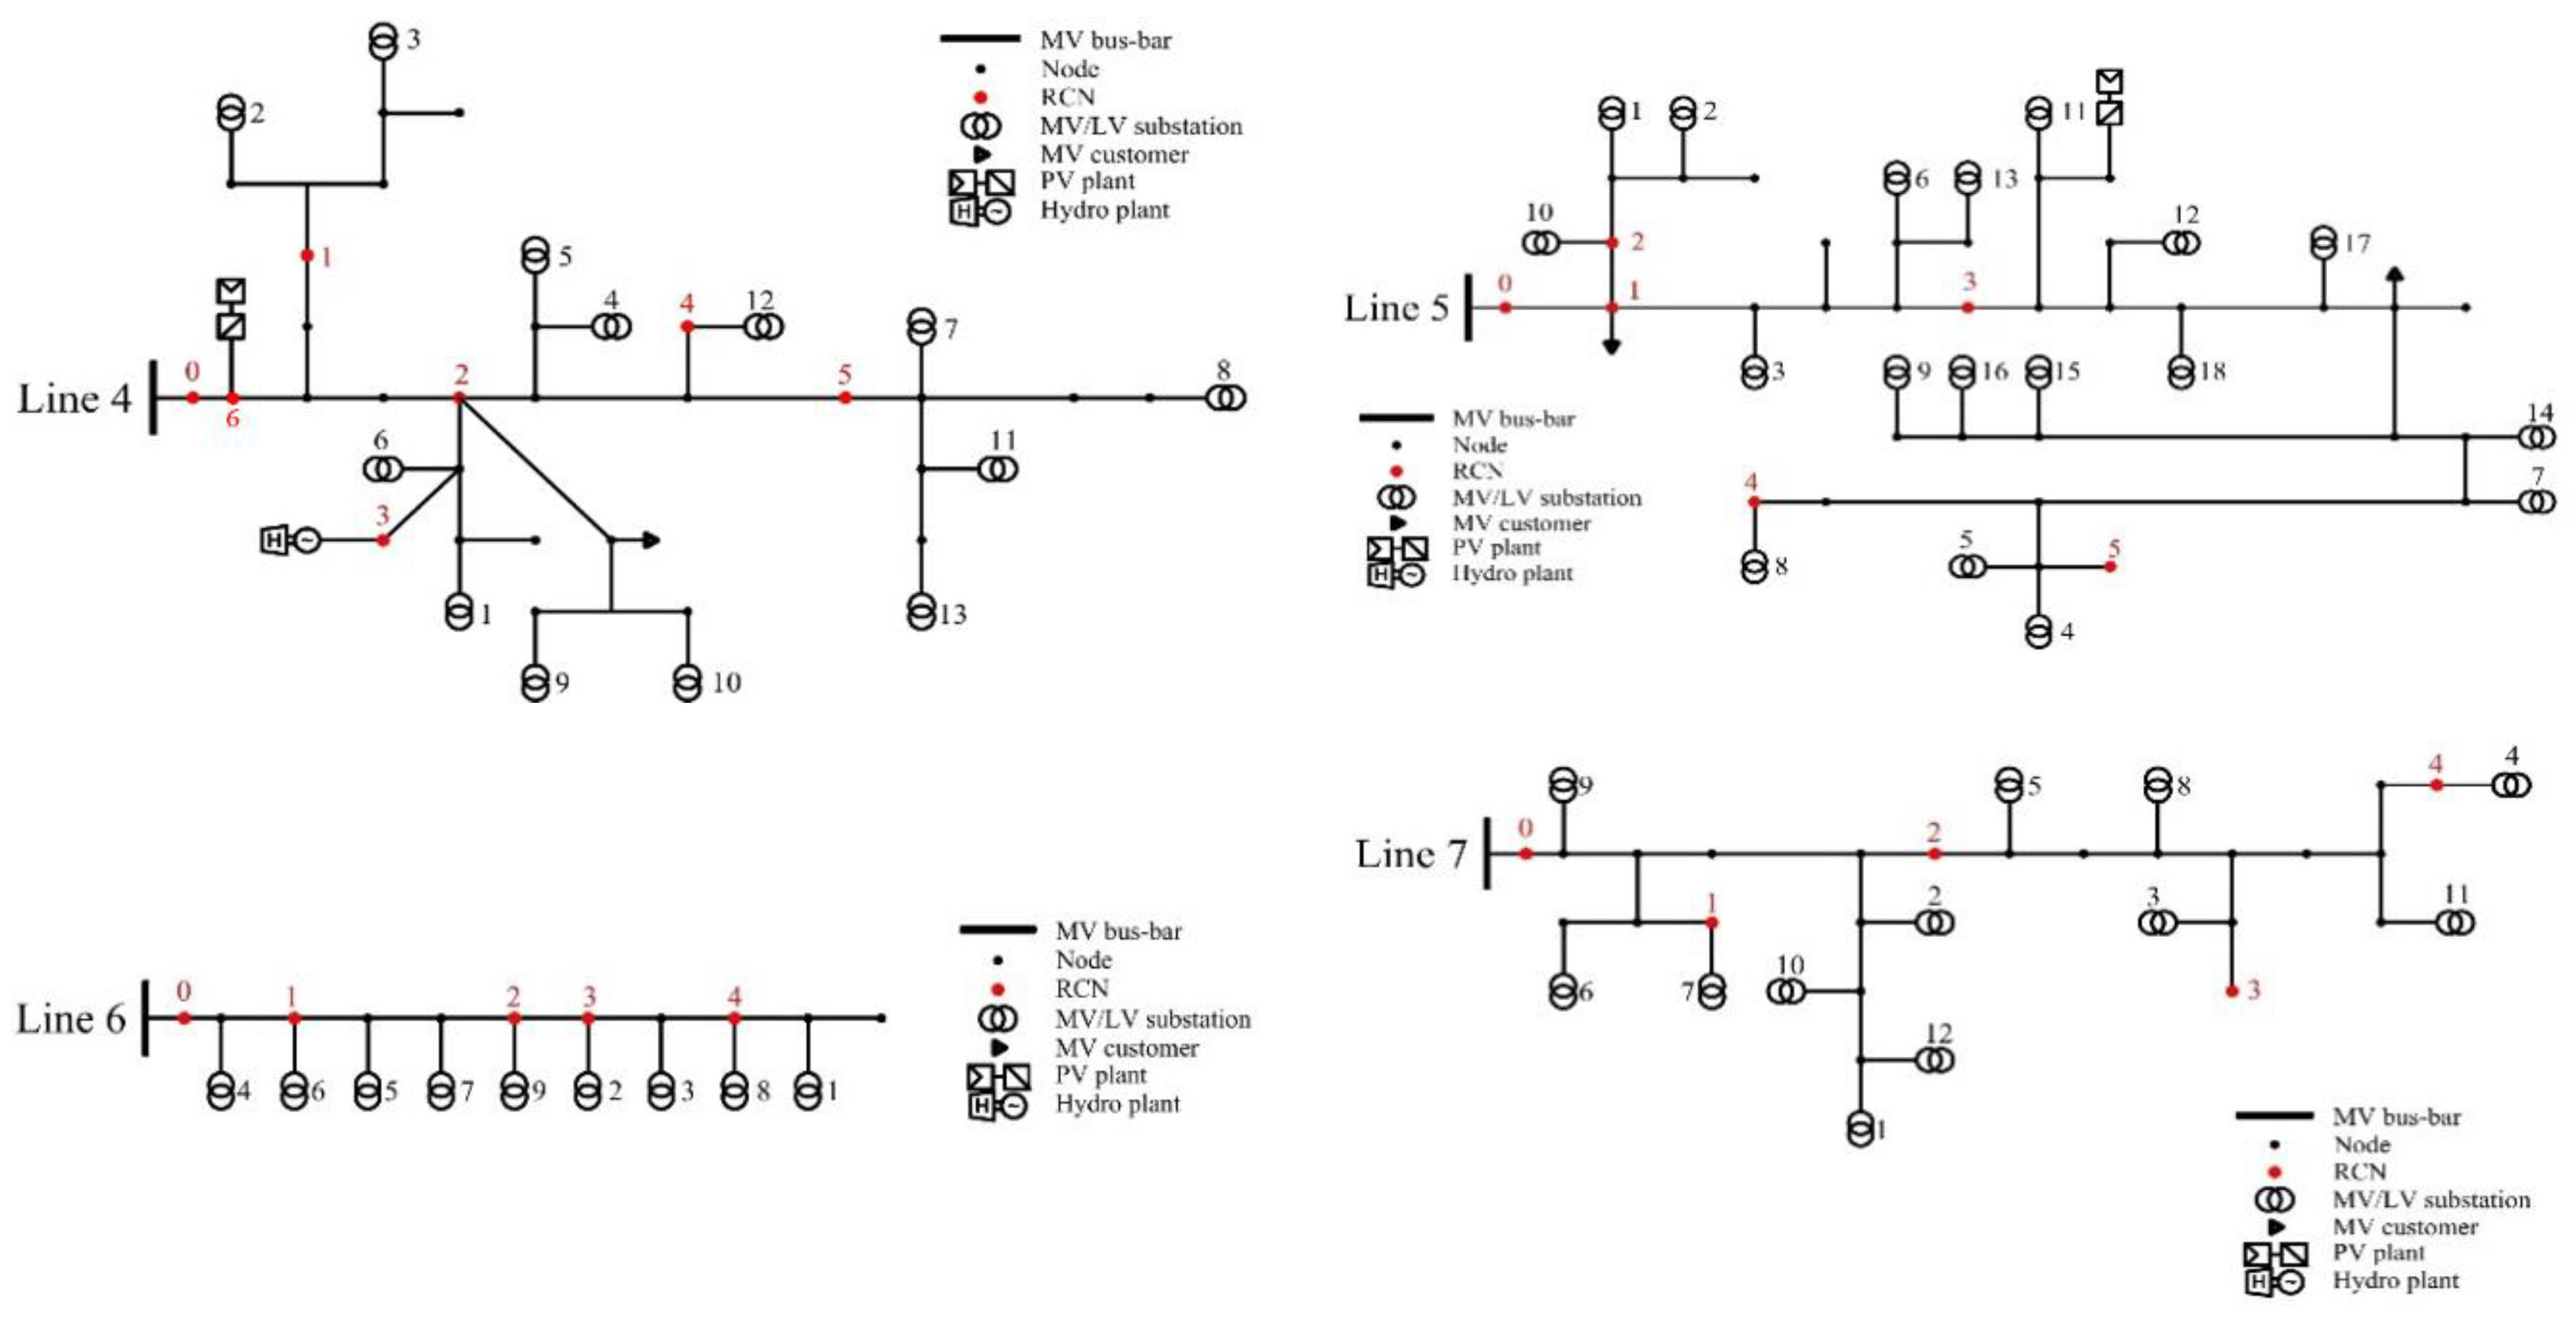
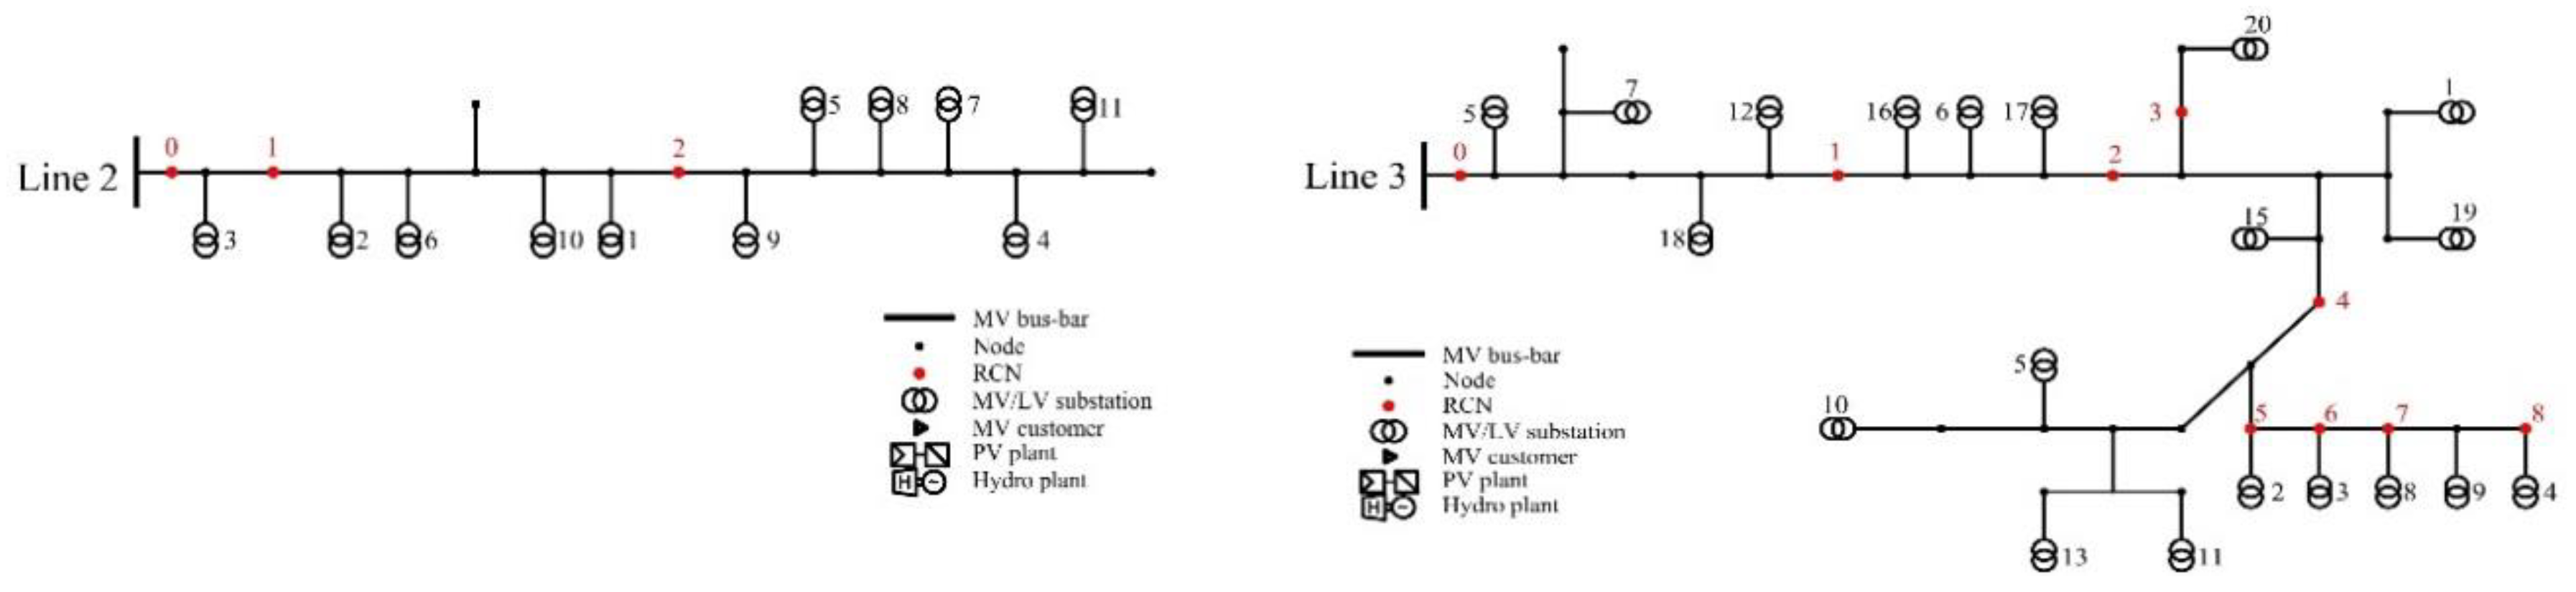
Although the lines are radially operated, there are common nodes between the different lines. This is useful for modifying network configuration in critical operating conditions, e.g., restoration after a blackout. Concerning network automation, the remote-control system allows the supervision of the MV network and the 28 nodes Remote Control Nodes (RCNs), in addition to each line circuit breaker on the MV bus-bar.
Figure 5 shows the RCN in each MV line of the case study; 0 denotes the RCN corresponding to the line circuit breakers at the head of line on MV bus-bar side.
The definition of the RP is based on the location of RCNs for each line, the number of MV/LV stations and MV customers, their average active and reactive power demand.
4.2. BESS and Control System
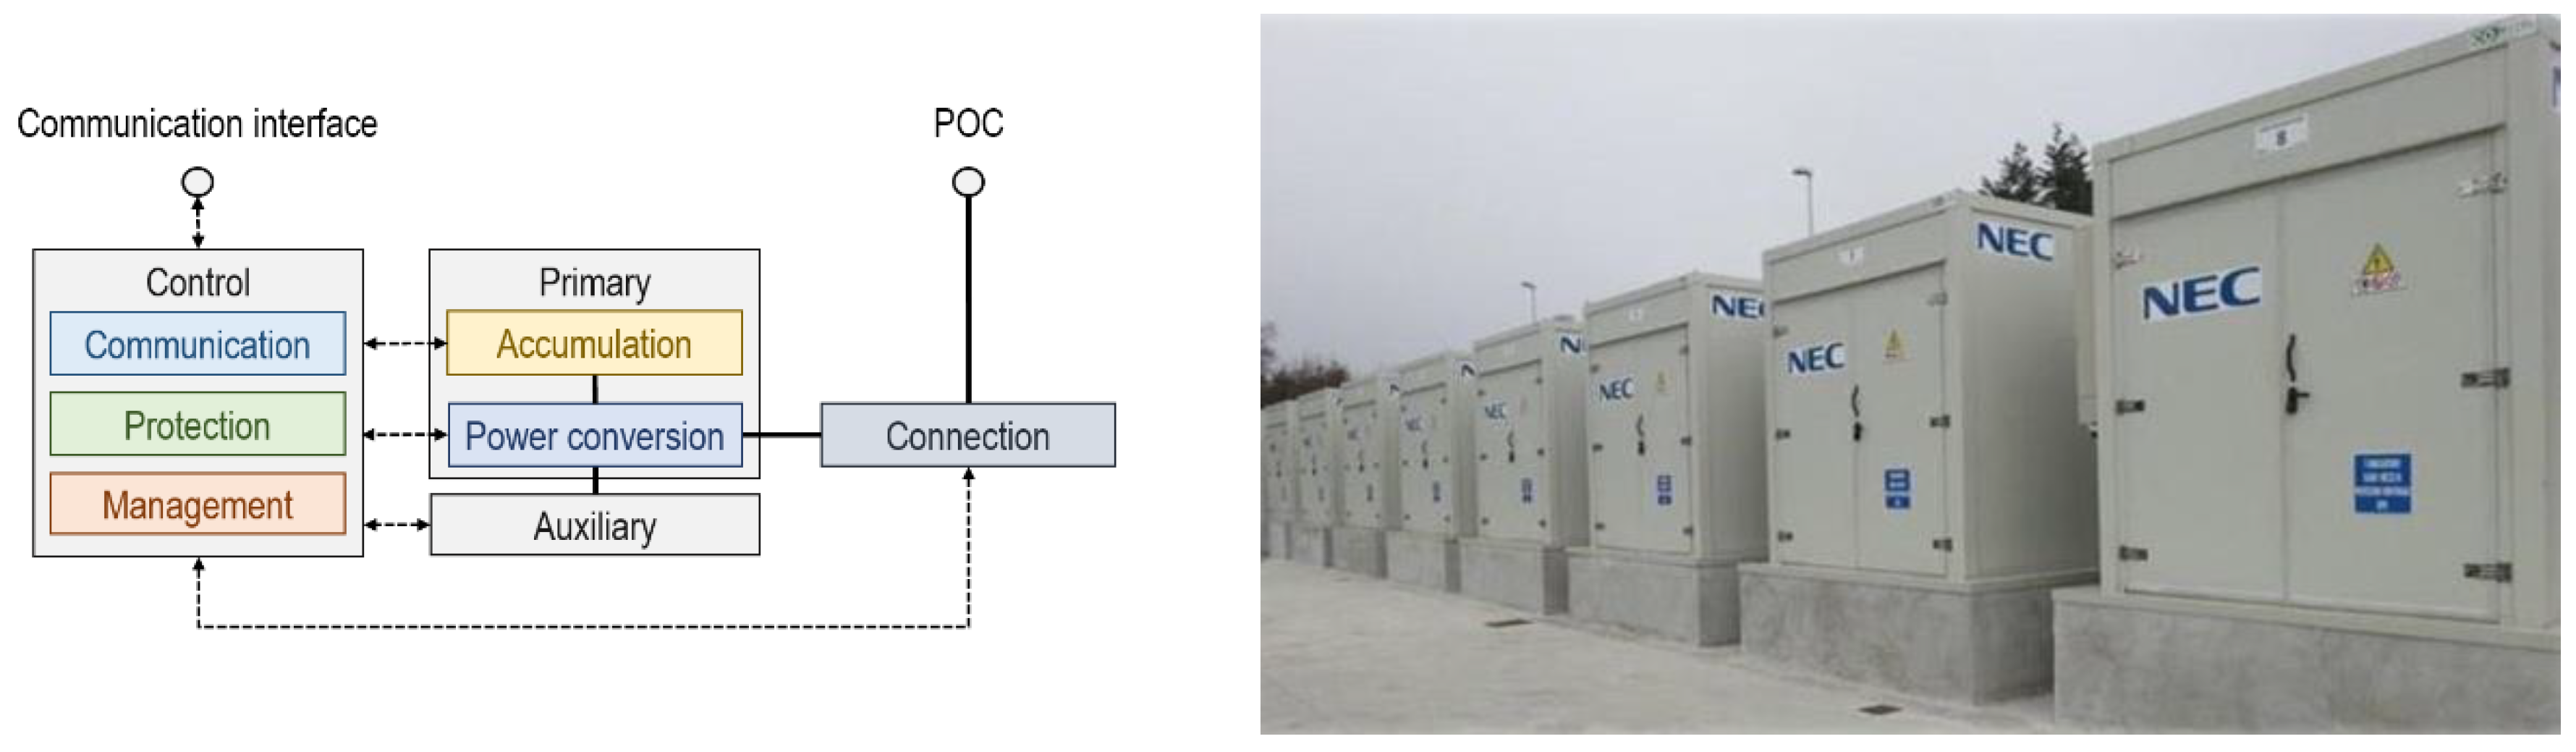
A Lithium-Ion BESS is installed in the HV/MV station and connected to the MV bus-bar via a dedicated line (Line 1). A schematic of the BESS control system and an image of the installation are presented in
Figure 6. The specifications of the ESS are:
BESS rated capacity: 2 MWh
BESS rated power: 2 MVA
Battery module rated voltage: 15.2 V
Battery module rated capacity: 0.625 kWh
Total efficiency: 80%
Installation: Containers (10 containers, 8 power converter systems, 3264 batteries), 400 m²
Providers: System integrator and batteries: NEC
Technology: Li-Ion (Lithium metal oxide)
Life: 4,000 cycles, 10 years
Maximum auxiliary consumption: 787.75 kWh/day
To clarify how the proposed procedure can be then implemented in the physical system, a general description of the control architecture available in the e-distribuzione MV grid (including the BESS in HV/MV stations), is detailed.
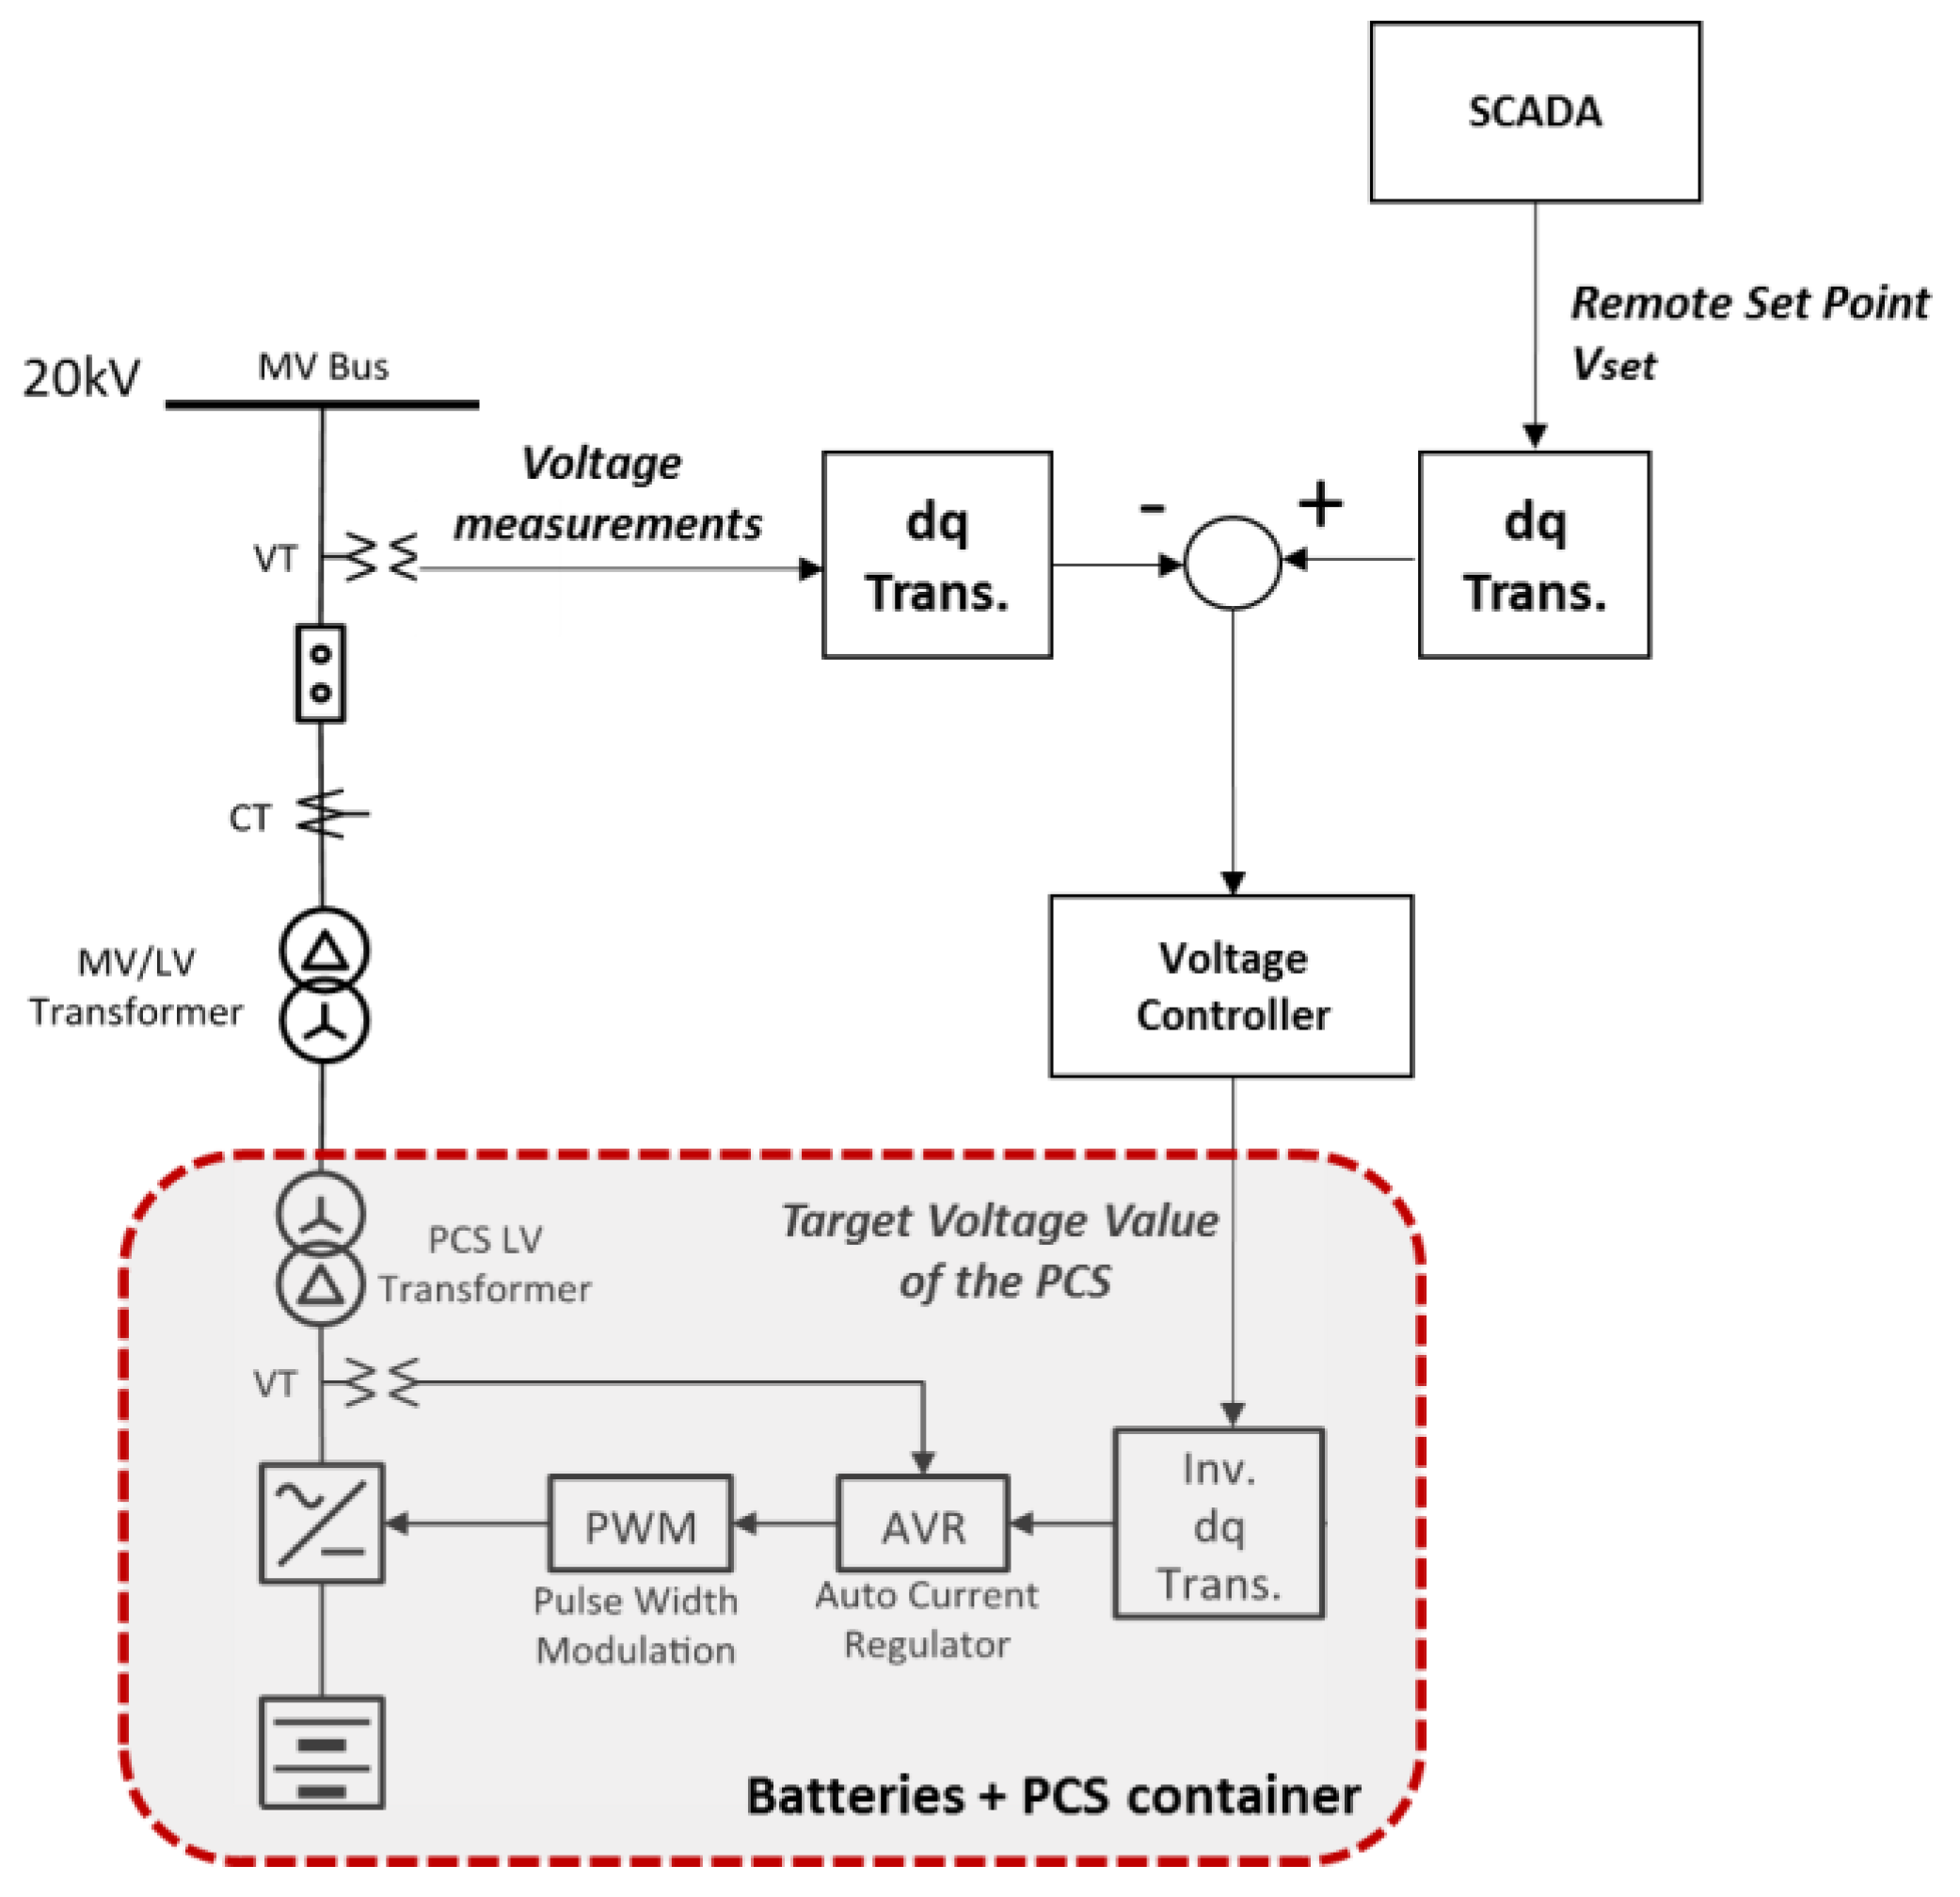
e-distribuzione MV grid management and control is in charge of 28 control centers; each one is responsible for several activities, e.g.,: quality of service certification, management of crews in the field, network and equipment predictive maintenance, and cooperation with the TSO in order to prevent blackouts and emergencies. The system is equipped with a Supervisory Control and Data Acquisition (SCADA), located in the control centers, which communicates with Remote Terminal Units (RTUs), located in the HV/MV and MV/LV stations. In case of fault on the HV grid, when the TSO requires the DSO to restore service on the MV network independently, the SCADA system is able to identify and isolate the MV network portion to be re-supplied. Consequently, the SCADA can also send the BESS a black-start remote command, making sure that all the security checks have been performed correctly. The communication architecture is based on the Client/Server model. The BESS local controller assumes the server role while, on the DSO side, there is an RTU, that assumes the client role and is remotely connected with the control center that hosts the DSO SCADA. The information exchanged between client and server is compliant with [
37]. As shown in
Figure 7, in order to execute a black-start operation and supply power to a target load, the BESS local controller must receive voltage commands (
Vset) for each stage from the SCADA to control the point of delivery voltages. Upon receiving
Vset commands from the SCADA, the BESS determines the target point of delivery voltage by calculating the difference between the
Vset values from the SCADA and the voltage values measured at point of delivery under the conditions that frequency is a constant value of 50 Hz and zero-sequence voltage is always set to zero. In order to avoid inrush current flow into the load, the BESS provides a soft start function, which increases voltage gradually according to a soft start period (e.g., from 1 s to 20 s). In this work, the system is studied in stationary state; therefore, it is assumed that the voltage is constant, imposed by the BESS, operating as the voltage regulator.
Hence, it is clear that the proposed procedure can be implemented in the physical system, both fully automated and manually guided by the system operator.
4.3. Simulation Scenarios and Hypotheses
For a given grid layout and control system, a RP of the MV grid is a function of the initial operation scenario, in terms of:
The state of the network in the time of blackout, i.e., amount of active power demanded by the loads and amount of power supplied by DG, which define the aggregate equivalent load at the MV bus-bar
The State of Charge (SOC) of the BESS at the time of the blackout
Thus, the first step to build a RP is to assume the blackout time and the BESS SOC.
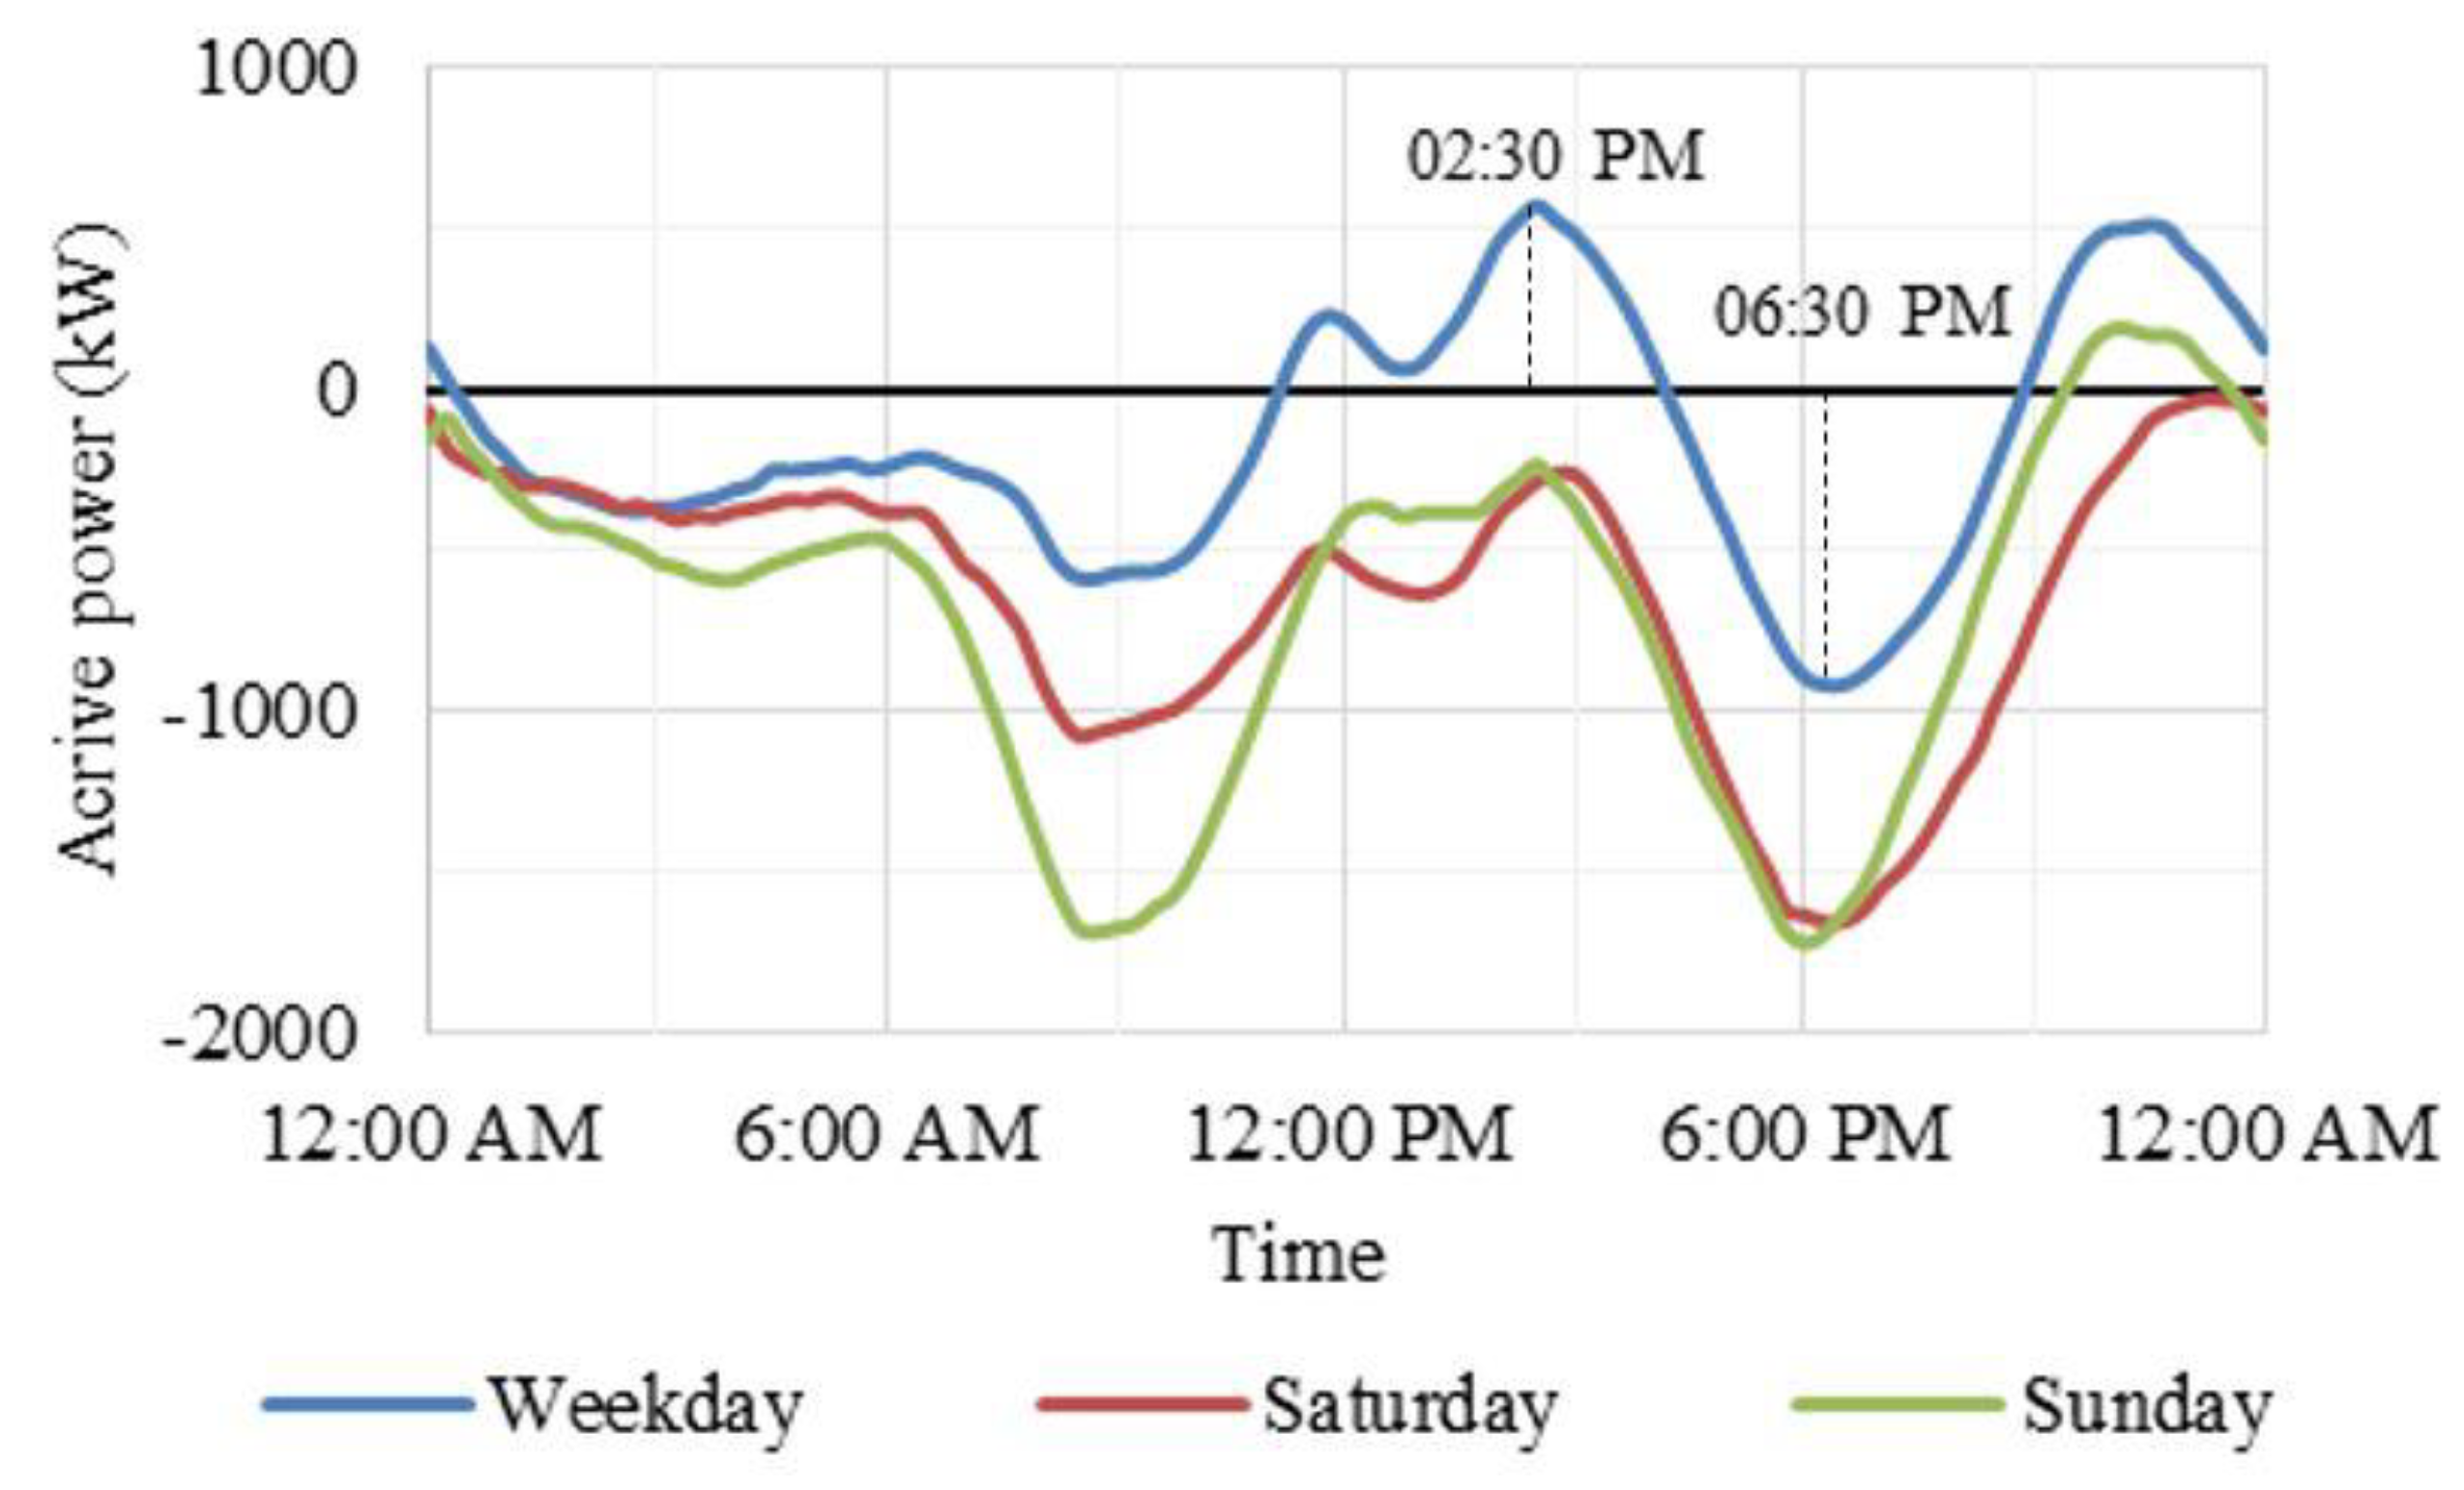
For the case study, operation data for three reference days (weekday, Saturday and Sunday) in January were available. For each of them, the aggregate equivalent load at the MV bus-bar was calculated via a PFA; the results are reported in
Figure 8, where the sign of active power is positive when power flows from the HV side to the MV side (passive distribution network).
Comparing the profile of the three days, it is evident that the distribution grid is passive only in some hours of the weekday, due to the combination of a greater load and a minor DG production. During the two weekend days, the grid behaves mostly as an equivalent generator in respect of the HV system.
On these grounds, the choice has been to build up RP assuming the weekday as the reference case, and check its feasibility in the other two days, when the net load at the MV bus-bar is mostly negative, due to a lower passive load and a higher generation.
With reference to the weekday, two times of blackout have been considered: maximum positive net load time (2:30 p.m.) and the maximum negative net load time (6:30 p.m.), as shown in
Figure 7.
Another hypothesis deals with the SOC of BESS at the time of blackout. Two level of SOC have been considered: 100% and 50%.
Based on the location of RCNs, different RPs were developed, divided in 10 stages. For each stage:
The list of opening and closing operations was set with respect to the various lines
The number of LV and MV customers and DG power plants to be reconnected were defined, assuming a time interval of 30 s and 300 s, respectively
The RPs were firstly simulated, assuming the absence of MV DG, in order to verify restoration capabilities of the system using only the internal DSO sources, i.e., without local DG. The same RPs were then checked, involving the MV DG plants, in reference to a smart management of the grid. The rationale is then to shift the connection of distributed generation as much as possible, to take advantage of the storage system, eventually considering no distributed generation contribution (only energy storage contribution) in the restoration process.
The results obtained for the three RPs, built up in reference of the weekday, for the two scenarios of positive maximum and negative maximum net load, without and with DG, and in reference of different initial SOC of BESS, are reported.
Table 4 summarizes the list of RCN operation for each stage in each line for the RP1. The table is based on RP1. RPs differ according to the stage of reconnection of MV DG, i.e., RCNs 3 and 6 of line 4 are closed during Stage 3, 4 or 5, in RP1, RP2 or RP3, respectively.
5. Results
In reference to the RPs, eight scenarios have been simulated and summarized in
Table 5.
In SC1, SC2, SC5 and SC6, the three RP are equal, because the DSO is supposed to use only the BESS as source of power for the restoration; the MV DG is not included in the RPs.
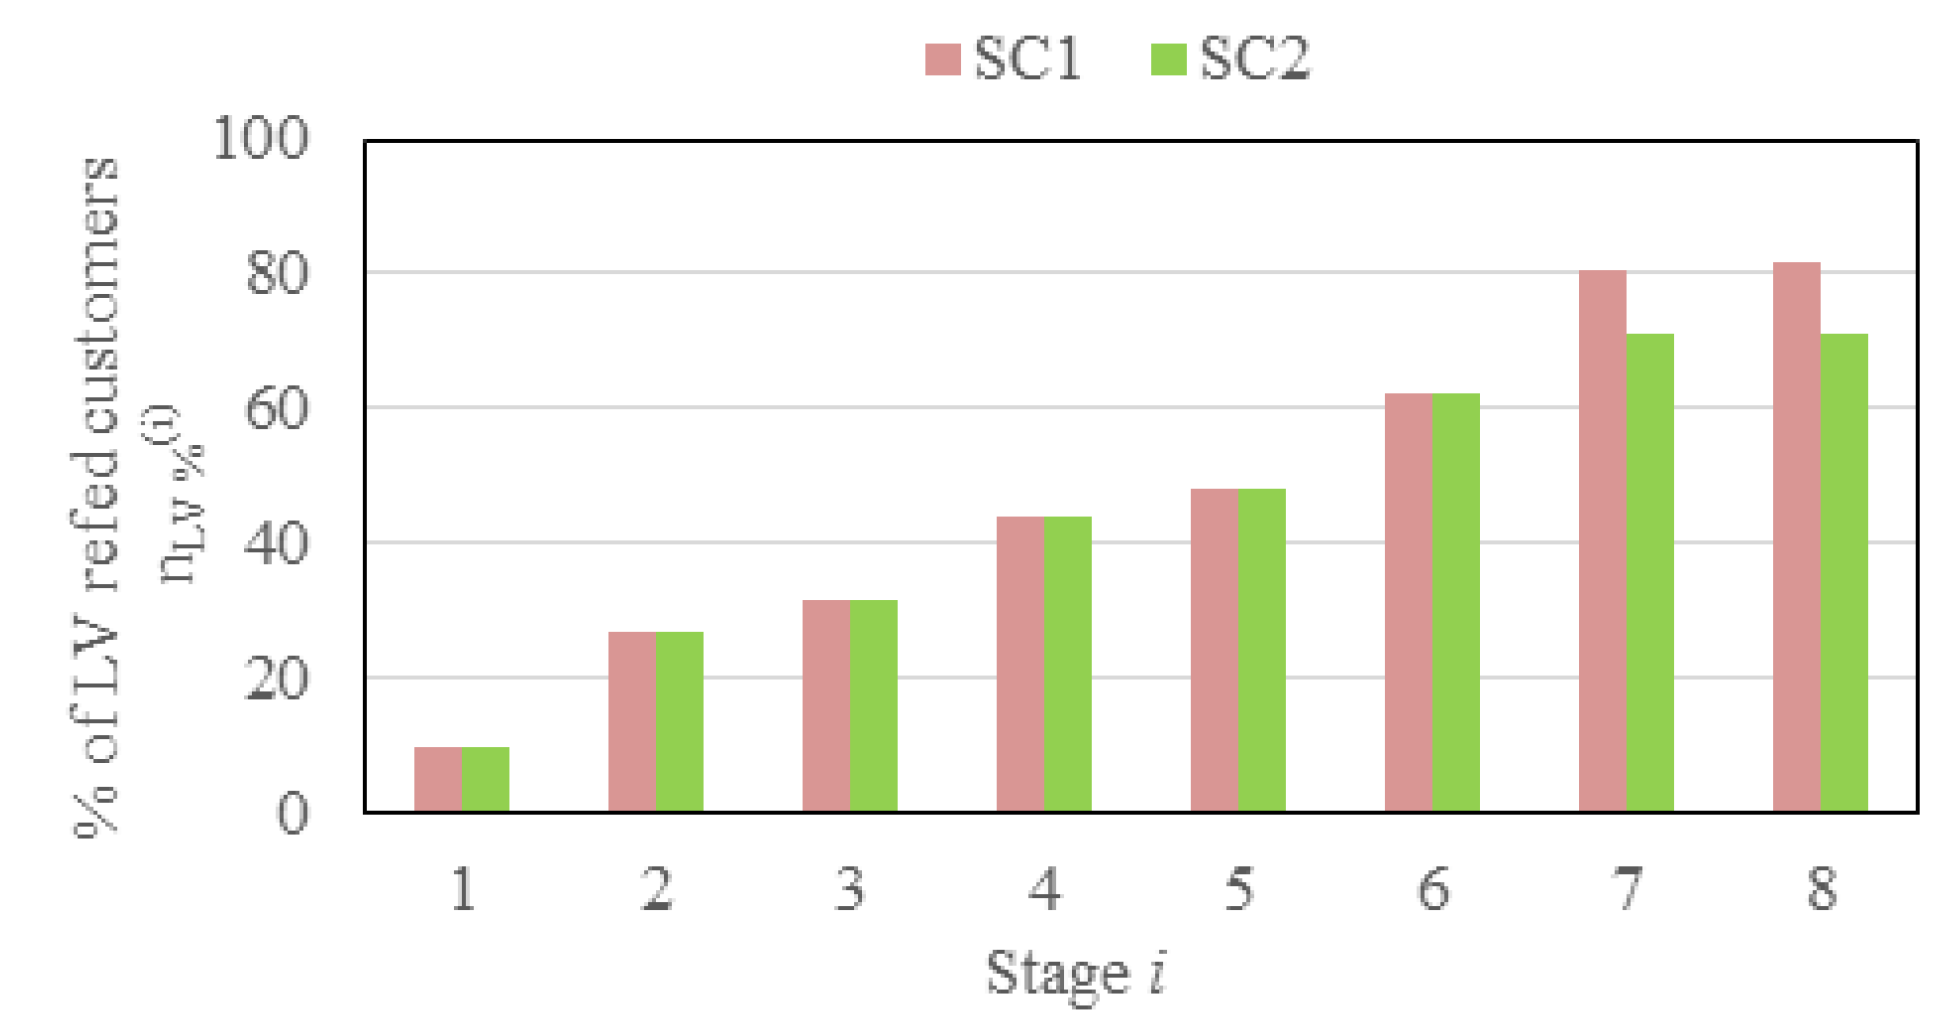
Figure 9 shows the number of LV customers guaranteed to be re-fed for each stage, when the initial SOC of the BESS is 100% (SC1 and SC2), taking into account its power capability.
At the end of the RP, it has been possible to assess that only for 81.6% in SC1 and 71% in SC2 of LV customers are guaranteed to be re-fed.
The second case is that with DG included in RPs (SC3 and SC4, SC7 and SC8), considering the possible
P-f control function of DG power plants, it allows a constant reduction of injected active power in function of the frequency variation, in accordance with the regulation [
21].
Independently from the initial SOC of the BESS (100% or 50%) and the time of blackout, the total restoration of the system is possible in terms of resupplying of all the customers of the grid.
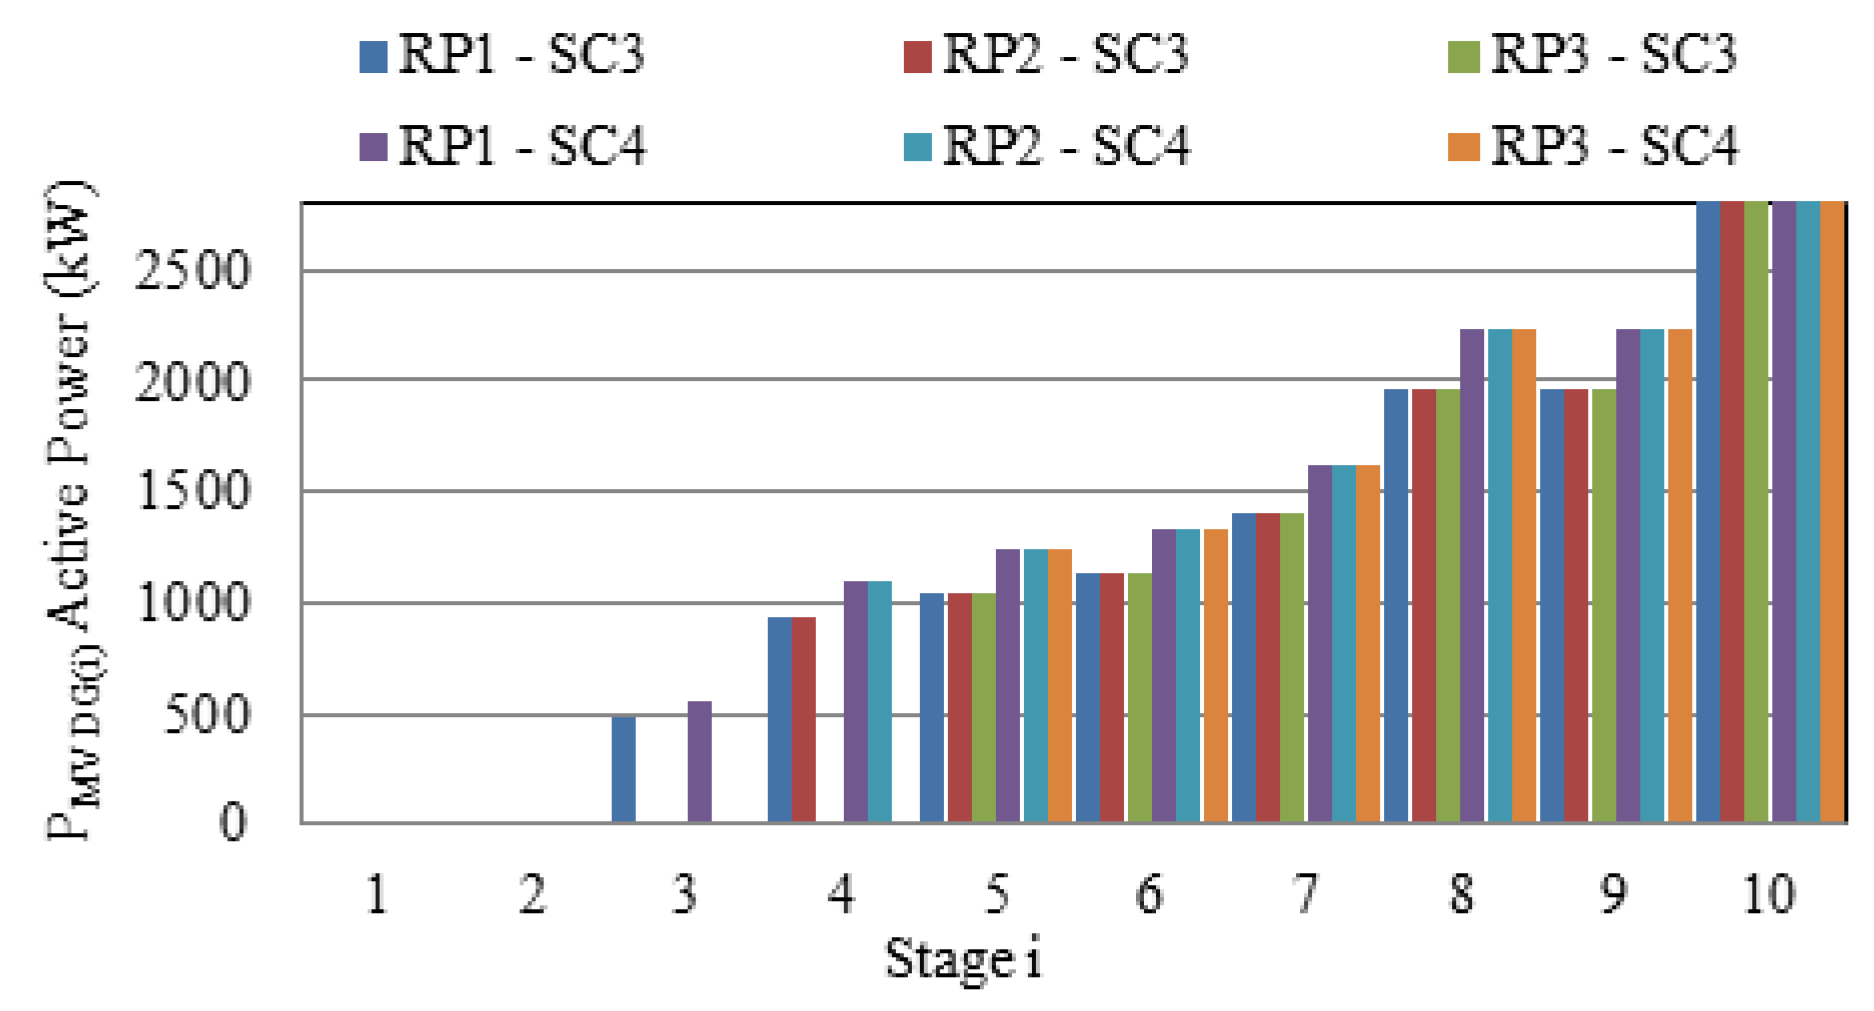
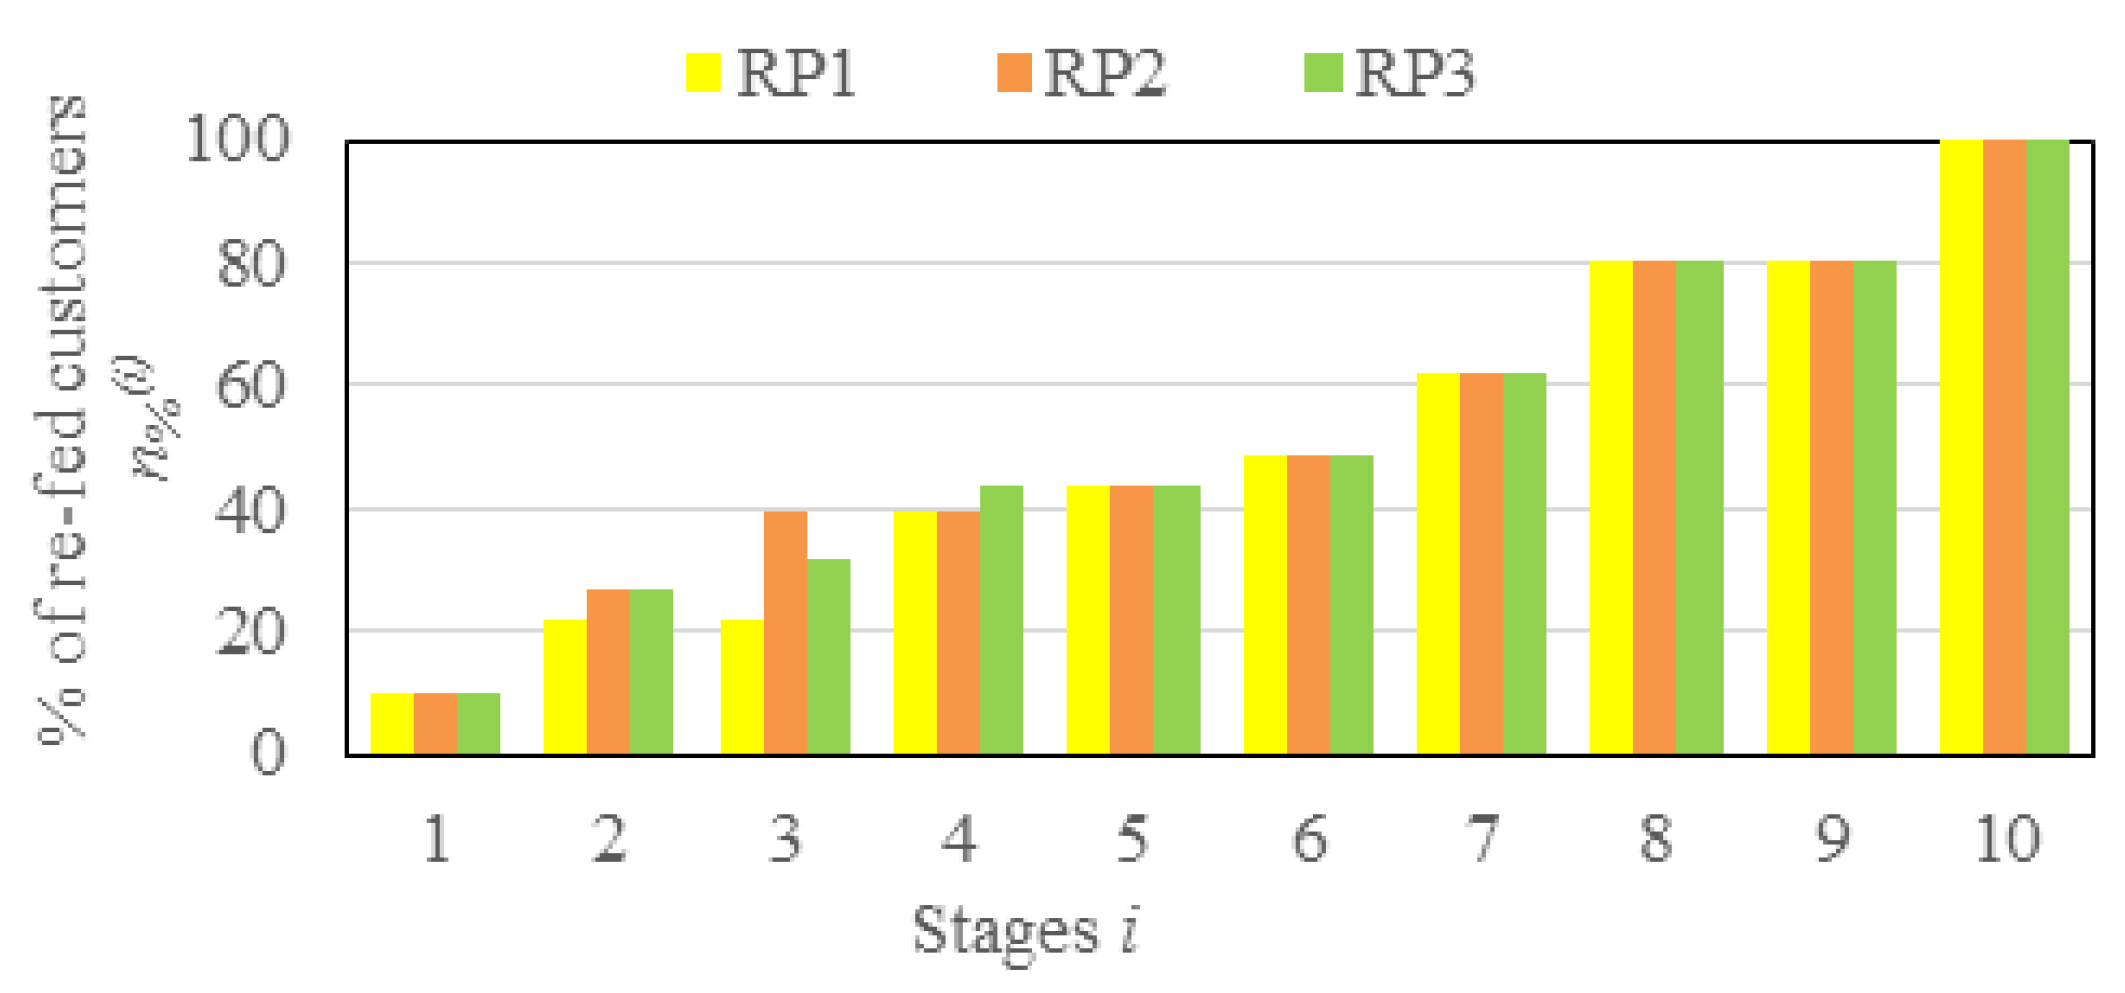
Figure 10 shows the comparison of the three RPs in terms of
for each stage.
This is because the DG is able to deliver large amounts of power, supporting the BESS in load supplying and charging the BESS itself. In particular,
Table 6 provides details on which DG power plants (type, line and size) are connected to the distribution grid in each stage for RP1.
Figure 11 shows the comparison of the three RPs in terms of power generated by the MV DG power plants at the stage
i of reconnection that can be injected in the distribution grid, in different load conditions (SC3 and SC4), with an initial BESS SOC of 100%.
Obviously, if the DSO was able to directly control the power plants, the control of the amount of power injected in the system by MV DG, in coordination with the other DSO sources, could improve the efficiency the RP procedure, both in terms of stability of portion of restored network and optimization of resources utilization.
Calculating the surplus of energy generated by MV DG in each stage in different load conditions (SC3 and SC4) and not injected into the distribution grid, it is possible to know the maximum value of the initial BESS SOC that would allow its inclusion. These values have been assessed for SC3 equal to 95.4% in RP1, 97.5% in RP2 and 98% in RP3, and for SC4 equal to 73% in RP1, 76.3% in RP2 and 77.7% in RP3. These results highlight that only a good forecasting of the DG production and coordination actions between the DG and BESS would make the RPs feasible in any load conditions.
6. Discussion
To develop a restoration plan for a part of a MV grid it is necessary to know the network, standards, equipment and personnel. The scope of the work is to:
Develop restoration plans for the MV grid to ensure controlled island operation in each load condition
Evaluate the performance of the BESS with respect to island operation
Compile a data sheet of the restoration procedures
This has been carried out in steady state; transients will be considered in future works.
A restoration plan for the MV grid must be able to ensure controlled island operation in each load condition; therefore, among the three reference days, the weekday is considered, being the day with the most onerous load. The two extreme conditions (maximum and minimum load, at 2:30 p.m. and 6:30 p.m., respectively), were considered. Among the three developed plans, it is possible to vary the percentage of customers and the DG plants connected at each stage, via the switches at the start of the lines and the RCNs. This allows to vary the load or power injection at the MV bus-bar. The results show that all the three plans ensure controlled island operation until the end of the day. This is due to the contribution of DG, which is able to deliver a large amount of power to re-feed the grid and recharge the BESS. Compliance with grid power limit and BESS minimum SOC is crucial. The different restoration plans, varying the time of connection of DG, and configurations without DG are considered, in order to assess the BESS limit capabilities with respect to duration and grid extent. The purpose is to minimize the duration and the extent of disruption, i.e., expenditures for the DSO.
The effectiveness of the BESS in the restoration process can be expressed via the maximum duration of controlled island operation. This is affected by the load conditions of the day and the BESS SOC, as reported in
Table 7.
To assess the extent of re-fed customers, LV customers have been considered, as they are the largest part of customers. Scenarios SC1-SC2, SC5-SC6 are those in which DG does not contribute and only the capacity of the BESS supports the RP. The constraint is not BESS energy capacity but rather power capacity (2 MVA) that limits the extent of the grid that can be supplied by the BESS (86% and 71% of customers in SC1 and SC2, respectively). If power capacity is higher, the percentage of customers that can be re-fed via the BESS obviously increases. Two approaches can be pursued: (i) in this work, the number of customers that can be re-fed, with a given power capacity of the BESS, is assessed; (ii) alternatively, the power capacity of the BESS can be increased, in order to re-feed all customers, and the consequent restoration time can be assessed.
It must be noted (see
Figure 10) that the different RPs can discharge the BESS in a different way at each stage, which can affect the success of the restoration. However, this is not the case if the DG supports the restoration, as this ensures the re-feeding of all customers.
Analyzing the MV DG reconnected, it is not possible to inject into the DS the total power that can be generated, due to the initial or reached BESS SOC of 100%. In other words, in RP1, independently from the SC, the
P-f control function of DG power plants acts and determines a constant reduction of generated active power, in accordance with the regulation [
38].
It is crucial to respect the power limit of the grid.
Figure 10 reports a comparison of the power generated by the MV DG power plants at stage
i, which can be injected in the distribution grid, in different load conditions (SC3 and SC4), for each RP. Therefore, it indicates the minimum SOC of the BESS, which must be able to absorb such power and thus energy. The minimum BESS SOC, rather than the percent charge/discharge for each stage, gives the assurance that no grid constraint is violated.
The proposed BESS complies with the Italian standard CEI-016 on connection to the MV grid. As evidenced in the results, the paper proposes a quantitative approach in steady state operation in order to assess the energy feasibility of the restoration plan via BESS. This is valuable information for any further analysis and development, in transient and fault conditions. Based on our findings, the implementation can be programmed; focused studies need to be carried out on transients, fault conditions and coordination of protection systems, in a way that the system complies with authority regulations, the national Grid Code [
31] and applying national standards on connection to the MV grid [
38].
7. Conclusions
In recent times, an evolution on power systems has occurred, concerning e.g., the implementation of DG and ESSs, or market and operation regulations. This has involved several stakeholders, including DSOs. Many DSOs around the world, including e-distribuzione (the largest DSO in Italy), have lately been implementing BESSs in HV/MV stations, to tackle issues arising in the power system. One of the possible new functionalities that can be provided by BESSs installed in HV/MV stations is the black start of portions of grid, i.e., the support to power system restoration after a blackout or an interruption.
In the present study, the deployment of restoration plans of a distribution grid supported by a BESS is investigated. An existing distribution grid has been considered, operated by e-distribuzione.
First, it is illustrated how a BESS can support the restoration process, acting as a slack bus between electricity supply and demand. A MATLAB®/Simulink® program has been developed, to simulate the restoration process of the distribution grid. RPs based on the BESS utilization have been developed. Their deployment has been tested via the program, to assess their ability to ensure a secure restoration of the distribution grid. Different scenarios are considered, based on the state of the network and the BESS SOC at the time of blackout. For the purpose of this work, steady state is assumed, verifying the power balance and compliance with voltage and current constraints. The effectiveness of the RPs is assessed via indicators, e.g., the maximum duration of controlled island operation and the percentage of re-fed customers at each stage of the RP.
The results show the ability of the BESS to support controlled island operation of the grid and the feasibility of the BESS-based RPs. These findings provide a valuable knowledge base to the DSO and corroborate the concept of BESSs as a valuable support for power system reliability.
In future works, it is worth to investigate transients and voltage and frequency control, with more detailed modeling and experimental activity. Then, the proposed procedure can be implemented in the real system, once the DSO has full control of the DG, following the evolution of electricity market regulations. Finally, the developed RPs can be integrated in the DSO’s grid management strategies, in order to direct grid investments, towards a smart grid management.

 ,
, 


