Article

Electricity as a Cooking Means in Nepal—A Modelling Tool Approach

Institute for Technology and Resources Management in the Tropics and Subtropics, TH Köln (University of Applied Sciences), Betzdorfer Strasse 2, 50679 Cologne, Germany
*
Author to whom correspondence should be addressed.
Sustainability 2018, 10(8), 2841; https://doi.org/10.3390/su10082841
Submission received: 4 May 2018 / Revised: 2 August 2018 / Accepted: 4 August 2018 / Published: 10 August 2018
(This article belongs to the Collection Power System and Sustainability)

Abstract

:
Cooking energy has an important role in energy demand of Nepal. Over the last decade, import of Liquefied Petroleum Gas (LPG) has increased by 3.3 times as an alternate cooking fuel to kerosene and firewood. The growing subsidy burden to endorse modern fuel switching from traditional energy sources and high import of LPG are challenges for sustainability and energy security. This paper analyzes the future residential cooking energy demand and its environmental and economic impacts from 2015 to 2035 using a Long-range Energy Alternative Planning System (LEAP) tool. In 2035, the LPG demand for cooking is projected to be 26.5 million GJ, 16.3 million GJ, 45.2 million GJ and 58.2 million GJ for business as usual (BAU), low growth rate (LGR), medium growth rate (MGR) and high growth rate (HGR) scenarios, respectively. To substitute LPG with electricity in the cooking sector by 2035, an additional 1207 MW, 734 MW, 2055 MW and 2626 MW hydropower installation is required for BAU, LGR, MGR and HGR scenarios, respectively. In the MGR scenario, substituting LPG with electricity could save from $21.8 million (2016) to $70.8 million (2035) each year, which could be used to develop large-scale hydropower projects in the long term.

1. Introduction

Energy is indispensable in modern societies to maintain the current standard of living. It is one of the main drivers of economic and social development, and thus its demand has increased enormously over the past years. In the context of Nepal, despite the huge potential of hydropower and solar energy, only about 70% of the country’s population had access to electricity in 2015 [1]. Additionally, there is a huge difference in electrification rate between urban and rural areas, i.e., 94% of urban inhabitants have access to the grid compared to only 61% of rural inhabitants [2]. As the country moves into the development era, energy demand in all sectors (e.g., industrial, commercial, residential, transportation, and agricultural) will significantly increase. Among these five different sectors, the residential sector has now the major share in country’s energy consumption and this sector is predominated by traditional biomass resources such as firewood, animal dung and agricultural residues. These resources are mainly used for cooking, lighting and heating applications. Cooking has more than a 61% share of residential energy consumption, whereas that for heating is about 14%. Electricity in the residential sector is mainly used for lighting purposes. However, depending upon the urbanization ratio, consumption of energy is also increasing for electrical and electronic appliances such as television, radio, irons, refrigerators, microwave ovens, computers, air conditioning, and even for cooking. Total energy consumption in the residential sector by different fuel types of Nepal for the fiscal year 2011/12 is shown in Table 1.
According to the Annual Household Survey Report of 2014/15, firewood was a major source of cooking fuel in Nepal, serving more than 59.3% of total households. The use of LPG has exponentially increased in recent years and it is now consumed by 25.8% of households. It is the most used cooking fuel in urban areas, at about 58.5% [4,5]. LPG is currently the second-most used cooking fuel in the country. In the fiscal year 2004/05, about 77,594 tons of LPG was imported from India. Over ten-year period, the demand for LPG grew exponentially and imports reached 258,299 tons in the fiscal year 2014/15 [6], as shown in Figure 1. Full dependency on LPG gas imports from India raises the question of energy security. Energy security is a key issue between the two countries (India and Nepal) due to the social-political issues in the supply-demand balance [7]. Full dependency on fuel import is linked to trade deficit and negative economic and social impacts, including intentional irregular supply of fuels, causing high economic cost to the national economy.
Today, the demand for LPG gas is rapidly increasing as an alternative option for kerosene. The economic survey report shows that the LPG demand in urban households is high, and households normally consume about 28.4 to 42.6 kg LPG monthly for cooking and heating purposes. In the fiscal year 2014/15, in monetary terms, the import of petroleum products had more than a 20% share of the total import budget of Nepal, costing about $1068.5 million [5]. The share of expenditure on petroleum product imports accounts for 28% of the national GDP, among which $194 million was spent to import 258,299 tons of LPG for domestic purposes [5,8] only.
More than 61% of the total population lives in rural areas [9], with limited or no access to modern fuels. The cooking energy need patterns of urban and rural areas in Nepal differ distinctly, as shown in Table 2.
In rural areas, more than 85% of households use biomass as cooking fuel. Undoubtedly, firewood is the predominant fuel, accounting for 72.5%, followed by dried cow dung. In a survey conducted by the Central Bureau of Statistics of Nepal, it was reported that 9.4% of rural households use LPG for cooking.
The switching of cooking fuel in the residential sector from traditional biomass and petroleum products to clean energy from hydropower is essential for the sustainable future of Nepal. Hydroelectricity is a cleaner source of cooking fuel and it does not cause any continuous deforestation or environment pollution (indoor and outdoor). The objective of this paper is to analyze the residential sector cooking fuel demand in Nepal under different scenarios based on national GDP growth rate assumption using the LEAP modelling tool up to the year 2035. As there has been less research done on substituting LPG with electricity, and because it is mainly based on policy intervention in one scenario without any consideration of latent demand, environmental impacts and economic analysis, to address this research gap, evaluation of cooking sub sectorial energy demand and GHG emissions, and economic analysis of modern fuel were also conducted in this work.

2. Literature Review

According to the historical hydropower production statistics of Nepal, universal electricity access and transition to cleaner cooking fuels are far below the level of basic human needs, as 30% of the country’s population still does not have reliable electricity access even for lighting purposes [1], and this sector faces various challenges from political level to the policy level [10]. Regardless of the huge water resources available for medium- and large-scale hydropower plants, the energy crisis has continued to grow due to lack of notable success in hydroelectricity generation.
Today’s energy transition in the residential sector is associated with a changing pattern of energy production, availability, and consumption, and the rising living standard of people. In Nepal, the residential sector dominates the total energy consumption pattern and receives the most attention from among researchers and policy makers. Pradhan and Limmeechokchai [11] analyzed electric and biogas stoves as an option for cooking fuel in Nepal and Thailand using the Asia-Pacific Integrated Model (AIM)/Enduse as an analytical tool. They compared three low-carbon cooking scenarios with the business as usual scenario, focusing mainly on the penetration effects of biogas and electricity cooking options in the country’s energy consumption pattern and energy-related GHG emissions, emphasizing that promoting electricity for cooking is not always a better option; it depends upon the country’s available energy sources. Some studies have highlighted the benefits of the access of electricity for cooking on human health [12,13,14]. Jain et al. [15] analyzed clean, affordable and sustainable cooking energy in terms of different fuel supplies (such as improved biomass cook stoves, biogas, electricity, LPG, and Piped Natural Gas), its technology resilience, economics, convenience of cooking, cumulative GHG emissions and health impacts resulting in higher drawbacks on the economic and supply assurances, posing a significant burden to people due to affordability as well as a higher fiscal burden to the government. A number of studies have been conducted on household fuel switching from solid fuels to a cleaner fuel [16,17,18], in which household age, education, income, size, and the price and availability of fuel are mentioned as strong determinants of fuel switching success. Although several studies have highlighted household fuel switching from solid fuel to a cleaner fuel (e.g., [16,17,18,19]), only limited studies have focused on fuel switching from LPG to electricity [11,15]. There are only a few studies conducted on the household electric cooking [11,20]. Some of the common methods and survey results on the topic are compiled in Table 3.
Long-term energy modelling systems integrate and capture various interaction of economic changes and energy supply, population, demand and costs. For that reason, many researchers have dedicated their work on integrated energy planning for sustainable development. Numerous studies have been conducted about the modelling tools and their application in different energy sectors for various cities and countries. Several studies are available regarding the various energy demand forecasting models, highlighting the methodological diversities and development over the past decades for analyzing whether the existing energy models are appropriate for developing country scenarios [27,28]. By analyzing the number of main characteristics of developing countries addressed per model, Ouedraogo’s [29] review paper mentioned LEAP, MESSAGE, MAED and WEM as commonly used energy modelling tools that specify large numbers of developing country characteristics.
In the context of Nepal, some authors [1,30] have used the MAED model, whereas others [31] have used MAED and MARKAL to evaluate the future energy demand for the medium to long term, focusing more specifically on demand for specified energy services. Although all these authors have a common objective in calculating the energy demand for each end-use category and sector, the projected value at the end year is different due to different assumptions, scenarios and economic growth rate considerations. An empirical econometric method was used by the authors in [32,33], projecting energy demand with the formation of linear logarithmic energy consumption models based on economic parameters. However, only three authors [1,20,31] analyzed national-scale energy demand using different simulation tools. To provide an insight into fuel switching from LPG to hydroelectricity for cooking purposes, this study uses modelling tools and economic analysis to appraise the energy demand, environmental impacts and cost implications of future scenarios based on national GDP growth rate.

3. Materials and Methods
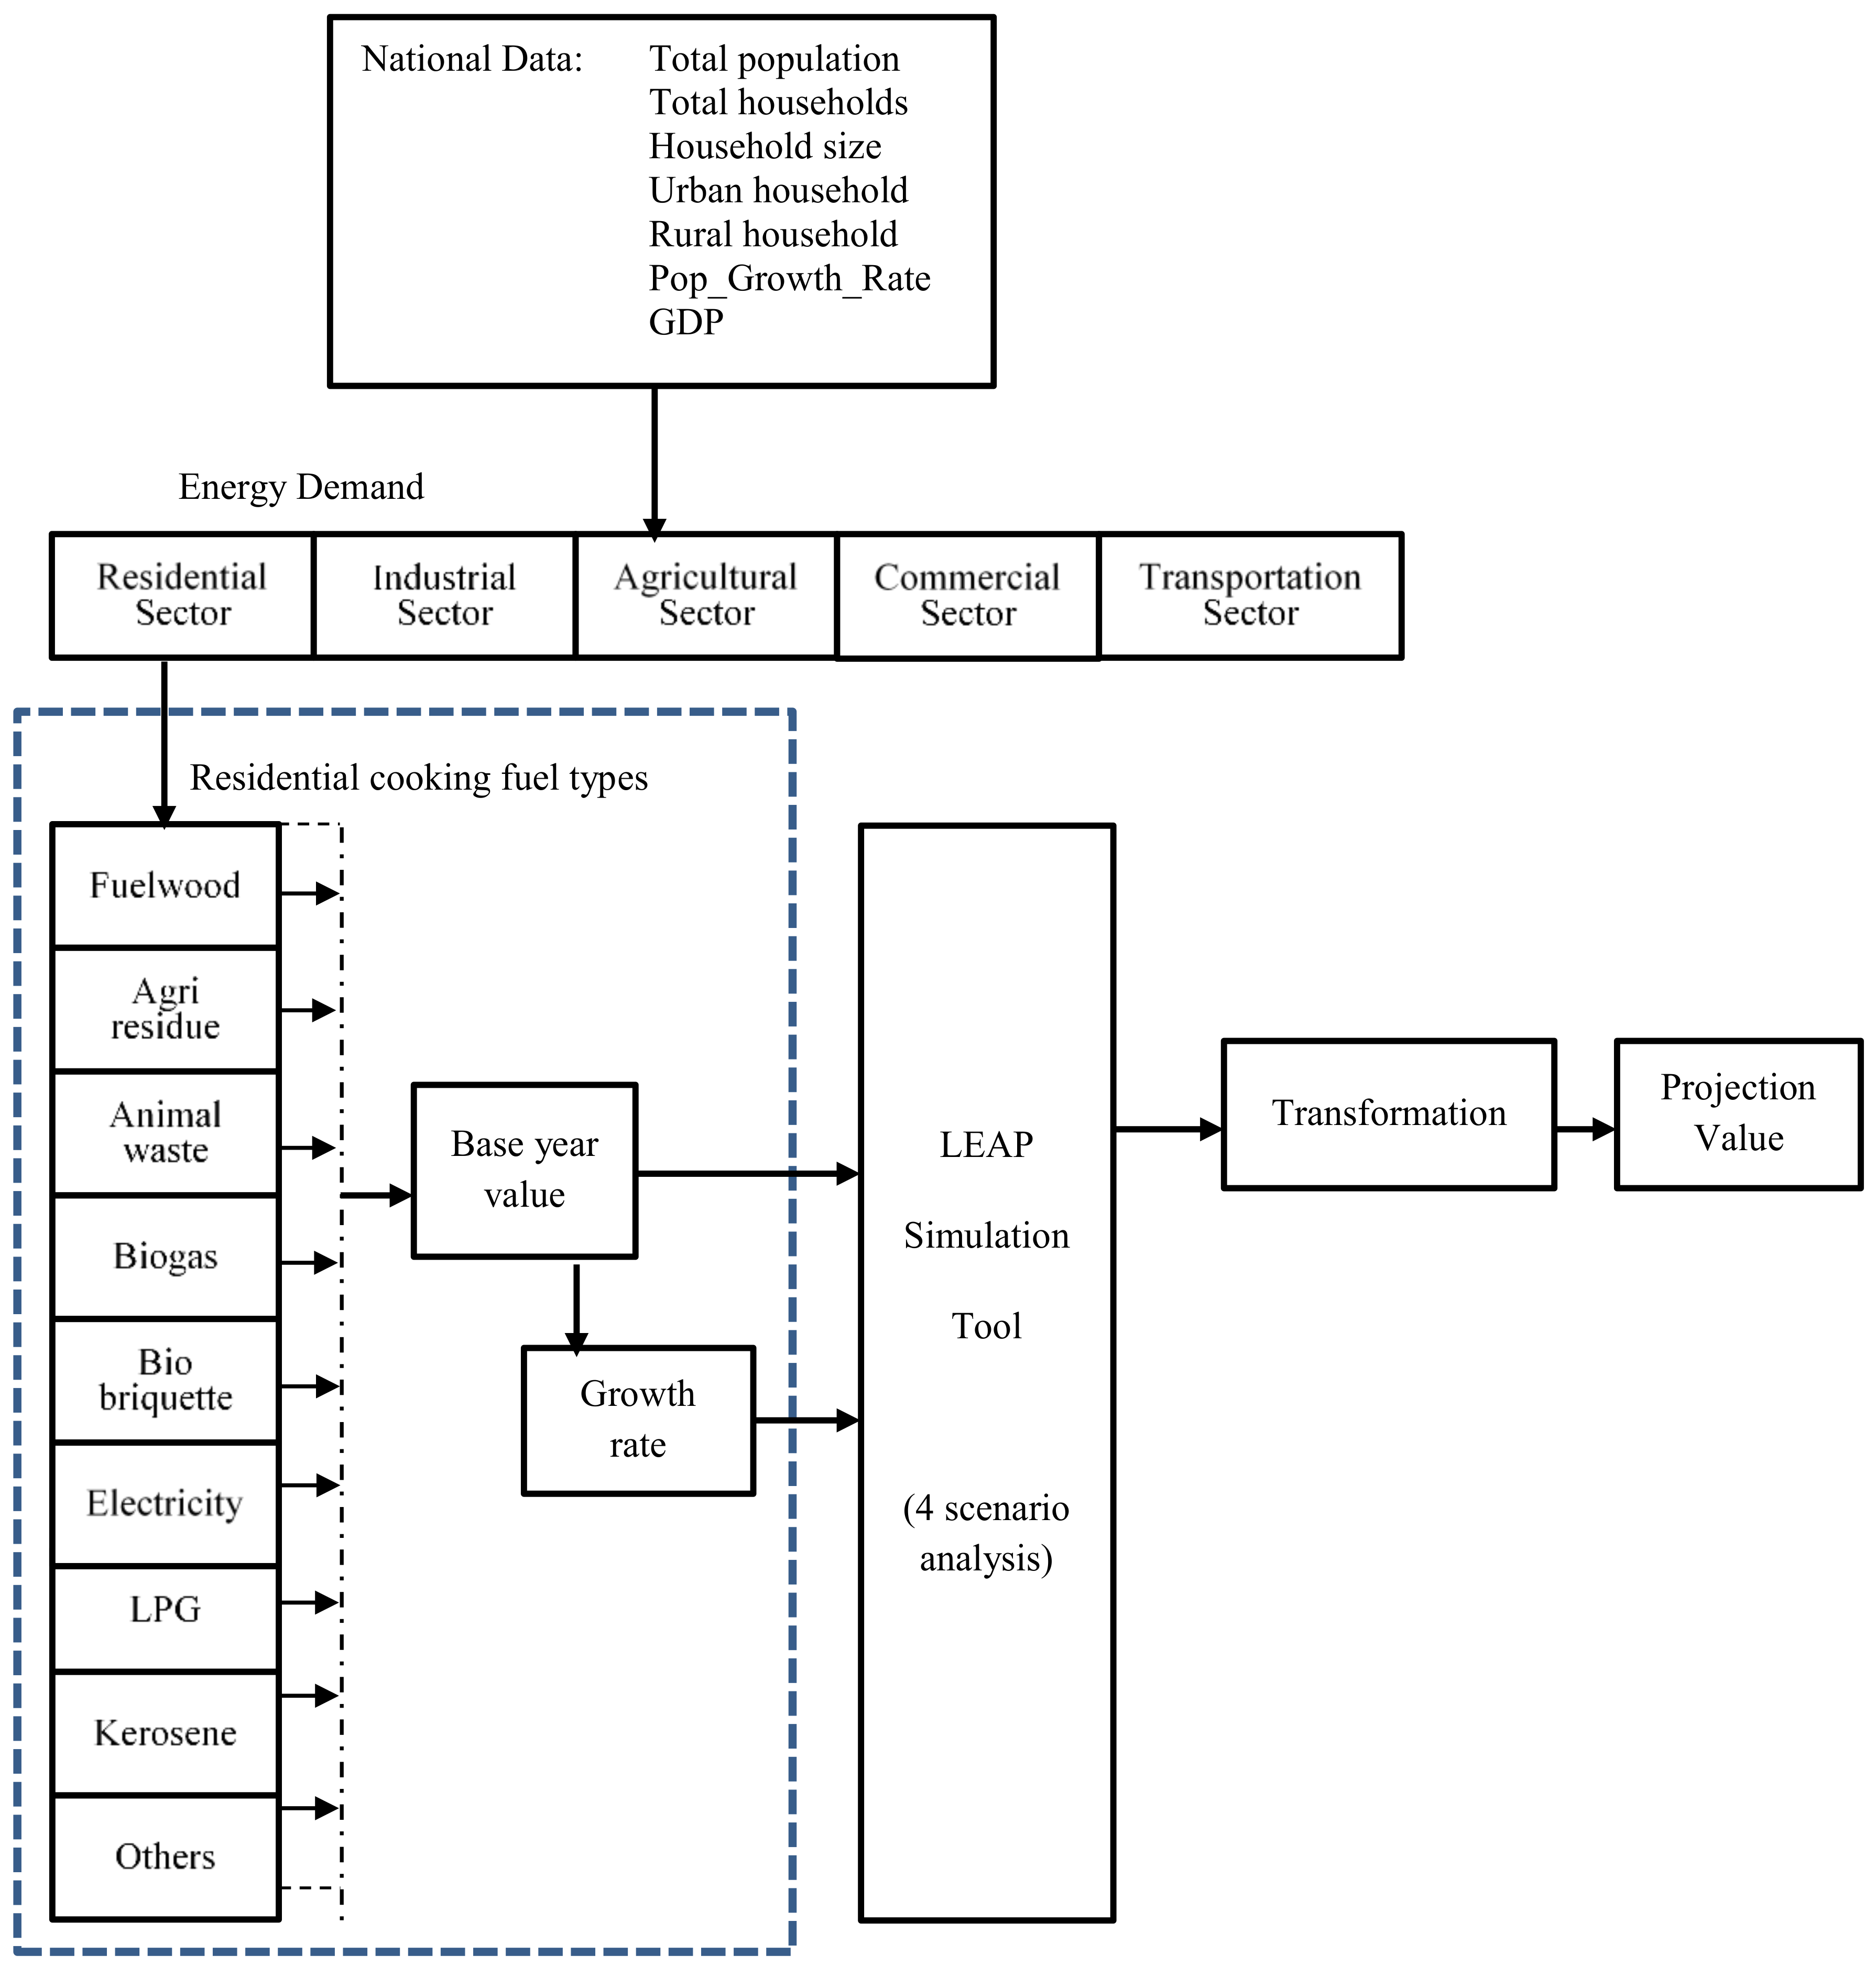
3.1. Methods

Energy models use various data from different official sources to describe the energy sector and sub-sector such in terms of energy demand and supply. They perform a simulation as a function of changes in national population, economic activity and energy intensity. Changes in those parameters influence the trends of electricity demand projection [34], which drive the evolution and development of long-term projection methods.
The LEAP model is selected as the preferred framework for expanding scenarios. LEAP is a comprehensive, integrated, scenario-based energy environment modelling tool to calculate future energy demand, supply and emissions at the local, national, regional or global levels. LEAP supports a wide range of different modelling methodologies, from bottom-up, end-use accounting to top-down, and provides a range of accounting, simulation and optimization methodologies [35]. In the LEAP model framework, it provides flexibility in using various input data “these can range from highly disaggregated end-use oriented structure to highly aggregate analyzes. Typically a structure would consist of sectors including households, industry, commerce, transport and agriculture each of which might be broken down into different sub-sectors, end-uses and fuel-saving devices” [35].
Several studies have already been conducted in the context of forecasting electricity demand in different sectors using the LEAP model. Park et al. [36] used LEAP to simulate the annual electricity demand and supply system of Japan from 2011 to 2030 as an alternative electricity scenario to meet the goals of nuclear phase-out and greenhouse gas emission reduction. Different authors have used LEAP as a long-term scenario analysis and management tool—although their scope, context, duration, sector and methodology differ—for different countries (e.g., for Taiwan [37], Korea [38], Pakistan [39], Iran [40], Ghana [41] and Lebanon [42]). A schematic representation of the LEAP model framework implemented in this work is shown in Figure 2.
The LEAP modelling framework is composed of five different sectors: residential, commercial, industrial, agricultural and transportation. This work mainly focuses on residential cooking fuel switching, thus the cooking sub-sector is divided into different fuel types. In developing scenarios, all the cooking fuel types that are commonly used in the residential sector are considered. Each scenario is integrated with the base year modelling.

3.2. Data Collection

In order to feed the required input data into the simulation tool, LEAP-relevant data were collected mostly from government agencies such as Central Bureau of Statistics [4,43], Ministry of Finance [44], Nepal Electricity Authority [45], Alternative Energy Promotion Center [46], National Planning Commission, Water and Energy Commission Secretariat (WECS) [3], etc. For economic parameters such as National GDP, GDP per capita, GDP growth rate and GDP by sectors, data were taken from the World Bank [47] and Ministry of Finance [44] reports. Most of the required data for the application of the LEAP model was available for the base year. However, for some input parameters, either the official data was not available, or it had not been updated. In such cases, either an assumption was made based on information available from previous years or data was collected from the literature.

3.3. Base Year Modelling

For modelling and analysis of a long-term cooking energy demand projection for Nepal, the population, national economic growth, sectorial value and energy intensities are the key drivers for the base year modelling. The energy balance report published by WECS [3] provides detailed information about the sectors and fuel types of energy consumption. In this paper, the energy balance report of fiscal year 2011/12 was taken as reference data, and was extrapolated till 2015 to consider 2015 as a base year. In fiscal year 2011/12, around 370 million GJ of total energy was consumed [9], of which more than 80% was used in the residential sector, in which 61% was consumed for cooking only.
Based on the census report, the total population of the country in 2011 was 26.5 million. With the population growth rate of 1.35% annually, total population in the base year 2015 was around 28 million and it will reach 36.6 million by 2035. Over the outlook period, it is assumed that electricity will play an important role by displacing traditional and fossil fuels by a certain fraction. For cooking purposes in the residential sectors, traditional and modern fuels such as wood, agricultural residue, animal dung, kerosene and LPG will be replaced to a certain percentage by electricity and LPG. To gain insight into the country’s energy production and consumption, historical energy data were analyzed in the base year model to understand the energy growth in terms of demand and supply, as well as the potential of available resources.

3.4. Scenario Description and Assumption

In the LEAP model framework, scenarios are based on detailed accounting of the types of energy consumed by the residential sector using various fuel types. In this research, scenarios were created to develop long-term energy plans and to understand energy demand and its environmental impacts. The long-term energy pathways propose a set of other possible situations for examining the future, which may unfold in different ways [48]. This study analyzes four different scenarios: one baseline scenario and three reference scenarios based on national GDP growth rate.
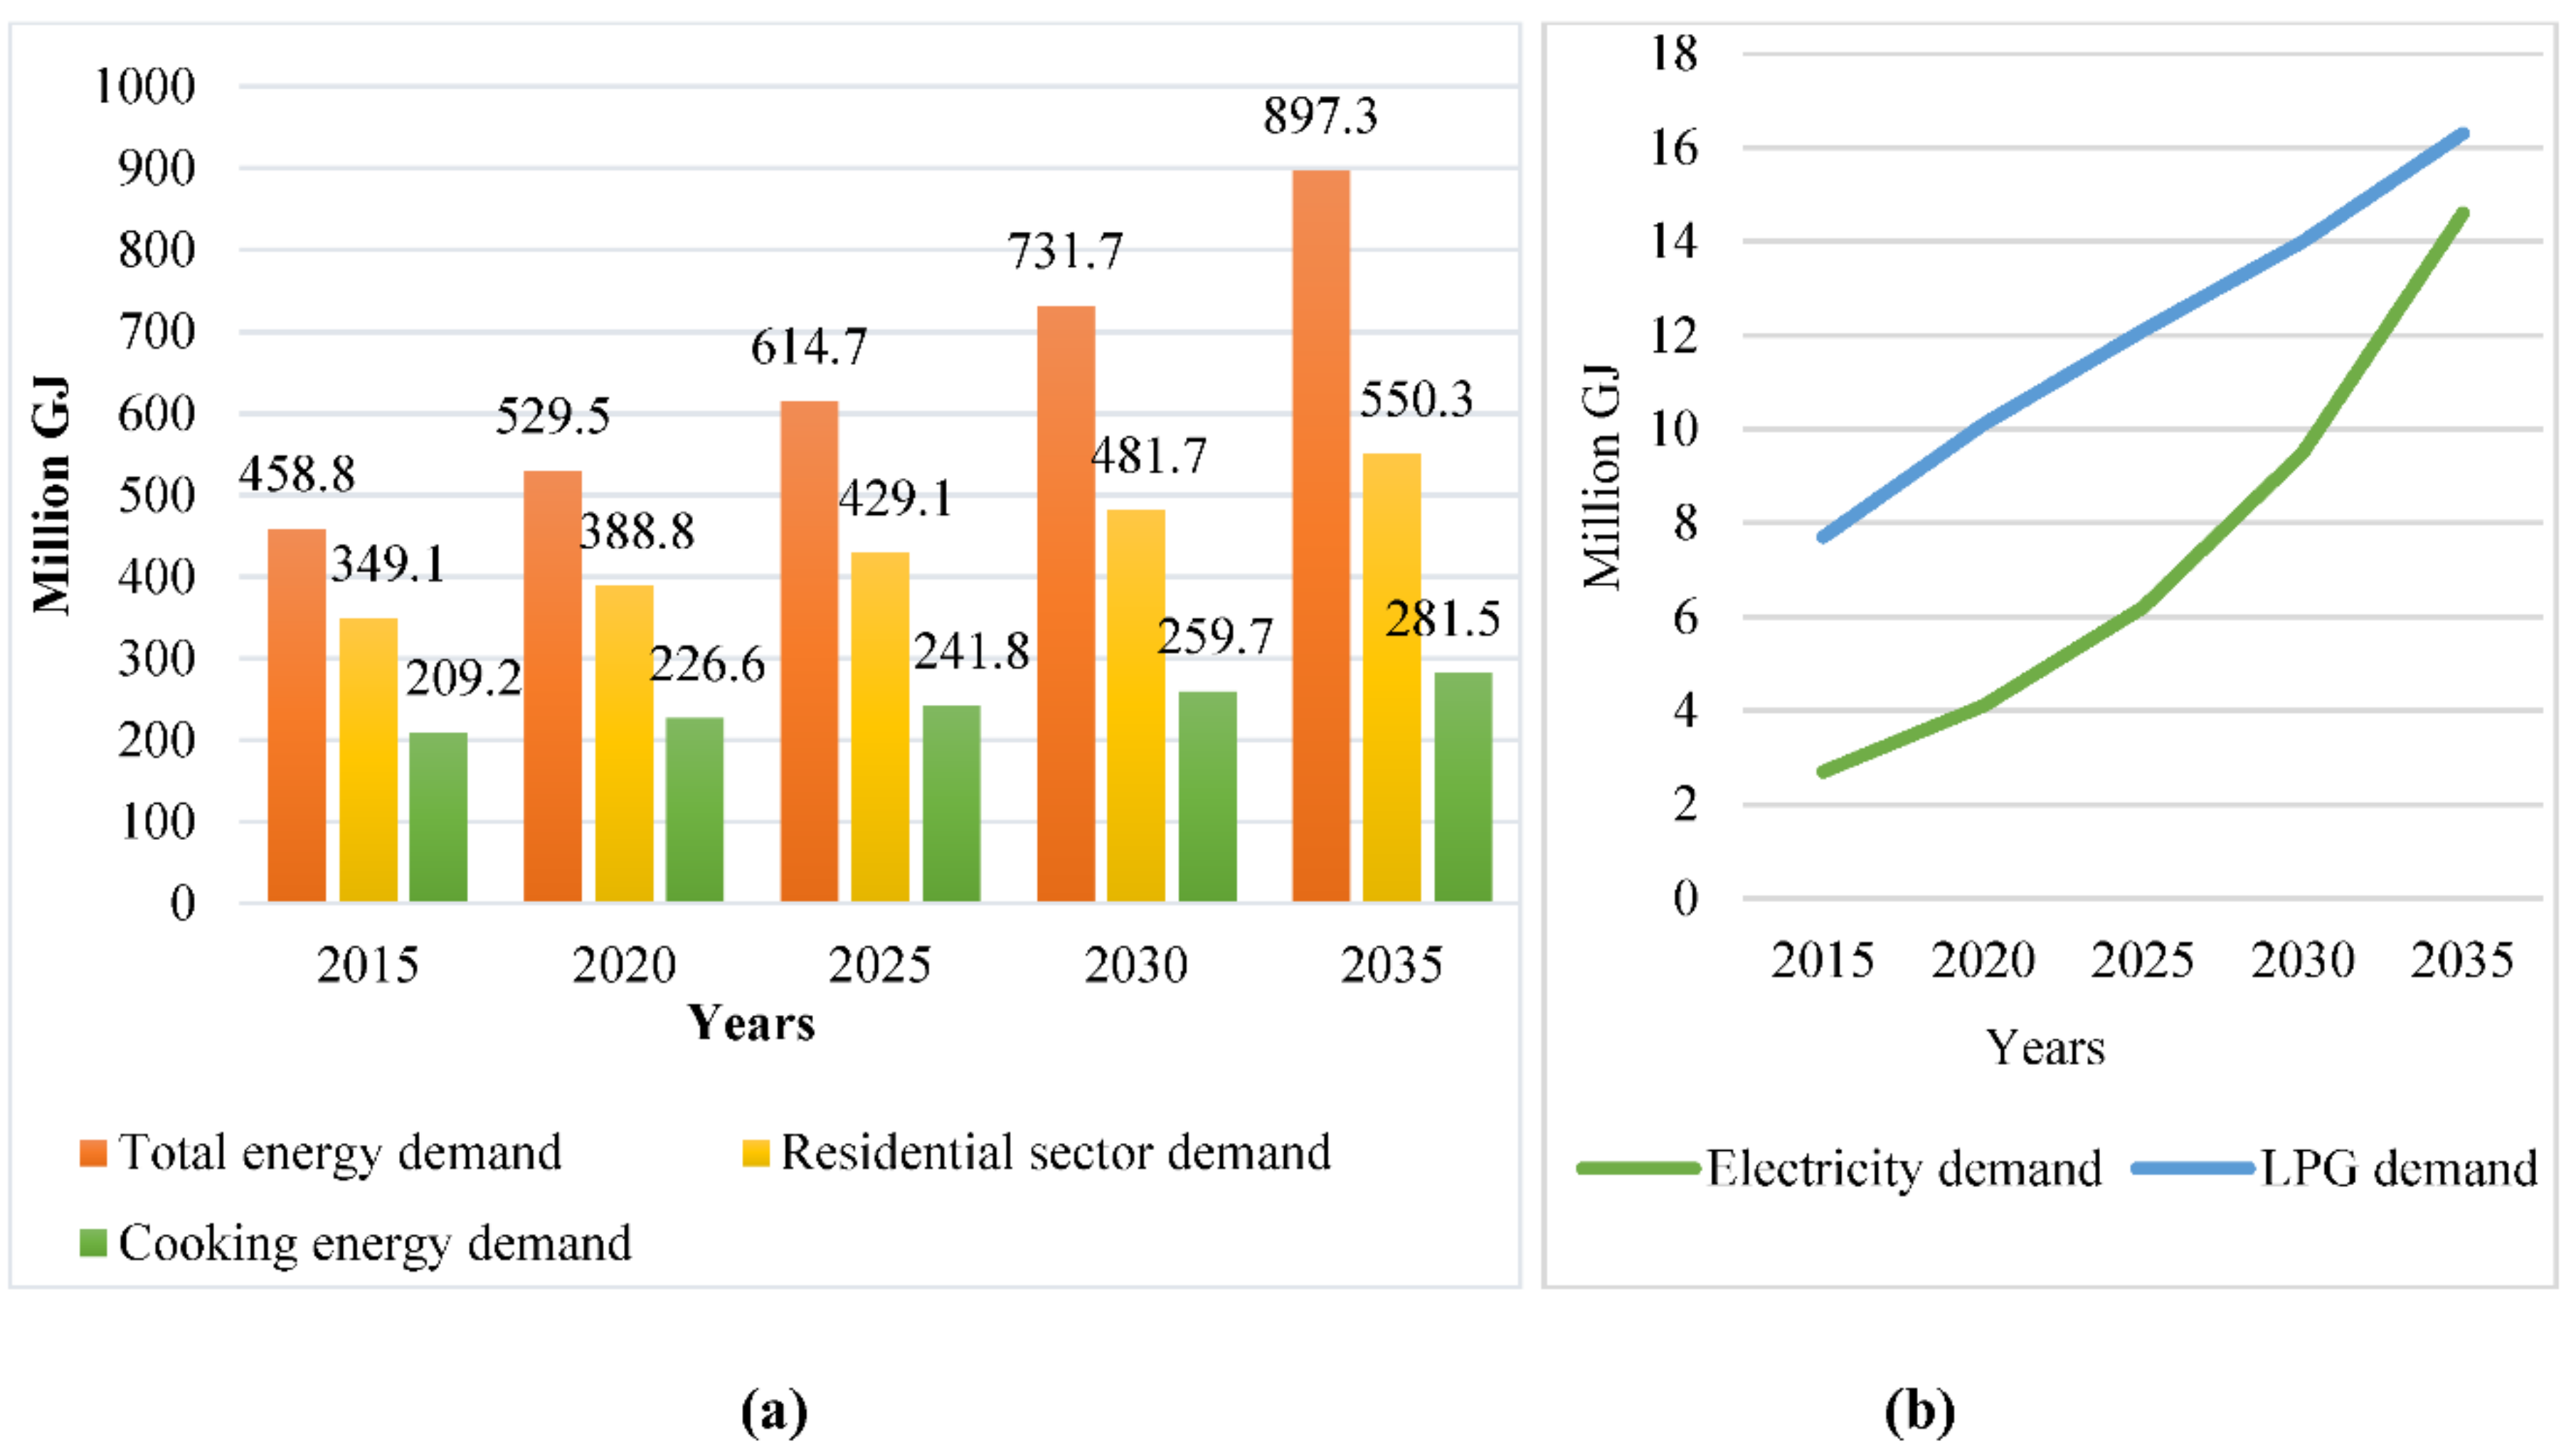
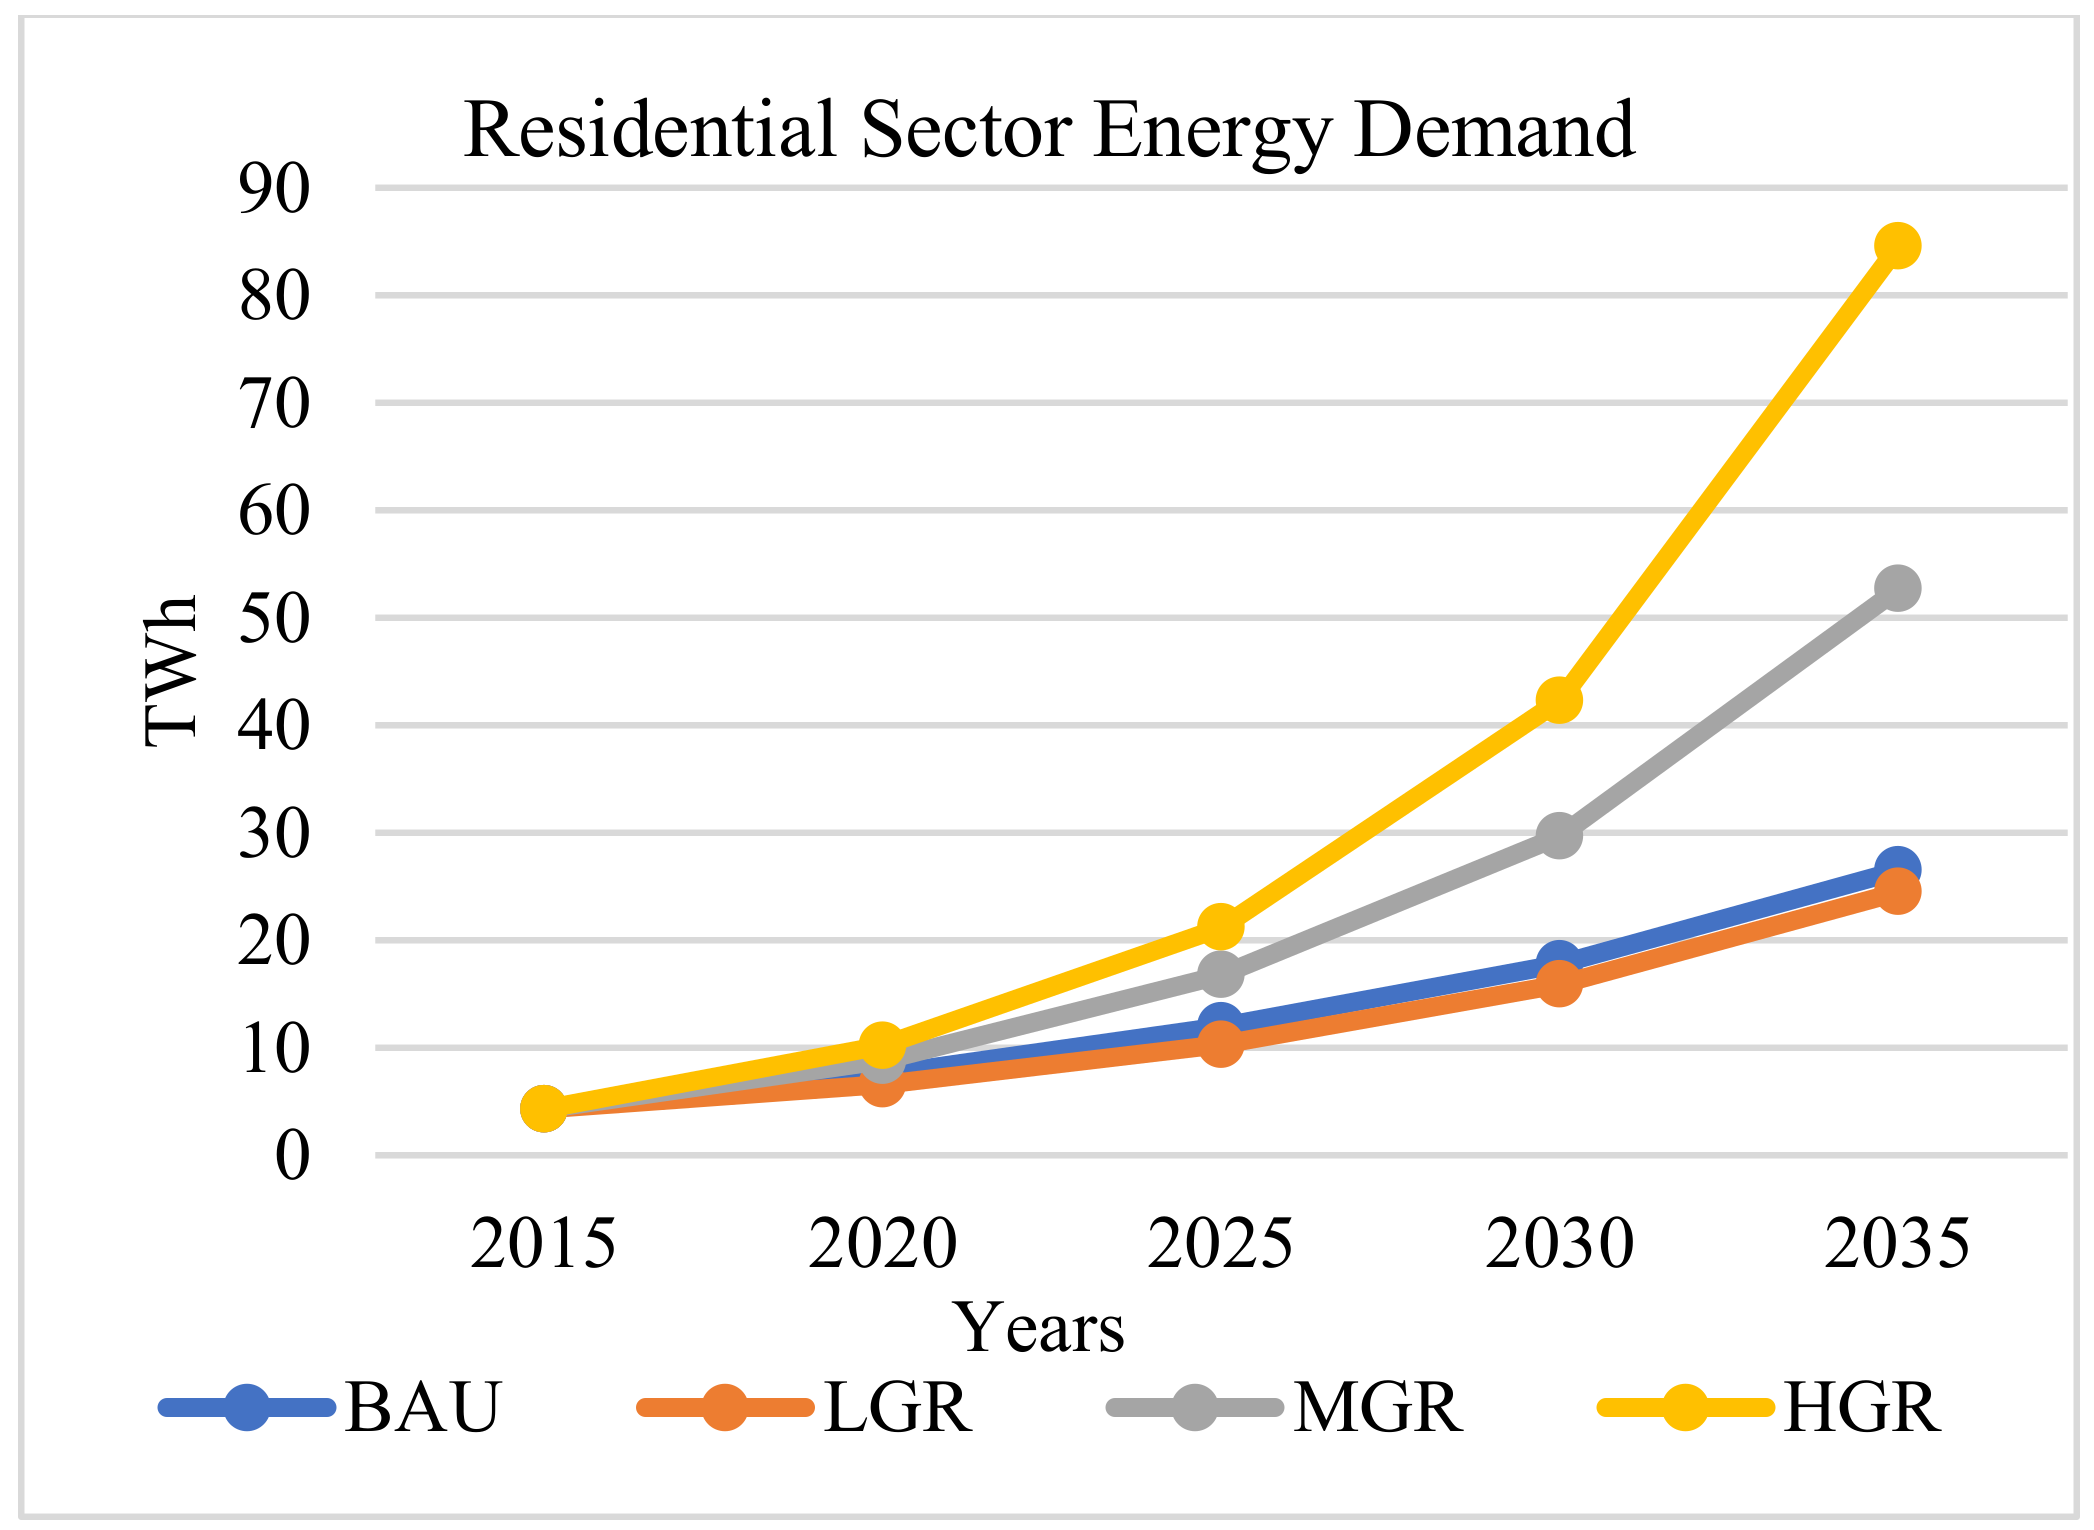
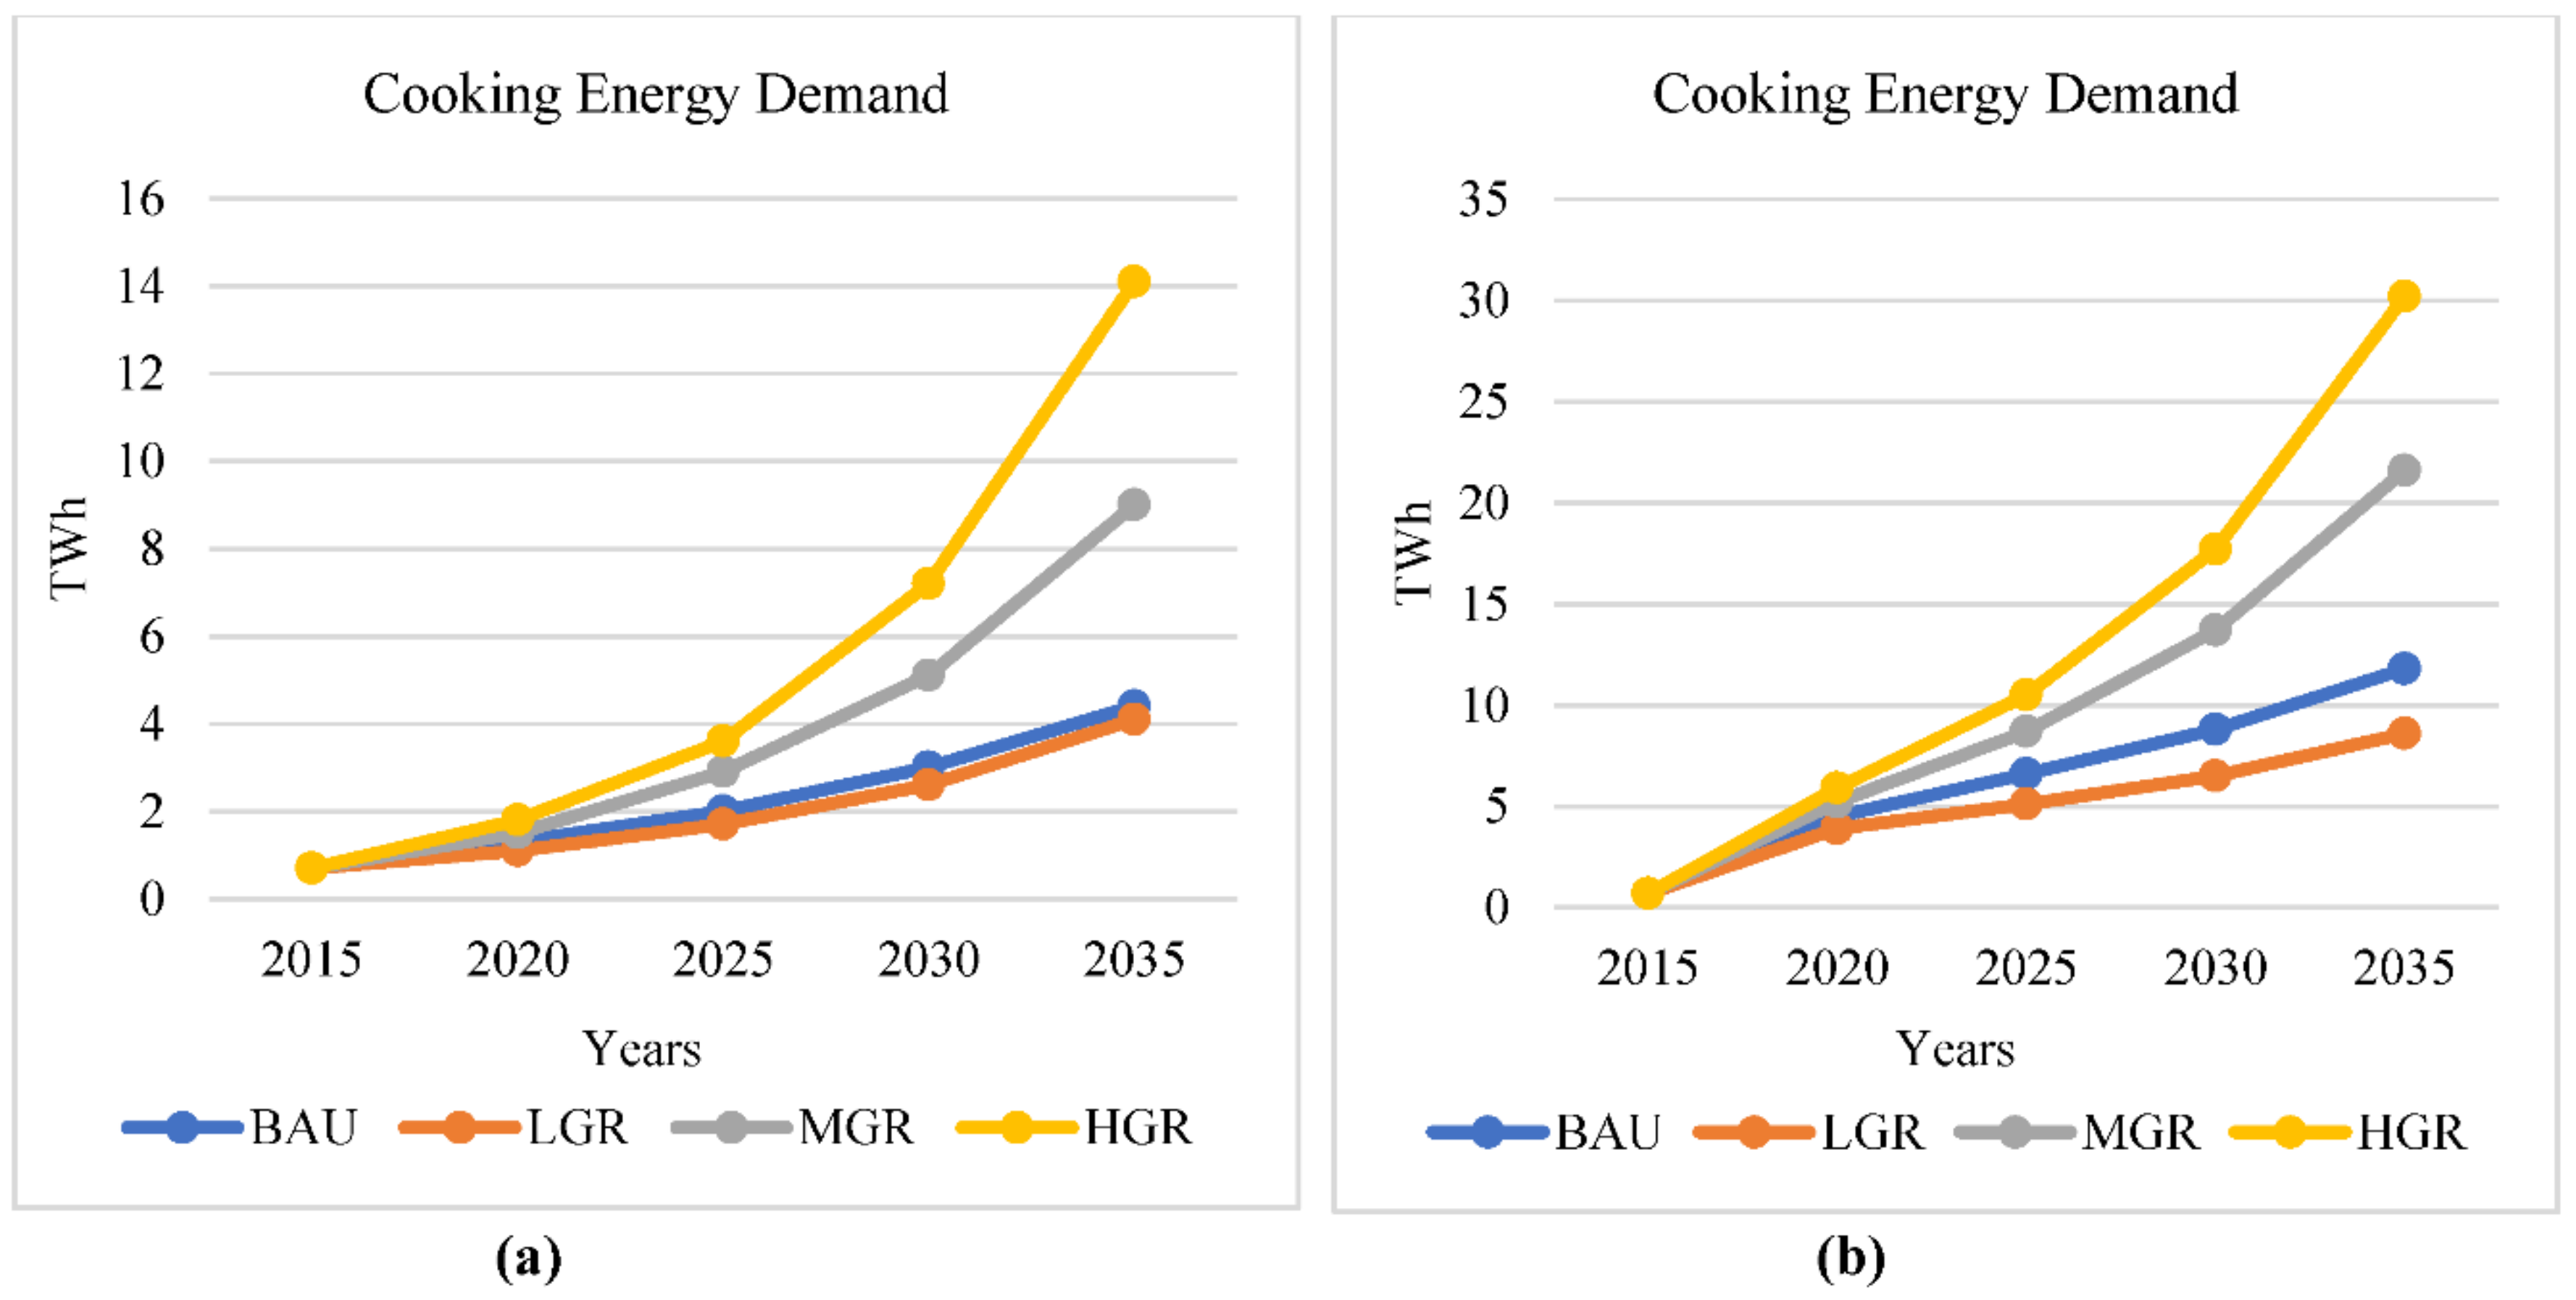
  • Scenario 1: Business as Usual Scenario (BAU)
    The BAU scenario forecasts the future energy balance based on current trends by using government plans, policy and official forecast information that define the shape of sector for the next decades. It assumes that current economic and energy policies will broadly continue. In other words, the BAU scenario will be the continuation of the current energy sector’s trends in the residential sector with an annual GDP growth rate of 5%.
  • Scenario 2: Low Growth Rate (LGR)
    This scenario deals with the demand growth with lower economic development than BAU and medium growth rate, assuming that the economic and political sector will be badly disrupted by internal and external factors. It is a pessimistic scenario where all the energy demand in different sectors will be low, having an economic growth rate of 4%.
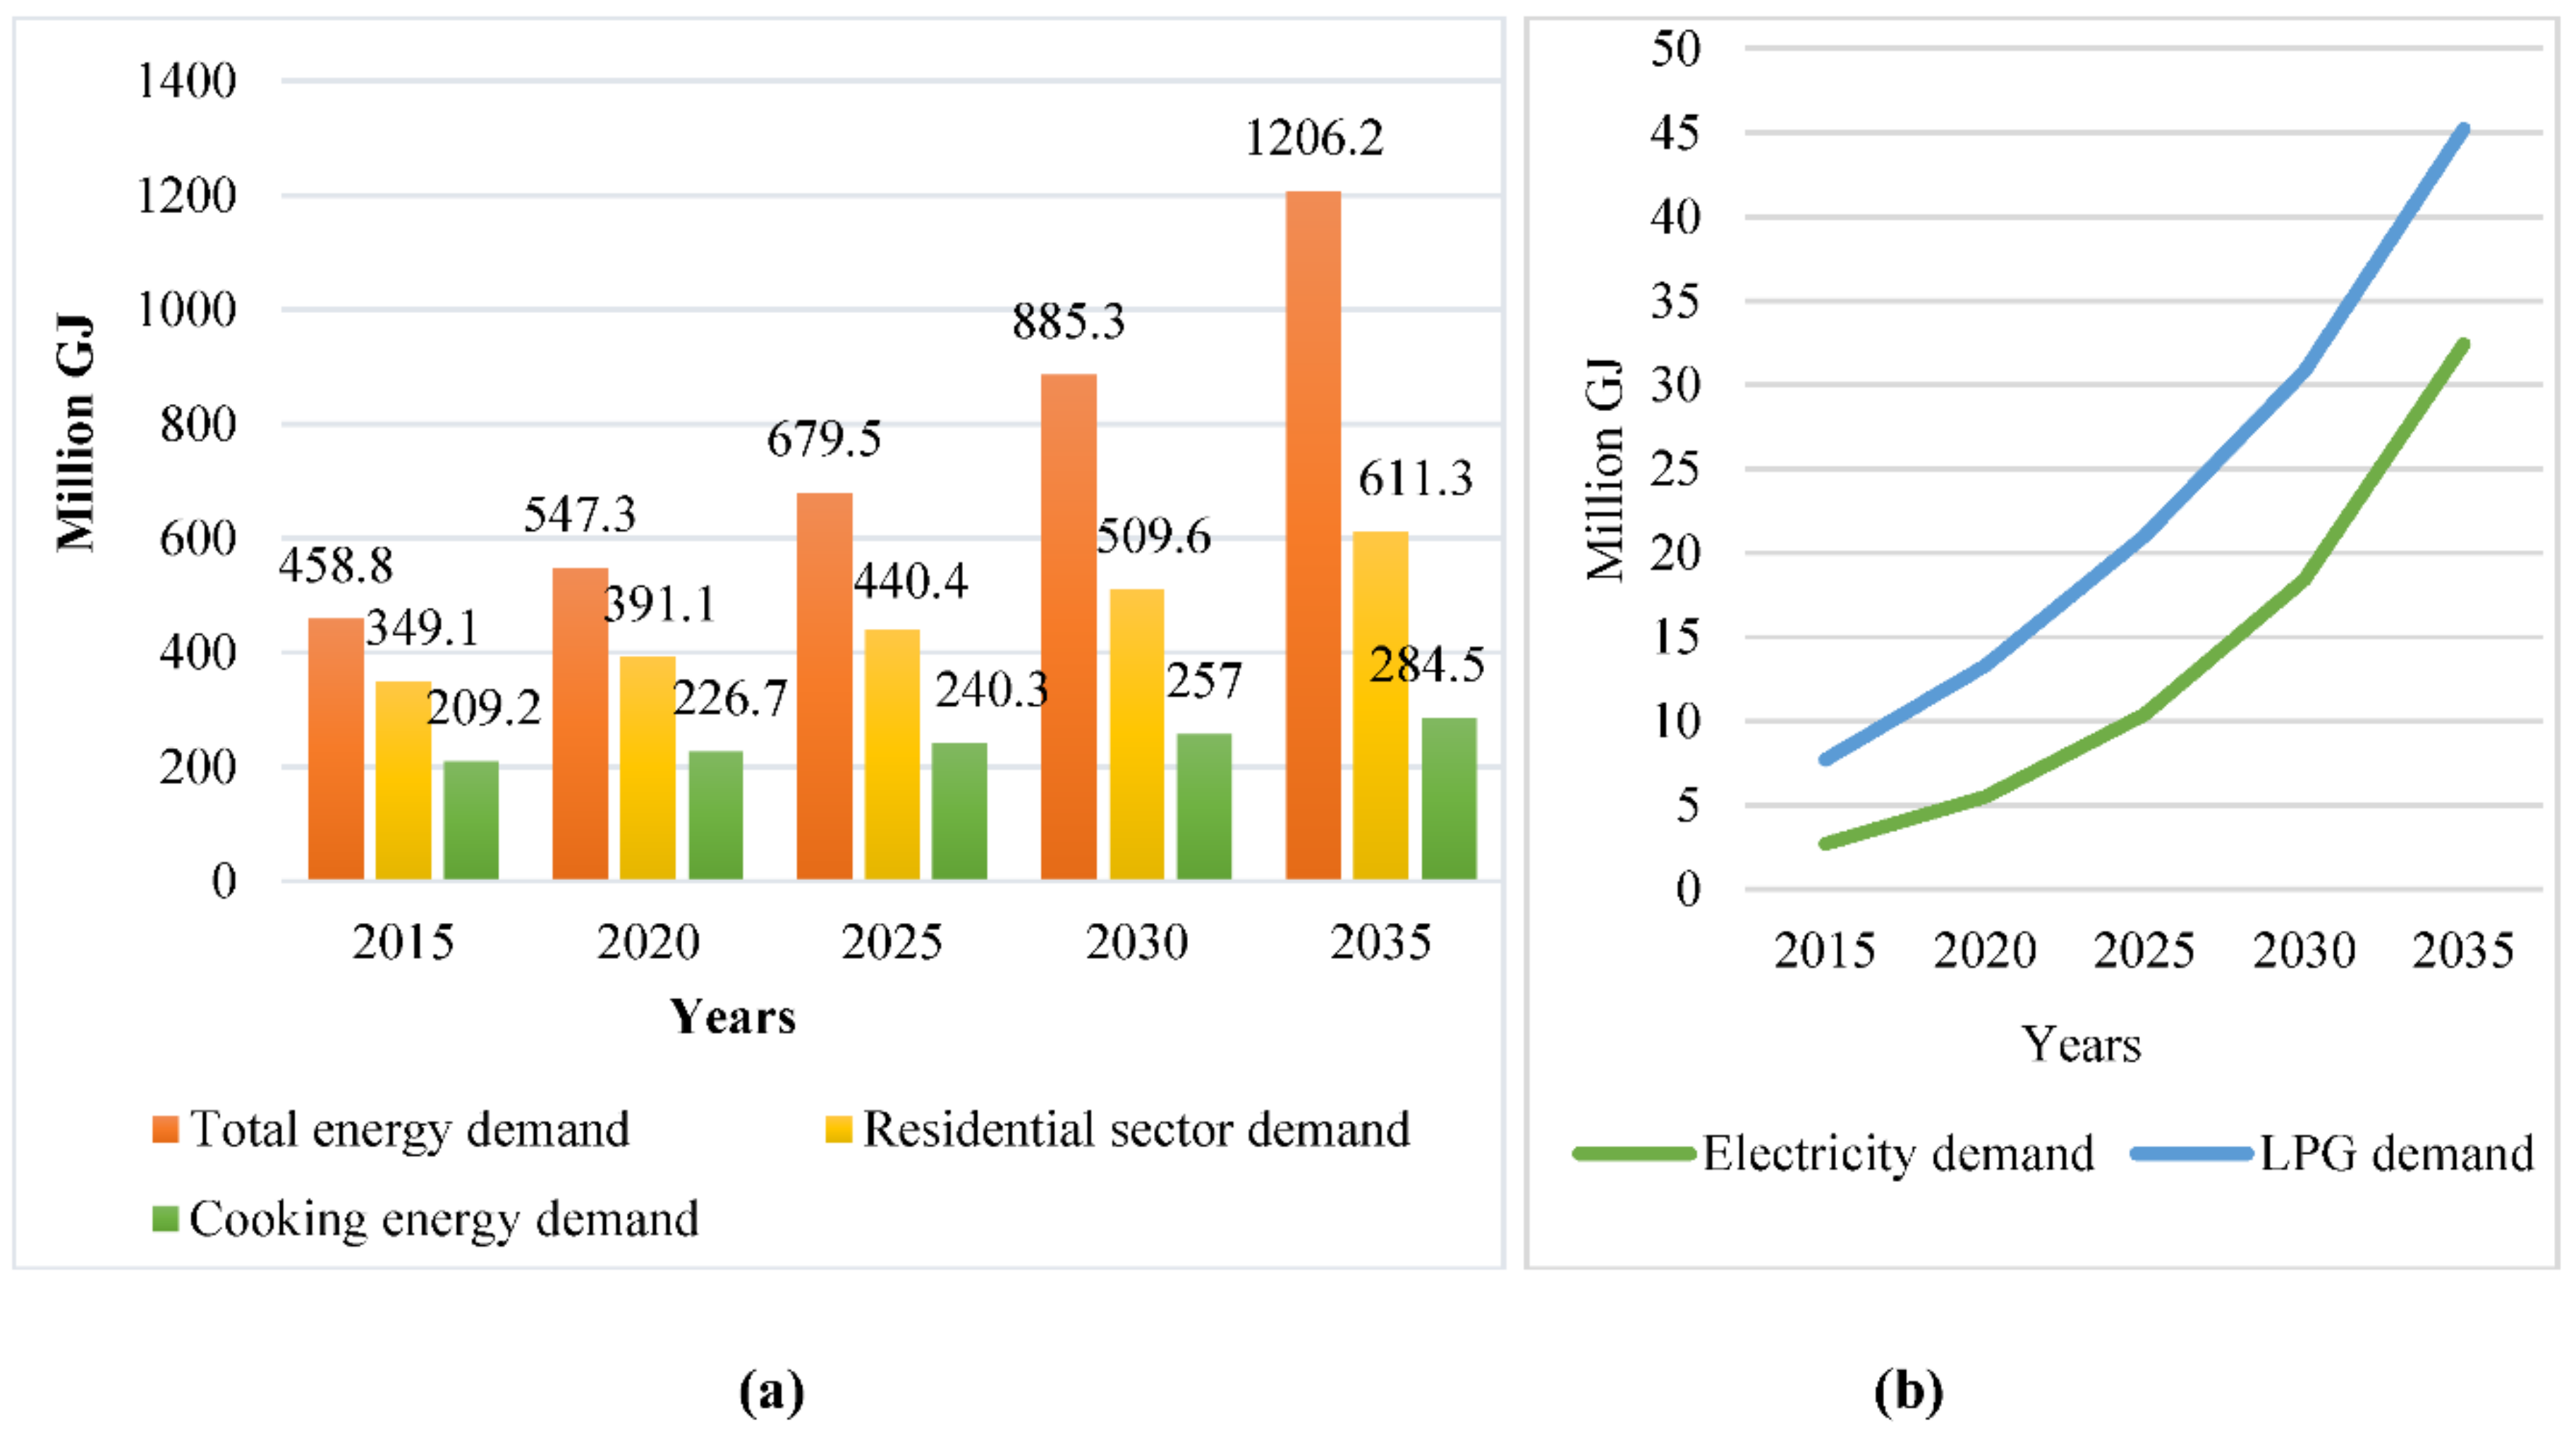
  • Scenario 3: Medium Growth Rate (MGR)
    This is the average economic development condition between low growth and high growth rates, assuming a national GDP growth rate of 6.5%. In this scenario, some parameters are nearly equal with the BAU scenario, assuming that the social and economic sector will boom, on average. In this case, it is more likely that many people of urban areas will shift from traditional biomass fuels to modern cooking fuels. Thus, this scenario is characterized by the increase of modern cooking fuels, accounting more than 30% of total energy demand by the end year, decreasing the dependency on traditional biomass fuels.
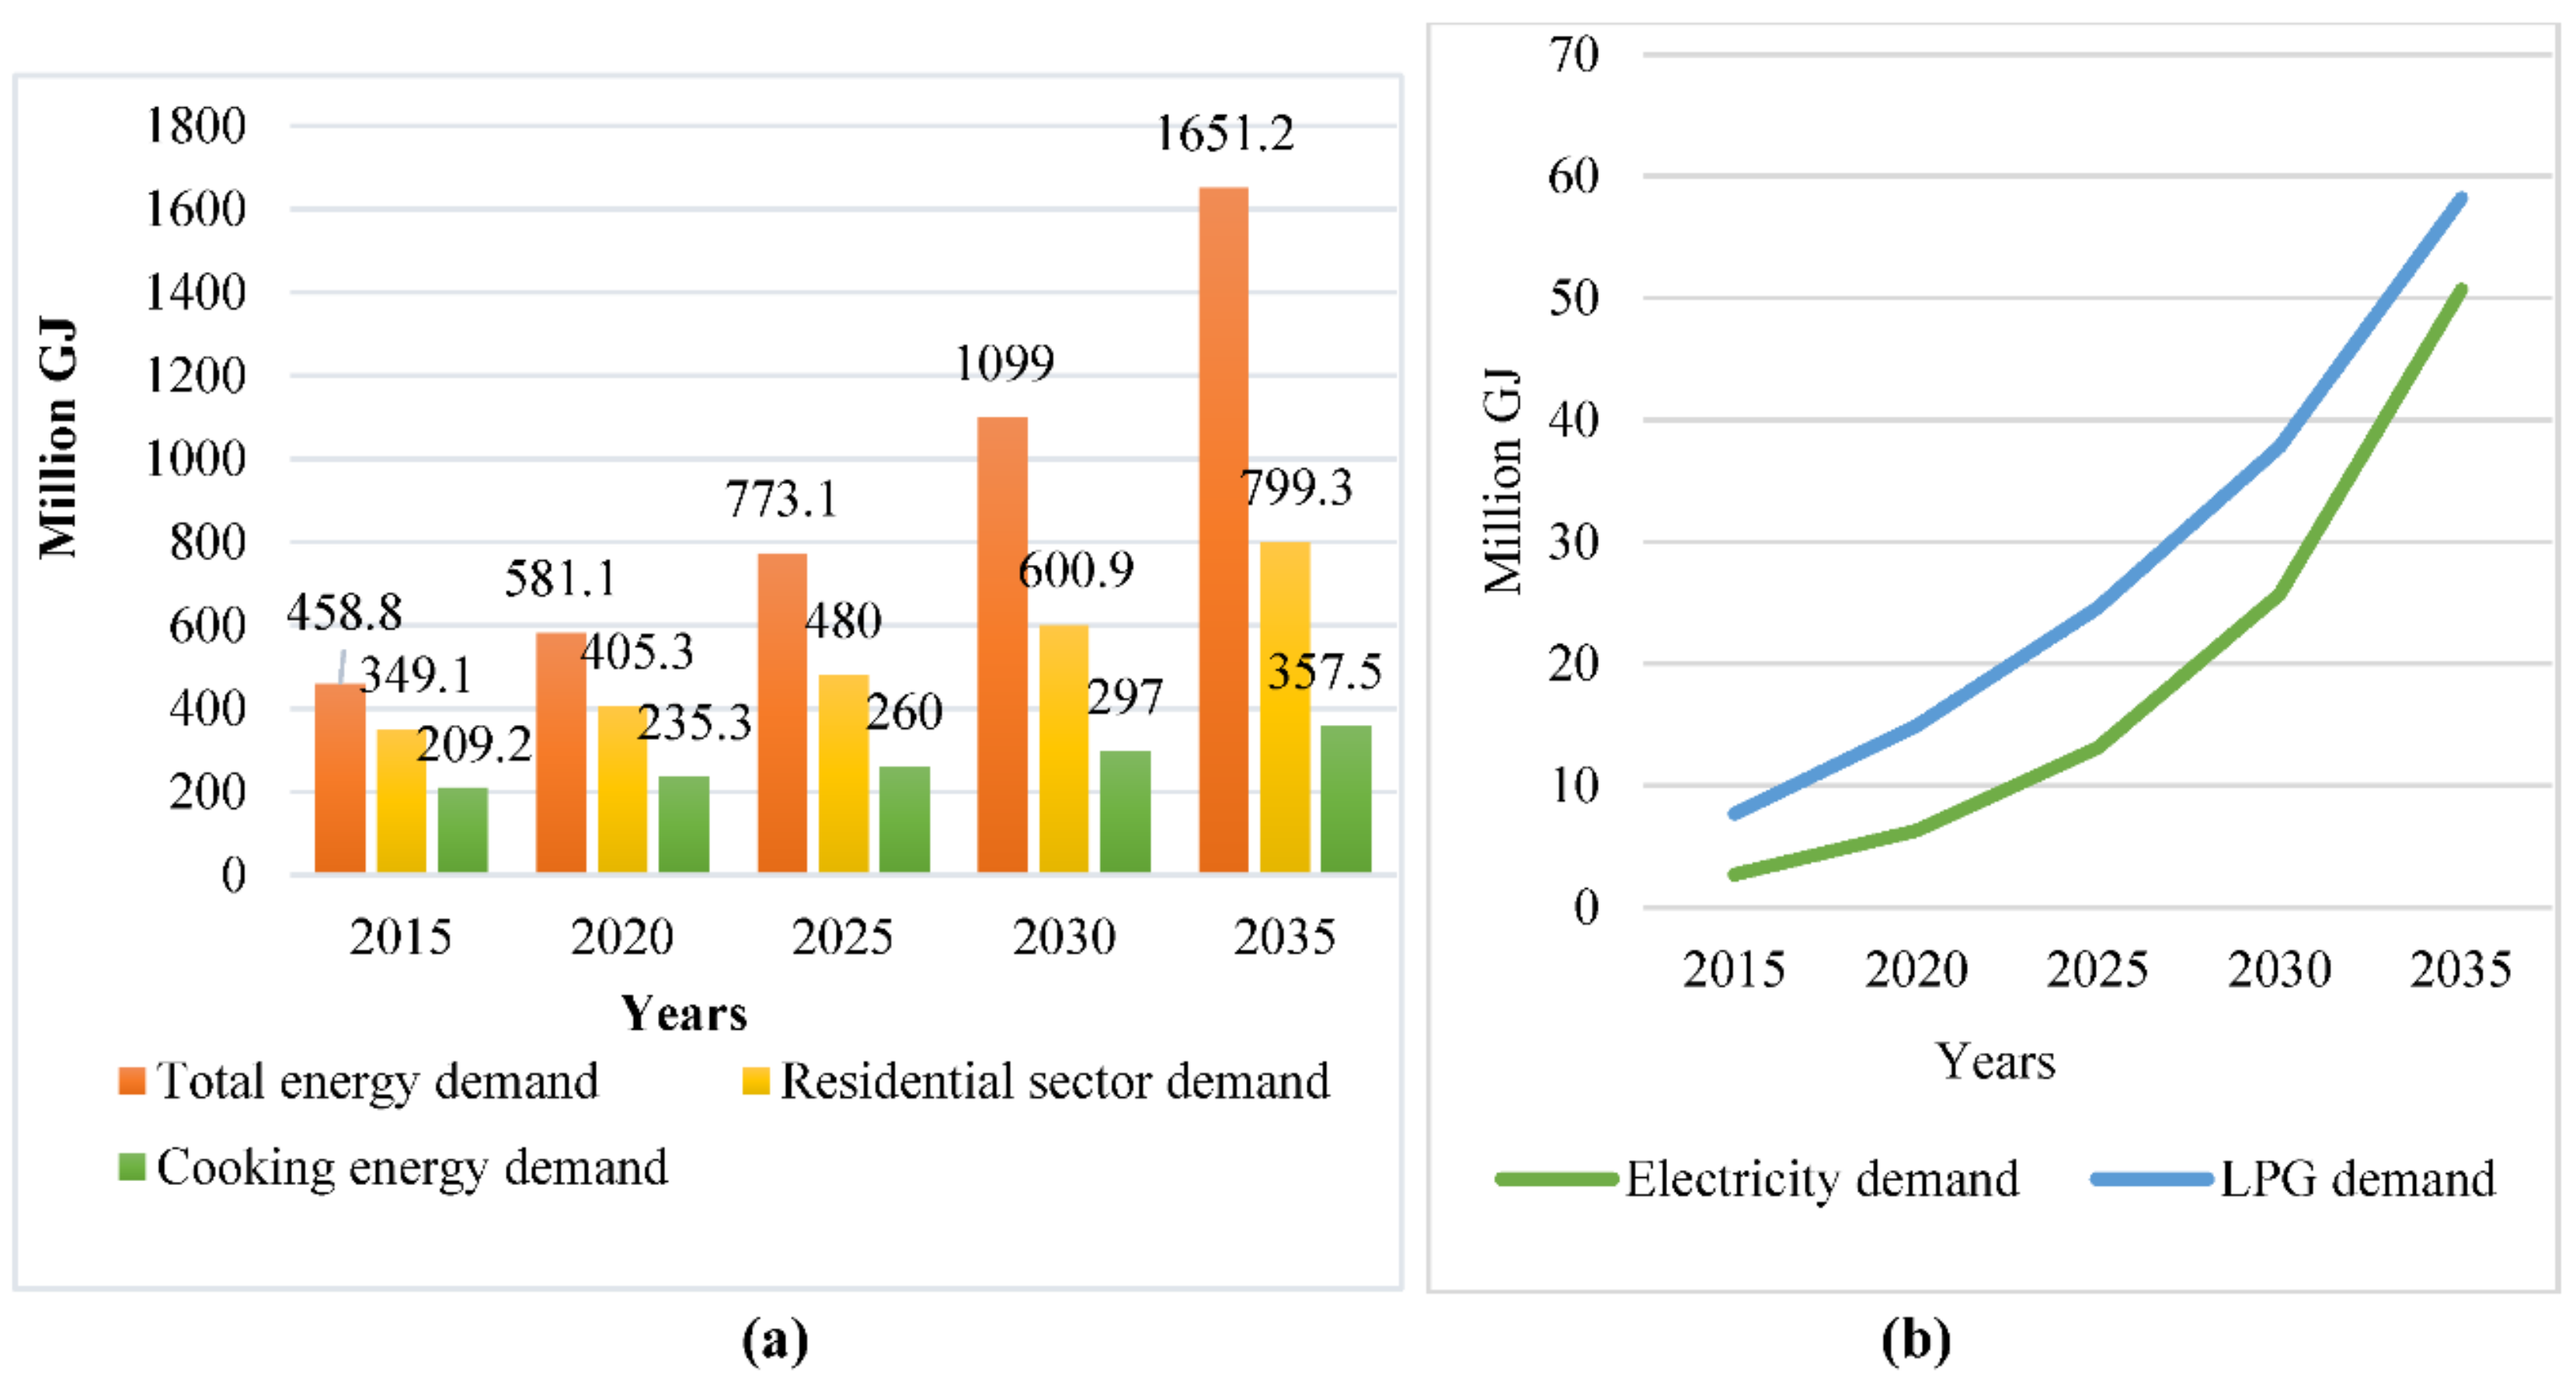
  • Scenario 4: High Growth Rate (HGR)
    This is the most optimistic scenario, having a GDP growth rate of 9%. When national GDP is very high, all major economic sectors will boom, with stable social, political and economic development. In this scenario, all sectors’ growth rates will be high, as well as cooking energy demand. Similar to the MGR scenario, it is assumed that modern cooking fuel (LPG and electricity) demand is set to grow over the outlook period, reducing the share of traditional fuels to below 60%. The purpose of this scenario is to boost the national economy and to enhance energy demand in the residential sector.

4. Results and Discussion

As shown in Figure 3a, out of 350 million GJ energy consumed by the residential sector in the base year, 209 million GJ was used for cooking alone. Figure 3b presents the types of fuel use for cooking, where traditional biomass such as fuel wood, animal dung and agricultural residues dominate, while the demand for modern fuels such as kerosene, LPG and electricity is continuously increasing.

4.1. Scenario Analysis

In this section, scenarios were analyzed using the LEAP model based on the historical data set, and the current trends of energy demand in residential sector with the assumed national GDP growth rate. The results obtained from the LEAP model for national energy demand, residential sectors and cooking sectors along with fuel type consumption— especially focusing on LPG and electricity—in four different scenarios are presented here (Figure 4, Figure 5, Figure 6 and Figure 7).
In the BAU scenario, the energy and economy sectors are assumed to follow historical trends. With economic growth of 5%, the final year energy demand of the country is projected to reach 926.6 million GJ, which is double the base year demand. Over the projection period, national energy demand is expected to grow at an Annual Average Growth Rate (AAGR) of 4%, resulting in higher energy demand in future. As the total energy demand increases, the cooking energy demand of the residential sector also increases. Final energy demand for cooking activities increases continuously and is estimated to have a demand of 243.1 million GJ. The consumption trend analysis in cooking activities by fuel types shows that traditional energy sources such as fuelwood, agricultural and animal wastes contribute the highest share, at 74%, while the share of modern energy fuels such as kerosene, LPG, electricity and biogas remain 26% in 2035, increasing its overall share of consumption by 17.5% over a 20-year period. Additionally, the demand for LPG and electricity for cooking increases at average annual growth rates of 6% and 10%, respectively. Figure 4b shows the demand trends of LPG and electricity in the BAU scenario where both modern cooking fuel demands increase over the outlook period.
The LGR scenario is the pessimistic scenario, having an economic growth of only 4%. However, energy demand in the residential sector, as well as in cooking sector, is higher than the BAU scenario as shown in Figure 5. One of the reasons for increased cooking energy demand in LGR scenario is due to continued dependency on inefficient traditional biomass. From 2015 to 2030, the demand trends of LPG and electricity grow smoothly with increasing population and urbanization growth. However, after 2030, electricity demand rapidly increases at an average growth rate of 7%, while LPG demand increases by only 2.5%, resulting in a decrease in the gap between them.
In the MGR scenario, total energy demand will increase, with an AAGR of 5% from 2015 to 2035. From the Figure 6, the total energy demand in 2035 is projected to be 1206.2 million GJ, reflecting an increase of 748.6 million GJ over the outlook period of 20 years. The residential sector energy demand will increase, with an AAGR of 3%, reaching nearly double the base year demand of 349.1 million GJ. The demand for electricity and LPG will increase, with annual growth rates of 13% and 9%, respectively, and will reach 32.4 and 45.2 million GJ, respectively. In this scenario, consumption of traditional fuels is reduced to 65%, a decrease of 22% compared to base year fuel consumption type.
From the HGR scenario analysis shown in Figure 7, national, residential and cooking energy demand are projected to increase by average annual rates of 6.5%, 4.25% and 2.7%, reaching 1651.2, 799.3 and 357.5 million GJ, respectively. As shown in Figure 7a, the total energy demand of Nepal increases by 3.6 times by the final year 2035 compared to the base year demand, in which cooking activities account to 22%, whereby modern cooking energy fuels are estimated to increase by 11% for LPG and 16% for electricity. Thus, modern cooking energy demand increases in parallel over the outlook period, decreasing the share of traditional fuels by nearly 30% in the end year with respect to the base year percentage share, whereby modern fuels account for 42.5%.
In all scenarios, energy demand in the residential sector is highest among major economic sectors. Traditional biomass (especially fuel wood) is still the predominant cooking fuel of the residential sector over the study period. With socio-economic development, the demand of electricity, as well as LPG, is projected to increase quickly during the period. Also, the growth ratio of energy demand compared to the base year value for the cooking sector in all scenarios will rise by 1.2, 1.3, 1.4 and 1.7 times for BAU, LGR, MGR and HGR, respectively.

4.2. Peak Power Requirement

Figure 8 shows the final electricity requirements in five-year intervals under all the assumed scenarios between 2015 and 2035. It can be seen that the total electricity demand in the residential sector is 26.5 TWh, 24.5 TWh, 52.7 TWh, 84.6 TWh, respectively, in 2035 without substituting LPG for BAU, LGR, MGR and HGR scenarios. Of the total residential electricity demand, lighting and electric appliances consume the highest share, followed by the cooking sector. To fulfil the growing electricity demand, hydropower is one of the best options. A significant amount of hydroelectricity can be produced in future if government action plans and policies run smoothly.
Figure 4b, Figure 5b, Figure 6b and Figure 7b shows the LPG and electricity demand under different scenarios. According to the projection, LPG demand in the final year will be 3.5, 2.1, 6 and 7.5 times higher than the base year demand for BAU, LGR, MGR and HGR scenarios, respectively. It can be said that only the minimum amount of electricity is consumed in the base year for cooking compared to LPG, indicating higher demand and thereby higher costs for petroleum products.
Figure 9a shows the electricity requirement for cooking without LPG switching under different growth rate scenarios. From the LEAP model, it is projected that the electricity demand will increase annually by 9.6%, 9.1%, 13.6% and 16.2%, meaning there will be a need for additional power plant capacity (with a 70% capacity factor) of 718 MW, 669 MW, 1468 MW and 2300 MW for BAU, LGR, MGR and HGR scenarios, respectively. Combined with LPG and electricity in the cooking sector, the total energy requirement is shown in Figure 9b. To substitute the growing LPG demand by 2035, assuming 70% capacity factor, an additional 1207 MW, 734 MW, 2055 MW and 2626 MW power plant capacity is required for BAU, LGR, MGR and HGR scenarios, respectively.

4.3. Environmental Analysis

This study classified the main cooking fuels in Nepalese households as shown in Table 1, where traditional biomass plays an important role. Although government energy policy and programs insist on the diversification of cooking fuel towards clean energy sources, the level of diversification in the residential sector is still at the initial level.
Energy consumption in the residential sector is increasing more rapidly than in any other sector. Among which, the cooking sector accounts for more than 45% of the total energy demand of the residential sector in all scenarios by 2035. The increase in cooking energy demand is a clear indication of large amount of GHG emissions if traditional biomass and petroleum products continue to dominate the sector. Different cooking fuels emit different amounts of CO2 equivalents. Although the Intergovernmental Panel on Climate Change (IPCC) does not consider LPG to be a major greenhouse gas emitter, LPG is a mixture of hydrocarbon-based gases produced from natural gas processing and crude oil refining. Based on the LEAP model analysis, considering the built-in emission factor of different fuel types taken from IPCC report [49], total GHG emissions from cooking fuel sources in the base and final years are shown in Table 4. In 2035, the demand for LPG in the cooking sector will have grown enormously, resulting in higher GHG emissions than for any other fuel types.
Today’s clean cooking fuels are essential for combating the high level of emissions. Even though LPG is an alternative option to firewood, kerosene, plants and animal residue, it emits greenhouse gases to the environment. Thus, one of the best mitigation options to reduce GHG emissions in the cooking sector is the replacement of LPG fuel with hydroelectricity, which could save 97, 60, 166 and 214 thousand tons of CO2 equivalent emission annually in BAU, LGR, MGR and HGR scenarios, respectively.

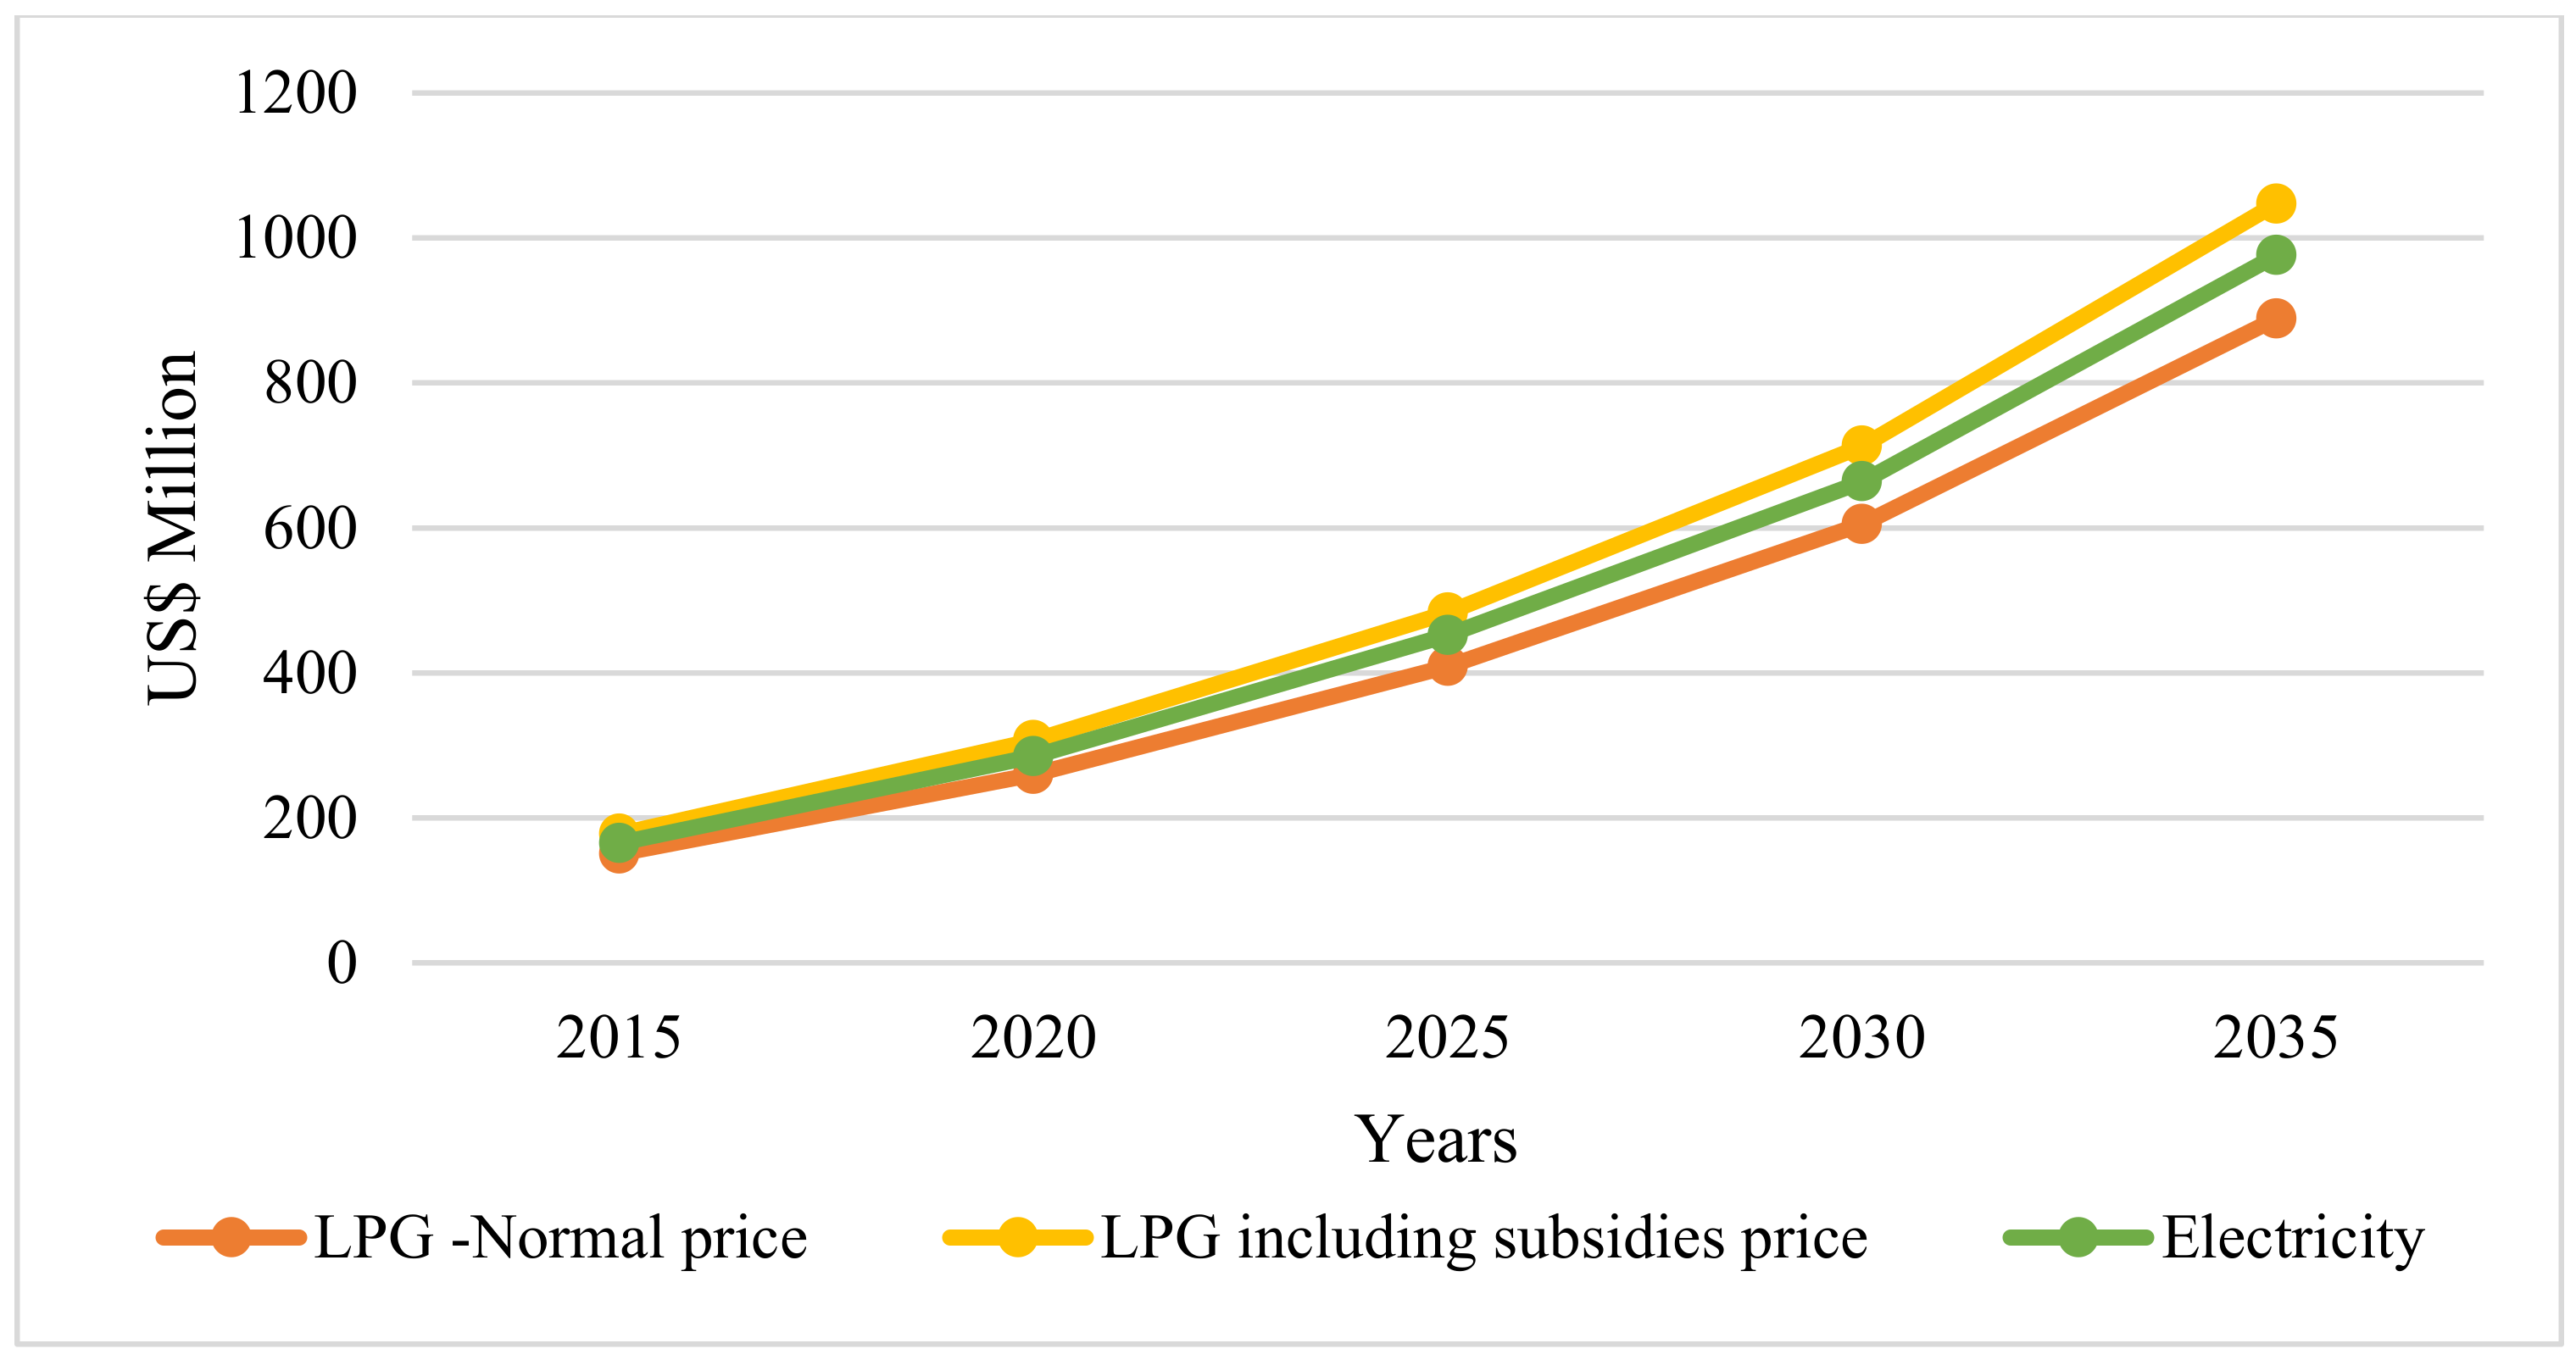
4.4. Economic Analysis

Economic feasibility plays a vital role when it comes to a choice between different cooking fuel options [50]. In this work, economic calculation of LPG and electricity cooking was performed by taking the average monthly cost of cooking for a household of 5 members [51], along with the electricity tariff rate [45] and current LPG price in the country [52]. Assuming a constant kWh price of electricity and LPG cylinders (14.2 kg), and a government subsidy of US$2.5 per cylinder throughout the outlook period, the annual cost of energy for the medium growth scenario in the residential sector is shown in Figure 10.
Results show that government is spending $27.2 million for LPG subsidies only in the base year, and this will increase to $158.3 million in 2035 due to the growth in LPG demand for cooking. In the base year, the total cost of LPG without accounting for subsidies is $150.5 million, whereas when considering the subsidy of $2.5 per cylinder, it is $177.7 million. Similarly, with an average electricity tariff (per kWh) of $0.08, it will cost $165 million. Consequently, in the final year 2035, it will cost $1046.8 million, and government needs to provide $158.3 million for subsidies alone. When replacing LPG with electricity, it would cost $976 million. By 2035, substituting LPG with electricity could save up to $70.8 million annually.

5. Conclusions

This paper projected the energy demand of the residential cooking sector in Nepal from 2015 to 2035 under four different scenarios with the objective of petroleum fuel switching towards clean, affordable and adequately available hydropower resources. The household cooking energy pattern would still be dominated by traditional biomass energy sources. With the growth of the economic sector, urbanization ratio and the living standards of people, demand of modern fuels such as LPG, kerosene and electricity is increasing, and the analysis shows that the demand of both LPG and electricity would increase significantly throughout the outlook period. Even though government energy policy and programs insist on the diversification of cooking fuels towards sustainable clean energy resources, the level of diversification in the residential sector is still not satisfactory. As seen in Table 4, GHG emissions from LPG would increase from 2.1 to 7.5 times the base year emission rate, if current trends of LPG demand continue. Government subsidies for LPG have historically been used to endorse switching to modern fuel from traditional energy sources. However, price subsides are not long-term solutions to promote modern fuels because of their high fiscal costs to the government.
From the analysis it could be seen that the total power requirement to fulfill growing electricity demand for cooking by 2035 is 718 MW, 669 MW, 1468 MW and 2300 MW for BAU, LGR, MGR, HGR scenarios, respectively. To substitute LPG with electricity, an additional 1207 MW, 734 MW, 2055 MW and 2626 MW power is required. Through economic analysis on the MGR scenario, if LPG demand is substituted by electricity, then the country could save $21.8 million (2016) to $70.8 million (2035) each year, which could be used to develop large-scale hydropower projects in the long term, as the total installation cost for large-scale hydropower projects normally lies in the range of $1000/kW to $3500/kW [53]. Considering the low hydropower installation costs, it requires a minimum of $2055 million to replace LPG with 2055 MW hydropower by 2035. In the long term, fuel switching with hydropower is the most flexible option due to country’s huge hydropower potential and lower power generation costs, which will help cut out LPG subsidies and reduce both the economic trade deficit as well as the energy import dependency on India.
Although substituting LPG with hydroelectricity in the residential sector is unrealistic as of today due to lacking generation capacity, it is easily possible in the future with the installation of additional hydropower capacity. Development of some large-scale hydropower has already been started by the government with the declaration of an ‘energy emergency’ and establishing new energy legislation. In this case, our recommendation to substitute LPG with hydroelectricity could come true, and it would help to utilize the country’s abundant water resources, and reduce environmental and health impacts along with economic sustainability and energy security of the country.

Author Contributions

R.B. proposed the concept and research design. S.P. collected most of the data. Simulation in LEAP was done jointly. Same is true for the writing part. Overall contribution is allocated as 50% each.

Funding

This research received no external funding.

Conflicts of Interest

The authors declare no conflict of interest.

References

  1. Water and Energy Commission Secretariat (WECS). Electricity Demand Forecast Report (2015–2040); Government of Nepal: Kathmandu, Nepal, 2017.
  2. World Bank. World Development Indicator. Available online: http://data.worldbank.org/indicator/EG.USE.ELEC.KH.PC?locations=DZ (accessed on 5 March 2017).
  3. Water and Energy Commission Secretariat (WECS). Energy Data Sheet; Government of Nepal: Kathmandu, Nepal, 2014.
  4. Central Bureau of Statistics (CBS). Annual Household Survey Report 2014–2015; Government of Nepal: Kathmandu, Nepal, 2016.
  5. Ministry of Finance (MoF). Economic Survey—Fiscal Year 2015/2016; Government of Nepal: Kathmandu, Nepal, 2016. [Google Scholar]
  6. Nepal Oil Corporation (NOC). Import and Sales. Available online: http://nepaloil.com.np/import-and-sales-22.html (accessed on 17 April 2017).
  7. Jewell, J. The IEA Model of Short-Term Energy Security (MOSES); International Energy Agency Paris: Paris, France, 2011; Available online: www.iea.org (accessed on 15 July 2017).
  8. Spotlight. Indian Increases LPG Supply to Nepal. Available online: http://www.spotlightnepal.com/News/Article/Nepal-India-provides-additional-LPG (accessed on 3 April 2015).
  9. Ministry of Finance. Economic Survey—Fiscal Year 2014/2015; Government of Nepal: Kathmandu, Nepal, 2015.
  10. Surendra, K.C.; Khanal, S.K.; Shrestha, P.; Lamsal, B. Current status of renewable energy in Nepal: Opportunities and challenges. Renew. Sustain. Energy Rev. 2011, 15, 4107–4117. [Google Scholar] [CrossRef]
  11. Pradhan, B.B.; Limmeechokchai, B. Electric and Biogas Stoves as Options for Cooking in Nepal and Thailand. Energy Procedia 2017, 138, 470–475. [Google Scholar] [CrossRef]
  12. Bruce, N.; Perez-Padilla, R.; Albalak, R. Indoor air pollution in developing countries: A major environmental and public health challenge. Bull. World Health Organ. 2000, 78, 1078–1092. [Google Scholar] [PubMed]
  13. Holdren, J.P.; Smith, K.R.; Kjellstrom, T.; Streets, D.; Wang, X.; Fischer, S. Energy, the Environment and Health; United Nations Development Programme: New York, NY, USA, 2000. [Google Scholar]
  14. Duflo, E.; Greenstone, M.; Hanna, R. Indoor air pollution, health and economic well-being. Surv. Perspect. Integr. Environ. Soc. 2008, 1, 1–9. [Google Scholar] [CrossRef]
  15. Jain, A.; Choudhary, P.; Ganesan, K. Clean, Affordable and Sustainable Cooking Energy for India-Possibilities and Realities beyond LPG; Council for Energy Environment and Water (CEEW): New Delhi, India, 2015. [Google Scholar]
  16. Lewis, J.J.; Pattanayak, S.K. Who adopts improved fuels and cookstoves? A systematic review. Environ. Health Perspect. 2012, 120, 637. [Google Scholar] [CrossRef] [PubMed]
  17. Andadari, R.K.; Mulder, P.; Rietveld, P. Energy poverty reduction by fuel switching. Impact evaluation of the LPG conversion program in Indonesia. Energy Policy 2014, 66, 436–449. [Google Scholar] [CrossRef]
  18. Tembo, S.T.; Mulenga, B.P.; Sitko, N.J. Cooking Fuel Choice in Urban Zambia: Implications on Forest Cover; Michigan State University, Department of Agricultural, Food, and Resource Economics: East Lansing, MI, USA, 2015. [Google Scholar]
  19. Yan, H.J. The Theoretical and Empirical Analysis on the Compatibility of Sustainable Development Strategies and Poverty Reduction Policies at Micro Level; University Aix-Marseille II: Aix-en-Provence, France, 2010. [Google Scholar]
  20. Bhattari, N. National Energy Demand Projections and Analysis of Nepal; Technical University of Vienna: Vienna, Austria, 2015. [Google Scholar]
  21. An, L.; Lupi, F.; Liu, J.; Linderman, M.A.; Huang, J. Modeling the choice to switch from fuelwood to electricity: Implications for giant panda habitat conservation. Ecol. Econ. 2002, 42, 445–457. [Google Scholar] [CrossRef]
  22. Baquié, S.; Urpelainen, J. Access to modern fuels and satisfaction with cooking arrangements: Survey evidence from rural India. Energy Sustain. Dev. 2017, 38, 34–47. [Google Scholar] [CrossRef]
  23. Bisu, D.Y.; Kuhe, A.; Iortyer, H.A. Urban household cooking energy choice: An example of Bauchi metropolis, Nigeria. Energy Sustain. Soc. 2016, 6, 15. [Google Scholar] [CrossRef]
  24. Heltberg, R. Fuel switching: Evidence from eight developing countries. Energy Econ. 2004, 26, 869–887. [Google Scholar] [CrossRef]
  25. Wickramasinghe, A. Energy access and transition to cleaner cooking fuels and technologies in Sri Lanka: Issues and policy limitations. Energy Policy 2011, 39, 7567–7574. [Google Scholar] [CrossRef]
  26. Gebreegziabher, Z.; Mekonnen, A.; Kassie, M.; Köhlin, G. Urban energy transition and technology adoption: The case of Tigrai, northern Ethiopia. Energy Econ. 2012, 34, 410–418. [Google Scholar] [CrossRef]
  27. Bhattacharyya, S.C.; Timilsina, G.R. Modelling energy demand of developing countries: Are the specific features adequately captured? Energy Policy 2010, 38, 1979–1990. [Google Scholar] [CrossRef]
  28. Laha, P.; Chakraborty, B. Energy model—A tool for preventing energy dysfunction. Renew. Sustain. Energy Rev. 2017, 73, 95–114. [Google Scholar] [CrossRef]
  29. Ouedraogo, N.S. Modeling sustainable long-term electricity supply-demand in Africa. Appl. Energy 2017, 190, 1047–1067. [Google Scholar] [CrossRef]
  30. Water and Energy Commission Secretariat. Energy Demand Projection 2030: A MAED Based Approach; Government of Nepal: Kathmandu, Nepal, 2016.
  31. Water and Energy Commission Secretariat. Nepal’s Energy Sector Vision 2050 A.D; Government of Nepal: Kathmandu, Nepal, 2013.
  32. Pokharel, S. An econometric analysis of energy consumption in Nepal. Energy Policy 2007, 35, 350–361. [Google Scholar] [CrossRef]
  33. Parajuli, R.; Østergaard, P.A.; Dalgaard, T.; Pokharel, G.R. Energy consumption projection of Nepal: An econometric approach. Renew. Energy 2014, 63, 432–444. [Google Scholar] [CrossRef]
  34. Santos, P.J.; Martins, A.G.; Pires, A.J. Designing the input vector to ANN-based models for short-term load forecast in electricity distribution systems. Int. J. Electr. Power Energy Syst. 2007, 29, 338–347. [Google Scholar] [CrossRef] [Green Version]
  35. Heaps, C.G. Long-Range Energy Alternatives Planning (LEAP) System. Available online: https://www.energycommunity.org (accessed on 25 May 2017).
  36. Park, N.-B.; Lee, S.; Han, J.-Y.; Jeon, E.C. Feasibility Analysis of Alternative Electricity Systems by 2030 in the Post-Fukushima Era. Asian J. Atmos. Environ. 2014, 8, 59–68. [Google Scholar] [CrossRef] [Green Version]
  37. Huang, Y.; Bor, Y.J.; Peng, C.-Y. The long-term forecast of Taiwan’s energy supply and demand: LEAP model application. Energy Policy 2011, 39, 6790–6803. [Google Scholar] [CrossRef]
  38. Park, N.-B.; Yun, S.-J.; Jeon, E.-C. An analysis of long-term scenarios for the transition to renewable energy in the Korean electricity sector. Energy Policy 2013, 52, 288–296. [Google Scholar] [CrossRef]
  39. Perwez, U.; Sohail, A.; Hassan, S.F.; Zia, U. The long-term forecast of Pakistan’s electricity supply and demand: An application of long range energy alternatives planning. Energy 2015, 93 Pt 2, 2423–2435. [Google Scholar] [CrossRef]
  40. Nojedehi, P.; Heidari, M.; Ataei, A.; Nedaei, M.; Kurdestani, E. Environmental assessment of energy production from landfill gas plants by using Long-range Energy Alternative Planning (LEAP) and IPCC methane estimation methods: A case study of Tehran. Sustain. Energy Technol. Assess. 2016, 16, 33–42. [Google Scholar] [CrossRef]
  41. Kemausuor, F.; Nygaard, I.; Mackenzie, G. Prospects for bioenergy use in Ghana using Long-range Energy Alternatives Planning model. Energy 2015, 93 Pt 1, 672–682. [Google Scholar] [CrossRef] [Green Version]
  42. Dagher, L.; Ruble, I. Modeling Lebanon’s electricity sector: Alternative scenarios and their implications. Energy 2011, 36, 4315–4326. [Google Scholar] [CrossRef]
  43. Central Bureau of Statistics. National Population and Housing Census 2011 (Population Projection 2011–2031); Government of Nepal: Kathmandu, Nepal, 2014; Volume 8, p. 22.
  44. Ministry of Finance. Economy Survey for Fiscal Year 2015/16; Government of Nepal: Kathmandu, Nepal, 2016.
  45. Nepal Electricity Authority (NEA). Annual Report; Nepal Electricity Authority: Kathmandu, Nepal, 2015. [Google Scholar]
  46. Alternative Energy Promotion Centre (AEPC). Annual progress Review of AEPC 2012–2013; Ministry of Science, Technology and Environment: Lalitpur, Nepal, 2014.
  47. World Bank. DataBank: Nepal. Available online: http://data.worldbank.org/country/nepal (accessed on 11 March 2017).
  48. Ghanadan, R.; Koomey, J.G. Using energy scenarios to explore alternative energy pathways in California. Energy Policy 2005, 33, 1117–1142. [Google Scholar] [CrossRef]
  49. Stocker, T.F.; Qin, D.; Plattner, G.-K.; Tignor, M.; Allen, S.K.; Boschung, J.; Nauels, A.; Xia, Y.; Bex, V.; Midgley, P.M. Climate chAnge 2013: The Physical Science Basis; Intergovernmental Panel on Climate Change, Working Group I Contribution to the IPCC Fifth Assessment Report (AR5); Cambridge University Press: New York, NY, USA, 2013. [Google Scholar]
  50. Jain, A.; Choudhury, P. Clean, Affordable and Sustainable Cooking Energy for India—Possibilities and Realities beyound LPG; Council on Energy, Environment and Water: New Delhi, India, 2015; Available online: http://ceew.in/pdf/ceew-clean-affordable-and-sustainable-cooking.pdf (accessed on 10 July 2017).
  51. Nakarmi, A.M. Current Energy Consumption trends & future energy scenarios of Nepal & Energy Emergency why. In IPPAN Seminar; Independent Power Producer’s Association: Kathmandu, Nepal, 2016. [Google Scholar]
  52. Nepal Oil Cooperation (NOC). Fortnightly Profit and Loss. Available online: http://www.nepaloil.com.np/uploads/pdf/16thJuly2017.pdf (accessed on 13 June 2017).
  53. IRENA. Renewable Energy Technologies: Cost Analysis Series; International Renewable Energy Agency: Bonn, Germany, 2012; Available online: https://www.irena.org/documentdownloads/publications/re_technologies_cost_analysis-hydropower.pdf (accessed on 4 August 2017).
Figure 1. Historical trend of LPG consumption [5,6].
Sustainability 10 02841 g001
Figure 2. Schematic framework of LEAP model implemented in this research.
Sustainability 10 02841 g002
Figure 3. Energy demand. (a) By sub-sectors; (b) By fuel types.
Sustainability 10 02841 g003
Figure 4. BAU scenario. (a) Energy demand; (b) Cooking fuel demand.
Sustainability 10 02841 g004
Figure 5. LGR scenario. (a) Energy demand; (b) Cooking fuel demand.
Sustainability 10 02841 g005
Figure 6. MGR scenario. (a) Energy demand; (b) Cooking fuel demand.
Sustainability 10 02841 g006
Figure 7. HGR scenario. (a) Energy demand; (b) Cooking fuel demand.
Sustainability 10 02841 g007
Figure 8. Total electricity requirement.
Sustainability 10 02841 g008
Figure 9. Electricity requirement. (a) Without fuel switching; (b) With fuel switching.
Sustainability 10 02841 g009
Figure 10. Costs of cooking energy in medium growth scenario.
Sustainability 10 02841 g010
Table 1. Energy consumption in the residential sector (in thousand GJ) [3].
Fuel TypesCookingHeatingCoolingLightingWater BoilingWater PumpingElectricity ApplianceOther UsesTotal
Firewood143,709.840,594.3--37,955--30,903.2253,162
Agri-residue13,225.7-------13,226
Animal waste16,671.31893-----547.619,112
Other biomass77.1177.3-----84.7339
Biogas4178--150.1----4328
Bio briquette0.533.3--1.9---36
Grid electricity878.5174.2609.41159.3326.5363.61114.9197.44824
Decentralized electricity---231.4-1.458.21.8293
Solar---0.9----1
LPG5120.9---566.6--13.55701
Kerosene456.8--575.674.5--43.51150
Other Petroleum---199.2---12.4212
Other battery---1.3--0.4-2
Total184,31942,872609231838,925365117431,804302,385
Table 2. Distribution of cooking fuel in households [4].
Urban/RuralFirewood (%)Cow Dung (%)Agriculture Residue (%)LPG (%)Kerosene (%)Bio-Gas (%)Other (%)Total (%)
Urban33.04.40.758.50.22.80.4100
Rural72.511.43.39.40.03.20.2100
Nepal59.39.02.425.80.13.10.2100
Table 3. Overview of different fuel choices (authors’ compilation).
ReferencesCountryFuel ChoiceStudy PeriodMethodologyPurpose Remarks
[17]IndonesiaKerosene

LPG
2009–2010Household survey across urban, suburban and rural regionsTo evaluate the impact of government program to substitute kerosene to LPGMainly high-income households in sub-urban areas will be benefited
[21]China Fuel wood

Electricity
1999Household interview and Random Utility Model (RUM)To protect the loss of giant panda habitat due to human activities to collect firewoodEnergy policies with proper electricity tariffs are required for reducing dependency on firewood and saving panda habitat
[22]IndiaTraditional fuels
(biomass)

Modern fuels
(LPG)
X Survey on 8568 households across six Indian statesTo analyze the household’s satisfaction with their cooking fuel types Cost, safety and accessibility are the major concerns changing behavior towards modern fuels
[23]Nigeria Traditional fuels

Modern fuels
(LPG, electricity and solar energy)
2014/15Two-step random sampling method, Descriptive statistics, Regression analysis and SPSSTo identify the factors affecting the cooking energy choices in urban householdChange in household size, dwelling ownership status, change of season, income level, education, energy availability and affordability are the major factors
[24]Brazil Ghana Guatemala India Nepal Nicaragua South AfricaVietnamTraditional fuels

Modern fuels
1995–2000Energy ladder model Regression and Multinomial analysisTo analyze the household fuel use and fuel switching in 8 developing countriesElectrification, urbanization and education can promote fuel switching behavior
[18]ZambiaTraditional fuels

Modern fuels
2010Econometric Model/Energy Ladder ModelTo analyze the various cooking fuel choices in urban householdsIncome, education and age of the household are important factors in determining the fuel choices
[25]Sri LankaTraditional fuels

Modern clean fuels
2006–2007Questionnaire Survey To understand the human dimension of energy access and technologiesLack of modern energy technologies, financial support and risk, as well as lack of motivation and pressure, hinders the fuel switching
[19]ChinaFuel choices
(wood, coal, LPG and electricity)
2004 and 2006Logit-regression model To analyze the links between energy use, environment and poverty considering household energy consumptionChoices of cooking fuel consumption depend upon the prices, availability and its effect on human health
[20]NepalLPG

Electricity
2005–2030LEAPEvaluating the electricity demand through substitution of LPG gas in the residential sector Policy intervention is necessary for substituting LPG by hydroelectric power
[26]Northern Ethiopia Fuel Choice (fuelwood, charcoal, kerosene, electricity)2003Probit Model To investigate the urban energy transition and technology adoption in the residential sectorChoice of a household’s fuel consumption depends on the fuel price, income and education
Table 4. GHG emissions from cooking fuel in different scenarios.
Fuel TypesUnitBase YearEnd Year—2035
2015BAULGRMGRHGR
KeroseneThousand tons of CO2 eq.46.446.139.262.1103.9
LPG561.81947.31194.53319.64272.6
Wood1525.61422.71991.91269.31203.5
Biogas58.5122.6101163.3261.2
Animal Wastes1622.81593.71451.62169.53530
Vegetal Wastes175.6173.4152.6223.4379.2
Other Biomass0.90.80.71.11.7
Total 3991.75306.64931.57208.39752.1

