Optimum Size Selection of CHP Retrofitting in Existing UK Hotel Building


 , and
, and
Abstract
1. Introduction
- Data collection of all essential building information including architectural plans, characteristics of the building envelope, plants/system data and actual building energy use. Inspection of the building is also done to validate collected information.
- Employing the gathered building information to develop a holistic model of the building with the energy simulation software.
- Computation of the total energy use of the building through plant/system modelling of the energy simulation software; subsequent verification of model results via comparison of the model result against the actual energy use of the hotel building.
- Introduction of the CHP into the model to evaluate the possible maximum CHP size based on the hotel’s base heating load with priority to meet Domestic Hot Water (DHW) demand, which is substantial and consistent throughout the year, hence ensuring that all the heat produced by the CHP is utilised.
- Reduction of the estimated maximum size by 10%, 20%, 30%, 40%, 50%, 60% and 70%; subsequently, critical analysis of the CHP performance over these range is employed as a basis of selection of the optimum CHP size.
1.1. Literature Review
2. Methodology
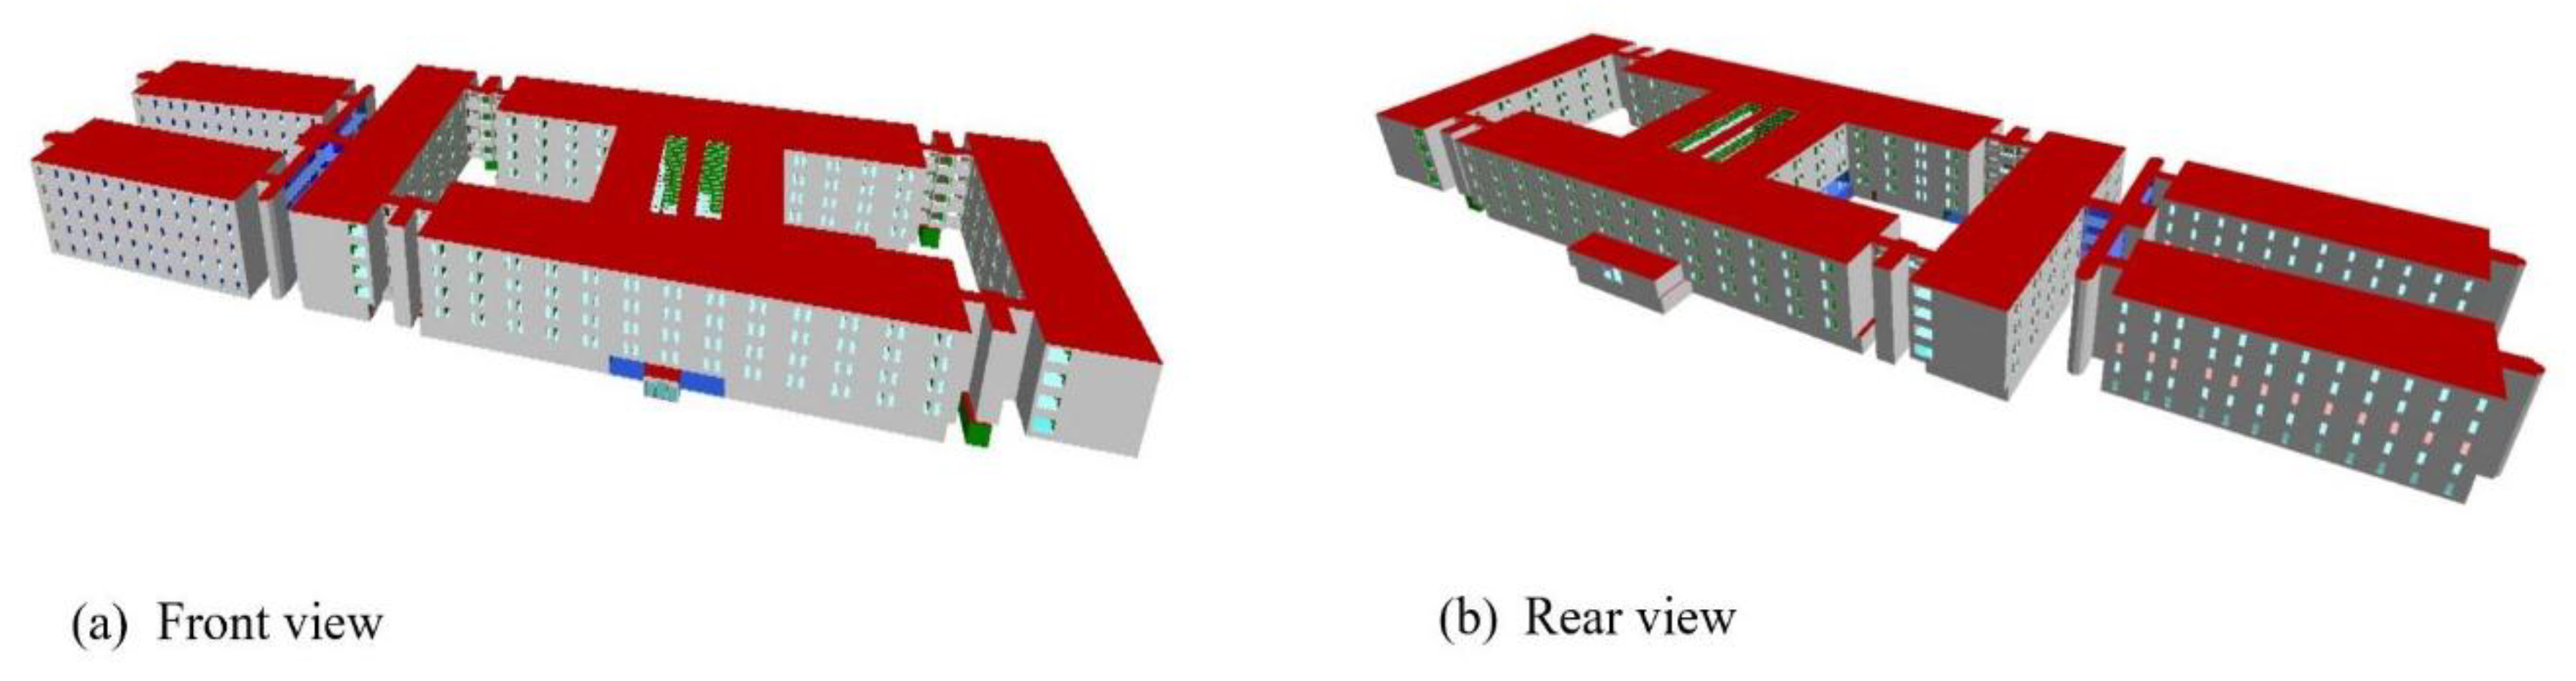
2.1. Building Description
2.2. Building Modelling Process
3. Results and Discussion of Results
3.1. Base Model (without CHP)
3.2. Model with Maximum Capacity of CHP
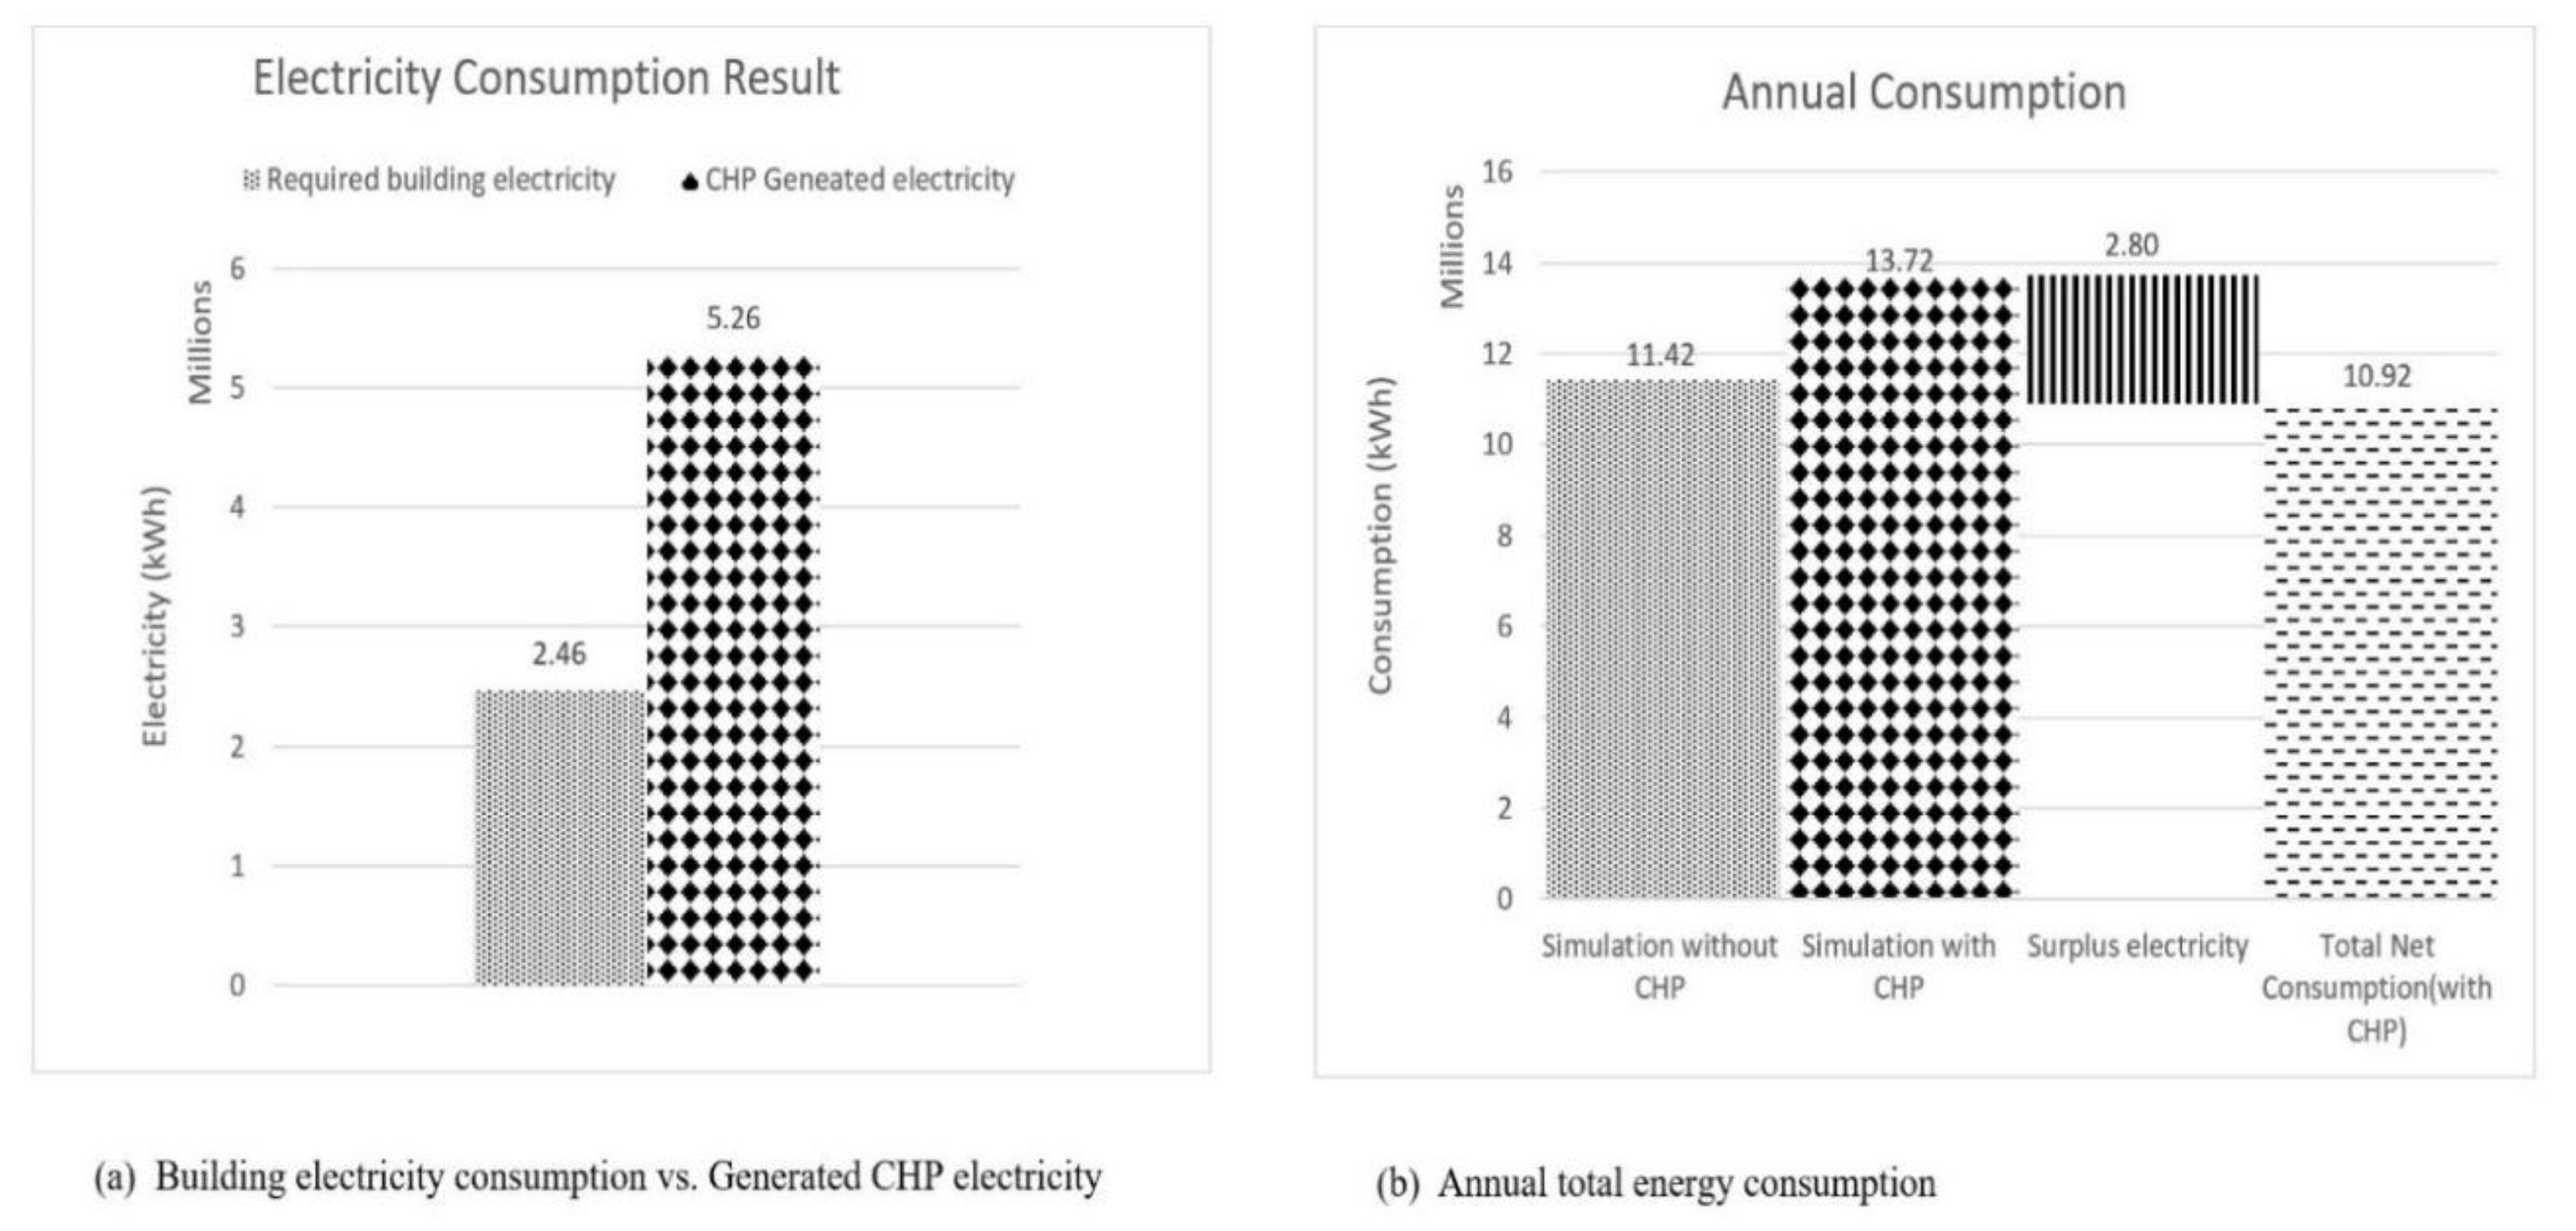
3.3. Model with CHP (307 kWe)
4. Conclusions
Author Contributions
Conflicts of Interest
References
- Babaei, T.; Abdi, H.; Lim, C.P.; Nahavandi, S. A study and a directory of energy consumption data sets of buildings. Energy Build. 2015, 94, 91–99. [Google Scholar] [CrossRef]
- UNEP-SBCI. Sustainable Buildings and Climate Initiative, Building. 2009. Available online: http://www.unep.org/sbci/AboutSBCI/Background.asp (accessed on 23 October 2017).
- Fumo, N. A review on the basics of building energy estimation. Renew. Sustain. Energy Rev. 2014, 31, 53–60. [Google Scholar] [CrossRef]
- Nock, A.; Ojiako, U.; Bektas, T.; Chipulu, M. CHP and its role in efficient energy production: a feasibility assessment model. Manag. Environ. Qual. Int. J. 2012, 23, 546–565. [Google Scholar] [CrossRef]
- Bell, M.; Gault, A.; Thompson, M. Meeting Carbon Budgets: Closing the Policy Gap: 2017 Report to Parliament. 2017. Available online: https://www.theccc.org.uk/wp-content/uploads/2017/06/2017-Report-to-Parliament-Meeting-Carbon-Budgets-Closing-the-policy-gap.pdf (accessed on 23 October 2017).
- International Energy Agency. Combined Heat and Power-Evaluating the Benefits of Greater Global Investment; IEA: Paris, France, 2008; Available online: https://www.iea.org/publications/freepublications/publication/chp_report.pdf (accessed on 9 November 2017).
- Carbon Trust. Introducing Combined Heat and Power; Technology Guide; Carbon Trust: London, UK, 2010; Available online: https://www.carbontrust.com/media/19529/ctv044_introducing_combined_heat_and_power.pdf (accessed on 16 September 2017).
- Romero Rodríguez, L.; Lissen, S.M.J.; Ramos, S.J.; Jara Roriguez, A.E.; Dominguez, A.S. Analysis of the economic feasibility and reduction of a building’s energy consumption and emissions when integrating hybrid solar thermal/PV/micro-CHP systems. Appl. Energy 2016, 165, 828–838. [Google Scholar] [CrossRef]
- Action Energy. Combined Heat and Power for Buildings; Action Energy: Sydney, Australia, 2004; Available online: http://www.cwp-ltd.com/wp-content/uploads/2012/03/UKGoodPracticeGuide.pdf (accessed on 16 September 2017).
- Çakir, U.; Çomakli, K.; Yüksel, F. The role of cogeneration systems in sustainability of energy. Energy Convers. Manag. 2012, 63, 196–202. [Google Scholar] [CrossRef]
- Mago, P.J.; Smith, A.D. Evaluation of the potential emissions reductions from the use of CHP systems in different commercial buildings. Build. Environ. 2012, 53, 74–82. [Google Scholar] [CrossRef]
- Bianchi, M.; De Pascale, A.; Melino, F. Performance analysis of an integrated CHP system with thermal and Electric Energy Storage for residential application. Appl. Energy. 2013, 112, 928–938. [Google Scholar] [CrossRef]
- Smith, A.D.; Mago, P.J.; Fumo, N. Benefits of thermal energy storage option combined with CHP system for different commercial building types. Sustain. Energy Technol. Assess. 2013, 1, 3–12. [Google Scholar] [CrossRef]
- Wang, H.; Yin, W.; Abdollahi, E.; Lahdelma, R.; Jiao, W. Modelling and optimization of CHP based district heating system with renewable energy production and energy storage. Appl. Energy 2015, 159, 401–421. [Google Scholar] [CrossRef]
- Magnani, S.; Pezzola, L.; Danti, P. Design Optimization of a Heat Thermal Storage Coupled with a Micro-CHP for a Residential Case Study. Energy Procedia 2016, 101, 830–837. [Google Scholar] [CrossRef]
- Crawley, D.B.; Hand, J.W.; Kummert, M.; Griffith, B.T. Contrasting the capabilities of building energy performance simulation programs. Build. Environ. 2008, 43, 661–673. [Google Scholar] [CrossRef]
- EDSL. Environmental Design Solutions Limited. 2015. Available online: http://www.edsl.net/main/Software/Designer/NVandPD.aspx (accessed on 10 October 2017).
- Rotimi, A.; Bahadori-Jahromi, A.; Mylona, A.; Godfrey, P.; Cook, D. Impact of cavity extraction fans on thermal and energy performance of existing UK hotel. Proc. Inst. Civ. Eng. Eng. Sustain. 2017. [Google Scholar] [CrossRef]
- Amoako-Attah, J.; B-Jahromi, A. Method comparison analysis of dwellings’ temperatures in the UK. Proc. Inst. Civ. Eng. Eng. Sustain. 2015, 168, 16–27. [Google Scholar] [CrossRef]
- Bahadori-Jahromi, A.; Rotimi, A.; Mylona, A.; Godfrey, P.; Cook, D. Impact of Window Films on the Overall Energy Consumption of Existing UK Hotel Buildings. Sustainability 2017, 9, 731. [Google Scholar] [CrossRef]
- Holmes, M.J.; Hacker, J.N. Climate change, thermal comfort and energy: Meeting the design challenges of the 21st century. Energy Build. 2007, 39, 802–814. [Google Scholar] [CrossRef]
- Department for Business, Energy and Industrial Strategy. UK Government Conversion Factors for Greenhouse Gas (GHG) Reporting. 2017. Available online: https://www.gov.uk/government/publications/greenhouse-gas-reporting-conversion-factors-2017 (accessed on 28 September 2017).
- Office of Gas and Electricity Markets. Feed-In Tariff (FIT) Rates. 2017. Available online: https://www.ofgem.gov.uk/environmental-programmes/fit/fit-tariff-rates (accessed on 1 December 2017).


| Area-Weighted Average U-Values (W/m2 K) | Element | Building Envelope | Building Services Compliance Standard for Non-Domestic Buildings |
|---|---|---|---|
| Average U-Values (W/m2 K) | Wall | 0.56 | 0.35 |
| Floor | 0.67 | 0.25 | |
| Roof | 0.72 | 0.25 | |
| Windows | 3.0 | 2.2 | |
| Doors | 1.30 | 2.2 | |
| High usage entrance door | 2.53 | 3.5 | |
| 0.81 | |||
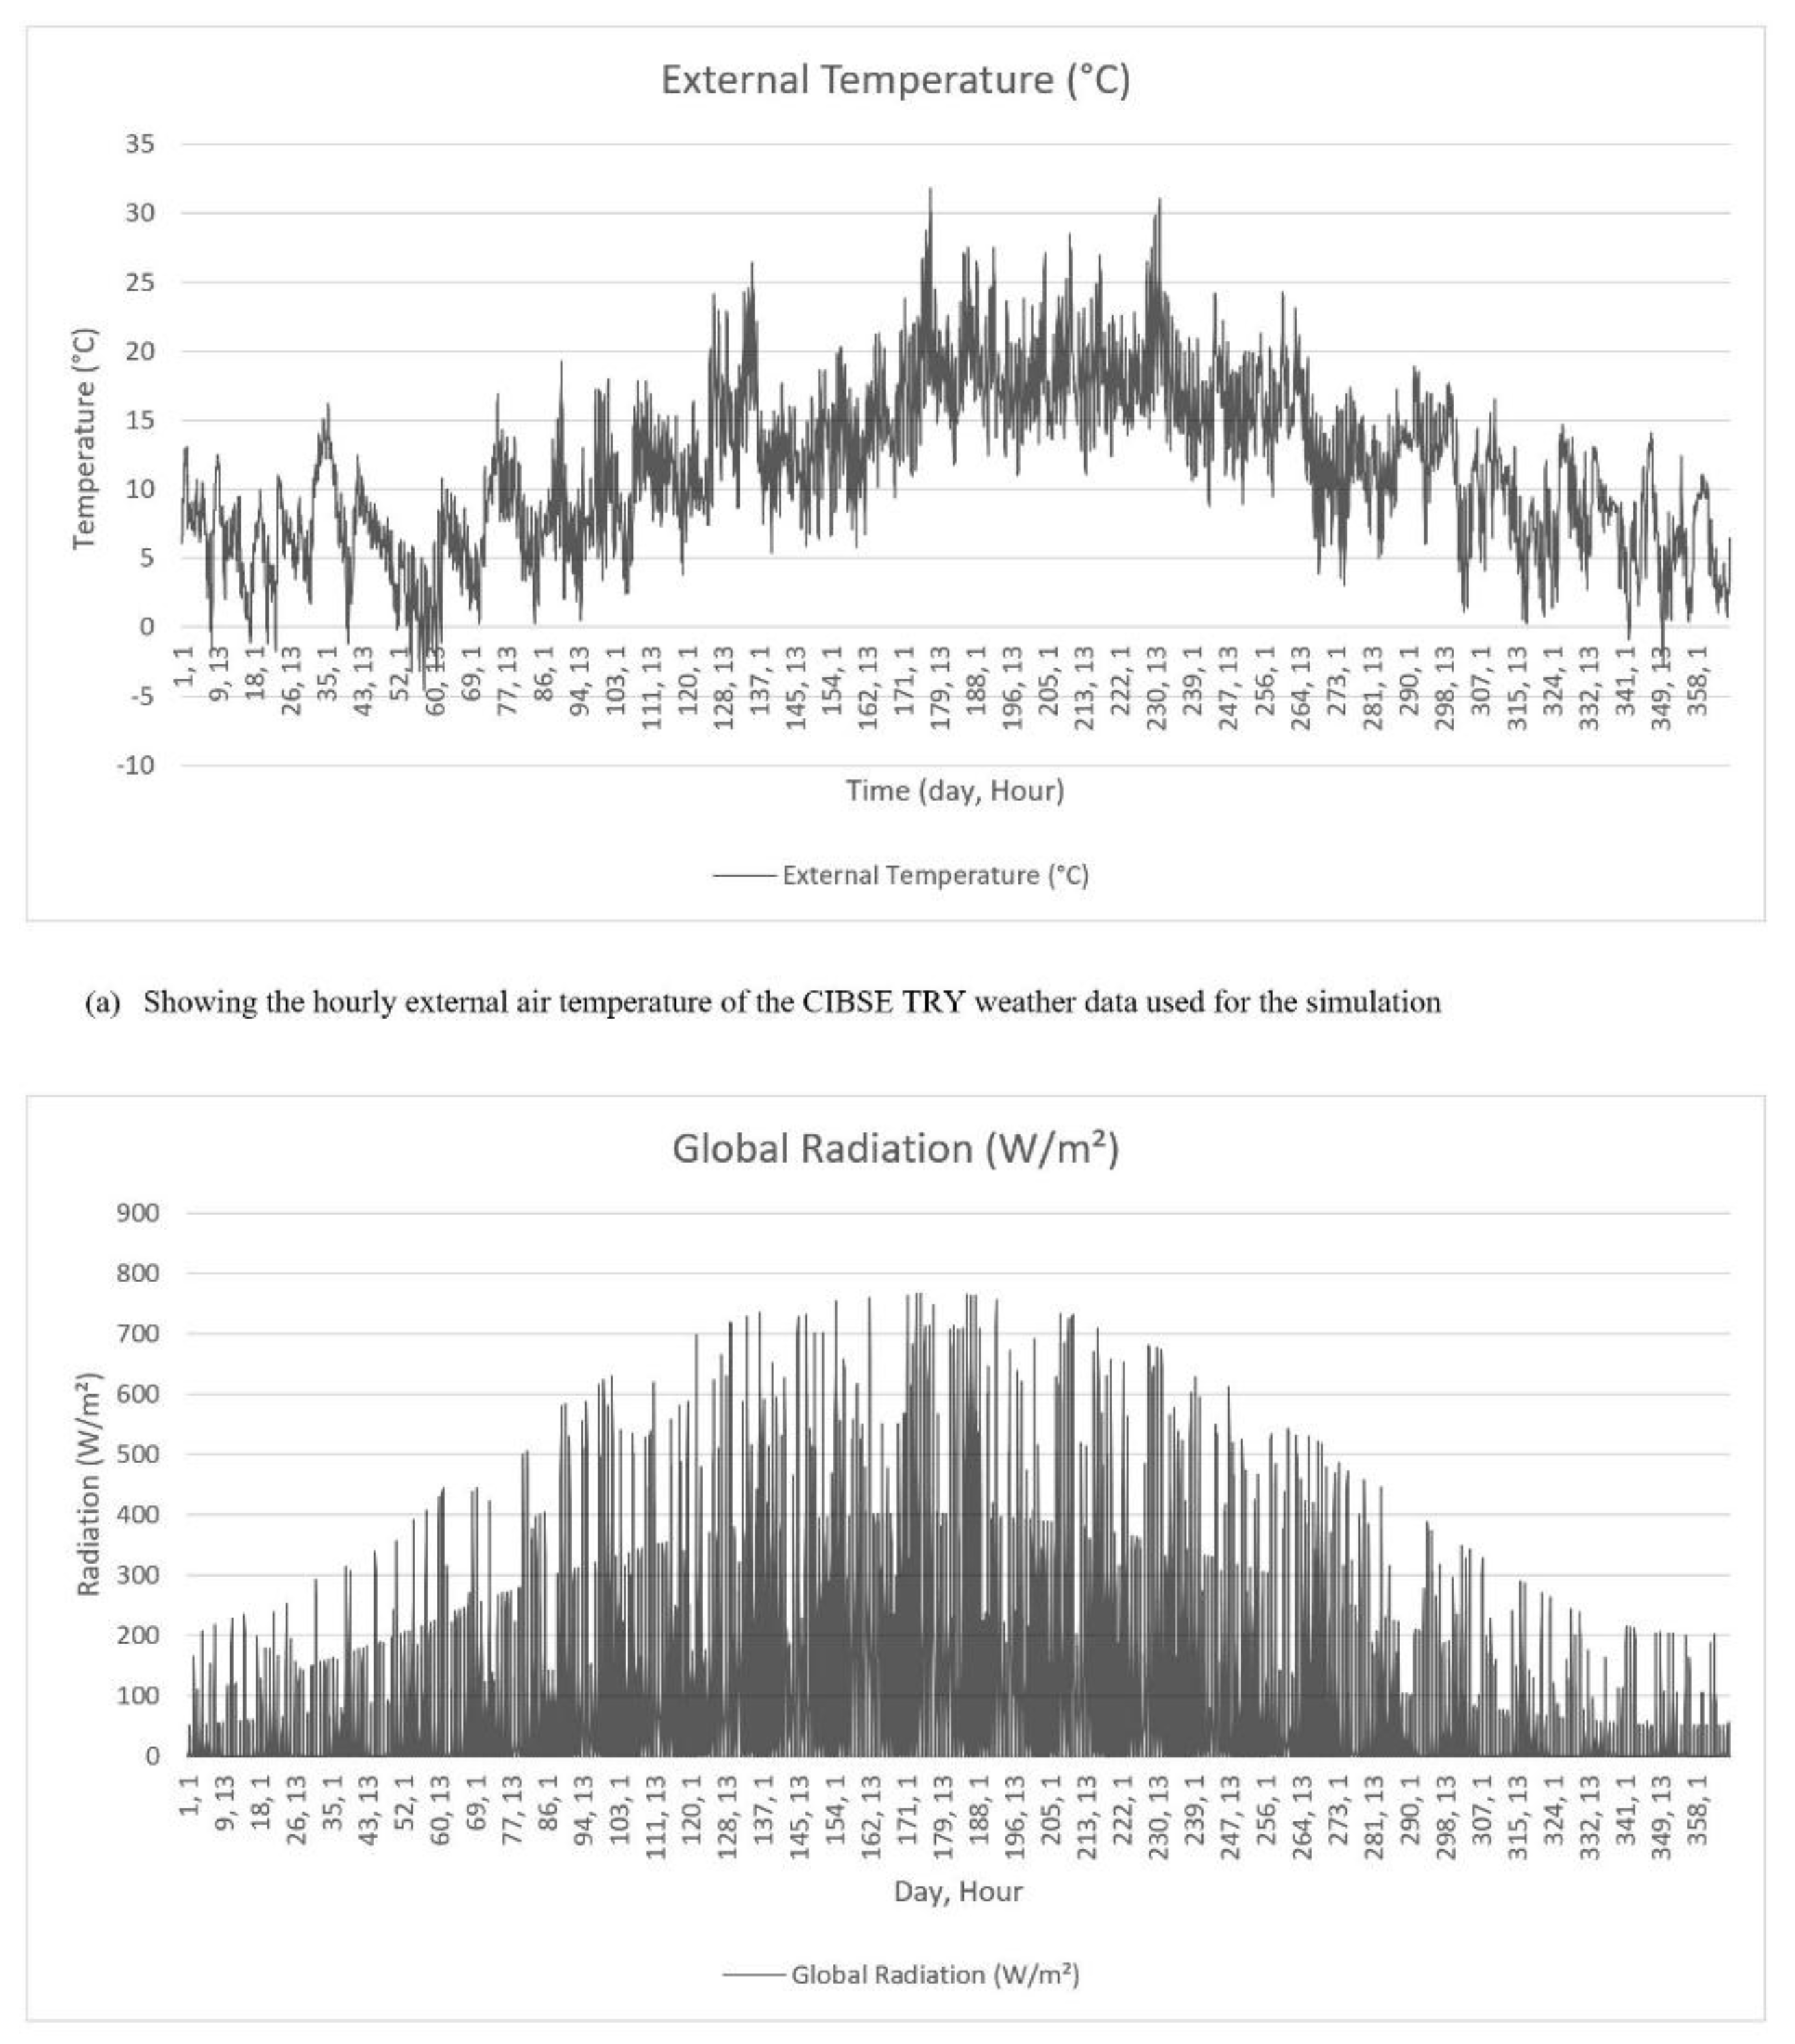
| Weather | London | ||
| Air Permeability | 5 m3/(h·m2) at 50 Pa | ||
| Average Conductance | 35,995 W/K | ||
| Alpha Values | 9.14% | ||
| Construction Data Base | National Calculation Method (NCM) Construction v5.2.tcd | |
|---|---|---|
| Occupancy Levels; People Density; Lux Level | Restaurant | 0.2 occupant/m2, 150 lux |
| Changing room | 0.119 occupant/m2, 100 lux | |
| Circulation area | 0.115 occupant/m2, 100 lux | |
| Bedroom | 0.094 occupant/m2, 100 lux | |
| Gym | 0.140 occupant/m2 150 lux | |
| Food prep/kitchen | 0.108 occupant/m2, 500 lux | |
| Hall | 0.183 occupant/m2, 300 lux | |
| Office | 0.106 occupant/m2, 400 lux | |
| Plant room | 0.11 occupant/m2, 200 lux | |
| Reception | 0.105 occupant/m2, 200 lux | |
| Store | 0.11 occupant/m2, 50 lux | |
| Lavatory | 0.118 occupant/m2, 200 lux | |
| Fuel Source | Natural gas | CO2 factor–0.184 Kg/kWh |
| Fuel Source | Grid electricity | CO2 factor–0.3516 Kg/kWh |
| CHP Model Size (kWe) | Surplus Generated Electricity (%) | Energy Consumption (%) | Energy Utility Cost (%) | CO2 Emissions (%) |
|---|---|---|---|---|
| 750 (Maximum sized CHP) | +53 | +20 | −54 | −39 |
| 307 (Selected CHP size) | +9 | −5 | −42 | −27 |
© 2018 by the authors. Licensee MDPI, Basel, Switzerland. This article is an open access article distributed under the terms and conditions of the Creative Commons Attribution (CC BY) license (http://creativecommons.org/licenses/by/4.0/).
Share and Cite
Rotimi, A.; Bahadori-Jahromi, A.; Mylona, A.; Godfrey, P.; Cook, D. Optimum Size Selection of CHP Retrofitting in Existing UK Hotel Building. Sustainability 2018, 10, 2044. https://doi.org/10.3390/su10062044
Rotimi A, Bahadori-Jahromi A, Mylona A, Godfrey P, Cook D. Optimum Size Selection of CHP Retrofitting in Existing UK Hotel Building. Sustainability. 2018; 10(6):2044. https://doi.org/10.3390/su10062044
Chicago/Turabian StyleRotimi, Abdulazeez, Ali Bahadori-Jahromi, Anastasia Mylona, Paulina Godfrey, and Darren Cook. 2018. "Optimum Size Selection of CHP Retrofitting in Existing UK Hotel Building" Sustainability 10, no. 6: 2044. https://doi.org/10.3390/su10062044
APA StyleRotimi, A., Bahadori-Jahromi, A., Mylona, A., Godfrey, P., & Cook, D. (2018). Optimum Size Selection of CHP Retrofitting in Existing UK Hotel Building. Sustainability, 10(6), 2044. https://doi.org/10.3390/su10062044