1. Introduction
Concerns on environmental issues have triggered environmental sustainability practices among business organisations. In Malaysia, environmental issues include pollutions from use of fertilizers, pesticides, and herbicides, and gaseous emissions of industrial processes. Air pollution is contributed largely by emission of motor vehicles and opens burning of industrial waste, mainly by wood-based and rubber-based factories. Water pollution results from the spoliation of land caused by activities such as tin mining and deforestation, and from domestic wastes [
1].
Malaysian government has been seriously emphasising environmental preservation through various initiatives such as promoting and financing high impact research on green technologies by the Ministry of Energy, Green Technology, and Water (KeTTHA) in 2009 [
2]. Sustainability has always been promoted by Bursa Malaysia as a key to success in business today. For this aim, the Malaysian government and Bursa Malaysia have mandated all public listed companies (PLCs) produce a sustainability report, called the corporate social responsibility (CSR) report, to reflect sustainability practices [
3]. Environmental or green practices require conducting activities in ways that could enrich the environment rather than harm it [
4]. Past studies indicated that green initiatives enable the intended green strategies to be successfully executed towards facilitating a better organisational performance [
5]. Organisations that adopted green initiatives by adjusting their activities consequently improved their organisational performance [
6].
Therefore, the aim of this study was to examine the extent of green initiative adoption in Malaysian PLCs and its impact on environmental performance. This needs to be examined empirically in the Malaysian context for the sustainability agenda to be realized.
4. Methodology
4.1. Research Design
The population frame was the list of public companies quoted on Bursa Malaysia and the unit of analysis was at the organisational level. PLCs in Malaysia have been mandated to produce CSR reports since 2007, which suggests a high possibility that these companies have adopted some green initiatives. This study was a cross-sectional research using questionnaire survey with the selection of respondents inclusive of organisational top management such as chief executive officer, managing director, financial controller, and senior manager. Data were collected using questionnaire survey distributed to all PLCs on Bursa Malaysia in May 2015. A structured questionnaire was developed and used for data collection. The questionnaire items were adapted from previous relevant and related literature. However, some alterations were made to fit the present study’s objectives. Data were entered into Statistical Package for the Social Science (SPSS) as a preparation before further analysing the data using partial least square-structural equation modelling (PLS-SEM). PLS-SEM according to [
29] was used to check the reliability and validity of items and constructs, correlation values, multiple regression analysis, and the significance of the hypothesised relationships. PLS-SEM is a kind of SEM that is used to test a series of hypothesized models due to its ability to simultaneously test more complex path models involving a larger number of variables. There are two types of SEM, namely Covariance-Based SEM (CB-SEM) and Variance-Based SEM (PLS-SEM), whereby CB-SEM is used to confirm (or reject) theories and PLS-SEM is primarily used to develop theories. PLS-SEM is used when sample sizes are small, and the data are not necessarily normal. In situations where theory is less developed, researchers should consider the use of PLS-SEM as an alternative approach to CB-SEM. This is particularly true if the primary objective of applying structural modelling is prediction and explanation of target constructs. PLS-SEM can also handle a single item in the structural model. Hence, PLS-SEM is relevant for this study. To provide further insight into the findings of the questionnaire survey, in-depth interviews were conducted with selected respondents. The purpose of the interviews was to complement and support the quantitative findings [
30].
4.2. Measurement of Constructs
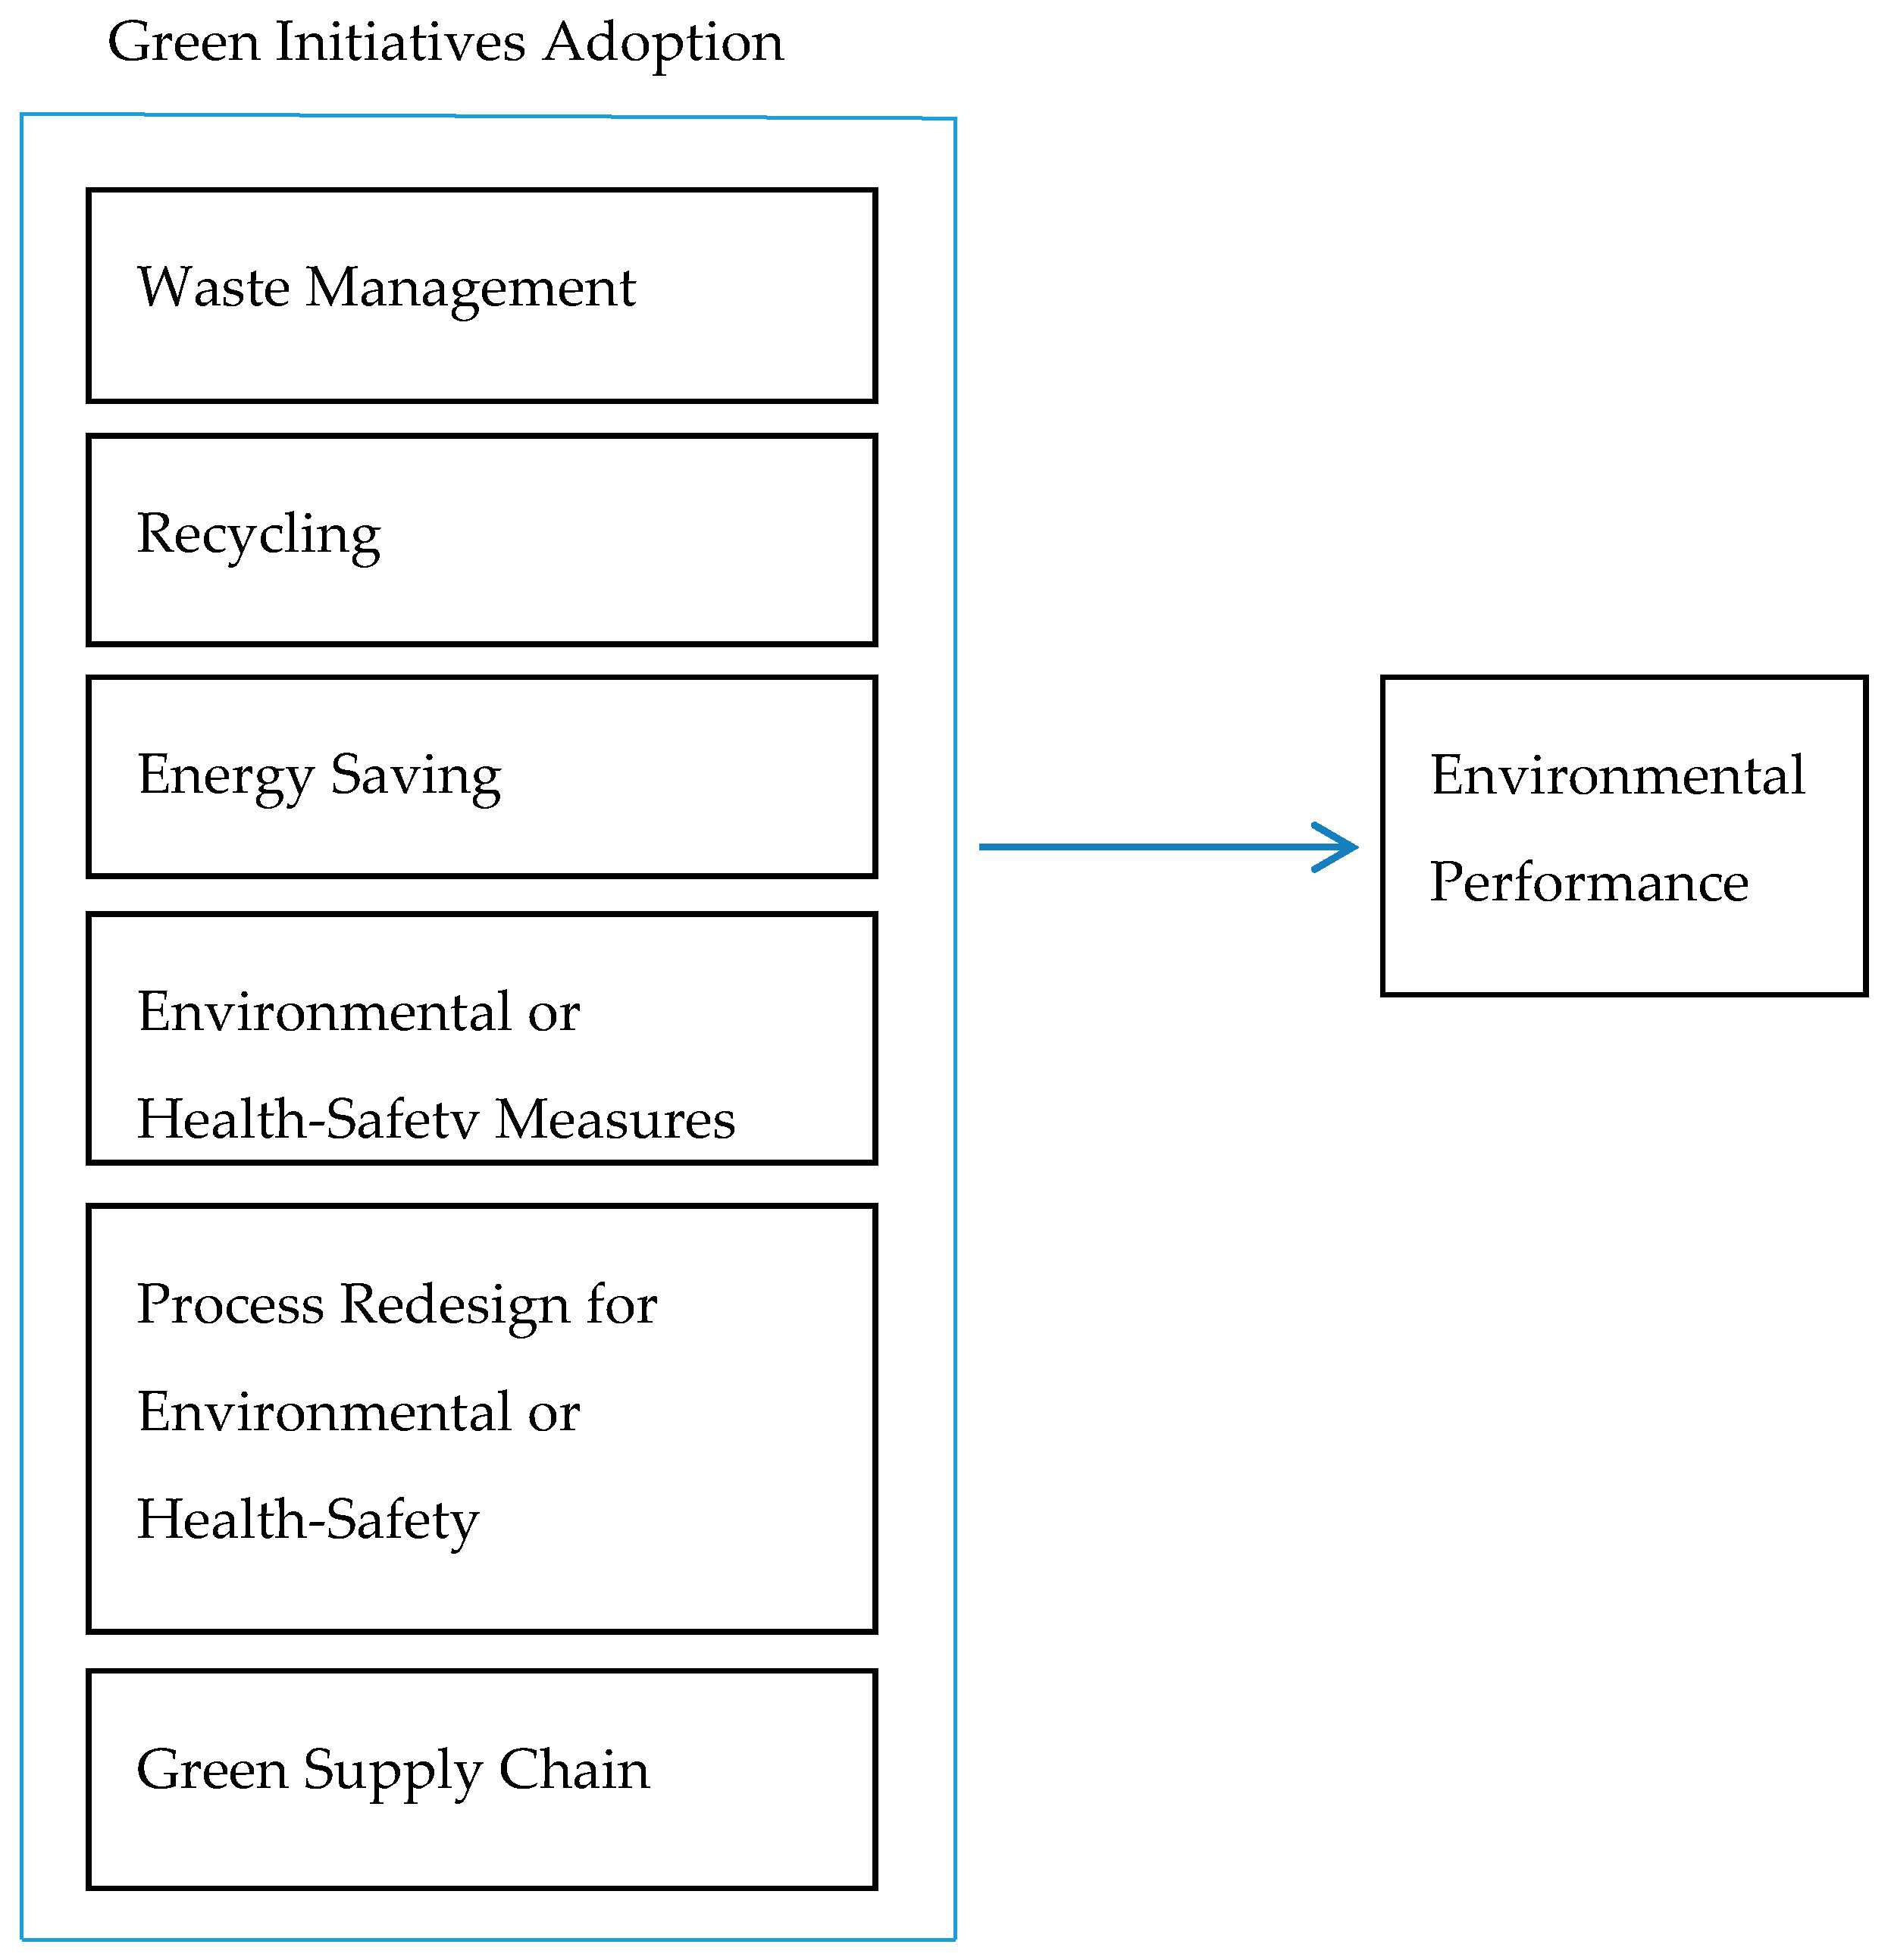
In the present study, green initiative adoption is adapted from Sustainable Development Initiatives in Malaysia by Malaysia Productivity Corporation, 2010. The waste management practice includes reduce waste and packaging, transportation, collection, disposal, treatment, and monitoring and regulating. It is aimed to lessen unfavourable impacts of waste on environment and health. A simple example of waste management is to provide bin to store waste. For recycling practice, it consists of processing used materials into new products to reduce the usage of new raw materials, energy and water, which can reduce air and water pollutions, for example recycling of polythene products and cans before transforming them into new materials without the need to send the whole waste to landfills or dump sites. Another example is, by collecting waste paper, and sorting and grading them accordingly, before selling them to paper mills that would recycle and convert them into various types of industrial paper. Energy saving practice usually includes the adoption of greenhouse gas (GHG) emission reduction programs at premises or factories to reduce GHG emissions, the use of light-emitting diodes (LED) bulb to reduce carbon dioxide emission and reduce energy usage. Energy saving practice includes the increase of energy efficiency in machineries and equipment usage such as high efficiency motor and pumps, the integration of renewable energy system and energy saving features in buildings, and the increased usage of thermal insulation for roofs in air conditioned buildings. Environmental or health and safety measures normally consist of prevention of harmful substances entering products, processes, work areas, and environment. Examples include measures addressing ergonomics and air quality, and minimising the usage of hazardous chemicals and gases. In addition, process redesign for environmental and health and safety includes recreating or remodelling of products for better energy saving and being more environmental friendly. Examples include: (i) front-load technology of washing machines can reduce water consumption up to 70%; (ii) intelligent inverter technology can reduce the consumption of electricity, for example, refrigerator uses 40% less electricity or exact amount of electricity needed; and (iii) intelligent inverter technology, precise power adjustment and compressor in air conditioner can save up to 60% energy saving and can cut carbon dioxide emission. Moreover, green supply chain initiatives include offering inventory management services for suppliers and clients, cleaner production, green packaging, design of products for reuse and recycling, return packaging to suppliers for reuse or recycling, cooperation with customers for eco-design, and using less energy during product transportation. Hence, green practices are environmentally-friendly activities and going green implies pursuing knowledge, activities, and lifestyles that lead to better environmental well-being.
Environmental performance measures were adopted from [
25], namely reduction in pollution emissions; reduction in use of water; reduction in use of energy; reduction in use of toxic inputs; reduction in use of paper; reduction of noise; reduction of smell/odour emissions; and reduction in the risk of severe accidents.
4.3. Test of Response Bias
The present study used
t-test to test for the non-response bias suggested by Oppenheim (2001). The sample was divided into two, namely “early responses” for companies that returned their questionnaires within two weeks after the date of distribution, and “late responses” for companies that returned their questionnaires after two weeks from the date of distribution, after many follow-up attempts [
31]. Accordingly, early responses were represented by the first thirty responses, and late responses were represented by the last thirty responses. An independent
t-test was employed to determine the significant difference between early responses and late responses for all variables examined in this study.
t-test shows that the
p-value of the variables are above 0.05. Hence, there is no significant difference of the mean score of these variables between early response and late response. In general, there is no significant difference found in all variables. This suggests that non-response bias is not an issue in this study. The result is illustrated in
Table 1 and
Table 2.
5. Analysis and Results
Table 3 shows that 78.4% of the sample companies have been adopting green practices for more than four years, and all of them adopted green practices in one form or another. The highest percentage of companies comes from “Trade and Services Sector” (25%).
Table 4 shows about two-third of the respondents (68.3%) are male and 89.2% are aged >30 years. Almost all of the respondents (93.3%) obtained certificates of tertiary education, either having a first degree or a professional degree, and they held top or senior managerial positions. Next, 85.8% have more than four years of working experience in their current companies and 58.3% of the respondents have more than ten years working experience in their current companies, suggesting that most respondents were knowledgeable about their companies and well experienced in operational practices.
Table 5 shows that the extent of green initiative adoption and environmental performance is at moderate level.
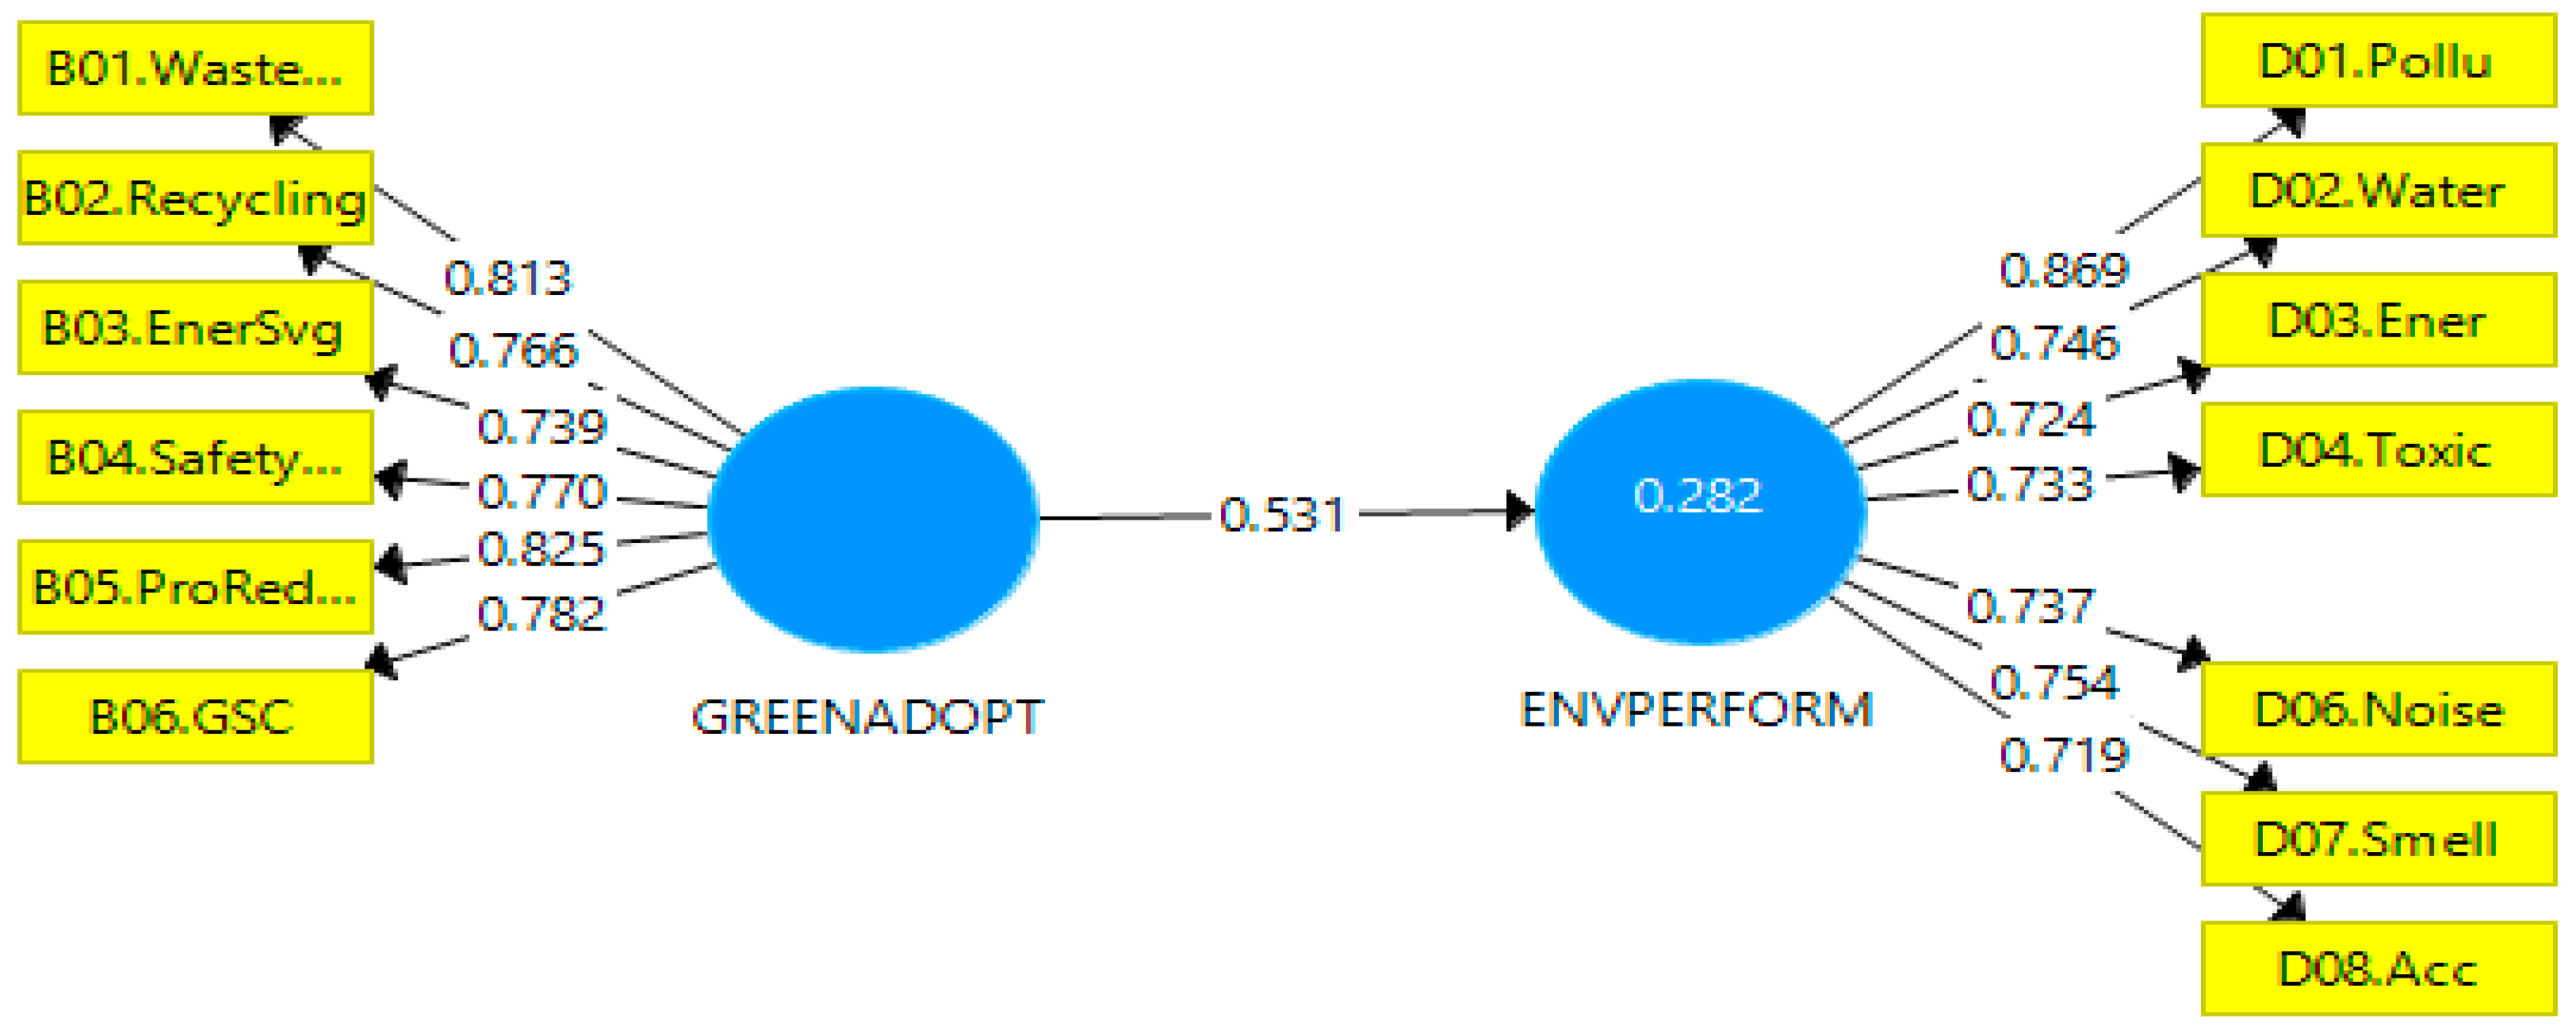
Figure 2 shows the statistical model for the study.
5.1. Internal Consistency
Internal consistency was measured using “composite reliability (CR)”. Internal consistency reliability defines the consistency of the results delivered in a test to ensure that the various items measured different constructs and delivered consistent scores. The CR value should be >0.70 because <0.60 shows lack of internal consistency reliability, 0.60–0.70 is acceptable in exploratory research and 0.70–0.90 is satisfactory [
32]. In this study, all indicators have CR > 0.70, hence have a satisfactory internal consistency reliability.
5.2. Indicator Reliability
In determining “Preacher and Hayes indicator reliability”, which is an indicator to measure whether an item is a member of the construct, the loadings to the respective constructs were computed [
33]. The standardised loadings should be >0.70. The common rule of thumb is outer loadings should be >0.70 because the squared outer loading is equivalent to the communality (at least 0.5 or 50%). In this study, there were two item loadings below the acceptable value and hence were removed. The items were “paperless = 0.626” and “tree planting = 0.670”. The inclusion of these items would negatively affect the later measurement and structural model. Researchers should carefully examine the effect of removing an item. Outer loading between 0.40 and 0.70 should be considered for removal from the scale only when deleting the indicator leads to an increase in the composite reliability or the average variance extracted (AVE). In addition, the removal would not affect content validity, but an item <0.40 should be eliminated. The results show outer loadings after removing “paperless = 0.626” and “tree planting = 0.670”.
5.3. Convergent Validity
Convergent Validity is the extent to which a measure correlates positively with the alternative measures of the same construct. The items share a high proportion of variance. To establish convergent validity, the outer loadings of the indicators and Average Variance Extracted (AVE) should be considered. AVE is defined as the grand mean value of the squared loadings and equivalent to the communality of a construct. The outer loading of the indicators should be >0.7 and AVE should be >0.5. AVE < 0.5 indicates that, on average, more errors remain in the items than the variance explained by the construct. In this study, the results show that AVE for all constructs were >0.5. As all constructs had AVE > 0.5 and item outer loadings > 0.70, the items shared a high proportion of variance and a measure positively correlated with the alternative measures of the same construct.
5.4. Discriminant Validity
Discriminant Validity is the extent to which a construct is truly distinct from other constructs by empirical standards. To determine if the items loaded on the other constructs equally as well as on their theorised construct, cross loadings, Fornell–Larcker criterion, and heterotrait–monotrait ratio of correlations (HTMT) were computed. For “cross loadings”, the outer loading on associated constructs should be greater than all of its loadings on other constructs. For “Fornell–Larcker criterion”, the square root of AVE should be greater than the latent variable correlations. For HTMT, the value of inter-correlation between construct and construct should be <0.85 or <0.90. If one of the assessments meets the criteria, then the constructs do not share same concept and they are discriminant. In this study, the assessment values met the criteria of cross loadings, Fornell–Larcker, and HTMT. Hence, the constructs did not share the same concept and they were discriminant.
Table 6 indicates that all items and constructs are reliable and valid after taking out item “DO5. Reduction in use of paper”. This item did not measure the construct it was designed to measure, as its factor loading was <0.70 and affected the whole measurement model.
5.5. Collinearity Issues
Collinearity indicates that the predictor (independent) variables might be highly inter-correlated. The path coefficient might be biased if the estimation involves significant levels of collinearity among the predictor constructs. Variance Inflation Factor (VIF) was used to test for collinearity. VIF > 5 in the predictor constructs indicates that collinearity is too high. If collinearity exceeds the threshold, researchers should consider eliminating constructs, merging predictors into a single construct, or creating higher-order constructs to deal with collinearity problems. The results indicated that all of the VIF were <5 and, hence, no collinearity exists.
5.6. Significance
The test for significance of the structural model relationships, Bootstrapping—Path coefficient, was used based on T Statistics > 1.96 for two-tailed test; T Statistics > 1.645 for one-tailed test; and p value < 0.05 for significance. The results indicated the path was statistically significant (GREENADOPT→ENVPERFORM), which has p = 0.000 (>0.05), and T Statistics = 10.538 (<1.645).
5.7. Relevance
To test for the relevance of significant relationship, PLS algorithm coefficient was used. The results show the relative importance of the exogenous (independent) constructs in predicting the endogenous (dependent) constructs. Green Adoption (GREENADOPT) = 0.531 is the most important to Environmental Performance (ENVPERFORM).
5.8. Predictive Accuracy of Model
The “coefficient of multiple determinations (R2)” is a measure for the model’s predictive accuracy and is calculated as the squared correlation between a specific endogenous construct’s actual and predicted values. It illustrates how well the data fit a statistical model or “goodness-of-fit”. In general, a model fits the data well if the difference between the observed values and the model’s predicted values are small and unbiased. The R2 ranges from 0 to 1 and the higher the R2, the better the model fits the data. There is no specific rule of thumb for R2 value. R2 value 0.75 = substantial, 0.50 = moderate and 0.25 = weak. The level of R2 for ENVPERFORM = 0.282 showed that the proposed model explains an acceptable amount of the variance of ENVPERFOM. This indicated that the model’s predictive accuracy was acceptable, showing a considerable explanatory power of the model.
5.9. Effect Size (f2)
The “effect size (f2)” is a measure of the impact of a specific exogenous construct on an endogenous construct. The f2 effect size measures the change in the R2 value when a specific exogenous construct is omitted from the model. It is used to evaluate whether the omitted predictor construct has a substantive impact on the R2 values of the endogenous construct(s). f2 value 0.35 = large, 0.15 = medium, and 0.02 = small. The results indicated that the green adoption (GREENADOPT) = 0.393 has a large effect in producing the R2 for environmental performance (ENVPERFORM).
5.10. Blindfolding and Predictive Relevance (Q2)
Next, “blindfolding and predictive relevance (Q2)” is an indicator of the model’s predictive relevance. The Q2 measure applies a sample reuse technique that omits part of the data matrix and uses the model estimates to predict the omitted part. It accurately predicts the data points of the indicators in reflective measurement models of multi-item as well as single-item endogenous constructs. The Q² value is calculated using the cross-validated redundancy, which uses the path model estimates for both the structural model and the measurement model. Q2 larger than zero for a specific reflective endogenous latent variable indicates the path model’s predictive relevance for a particular construct. Q2 of zero or below indicates a lack of predictive relevance. The value of Q2 was considerably above zero, ENVPERFORM = 0.120, thus providing support for the reputation model’s predictive relevance.
In
Table 7, the predictor construct is summarised as having no collinearity, and the path was statistically significant. The exogenous driver construct has importance in predicting the endogenous construct. The overall model’s predictive accuracy was moderate, indicating a considerable explanatory power of the model, and the exogenous construct has a considerable impact on an endogenous construct. In addition, the endogenous latent variable provided support for the reputation of model’s predictive relevance. Thus, the model has the capability to answer the research questions and hypothesis.
The findings reveal that the extent of green initiative adoption and environmental performance is at moderate level. Green initiative adoption positively affects the environmental performance of Malaysian PLCs; hence, the hypothesis was supported. The impact of green initiative adoption on environmental performance includes: reduction in pollutant emissions, reduction in use of waste, reduction in use of energy, reduction in use of toxic inputs, reduction in noise, reduction of smell/odour emissions, and reduction in the risk of severe accidents.
6. Discussion
6.1. Extent of Green Initiative Adoption
The results of data analysis showed that the extent of green initiative adoption in Malaysian PLCs is rather modest. PLCs practise certain extent of waste management, recycling, energy saving, environmental or health and safety measures, process redesign for environmental and health and safety, and green supply chain but are not proactive. Based on findings from the in-depth interviews with the top management of Companies A, B and C, the extent of the adoption depends on the nature of industries, beliefs of the top level managers, employee responsibility, education received, culture and pressure from certain groups. Industries that require high level of clean and healthy environment which need to be regularly checked by Health Department, such as poultry industry, extensively adopt green initiatives. For example, in the present study, it was found that they systematically managed industrial wastes, otherwise, it would lead to diseases onto their products, employees, and surrounding communities.
Companies also do charitable activities, for example paper wastes were given for free to those in needs. For this kind of industry, the top managers support green activities, as well as encourage and reward staff adopting or practicing green initiatives. Normally, companies would consider new green technology if it would give some benefits at low cost. For some companies, going green is not a priority, but others do make it a priority because of their beliefs and awareness on CSR activities.
6.2. Effect of Green Initiative Adoption on Environmental Performance
Referring to the results of data analysis, the adoption of green initiatives significantly affected the environmental performance of Malaysian PLCs; hence, the hypothesis was supported. Adoption of waste management, recycling, energy saving, environmental or health and safety measures, redesign process for environmental and health and safety, and green supply chain positively affected the environmental performance of Malaysian PLCs. Green initiative adoption affects environmental performance in the reduction in pollutant emissions, reduction in use of waste, reduction in use of energy, reduction in use of toxic inputs, reduction in noise, reduction of smell/odour emissions, and reduction in the risk of severe accidents. The effect of green initiative adoption on environmental performance in this study is consistent with the studies by [
7] on supply chain management in Chinese manufacturing enterprises.
Institutional theory claims that coercive and normative pressure push manufacturers to adopt green practises and would give positive effect to the firm performance. Government agencies are the obvious factor that influences the adoption of green practices by organisations through the enforcement of rules and regulations. For instance, to reduce pollution to the environment, organisations are required to use pollution control technologies and report their pollution emissions to indicate their impact on the environment. Their failure to do so might cause these organisations to face legal sanctions which affect the business progress adversely. Stakeholder theory explains that the actions undertaken in the best interests of the stakeholders would lead to positive firm performance and the survival of organisations in the long run [
34].
7. Conclusions
The study suggests that Malaysia needs more advanced green technologies and more effective monitoring and enforcement of rules and regulations. Their other challenges include the lack of green awareness, lack of financial incentives, and lack of technical resources. The adoption of green initiatives requires a lot of effort, time, and resources that are costly to the companies and might not yield returns in the short term. Green practices are also given less priority among Malaysian PLCs as they have to weigh the associated costs and profits because most business organisations are profit-oriented.
This study contributes to the literature of environmental management in the context of green and sustainable development, whereby it reveals that the extent of green initiative adoption in Malaysian PLCs is moderate in practice and contributes to the positive environmental performance. In addition, this study provides an analysis of the understanding of green practices and green management using survey approach. It is useful for this large-scale quantitative study as it allows the incorporation of a broader scope, on top of being supported by in-depth interviews with the top management of selected companies. This study delivers empirical evidence on how companies could contribute to meeting the needs of our planet and enhancing performance in their respective industries.
This study also provides some important contributions for management practices by providing empirical evidence to managers that green initiative adoption contributes to environmental performances to save the world. Companies should be more proactive and extensively adopt green initiatives to contribute to better environmental performance. The role of top managers in green initiatives is important because they are powerful in terms of nurturing companies to support proactive green strategies. Managers should encourage employees’ involvement in green practices, perhaps rewarding them for their environmental improvement in their day-to-day activities. Managers should inform and train employees about environmental issues, environmental objectives, and environmental impacts of their actions on organisations. Moreover, regulatory authorities or policy makers could facilitate and encourage effective implementation of green initiatives by providing more incentives such as financial incentives, technical resources, governmental subsidies, tax incentives, training, pilot green projects, and green awareness. Governments should consider what elements of their existing work might contribute to sustainability, and how other elements of sustainability could interact and be incorporated for present and future positive impacts. Financial institutions should offer financing at lower rates for environmentally friendly technologies and lower the insurance premium to protect companies against environmental risks.
Limitations of the study are it only focused on the green initiative adoption in Malaysian PLCs, and the research findings were limited and too generic. Moreover, it only considered the institutional theory, contingency theory, and stakeholder theory. In terms of research methodology, as the research variables were measured through the perceptions of respondents, there were some rather subjective and leniency errors, where the observed scores had higher mean values due to over-emphasising the good performance or positive quality of the organisations. Furthermore, because of time and cost constraints, the data were only collected once, thus inheriting the usual limitations of cross-sectional data. This study also faced difficulty during data collection process as PLCs were mainly concerned and worried with the act of disclosing company’s information and having lack of understanding on the importance of the research. According to [
35], mail surveys in Malaysia normally have low response rate, ranging from 10% to 20%.
Future research might be done in different countries on multiple types of organisations involving various green practices.


