Abstract
The carbon emissions and agricultural nonpoint source pollution constraints were incorporated into the input–output index system, and the epsilon-based measure (EBM) super efficiency model and global Malmquist–Luenberger (GML) index were used to measure the cultivated land use efficiency and changes in the total factor productivity (TFP) of cultivated land use in the main grain-producing areas in China from 1993–2016. The results indicate that: (1) from 1993 to 2016, the cultivated land use efficiency in the main grain-producing areas in China showed a tendency to fluctuate and increase, with obvious stage characteristics; however, the overall level was not high. (2) There is a significant difference in the cultivated land use efficiency under the constraints of carbon emissions and nonpoint source pollution in the main grain-producing areas in the different provinces, and low-efficiency provinces have higher input redundancy and undesired output redundancy than high-efficiency provinces. It can be observed that input redundancy and undesired output redundancy have a significant negative effect on cultivated land use efficiency. (3) The TFP of cultivated land use under the constraints of carbon emissions and nonpoint source pollution in China’s main grain-producing areas is estimated by the GML index. The results show that the TFP of cultivated land use in the main provinces in the main grain-producing regions is greater than 1, indicating that the productivity levels of all the provinces in China’s main grain-producing areas are increasing. From the perspective of the power sources in each province, global pure technological change (GPTC) and global scale technological change (GSTC) are the main driving forces for the TFP of cultivated land use, while global pure efficiency change (GPEC) and global scale efficiency change (GSEC) are the bottlenecks for increasing the TFP of cultivated land use.
1. Introduction
As the essence of cultivated land, the foundation of food production is the most basic resource for human survival and development and plays an irreplaceable role in the development of agriculture and the national economy. Since the period of reform and opening up, the process of industrialization and urbanization in China has been advancing rapidly. Accompanied by the rapid reduction of high-quality cultivated land, the “red line” pressure on the protection of 120 million hectares of cultivated land has continuously increased [1]. As a major type of agricultural land, cultivated land has the positive effect of producing agricultural products and increasing the total agricultural output value. Conversely, due to unreasonable cultivated land use behavior, agricultural production activities will lead to a decrease in soil storage and carbon content, and a greater release of carbon into the atmosphere will lead to an increase in the concentration of atmospheric CO2. Li found that in 2008 China’s carbon emissions from cultivated land use reached 7843.08 million tons, and a large amount of greenhouse gas emissions has made the cultivated land use in our country more vulnerable to instability and risks [2]. Li supported the data from Jiangsu province and found that for each additional 1 km2 of cultivated land, a corresponding increase of 0.0422 t of carbon emissions would occur. Unreasonable use of cultivated land would weaken soil carbon storage and the vegetation carbon sequestration capacity and change the intensity and pattern of regional carbon emissions, thus increasing the global warming trend and climate change [3]. On the other hand, the long-term use of high-contamination source materials such as fertilizers, pesticides, and agricultural plastic films in the cultivated land use process often leads to soil compaction, degraded cultivation quality, and decreased soil fertility. It is the main cause of soil pollution, in 2014, the National Soil Pollution Survey Communique showed that the rate of over-standard soil sites in Chinese cultivated land was as high as 19.4%. According to the first national census of pollution sources, the total nitrogen emitted from agricultural nonpoint source pollution in 2007 was 2.7046 million tons, and the total phosphorus was 284,700 tons, which accounted for 57.19% and 67.27% of the China emissions for the same period. In particular, the nonpoint source pollution caused by the process of cultivated land use has begun to replace the point source pollution, becoming an important factor in water pollution [4]. In 1985, the U.S. conducted the most extensive nonpoint source pollution survey to date. The survey results showed that the contribution rate of agricultural nonpoint source pollution in nonpoint sourced rivers and lakes were 64% and 57%, respectively [5]. For example, in the total nitrogen and total phosphorus load that enters Dianchi Lake, agricultural nonpoint source pollutants accounted for 53% and 42%, respectively [6].
China’s main grain-producing areas have suitable conditions for agricultural production, high food production, and are suitable for large-scale food production, so that food production has a comparative advantage. Over the years, food production’s proportion of China’s grain production was approximately 75%; the main grain-producing areas have the task of meeting the food security needs in China. The effective use of cultivated land resources in the main grain-producing areas not only affects food production but also relates to food security and regional and global ecological security issues. In this context, this paper discusses the characteristics of the spatiotemporal evolution of cultivated land use efficiency under the constraints of carbon emissions and agricultural nonpoint source pollution in the main grain-producing areas, analyzes the true performance of the increase in total agricultural output value, and promotes the coordinated development of cultivated land and the environment. The construction has important practical significance for the promotion of China’s ecological civilization.
1.1. Literature Review
In recent years, many scholars have conducted beneficial explorations of cultivated land use efficiency. To date, many fruitful results have been achieved by focusing on different aspects, methods and perspectives.
(1) In terms of the research content, the exploration of cultivated land use efficiency is mainly conducted in terms of index construction, regional differences, and influencing factors. For example, Pang proffered the analysis framework of “Cultivated land output efficiency coefficient + cultivated consumption return coefficient + cultivated land pollution substitution coefficient + cultivated land use intensive coefficient” [7]. Wang selected eight indicators, such as unit cultivated land area, agricultural labor force, irrigation index, multiple cropping index, and proportion of agricultural investment, to analyze the cultivated land use efficiency in Henan Province [8]. However, currently, fewer scholars include carbon emissions and agricultural nonpoint source pollution in the evaluation index system of cultivated land use efficiency. Ye and Wang analyzed the regional differences in the cultivated land use efficiency in China and found that the cultivated land use efficiency in China in the eastern region was higher than that in the central and western regions [9,10]. Bonfiglio, Song, Chen and others studied the driving factors affecting the improvement of cultivated land use efficiency [11,12,13]. Bonfiglio’s research found that excessive use of chemical fertilizers and pesticides will affect the improvement of cultivated land use efficiency, while young farmers participating in the agricultural environment plan will increase the cultivated land use efficiency. Song’s research found that the green food development policy helps to improve the cultivated land’s ecological environment and improve the cultivated land use efficiency. Chen’s research found that improving the educational level of farmers and developing mechanized systems can increase the cultivated land use efficiency.
(2) In terms of research methods, scholars mainly adopt the data envelopment analysis methods (DEA) for research into cultivated land use efficiency. Data envelopment analysis methods can be divided into two categories. The first category is DEA models that do not consider undesired outputs. The evaluation model mainly includes the DEA model [14,15], the improved DEA model [16], and the super efficiency DEA model [17]. Although the DEA method can be used to compensate for the past measurement of cultivated land use efficiency, it only considers the deficiencies of individual input and output indicators. However, because the value of cultivated land use efficiency is not considered under conditions of environmental constraints, the measured value of cultivated land use efficiency is often high. Dai used the two-step method based on the DEA to analyze the cultivated land use efficiency and its influencing factors under different utilization patterns in Nenjiang county, Heilongjiang province. The results showed that the overall cultivated land use efficiency in Nenjiang county was 0.874, and the individual contracted land use efficiency was the highest [18]. Feng analyzed the change of cultivated land use efficiency in Fengdu county from 2002 to 2008 by the DEA method. It was found that the change of cultivated land use efficiency was mainly caused by the change of pure technical efficiency. The factors affecting the utilization efficiency of cultivated land from big to small are: economic conditions > natural conditions > cultivated land resource endowments [19]. Li used DEA to evaluate the cultivated land use efficiency in 30 townships in the Lixia river area of Yangzhou city. Finally, an econometric model was used to examine the impact of fragmentation on cultivated land use efficiency. Fragmentation has a significant negative effect on the scale efficiency and pure technical efficiency of cultivated land use. The degree of fragmentation should be reduced from the aspect of plot size, distribution and shape to increase the productivity of cultivated land [20]. The second category is the slack-based measure (SBM) model, which considers undesired outputs, adding one or more pollutants as undesired outputs to the first type of model. The SBM model is a data envelopment analysis method that puts the slack variable directly into the objective function, which not only solves the problem of relaxation of input and output, but also solves the problem of efficiency evaluation when there is undesired output. For example, Lu, Liu, and Feng have evaluated the cultivated land use efficiency under environmental constraints [21,22,23]. Many scholars have also applied the Malmquist index to the study of the cultivated land use efficiency. For example, Yang used the Malmquist index to analyze the cross-temporal changes of cultivated land use efficiency in the major areas of Shanxi Province from a time scale [24]. It was found that Shanxi province had significant regional differences in total factor productivity (TFP), and the growth structure was different. As the Malmquist–Luenberger (ML) index is prone to the problem of no feasible solution, many scholars use the global Malmquist–Luenberger (GML) index to measure TFP. For example, Xie used the GML index to measure the industrial green TFP of major industrial areas in China from 2003 to 2013 [25]. Xie used the GML index to estimate the TFP of forestland in China during the period from 1990 to 2010. The study found that the increase in TFP in the western region was mainly due to technological progress. The increase in TFP in the central region was mainly due to the scale expanding [26]. Xie used the GML index to measure the TFP of cultivated land green use in China from 1995 to 2013 under the constraint of agricultural nonpoint source pollution and noted that improving production techniques and improving the ecological environment will help improve the TFP of cultivated land green use [27]. Yue used the GML index method and panel data regression model under the constraints of nonpoint source pollution and carbon emissions, measures and analyzes the spatial–temporal differentiation characteristics and influencing factors of China’s cultivated land use efficiency from 2009 to 2015, and clarifies the ways to increase cultivated land use efficiency in different regions [28]. Du used the GML index method to measure agricultural technological progress, environmental technology efficiency and environmental total factor productivity. The following conclusions are drawn: (a) the growth of the TFP of the agricultural environment is mainly driven by technological progress. (b) regional differences in environmental TFP and its compositional changes and inter-provincial differentiation are significant [29]. There are significant differences in the significant factors affecting TFP in different regions, and technological progress is the main driving force of TFP growth in all regions. The GML index can solve the problem of linear programming without solution, and can carry out cross-period comparative analysis. However, fewer scholars currently use the GML index to measure the TFP of cultivated land use under the constraints of carbon emissions and agricultural nonpoint source pollution. Many scholars have conducted a convergence analysis of efficiency values; for example, Xie analyzed the convergence of TFP of industrial land in China’s six major economic zones. The study found that each economic zone converged to its own steady-state level [30]. Li analyzed the convergence of the TFP of agriculture from 1985 to 2005 and found that China’s agricultural productivity has convergence [31]. Certain scholars also analyze the convergence of cultivated land use efficiency. For instance, Ye analyzed the convergence of cultivated land use efficiency in various provinces and autonomous regions in China from 1990–2018 and found that China’s three major economic belts will converge to a higher level of cultivated land use efficiency [9]. However, fewer scholars currently analyze the convergence of cultivated land use efficiency under the constraints of carbon emissions and agricultural nonpoint source pollution.
(3) In terms of the research object, the focus was mainly on the country [32], province [33], and city [34]. There are few studies of cultivated land use efficiency in the main grain-producing areas. Currently, only Zhang and Gai, in a domestic study, have assessed the cultivated land use efficiency in the main grain-producing areas [35,36]. Zhang’s study did not consider undesired outputs such as carbon emissions and agricultural nonpoint source pollution. Although Gai’s study considers undesired outputs such as carbon emissions and agricultural nonpoint source pollution, he has not considered the convergence of cultivated land use efficiency over time.
1.2. Critical Missing Aspects
From the above literature, we can find that certain deficiencies remain in the study. (1) From the perspective of research, regarding incorporating undesired outputs into the evaluation index system, there are relatively few evaluations of cultivated land use efficiency under the constraints of carbon emissions and agricultural nonpoint source pollution. (2) In terms of research methods, both the radial DEA model and the nonradial SBM model have certain flaws when evaluating the cultivated land use efficiency. The radial DEA model requires that all inputs or outputs be proportionately changed, thus ignoring the effect of nonradial slack variables [37]. While the SBM model’s efficiency measurement includes a nonradial slack variable, it is optimized relative to the traditional DEA model; however, this optimization is based on the original proportional information of the loss efficiency front projection value [38]. Thus, in 2010, Tone proposed a mixed model including radial and SBM distance functions, the EBM model [39]. The EBM model is a data envelopment analysis model that considers the coexistence characteristics of radial and non-radial relaxation variables. This model can not only calculate the improvement ratio between the target value and the actual value, but also calculate the nonradial value of each input and output to find the difference between the actual value and the target value. Thus, the DMU efficiency value is more accurately calculated [40].
1.3. Aims of the Study
Given the previous research, the main purpose of this paper is as follows. First, from the research perspective, carbon emissions and agricultural nonpoint source pollution are regarded as indicators of undesired outputs of cultivated land use, which facilitates the actual assessment of the real performance of cultivated land use. The second is that, for the first time, the EBM super efficiency model was used to measure the cultivated land use efficiency in the main grain-producing areas, because it considers both radial and nonradial coexistence characteristics that can more accurately measure the cultivated land use efficiency in the main grain-producing areas. Third, under the constraints of carbon emissions and agricultural nonpoint source pollution, the EBM super efficiency model was combined with the GML index to measure the TFP of cultivated land use, and Zofio was used to decompose the TFP of cultivated land into GPEC (global pure efficiency change), GSEC (global scale efficiency change), GPTC (global pure technological change), and GSTC (global scale technological change) [41]. The model will provide a basis for the government to formulate a corresponding agricultural policy to increase the cultivated land use efficiency.
2. Study Area
The main grain-producing areas are important production bases for China’s commodity grains (see Figure 1). Compared with non-main grain-producing areas, these areas have conditions such as a soil, climate, and geography location that are more suitable for planting food crops, have high grain yields and have a relatively large proportion of plantations. In addition, these areas satisfy their own consumption, and a large amount of the economically valuable area can also be utilized for commodity grains [42]. According to the “Opinions on Reforming and Improving Several Policies and Measures for Comprehensive Agricultural Development” promulgated by the Ministry of Finance in 2013, the areas includes the following: Heilongjiang, Jilin and Liaoning in Northeast China; Hebei, Inner Mongolia in North China Area; Shandong, Jiangsu and Anhui in East China Area; and Henan, Hunan, Hubei and Jiangxi in Central China Area. In addition, in the Southwest China Area of Sichuan, a total of 13 provinces were identified as the main grain-producing areas of China [43]. According to the data published in “China Statistical Yearbook 2017”, the area of cultivated land in the main grain-producing areas in 2016 was 88.926 million hectares, representing 65.9% of the country’s cultivated area; the effective irrigated area was 46.111 million hectares, representing 69.6% of the country’s effective irrigated area. The grain output was 47.677 million tons, representing 75.9% of the country’s total grain output. From the perspective of grain sales, farmers in grain production areas in China represent more than 80% of the nation’s total grain sales [44]. Most of the 13 main grain-producing areas are in plain or lowland areas, with humid or semi-humid climates, adequate light, abundant moisture, fertile soil and high organic matter content; these characteristics are suitable for farming and the conservation of soil and water and suitable for the growth of crops [45,46]. The main grain-producing areas have a very close relationship with food security. The main grain-producing areas are responsible for ensuring national food security. To maintain national food security and economic stability, we must focus greatly on the cultivated land use efficiency in the main grain-producing areas [47].
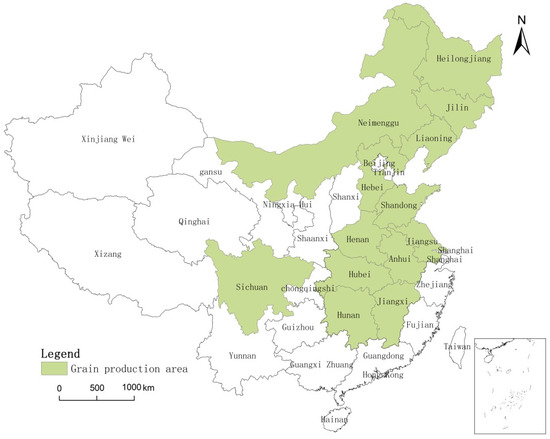
Figure 1.
Location of the main grain-producing area in China.
3. Material and Methods
3.1. EBM Super Efficiency Model
Data envelopment analysis (DEA) is a method that can deal with multiple input–multiple output efficiency problems in the same framework at the same time. DEA also has stronger explanatory power, because it relaxes the specific functional form limitations of stochastic frontier analysis [48]. However, from the measurement methods, the traditional radial DEA model requires that all inputs and outputs must be expanded or reduced in the same proportion and cannot include the estimation of slack variables. The SBM model, which is based on non-radial measurement, considers the non-radial slack variable and compensates for this defect; however, it also loses the ratio between the input and output target value and the actual value. To solve this problem, Tone and Tsutsui proposed a mixed model that includes both radial and SBM distance functions [39]. Due to the use of the parameter in the model, Tone calls it the epsilon-based measure (EBM). This paper wants to analyze and study the cultivated land use efficiency in the main grain-producing areas from both input and output perspectives. Therefore, a non-oriented EBM model was selected. The non-oriented EBM model planning formula is as follows:
In Formula (1), is the radial efficiency value calculated by the Charnes, Cooper and Rhode (CCR) model. The CCR model is a DEA model that assumes constant returns to scale. It is the most basic and important technology in the DEA model. , represents the relative importance of various input indicators, and and are the relative importance of the expected output and undesired output, respectively. Where is a key parameter, the range of values is [0,1], which represents the importance of the non-radial portion in the calculation of the efficiency value. If , the EBM model is equivalent to the radial model. If , the EBM model is equivalent to the SBM model.
In the analysis results for the DEA model, there are often cases where multiple DMUs are rated as valid. Particularly when there are a large number of input and output indicators considered, the number of effective DMUs will also increase. In the DEA model, the maximum efficiency value obtained is 1; the effective DMU efficiency value is equivalent, and it is difficult to further distinguish the degree of efficiency of the DMU. To solve this problem, Andersen and Petersen proposed a means to further differentiate effective DMUs [49]. This approach was later called the “super efficiency model”. For convenience, the traditional DEA model is called the standard efficiency model. The only difference between the super efficiency model and the standard efficiency model is that the constraint condition of j is increased. The model of the super efficiency model is as follows:
The meaning of each variable in the above equation is consistent with the previous variable. The core of the super efficiency model is to remove the evaluated DMU from the reference set. Therefore, the efficiency value of the evaluated DMU is obtained by referring to the frontier of the remaining DMUs. The effective DMU value will generally be greater than 1, thus distinguishing the effective DMU.
The EBM super efficiency model is based on cross-sectional data and can only measure the efficiency of each DMU at a single point in time. This finding makes it impossible to compare results using data at different points in time. Therefore, this model can be combined with GML index analysis to reflect the timing changes.
3.2. Directional Distance Function Model and GML Index Model
3.2.1. Construction of Directional Distance Functions
Chung et al. applied the directional distance function with undesired outputs to the Malmquist model, and the Malmquist index was collectively referred to as the Malmquist–Luenberger productivity index [50]. This index can well solve the efficiency of the evaluation problem with undesired outputs. The index formula is as follows:
represents the input vector of land, labor, and capital. and are the vectors of the expected outputs in t period; and are the vectors of the undesired outputs in t period. is expressed as a direction vector. is the directional distance function that maximizes expected output and minimizes undesired output in the t period [46]. Suppose there are n DMUs (provinces). Each DMU has i inputs to obtain u desired outputs and z kinds of undesired outputs ; represent the possible production sets for t = 1...,T periods:
productivity can usually be decomposed into two parts: technology progress index and efficiency change index. That is, . In the formula, , , >1 or (<1), respectively, represent growth (decrease) in TFP, technological progress (regression), and efficiency improvement (deterioration).
3.2.2. Global Malmquist–Luenberger Index Model
Since the TFP calculated using the average geometric form of the ML index does not have the property of cyclic multiplication, the short-run change analysis of the adjacent production efficiency can only be performed; however, the long-term growth trend of the production efficiency cannot be observed. Moreover, the problem of the directional distance function is prone to no feasible solution [51]. Therefore, Oh (2010) constructed the GML index model, which is based on the sum of the common reference set of each period as a reference set [52]. The common reference set for each period is: . The GML index method can not only avoid the possibility of “technical regression”, but also the DMU being evaluated is certainly included in the global reference set. Therefore, there is no problem of no feasible solution to the GML index. Additionally, the GML index is transitive and can be multiplied. The GML index of this article is based on the Oh’s (2010) work, combined with the EBM super efficiency model, to construct the model formula of the GML index from t to the t + 1 period:
The index can be further decomposed into () and (), the model is as follows:
The decomposition method of Zofio can be viewed as extending from the decomposition method of Fare et al. [53]. Based on the Zofio productivity decomposition method, this paper further decomposes into pure efficiency change () and scale efficiency change (), and decomposes into pure technology change () and technology scale change (), as shown in the following formula:
According to the results, reflects the state of environmental governance in the main grain-producing areas. represents the state of the scale economy in the main grain-producing areas. is a standard used to distinguish the technological advancement in different regions. reflects the interaction between economic size and technological progress. , , , , >1 or (<1), respectively, indicate the increase or decrease of the TFP of cultivated land use, the improvement or regression of environmental governance, the growth or decline of economies of scale, and the technological progress or retrogression. The interactive relationship between economic size and technological progress is improving or worsening. This paper uses this decomposition method to analyze the utilization status of cultivated land use efficiency in the main grain-producing areas from four dimensions, which is more comprehensive and specific than previous studies. Abbreviations for proper nouns are shown in Table 1.

Table 1.
List of abbreviations.
3.3. Selection of Indicators
Cultivated land use efficiency is an important indicator for evaluating the performance of cultivated land use and refers to the input–output ratio of various production factors for cultivated land per unit area [54]. This paper combines the research of Zhang [16], Lu [21], Pan [55], Feng [23] and others and refers to the domestic and foreign literature on cultivated land use efficiency, mainly based on the ratio of input and output to measure the cultivated land use efficiency. Input factors mainly reflect the aspects of land, labor and science and technology used by cultivated land, while output factors mainly reflect the use of cultivated land for economic and environmental output. Both factors are based on the connotation of cultivated land use efficiency and the principle of representation, availability and authenticity. From the two dimensions of input and output of cultivated land, indicators were selected to construct an evaluation index system of cultivated land use efficiency under the constraints of carbon emissions and nonpoint source pollution in the main grain-producing areas.
(1) Selection of input indicators
Input indicators for cultivated land production can be selected from three aspects: land, labor and science and technology input. Due to the existence of multiple cropping and interplanting in the production process of cultivated land, to accurately study the degree of utilization of cultivated land, the sown area of crops (I1) should be used as the input index of cultivated land. The selection of the labor force in the first industry (I2) reflects the human input of cultivated land. The capital input was selected from the total agricultural machinery power (I3), effective irrigation area (I4), fertilizer application (I5), pesticide application (I6), and agricultural plastic film usage (I7).
(2) Selection of expected and undesired output indicators
In the actual use of cultivated land, a variety of input factors will produce a variety of different products; therefore, when calculating the total output, it will not be as simple as calculating a single input and output. Therefore, this paper selects the comprehensive index of the total agricultural output value (O1) to characterize the expected output variables of cultivated land use. It also selects total carbon emissions as one of the undesired output indicators (O2). Based on the research results of the existing literature and combining the actual conditions of the main grain-producing areas, this paper determines the main sources of carbon emissions during cultivated land use. The accounting model for the total quantity of carbon emissions from cultivated land is as follows:
In the formula, represents the total carbon emissions during the use of cultivated land, and the unit is 104 t; represents the quantity of carbon source produced by pesticides, fertilizers, agricultural plastic films, and the total power of agricultural machinery, plowing, and irrigation during the cultivated land use in units of 104 t. The represents the original quantity of each carbon source. represents the carbon emission coefficient corresponding to various carbon sources. Combined with the research results of Li [56] and You [57], the carbon emission factors corresponding to various carbon sources are shown in Table 2.
Table 2.
Carbon emission factors of various types of cultivated land carbon sources.
The threat of agricultural nonpoint source pollution caused by the cultivated land use has become increasingly prominent. At the same time, agricultural nonpoint source pollution is difficult to measure due to the characteristics of the nonpoint source, such as dispersion, concealment, and randomness. This article refers to the research of Pan [55], Liang [58] and others and uses the unit survey assessment method and the inventory analysis method to measure the chemical oxygen demand (COD), total nitrogen (TN) and total phosphorus (TP) produced by the agricultural nonpoint source pollution in the main grain-producing areas. The agricultural nonpoint source pollution is calculated as follows:
is the total emissions of the agricultural nonpoint source pollution during the cultivated land use. is the statistical number of unit i indicators, which can be obtained based on statistical yearbooks for each region; is the pollution intensity factor of the pollutant of unit i. is the utilization efficiency coefficient of the pollutant of unit i; is the emission factor of the pollutant of unit i. Additionally, we use the formula (equivalent standard pollution emissions = total pollutant emissions/pollutant emission evaluation standards) to convert these emissions to equivalent emissions. The COD, TN, and TP pollutant emission evaluation criteria were set to 20 mg/L, 1 mg/L, and 0.2 mg/L, respectively. The agricultural nonpoint source pollution (O3) is another undesired output indicator. The indicators selected for input and output are listed below (see Table 3).
Table 3.
Evaluation index system of cultivated land use efficiency in major grain-producing areas.
3.4. Data
The basic data of the measure of cultivated land use efficiency originate from the “China Statistical Yearbook (1994–2017)”, “China Rural Statistical Yearbook (1994–2017)”, “New China Statistical Yearbook Compilation”, “Thirty years of reform and opening up statistics compilation”, Chinese Agriculture and Forestry Database in the EPS Data Platform (by Region), China Agriculture and Agriculture Database (by Region), China Science and Technology Database (by region), and China Environmental Database (sub regional).
4. Results and Analysis
4.1. Spatial and Temporal Characteristics of Cultivated Land Use Efficiency under the Constraints of Carbon Emissions and Nonpoint Source Pollution
Relying on the Maxdea7 software platform, based on the DEA, EBM, and SBM super efficiency models, the cultivated land use efficiency values in the main grain-producing areas from 1993 to 2016 were calculated. The DEA super efficiency model calculates the cultivated land use efficiency value without considering the undesired output. The calculation of the EBM and SBM super efficiency models is to consider the cultivated land use efficiency value under undesired output. From Figure 2 and Table 4, it can be observed that the average cultivated land use efficiency in the main grain-producing areas was significantly reduced after considering undesired output. Using the period from 2014 to 2016 as an example, the average efficiency of the undesired output was 0.876, which is the opposite of 0.915. It can be observed that, considering that the undesired output has a significant impact on the measurement of cultivated land use efficiency, the model of high input, high output, and high efficiency is unscientific, and the efficiency evaluation based on undesired output can improve its accuracy and credibility. However, SBM models that also consider undesired outcomes tend to underestimate the efficiency of Decision Making Unit (DMU), because they ignore the linear proportional information. The DEA method deals with the input and output data of all decision-making units (DMUs) to construct a frontier efficiency surface. If DMU's efficiency value is 1, it indicates that the DMU’s input-output combination efficiency is optimal. If the DMU's efficiency value is between 0 and 1, it indicates that the DMU input-output combination is efficient but not optimal. If the DMU's efficiency value is 0, it is an inefficient DMU. The EBM model is a mixed model that includes both radial and SBM model distance functions and can reflect the cultivated land use efficiency more realistically. At the same time, the mean values calculated by the DEA super efficiency model and the SBM super efficiency model are 0.633 and 0.452, respectively. The efficiency value calculated by the EBM super efficiency model is 0.600, which is exactly between the DEA super efficiency model and the SBM super efficiency model.

Figure 2.
Dynamic contrast analysis of cultivated land use efficiency in major grain-producing areas with or without considering the unintended output.
Table 4.
Table of comparison of cultivated land use efficiency in the main grain-producing areas considering and not considering undesired outputs, 1993–2016.
4.1.1. Characteristics of Time Series Changes of Cultivated Land Use Efficiency under the Constraint of Carbon Emissions and Nonpoint Source Pollution
Given the advantages of the EBM super efficiency model, the temporal and spatial differentiation characteristics of cultivated land use efficiency in the main grain-producing areas under the undesired output are examined below, based on the EBM model calculation results. From 1993 to 2016, the value of cultivated land use efficiency in the main grain-producing areas showed a fluctuating upward trend (Figure 2), rising from 0.486 in 1993 to 0.899 in 2016. Judging from the degree of time evolution, the cultivated land use efficiency increased from 1993 to 1996. From 1996 to 2003, the cultivated land use efficiency value showed a declining state, and in 2003, the lowest value in 24 years was 0.463. In 2003, there was an inflection point, and the cultivated land use efficiency showed an upward trend. The reason was that, after 2003, the country focused on building a core food production area, and the central government supported this. Preferential policies such as grain production and agricultural development have gradually shifted to the main grain-producing areas.
On the regional level, this paper divides the main grain-producing area into five regions: Northeast China (Heilongjiang, Jilin, Liaoning), North China Area (Hebei, Inner Mongolia), East China Area (Shandong, Jiangsu, Anhui), Central China Area (Henan, Hunan, Hubei, and Jiangxi) and Southwest China Area (Sichuan). The five regions all experienced the process of the shifting efficiency value from high to low and then to high again. The changes in the five regions were approximately the same, with an overall upward trend, with an average annual increase of 1.77%, 1.60%, 5.54%, and 3.77% and 3.55%, respectively. Additionally, there was a clear regional difference in the cultivated land use efficiency in the main grain-producing areas (Figure 3). The cultivated land use efficiency from 1993 to 2008 was gradually reduced from Northeast China, North China Area, Southwest China Area, Central China Area, and the East China Area. The average difference in cultivated land use efficiency in each region was maintained at 0.005–0.190. The cultivated land use efficiency in Northeast China was the highest in the five regions, with an average efficiency value of 0.693. In addition to the apparent downward trend in 1996–2000, the overall efficiency shows a progressive trend. The main reason is that the Northeast region has actively promoted the control and improvement of cultivation quality and widely promoted the return of crop stalks to fields. In addition, the management quality of cultivated land in Northeast China has increased significantly in recent years, particularly the cultivating rate, the planting rate, the yield, and the large-scale irrigation facilities. Great progress has been made, and the cultivated land use efficiency has been improved.
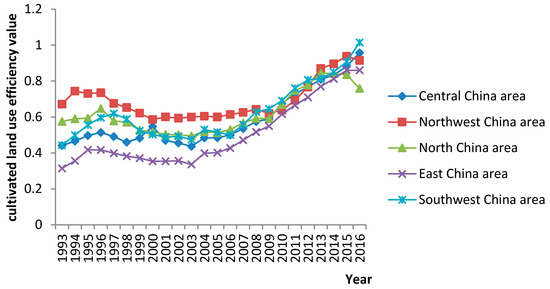
Figure 3.
Trend of cultivated land use efficiency in various regions constrained by carbon emissions and nonpoint source pollution in the major grain-producing areas.
From the provincial level (Figure 4), it is apparent that the cultivated land use efficiency in Heilongjiang, Jilin, Liaoning, Hubei, and Inner Mongolia is relatively high; the average cultivated land use efficiency is 0.635, 0.720, 0.725, 0.621, and 0.733, respectively. The cultivated land use efficiency in other provinces is low, with an average of only 0.388. In 2016, the provinces at the forefront of production were Hubei, Hunan, Jiangsu, Liaoning, and Sichuan, and the provinces effectively represent 38.5%, while the cultivated land use efficiency in other provinces remains in an invalid state. In Jilin and Inner Mongolia, where the cultivated land use efficiency was initially high, there was a degree of deterioration. During the period under review, the cultivated land use efficiency in each province showed a rising trend. However, it is worth noting that the average value of cultivated land use efficiency in the main grain-producing areas from 1993 to 2016 was 0.600. The overall level was extremely low, and there is a great deal of space for efficiency improvement. The reason why the sequence evolution among the main grain-producing areas shows this characteristic is that China is late to focus more on the cultivated land use efficiency in the main grain-producing areas, and the foundation is weak. During the period from 1993 to 2003, the country vigorously developed its planting industry. However, due to the increase in grain production and the expansion of the size of cultivated land during this period, the mode of development was relatively extensive, ignoring the quality and cultivated land use efficiency, particularly the environmental benefits. Due to the waste of resources and the destruction of the environment, the efficiency of this period continues to decline; with the emergence of environmental problems, the Chinese government has placed increasing emphasis on the intensive development of agricultural development and food production since 2003. Since 2004, the Central Committee of the Communist Party of China has issued the No. 1 document with the theme of “Agriculture, Countryside and Farmers” for 14 consecutive years. The document has begun to change the means of using cultivated land, increasing energy conservation and consumption reduction and investing in environmental protection. Due to the serious environmental problems in the early period and environmental protection in the early stage, the marginal effect of input cannot be immediately apparent, and the cultivated land use efficiency temporarily fluctuated. After 2008, particularly after entering the “Twelfth Five-Year Plan” period, with the improvement of the technical level and the marginal effect of the previous environmental protection investment, the cultivated land use efficiency has rapidly improved.
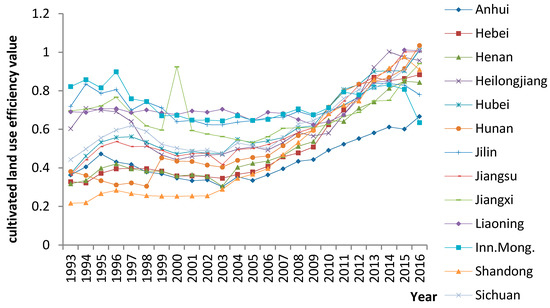
Figure 4.
Temporal change of cultivated land use efficiency in various provinces under the constraints of carbon emissions and nonpoint source pollution in the major grain-producing areas from 1993 to 2016.
4.1.2. Impact of Input–Output Redundancy on the Cultivated Land Use Efficiency.
Through the improvement of the input and output redundancy of the DMU, the cultivated land use efficiency has been improved. The advantage of the EBM model is that it can simultaneously measure the amount of redundancy in the input, the deficit in the desired output, and the redundancy of the undesired output from both the ratio improvement value and the slack improvement value. The superposition of both the ratio improvement value and the slack improvement value is the overall redundancy value.
(1) From the perspective of input (Table 5), the quantity of input redundancy improvement for each period from 1993 to 2016 for other variables besides the input redundancy improvement of the total power of agricultural machinery is reduced in the fluctuations. The improvement in the input redundancy of total agricultural machinery power increased from −724.3 (104 kw) in 1993–1995 to −145.4 (104 kw) in 2014–2016. The amount of redundancies in the input of the employees in the primary industry in agriculture changed the most, from −1067.2 (104 people) in 1993–1995 to –200.7 (104 people) in 2014–2016. The main reason is that, with the continuous development of urbanization and industrialization, increasingly affluent rural laborers continue to flood into the second and third industries of urban construction. The transfer of employees from the primary industry to agriculture will promote the development of agricultural machinery and excessive use of the total power of agricultural machinery. The increase in the level of agricultural mechanization will increase the efficiency of rural production and, in turn, will promote the transfer of an affluent agricultural labor force. However, due to the small per capita cultivated land in China, the failure of agricultural machinery to fully realize its maximum utility will often lead to excessive undesired output [59].
Table 5.
Redundant analysis of input in major grain-producing areas.
At the provincial level (Table 6), the cultivated land use efficiency values in the six provinces of Anhui, Hebei, Henan, Hunan, Jiangsu, and Shandong are all below 0.6, and these provinces have a large amount of input redundancy, which inhibits the improvement of efficiency values. Using Hebei and Shandong provinces as examples, Hebei province’s agricultural machinery total power and effective irrigation area are very prominent in terms of input redundancy. The amount of improvement is −4997.9 (104 kw) and −156.5 (104 hm2), respectively. Compared with Hebei, Shandong Province’s agricultural supplies have more serious redundancy. For example, the quantity of agricultural chemical fertilizers used, the quantity of pesticides used, and the quantity of agricultural plastic film used are −197.6 (104 t), −8.4 (104 t), and −13.5 (104 t), respectively. Excessive use of chemical substances such as chemical fertilizers and pesticides during cultivated land use will lead to a decline in the productivity of cultivated land, declining food quality, and the pollution of water quality, causing serious pollution to the cultivated land ecosystem and the food chain. Although the total agricultural output value can be increased in the short term, it is not conducive to the sustainability of cultivated land use, and it seriously threatens food security and food safety. It can be observed that the improvement of the cultivated land use efficiency in the main grain-producing areas cannot rely solely on the increase in the number of inputs. Excessive investment will lead to a decrease in efficiency. To reduce over-investment, proper control and improvement must be made for various inputs, changing the traditional means of using cultivated land.
Table 6.
The input improvement scales for provinces in the grain-producing regions.
(2) From an output perspective (Table 7), although there was a reduction in the expected output deficit from 1993 to 2016, a large shortage remains. The average expected output deficit from 1993 to 2016 was 23.67 billion yuan. The main reason was that food, as a quasi-public product, has relatively low benefits. Although local governments provide large subsidies, such as agricultural auxiliary facility construction funds and agricultural science and technology expenditures, to the main grain-producing areas, the transfer of food to the main sales areas from the main production areas is actually accompanied by the transfer of grain subsidies [60]. The output of agricultural output is insufficient.
Table 7.
Redundancy analysis of output in the major grain-producing areas.
At the provincial level (Table 8), the input of agricultural materials, such as high-carbon and high-nonpoint-pollution sources, has caused large quantities of carbon emissions and agricultural nonpoint source pollution in the provinces of the main grain-producing areas. For example, cultivated land use efficiency in Shandong Province is 0.501, and the improvement quantities of carbon emissions and agricultural nonpoint source pollution in the province’s output indicators are −295.4 (104 t) and −3069.6 (108 m3), respectively. The cultivated land use efficiency in Henan Province is 0.472, and the improvement quantities of carbon emissions and agricultural nonpoint source pollution are −293.3 (104 t) and −3436.1 (104 t), respectively. The main reason for the undesired output redundancy stems from four factors. First, rural farmers rely on high-pollution substances (such as fertilizers and pesticides) to invest in increasing the output of cultivated land in the short term. The second factor is the backwardness of the agricultural infrastructure, the production methods and the technology. Third, the government’s monitoring and supervision mechanisms for carbon emissions and agricultural nonpoint source pollution are incomplete. Therefore, farmers should ration fertilization, increase straw utilization efficiency, solve the problem of relying heavily on agricultural inputs to increase agricultural output value, reduce carbon emissions during cultivated land use, reduce nonpoint source pollution, and protect the cultivated land ecological environment in the main grain-producing areas. Thus, farmers will promote the green development of cultivated land.
Table 8.
The output improvement scales for provinces in the grain-producing regions.
4.1.3. Spatial Heterogeneity of Cultivated Land Use Efficiency under the Constraint of Carbon Emissions and Nonpoint Source Pollution in the Main Grain-Producing Areas
According to the calculation results of the EBM super efficiency model, and in accordance with the classification method of environmental technology efficiency by Tu [61], the cultivated land use efficiency in the main grain-producing areas is set to 0.6, 0.7, 0.8, and 0.9 as the classification threshold, and the efficiency value is (0, 0.6], (0.6, 0.7], (0.7, 0.8], (0.8, 0.9], and (0.9, 1.5]. The regions are divided into low-efficiency, relatively-low-efficiency, medium-efficiency, relatively-high-efficiency, and high-efficiency regions. Combined with the improvement quantities of carbon emissions and nonpoint source pollution in 13 provinces in the main grain-producing areas, the spatial differentiation characteristics of cultivated land use efficiency in the main grain-producing areas are analyzed as follows:
(1) In 1998, the cultivated land use efficiency of most provinces in the main grain-producing areas was in low-efficiency and relatively low-efficiency regions. The low-efficiency regions included the following: Heilongjiang Province in the Northeast region; East China Area, consisting of three provinces, namely Anhui, Jiangsu and Shandong. The low-efficiency regions also included Hebei Province in the North China Area; Hubei, Hunan and Henan Provinces in the Central China Area; and Sichuan Province in the Southwest China Area. The average cultivated land use efficiency value in low-efficiency regions was only 0.430, which shows a strong agglomeration phenomenon. The low-efficiency regions are accompanied by higher undesired outputs. The average improvement of the redundant output of the undesired outputs of carbon emissions and nonpoint source pollution was −111.47 (104 t) and −2129.6 (108 m3), respectively; the relatively low-efficiency regions mainly include Jiangxi Province in the Central China Area, with an efficiency value of 0.618. The improved values of carbon emissions and agricultural nonpoint source pollution were −343.5 (104 t) and −2996.7 (104 t), respectively. The medium-efficiency regions mainly include Jilin and Liaoning provinces in Northeast China and Inner Mongolia in the North China Area; the average efficiency of cultivated land in the medium-efficiency area was 0.729, and the average improvement quantities of carbon emissions and agricultural nonpoint source pollution was −179.6 (104 t) and −862.6 (104 t), respectively. It can be observed that although the Northeast region and North China Area are concentrated areas with medium-efficiency values, there are more carbon emissions and greater nonpoint source pollution.
(2) In 2004, the distribution pattern of cultivated land use efficiency in the provinces of the main grain-producing regions was basically similar to that in 1998; the provinces in low-efficiency regions were Anhui, Jiangsu, Shandong, Hebei, Hubei, Hunan, Henan Sichuan and Heilongjiang Province. Compared with 1998, the number has only increased in Heilongjiang Province. The efficiency value of Heilongjiang decreased from 0.515 in 1998 to 0.498 in 2004, because more undesired outputs were generated. The carbon emission improvement amount increased from −76.7 (104 t) in 1998 to −178.5 (104 t) in 2004, and the amount of improvement in agricultural nonpoint source pollution increased by −1107.0 (104 t). This finding shows that the negative effects of undesired output such as carbon emissions and agricultural nonpoint source pollution on cultivated land use efficiency tend to increase. Relatively-low-efficiency regions have increased in Jilin and Liaoning provinces in the Northeast region and in Inner Mongolia in the North China Area. The efficiency values of the Northeast and North China Areas show a declining trend.
(3) In 2010, the distribution pattern of cultivated land use efficiency in the main grain-producing areas was compared with that in 2004. Inner Mongolia in the North China Area changed from an originally relatively-low-efficiency region to a middle-efficiency region. Efficiency values increased by 5%. With the increase in efficiency values in provinces such as Anhui, Jiangsu, Shandong, Hebei, Hubei, Hunan, Henan, Sichuan, and Heilongjiang, and the promotion of Sichuan and Hubei provinces to relatively-low-efficiency regions, the number of low-efficiency regions decreased to seven provinces.
(4) In 2016, the cultivated land use efficiency in the main grain-producing areas changed from “contiguous” distribution to “point-like” distribution, and the efficiency value changed greatly. Only two provinces remain in the low-efficiency regions, including Inner Mongolia in the North China Area and Anhui Province in the East China Area. At the same time, a significant increase in the number of areas with relatively-high-efficiency and high-efficiency regions, including Hebei, Henan, Heilongjiang, Jiangxi and Shandong provinces, was observed. The five provinces of Hubei, Hunan, Jiangsu, Liaoning and Sichuan have recently become high-efficiency regions. The carbon emissions and agricultural nonpoint source pollution in these provinces have been greatly reduced, and the cultivated land use efficiency has achieved an effective frontier. In general, low-efficiency provinces are often accompanied by higher undesired outputs. Therefore, the improvement of cultivated land use efficiency requires the improvement of undesired output redundancy. First, we must actively use science and technology to transform agricultural production methods. High-input, high-energy-consumption, and low-efficiency traditional agriculture that depends on chemical fertilizer and pesticide inputs must be transformed into promoting the reduction of fertilizers and pesticides, the harmless use of livestock and poultry manure, and the cleanliness of ecosystems. In addition, modern organic agriculture must be promoted using clean energy sources such as straw methane, biomass, and solar energy. Second, it is necessary to increase the use of land-use wastes through the promotion of science and technology and improve the harmless treatment and recycling of cultivated land waste. Furthermore, we must strengthen the government’s monitoring and assessment of carbon emissions and nonpoint source pollution. Finally, we must strengthen the government’s monitoring and assessment of carbon emissions and nonpoint source pollution, integrate the monitoring of undesired outputs into local agricultural assessment indicators, establish a management and assessment responsibility system for energy conservation and emission reduction, and advocate “resource-saving and environmental friendly protection” for the sustainable use of cultivated land.
4.2. Global Malmquist–Luenberger Index
This paper used the GML index to measure the TFP of cultivated land use in 13 provinces of main grain-producing areas in China from 1994 to 2016, considering undesired outputs, and broke it down into GPTC, GSEC, GPEC, and GSTC to study the measurement results. The GML index is a method used to measure TFP of cultivated land. The index can not only deal with multi-output and multiple-input, as well as the undesired output of environmental pollution caused by production, but also can avoid the problem of linear programming without solution of the traditional ML index, which can be cumulatively accumulated. In turn, the TFP of cultivated land can be calculated more accurately. GPEC indicates the level of environmental governance in major grain-producing areas. GSEC indicates the scale of the economy in major grain-producing areas. The GPTC is a standard that distinguishes technical progress in various regions of the main grain-producing areas. The GSTC indicates the interactive relationship between economic scale and technological progress. The specific results are shown in Figure 5, Figure 6 and Figure 7.
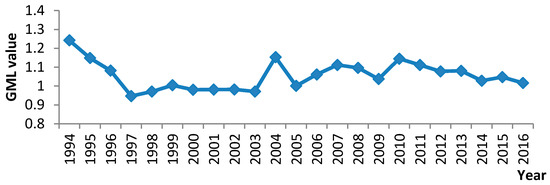
Figure 5.
Evolution of local agglomeration patterns of inter-provincial cultivated land use efficiency in the main grain-producing areas from 1993 to 2016.
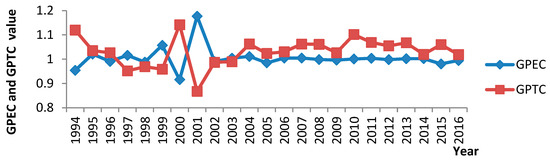
Figure 6.
Global Malmquist–Luenberger (GML) index of major grain-producing areas 1994–2016.

Figure 7.
Changes in Global Pure Efficiency Change (GPEC) and Global Pure Technological Change (GPTC) under the constraints of carbon emissions and nonpoint source pollution in major grain-producing areas from 1993 to 2016.
(1) From the analysis of the time series (see Figure 8), the TFP of cultivated land use in the main grain-producing areas showed fluctuating changes. Under the constraints of carbon emissions and agricultural sources, the TFP of cultivated land use in the main grain-producing areas showed a decline in the volatility trend from 1994–2016. During the period from 1994 to 1997, the significant decline in GPTC and GSTC led to a significant decline in the GML index. During this period, the level of agricultural science and technology was low, and the development of agricultural industrialization lacked motivation. In addition, due to the small amount of cultivated land per capita in China and the high fragmentation of cultivated land, it is very difficult to mechanize operations. Therefore, it is necessary to increase investment in science and technology and improve productivity by improving resource allocation. During the period from 2002 to 2014, the volatility ranges of the GPTC and GSTC indices were approximately the same as the volatility of the GML index. During this time, the main grain-producing areas greatly increased agricultural investment, further improved agricultural infrastructure construction, promoted the development of agriculture, and improved technological progress that can improve the TFP of cultivated land use. However, although the GSTC and GPTC improved to an extent during the period from 2014 to 2016, the decline in GPEC and GSEC caused a reduction in the GML index within a small range. There are two main reasons. First, the input and output structure at this stage is irrational; the over-demand of urban construction land and the implementation of policies such as returning cultivated land to grassland result in the continuous loss of cultivated land resources and a reduction in the size of cultivated land. Moreover, due to the excessive input of agricultural materials, such as pesticides, fertilizers and agricultural machinery, as well as carbon emissions and agricultural nonpoint source pollution, the cultivated land has become polluted, and it is not suitable for farming. The TFP of cultivated land use in the main grain-producing areas has declined. Second, due to the rapid socioeconomic development and the impact of urbanization and industrialization, the increase in the cost of agricultural production opportunities has led to the shift of a large number of affluent agricultural laborers to secondary and tertiary industries. A large amount of cultivated land is idle, and it is continuously occupied by urban construction land. The input of factors, the scale of cultivated land, and the TFP of cultivated land use have decreased.

Figure 8.
Changes of Global Scale Efficiency Change (GSEC) and Global Scale Technological Change (GSTC) under the constraints of carbon emissions and nonpoint source pollution in major grain-producing areas from 1993 to 2016.
(2) From the perspective of spatial differentiation, the mean value of the GML index of the provinces in the main grain-producing areas from 1994 to 2016 was supported by ArcGIS 10.1 software. The natural discontinuous point classification method was used to determine the TFP of cultivated land use in the main grain-producing areas. The growth situation is divided into four categories: low (), relatively low (), medium (), and high (). It can be observed that the efficiency of the 13 provinces has generally improved. The high-grade regions are mainly distributed in Shandong, Jiangsu, and Hunan Province in the Central China Area. The middle-grade regions are mainly distributed in Heilongjiang and Liaoning in Northeast China, Hebei Province in the North China Area, and Hubei and Jiangxi Provinces in the Central China Area. The relatively low-grade regions mainly include Hunan Province in the Central China Area, Anhui Province in the East China Area and Sichuan Province in the Southwest China Area. The low-grade region is Inner Mongolia in the North China Area. Figure 9 shows that there is a serious regional imbalance in the distribution of the TFP of cultivated land use in the main grain-producing areas in China, and there is a “point-like” distribution trend in the distribution.

Figure 9.
Classification of the mean value of GML indices for provinces in the main grain-producing regions in consideration of unintended output.
(3) From the perspective of the GML index and the analysis of provinces in the main grain-producing areas (see Table 9), although the TFP of cultivated land use in Anhui, Jilin and Inner Mongolia was progressive, progress was slow. The main reason for this is the decline of GPEC and GSEC; this indicates that these provinces often ignore the emission of pollutants in the process of the technological advancement of cultivated land use. The growth of agriculture in these provinces is at the expense of the ecological environment. Advances in production technology have led to a greater increase in the TFP of cultivated land use than in the production of pollutants, which has caused serious damage to the ecological environment. Although both GPEC and GSEC are growing in Hunan and Sichuan provinces, the growth speed is slow relative to GPTC and GSTC. The growth speed of the TFP of cultivated land use in other provinces is relatively fast. The increase in the efficiency of these provinces mainly depends on the progress of GPEC and GSTC. The technical progress has a greater effect on the TFP of cultivated land use in these provinces than the scale efficiency. For Jiangxi, Liaoning and Heilongjiang provinces, the growth of the TFP of cultivated land use mainly depends on the growth of GSTC, and the promotion effect of GSTC is greater than that of GPTC, GPEC, and GSEC. This finding shows that under the conditions of adequate agricultural capital and advanced production equipment, it is necessary to tie in with the increase in the scale of cultivated land management to increase the TFP of cultivated land use. Due to the large number of agricultural laborers in China, the per capita cultivated land area is significantly smaller than in other developed countries in the world. With the exception of a small portion of cultivated land with abundant resources, the amount of cultivated land in most areas is very small. The small scale of cultivated land and the long-term lack of rural infrastructure will lead to higher production costs for farmers using advanced agricultural farming techniques. Therefore, the government needs to regulate the land circulation market; establish assessment, consulting and notary agencies related to land transfer; and reduce land transfer costs to attract more farmers and promote the scale of peasant farmers and the scale of cultivated land operations that match modern production agriculture technologies. For Hebei and Henan, compared to other provinces, there is no substantial difference in the changes of GSEC and GSTC, and the improvement of cultivated land use efficiency mainly depends on the progress of GPTC. This finding shows that, in the cultivated land use process, it is necessary to accord full play to the support functions of agricultural research institutions for agricultural production technology, encourage more agricultural scientists and technicians to invest in the agricultural production of cultivated land, and promote the use of agricultural production technology [62]. It is also necessary to vigorously develop vocational and technical education in rural areas and focus on farmers’ labor skills training. In summary, under the constraints of carbon emissions and agricultural nonpoint source pollution, the TFP of cultivated land use in the main grain-producing areas in China has shown an overall upward trend. The inter-provincial analysis shows large differences in the TFP of cultivated land use. Changes in GPTC and GSTC are the main driving forces for the TFP of cultivated land use growth in the main grain-producing areas, while GPEC and GSEC are the bottleneck for the growth of the TFP of cultivated land use in all provinces.
Table 9.
GML index for provinces (regions) of major grain-producing areas from 1998 to 2016.
4.3. Absolute Convergence Analysis of Cultivated Land Use Efficiency
4.3.1. Absolute -Convergence Test
The -convergence test describes the horizontal trend of the differences in cultivated land use efficiency among the different provinces in the main grain-producing areas and whether the differences between provinces will decrease with time. In the research, this paper applies traditional statistical indicators such as standard deviation and coefficient of variation to measure the degree of dispersion among provinces. Using cultivated land use efficiency as an example, represents the cultivated land use efficiency level of each province in the main grain-producing areas, represents the average cultivated land use efficiency in the main grain-producing areas, and represents the number of provinces included in the main grain-producing areas. is the standard deviation, and is the coefficient of variation. The standard deviation and coefficient of variation are calculated as:
Based on the above calculation results, the standard deviation and coefficient of variation of the cultivated land use efficiency in the main grain-producing areas in China from 1993–2016 were calculated. The results are shown in Figure 10. The inter-provincial standard deviation and coefficient of variation showed upward and downward fluctuations. In 2000, the peaks were reached and the -convergence showed a divergence. This finding was strongly related to the reform of the economic system at that time because, at the end of the 20th century, China implemented a policy of the full opening of coastal cities, and the economic development of the southern provinces was faster than that of the northern provinces. China’s grain region continued to shift from the south to the north, and the original south-to-north grain transfer gradually changed to a north-to-south grain transfer, making cultivated land use efficiency in the northern provinces different from that of the southern provinces. Between 2000 and 2010, in addition to significant growth in 2003, the standard deviation and coefficient of variation of the cultivated land use efficiency have been variably decreasing, and cultivated land use efficiency has shown a -convergence trend. After 2010, there was a clear trend of divergence, indicating that the difference in cultivated land use efficiency among the provinces in the main grain-producing areas will not automatically disappear, and the differences between the provinces’ efficiency values will continue to exist.
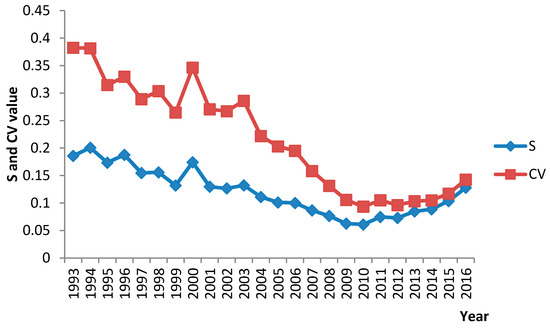
Figure 10.
Evolution trend of the standard deviation and coefficient of variation of environmental economic efficiency in the provinces of the major grain-producing regions in China.
4.3.2. Absolute -Convergence Test
Absolute -convergence is a necessary and insufficient condition for absolute -convergence. The cultivated land use efficiency in different provinces eventually converges, and it must be ensured that provinces with low cultivated land use efficiency have faster growth rates than provinces with high cultivated land use efficiency. Therefore, although there is no absolute -convergence, it cannot be concluded that there is no absolute -convergence phenomenon. Since the absolute -convergence is sensitive to the time span, this article uses the model proposed by Barro and Sala-i-Martin [62] to test the absolute -convergence. The model is as follows:
In the formula, represents the time period examined. represents the value of cultivated land use efficiency at the beginning of province in the main grain-producing areas. . represents the value of cultivated land-use efficiency at the end of province . in the main grain-producing areas.; is the interception term. is the estimated coefficient, and is the error item. If the estimated coefficient is negative and statistically significant, it means that the rate of increase in the cultivated land use efficiency is negatively correlated with the value of initial cultivated land use efficiency. The provinces with low cultivated land use efficiency are growing faster than those with high cultivated land use efficiency. Absolute -convergence exists. The result of the above -convergence is used as the basis for the time division. From Figure 10, it can be seen that 2000 and 2010 were the turning points of the standard deviation and coefficient of variation of cultivated land use efficiency. The authors regard 2000 and 2010 as the criteria for dividing the time period and divides the period from 1993–2016 into three time periods, considering the overall convergence of 1993–2016. Thus, this paper divides the absolute test of cultivated land use efficiency in the main grain-producing areas in China into four time periods: from 1993 to 2000 (based on 1993 as the base year), 2000 to 2010 (based on 2000 as the base year), 2010 to 2016 (based on 2010 as the base year). The period 1993 to 2016 (based on 1993 as the base year) examines the -convergence of the cultivated land use efficiency values over the entire study period. The results are shown in the table below.
Table 10 shows the absolute -convergence test results of cultivated land use efficiency in the main grain-producing regions in China. From the results of the regression, in the past 24 years, there was indeed an absolute convergence between the provinces, and the regression coefficient is negative and significant in the convergence equation of the cultivated land use efficiency. It can be observed that the differences in cultivated land use efficiency between provinces will automatically disappear over time. Provinces with low efficiency at the beginning of the period have faster growth rates than provinces with high efficiency. However, in the period from 2010 to 2016, there was no absolute -convergence between provinces, showing a divergent trend. The main reason for this is that, under the conditions of the continuous emergence of new technologies and the unfavorable extension of agricultural technology, provinces with high cultivated land use efficiency have higher technical efficiency, and their cultivated land use efficiency has grown faster than provinces with low cultivated land use efficiency.
Table 10.
Absolute beta convergence test for the economic efficiency of cultivated land in major grain-producing areas.
At the same time, due to the relative lack of resources and environmental treatment technologies in the field of cultivated land use in China and the many problems in the promotion of agricultural technology, there will be less imitation and spread of cultivated land use environmental treatment technologies. Therefore, the rate of improvement in the cultivated land use efficiency in low-efficiency areas is suppressed. Shi’s research found that in recent years, severe flooding and drought disasters have frequently occurred in the major grain-producing areas. Climate change has led to a prominent contradiction between water supply and demand in China. The lagging and scarcity of cultivated land water conservancy construction remains the biggest flaw affecting the stable development of agriculture and national food security. In addition, due to the large-scale transformation of the low-yielding fields, long duration, and slow success, excellent varieties and cultivation techniques also need to work well on the basis of improved infrastructure. With regard to the structure of current agricultural scientific research projects, most agricultural research projects are designed to pursue high-yield targets. Therefore, the high-yield and super-high-yield results are usually achieved in high-yielding demonstration fields and high-yield areas, but there is relatively little research on improving the production of low-yield fields [63]. Agricultural technology promotion also has many problems. The 2003 Agricultural Policy Research Center of the Chinese Academy of Sciences in Hubei, Guangdong, Heilongjiang, Gansu and other seven provinces showed that the grass-roots agricultural extension agencies in the first line of China’s agricultural technology promotion have been basically in a state of paralysis, with serious personnel losses [64]. According to statistics, 44% of county-level agricultural technology extension agencies and 43% of township promotion agencies in the country have had their operating expenses cut or suspended, and their work funds are very tight. Nearly 1/3 of the technicians have left their agricultural posts. The departure of agricultural technicians will hinder the promotion of agricultural technology [65]. Agricultural technology promotion still has the disadvantages of a single promotion method and backward promotion methods. At the same time, promotion work still lacks a certain pertinence. Taking into account the characteristics of farmers’ technology, the promotion of agricultural technology is formalized. The above reasons are the main reasons for the inconspicuous convergence of cultivated land use efficiency.
According to the following formula, we can calculate the convergence speed : . The absolute convergence speed was 0.191% from 1993 to 2016, indicating that there was convergence between provinces in the main grain-producing regions; the convergence speed was slow. With regard to areas where the cultivated land use efficiency is less efficient, they are slow to catch up with areas with high cultivated land use efficiency. This can be illustrated by the indicator of half-life cycle . represents the time required for the lower regions to catch up with the higher regions. According to the estimated value of the convergence coefficient , the half life cycle of the convergence can be calculated. The formula is as follows: . Calculated half life cycle up to 362.90 years. That means that the time required for the lower efficiency areas to catch up with the higher efficiency areas was 362.90 years. The average speed of convergence in 24 years was 0.008%. Therefore, the convergence speed was slow.
5. Discussion and Policy Implications
5.1. Discussion
The lack of research in this article and the aspects that need further study in the future are mainly manifested in the following aspects. First, with regard to the time scale, only the spatial and temporal patterns of cultivated land use efficiency in the main grain-producing areas have been studied since 1993, and the scale of time is relatively short. Long-term sequences are more able to explain the regular pattern and trends of research objects. For instance, Lu summarized the general situation of China’s intensive cultivated land use in the past 30 years, and concluded that the analysis of long-term sequence data has obvious advantages in exploring changes in trends and trends of intensive cultivated land use, especially in facilitating the development of both time and space. Coupled analysis makes it easier to draw meaningful results [66]. Thus, there remains a need to further study the law of space–time differentiation of cultivated land use efficiency in the main grain-producing areas in China on a long-term scale. Second, considering the availability and operation of the data, the evaluation index system for cultivated land use efficiency remains insufficiently comprehensive. Referring to the existing literature on the cultivated land use efficiency, it was found that the vast majority of existing studies have been considered from three aspects, using traditional indicators such as land, labor, and capital. There is a big shortage in the construction of the indicator system. For example, DEA calculations cannot reflect the initial differences in the quality of cultivated land, soil fertility, natural environment, and socio-economic conditions. This will lead to biased estimates of the use of cultivated land. At the same time, the evaluation of cultivated land use efficiency failed to reflect the loss of cultivated land use efficiency caused by industrial pollution, due to the lack of data on soil pollution caused by industrial development [23]. In addition, micro-input indicators, such as crop improvement and field farming techniques, need to be included in the evaluation index system, and the selection of factor indicators should be followed by improvements. Third, with regard to the spatial scale, Wang analyzed the problem of the scientific regulation of the sustainable use of land at the county level, and considered that the county economy constitutes an important part of the economy of the country, the province, and the central city. The county-level scale is a complete grass-roots unit for administrative management in China, and the county-level economy is the basis for China’s national economy. Similarly, the county-level scale is also the best scale for the sustainable use, management, and planning of land resources in China [67]. This paper only measures the cultivated land use efficiency in the main grain-producing areas from the provincial level; there is a lack of research into the cultivated land use efficiency inside the main grain-producing areas. Thus we should further study the city-level and the country-level of the main grain-producing areas in China. Fourth, the unit survey assessment method and the inventory analysis method adopted for agricultural nonpoint source pollution do not consider the impact of the different types of land use and chemical fertilizer application intensity on nonpoint source pollution. Future research needs to establish improved scientific agricultural nonpoint source pollution detection and an environmental statistical accounting system. Fifth, different scholars study different factors influencing the improvement of cultivated land use efficiency. For example, Yang analyzed the impact of aging on farmers’ cultivated land use efficiency. As a result, it was found that aging does not necessarily lead to a decline in farmers’ cultivated land use efficiency. If health is good, even if they are old, their cultivated land use efficiency may be higher than that of young peasant households [68]. The existing research only analyzes the impact factors of China’s cultivated land use efficiency at the national level, but there is a lack of analysis of the regional differences in the factors affecting the cultivated land use efficiency. However, due to the differences in natural source conditions and social and economic development levels between regions, there are significant differences in the factors affecting cultivated land use efficiency. Analysis of the regional differences in the factors affecting the cultivated land use efficiency can determine the dominant factors affecting the cultivated land use efficiency in each region, which in turn will help China to implement selective and regionally differentiated policies to support agricultural development in accordance with local conditions, promoting the rapid development of modern agriculture. The analysis of influencing factors of cultivated land use efficiency in the main grain-producing areas and future optimization measures will be further improved in future research.
5.2. Policy Implications
(1) Reduce the total quantity of carbon emissions and agricultural nonpoint source pollution in cultivated land use through technological innovation, structural adjustment, and resource integration. Change the mode of cultivated land use as the strategic focus of current and future cultivated land management, improve carbon emissions from cultivated land via an agricultural nonpoint source pollution detection and assessment system, and increase investment in pollution control.
(2) Explore diversified protection systems and mechanisms for the use of a low-carbon, low-agricultural nonpoint source pollution in cultivated land and establish a low carbon and low agricultural nonpoint source pollution monitoring center for cultivated land use. Efforts will be made to improve the design of ecological environmental compensation systems for cultivated land use in the main grain-producing areas, to establish a reasonable mechanism for compensation and relief of cultivated land environmental protection as soon as possible, to focus on controlling carbon emissions and agricultural nonpoint source pollution from cultivated land use, and to develop clean production of cultivated land and provide a clean and safe ecological environment for cultivated land use.
(3) From Section 4.1.2 on the impact of the input–output redundancy on the cultivated land use efficiency, we could draw the conclusion that undesired output redundancy is mainly due to the following two aspects: first, farmers reliance on high-intensity inputs to achieve a short-term increase in cultivated land output; and second, irrational farming methods and the fall of production methods and technologies. At present, the traditional energy use of cultivated land not only seriously pollutes the environment, but also harms people’s health. It also causes excessive greenhouse gas emissions, exacerbates the greenhouse effect, and causes agricultural nonpoint source pollution, resulting in various natural disasters. New energy has the advantage of being renewable, nonpolluting, and widely distributed. Therefore, the development of new energy technologies for cultivated land and adopting a sustainable development path with low energy consumption and low emissions are the most important factors in modern cultivated land use [69]. As the use of chemical substances, such as chemical fertilizers, pesticides, and other chemicals, in the use of cultivated land cause damage to the ecological environment of the cultivated land, we must actively use science and technology to realize the transformation of cultivated land use methods. The traditional means of using cultivated land are based on chemical fertilizers, high inputs, high energy consumption, and low profitability, and depend mainly on chemical fertilizers, pesticides, and growth promoters. To promote the reduction of chemical fertilizers, a reduction in pesticides, the harmless use of livestock and poultry manure, and the cleanliness of ecosystems, we will vigorously popularize the use of modern methods of cultivated land use, such as straw methane, biomass, and solar energy.
(4) Due to the advancement of pure technical efficiency and technological scale efficiency, these are the main driving forces for the advancement of the TFP of cultivated land use. Therefore, it is necessary to increase scientific and technological investment in the main grain-producing areas, focusing on cultivating practical talents adapted to the low-carbon use of cultivated land and the use of low-agricultural nonpoint source pollution, and improving the basic knowledge and qualities of cultivated land use subjects. Additionally, by regulating the land circulation market, using local finances to subsidize farmers off the land, encouraging land circulation and financial sector reforms and other measures to promote land circulation, will help farmers to achieve large-scale operations and intensive production, easing the use of small cultivated plots of land under the system’s high energy pressure. Xu divides the types of farm households based on the size of the households’ cultivated land. Based on the survey data on farmers in some districts and counties in the Wuhan city circle, the DEA–Tobit model was used to analyze the influence of the fragmentation of cultivated land on the cultivated land use efficiency. The results of the study indicate that: (1) the average cultivated land management area for small-scale farmers is 0.194 hm2, and the cultivated land use efficiency is 0.360. The average cultivated land management area for middle-scale farmers is 0.492 hm2, and the cultivated land use efficiency is 0.446; the average large-scale cultivated land management area is 1.179 hm2, and the cultivated land use efficiency is 0.497. The cultivated land use efficiency was positively correlated with the scale of farmers’ cultivated land management. The study concluded that the transfer of cultivated land is conducive to the optimization of the allocation of land, capital, technology, labor, and other factors of production, to improve the cultivated land use efficiency, and to promote the large-scale management of cultivated land. (2) In the process of vigorously promoting the large-scale operation of agriculture, we must reduce the degree of fragmentation in order to improve the technical efficiency of the cultivated land use efficiency; and an effective way to reduce the fragmentation is to organically integrate cultivated land remediation and the transfer of cultivated land. Only the combination of cultivated land remediation and the transfer of cultivated land can increase the scale of the plots, make the shape of the plots more regular, and make the plots more even, and the agricultural infrastructure more complete. However, in the practice of cultivated land remediation and cultivated land transfer, we must respect the wishes of farmers and safeguard farmers’ rights and interests [70]. Zu studied the relationship between the fragmentation of cultivated land and its utilization efficiency in hilly areas of southwest mountainous areas, and the adoption of land consolidation, ownership adjustment, land exchange, land transfer, etc. The area of contracted land reached more than 1000 m2, which is extremely beneficial to improving the cultivated land use efficiency and irrigation efficiency. The study found that under the influence of the fragmentation of cultivated land and the existing level of mechanization, the cultivated land use efficiency showed a decreasing trend with the degree of the fragmentation of cultivated land. The cultivated land will be transferred and remediated in order to promote the expansion of the cultivated land scale. In addition, the provision of corresponding farming facilities and irrigation facilities and improved farming practices in the region are significant for the realization of a modest scale of land management and the improvement of the cultivated land use efficiency [71]. Specific measures can also be achieved through the following: land consolidation, the integration of scattered small plots into large plots, the transformation of irregularly shaped plots into regularly shaped plots, the improvement of the operating conditions of agricultural machinery, the provision of full play to the potential of agricultural science and technology, and the improvement in the cultivated land use efficiency.
(5) The slow promotion of agricultural technology has led to a slow convergence of cultivated land use efficiency in the main grain-producing areas in China. It is necessary to establish a government-led organization that will promote diversified agricultural technology, reform the management system and operating mechanism of the agricultural technology extension system, and separate the public welfare function from the operational one. The government should improve the relevant laws and regulations for the promotion of agricultural technology, increase government investment in agricultural science and technology, implement the access system for agricultural technology promotion qualifications, and strengthen the management of various types of agricultural technology service organizations. Finally, we must also focus on strengthening the development of agricultural technology promotion talents.
6. Conclusions
In this paper, the EBM efficiency model was used to measure the value of cultivated land use efficiency under the constraint of carbon emissions and nonpoint source pollution in the main grain-producing areas from 1993–2016. Additionally, the GML index was used to measure the TFP of cultivated land use in the main grain-producing areas from 1994 to 2016 and break it down into GPTC, GSEC, GPEC, and GSTC. A convergence analysis of the cultivated land use efficiency in the main grain-producing areas was performed. The main conclusions are as follows:
(1) From 1993 to 2016, the cultivated land use efficiency under the constraint of carbon emissions and nonpoint source pollution in the main grain-producing areas showed a tendency to fluctuate and increase, with significant phase characteristics, and the overall efficiency was not high. A huge gap remains between the actual output in most regions and the ideal output under the existing input level. This finding shows that, in the cultivated land use efficiency process in the main grain-producing areas in China, problems such as the waste of inputs, insufficient agricultural output value, and environmental pollution remain. The contradiction between carbon emissions and agricultural nonpoint source pollution and the improvement of cultivated land use efficiency has become increasingly acute.
(2) The cultivated land use efficiency under the constraints of carbon emissions and nonpoint source pollution in all provinces varies greatly, and the overall performance is “continuous” distribution. However, in 2016, this distribution shifted from the original “continuous” distribution to “pointed” distribution. Overall, the cultivated land use efficiency in the North China Area, Northeast China, and Southwest China Area are higher than in the Central China Area and the East China Area. The geographical location and climate environment of the provinces in the central region are better than those in the northern region. Theoretically, the cultivated land use efficiency value should be higher than that in the northern region. The reason for this finding may be that, in addition to the reform of China’s economic system, China’s grain region has continued to shift from the south to the north. The gradual transformation from the original south-to-north grain transfer to the north-to-south grain transfer made the cultivated land use efficiency in the northern provinces higher than that of the southern provinces.
(3) From 1994 to 2016, the TFP of cultivated land use under the constraints of carbon and nonpoint source pollution in the main grain-producing areas of China was greater than 1, and the overall productivity in the dynamics increased, indicating that the productivity levels of the provinces in the main grain-producing areas of China improved. From the perspective of the analysis of the GML index, under the constraints of carbon emissions and agricultural nonpoint source pollution, the TFP of cultivated land use in the provinces of the main grain-producing areas was uneven. Changes in GPTC and GSTC dominated the process of promoting the TFP of cultivated land use. The backwardness of GSEC and GPEC among the different provinces is the main reason for the slow growth of the TFP of cultivated land use in certain provinces. Therefore, it is necessary to actively promote the circulation of land and to promote the scale of cultivated land such that the scaled operations of tenant farmers match modern agricultural technology production.
(4) In the past 24 years, in China, there has been convergence in the cultivated land use efficiency under the constraints of carbon emissions and nonpoint source pollution in the provinces of the main grain-producing areas in China. This finding shows that the areas with low cultivated land use efficiency are faster than those with high cultivated land use efficiency at the beginning of the year; however, the convergence speed is slow. Additionally, the absolute β-convergence characteristics of the main grain-producing areas in the most recent eight years were not significant. The main reason for this is that, under the conditions of the continuous emergence of new technologies and the unfavorable extension of agricultural technology, areas with high cultivated land use efficiency have higher technical efficiency, and the growth speed of high cultivated land use efficiency is faster than that of low cultivated land use efficiency. At the same time, due to the level of cultivated land use efficiency under the constraint of carbon emissions and agricultural nonpoint source pollution, the relative lack of resources and environment treatment technologies in the field of cultivated land use in China will lead to lesser imitation and the spread of cultivated land use environment treatment technologies.
Author Contributions
H.X. and Y.C. developed the original idea for the study. Y.Z. was responsible for data collection. Y.Z. conducted the data analyses. All the authors contributed to drafting the manuscript and approved the final version of the manuscript.
Acknowledgments
This study was supported by the National Natural Science Foundation of China (No. 41561040), the Key projects of the National Social Science Fund of China (No. 15AZD075), Funding Project for Academic and Technical Leaders in Major Disciplines of Jiangxi Province (20172BCB22011), the Technology Foundation of Jiangxi Education Department of China (No. KJLD14033 & No. GJJ160431) and the Fok Ying-Tung Fund (No. 141084).
Conflicts of Interest
The authors declare no conflict of interest.
References
- Liu, Y.S.; Qiao, L.Y. Cultivated land protection system and policy innovation under the background of new urbanization in China. Econ. Geogr. 2014, 34, 1–6. [Google Scholar]
- Li, B. Study on the Carbon Emission of Agricultural Land Utilization and Emission-Reducted Policy in China. Ph.D. Thesis, Huazhong Agricultural University, Wuhan, China, 2011. [Google Scholar]
- Li, Y.; Huang, X.J.; Zhen, F. Carbon emission effects of different land use patterns in Jiangsu Province. Chinese. J. Agric. Eng. 2008, 24, 102–107. [Google Scholar]
- Liu, Y.H.; Ye, S.F.; Xu, C.H.; Qiu, L.F.; Yuan, Y.G. Hazards caused by agricultural non-point source pollution on farmland soil environment. China Agric. Inf. 2016, 12, 100–103. [Google Scholar]
- Cheng, B.; Zhang, Z.; Chen, L.; Yuan, Z.H.; Sun, X.R. The Eutrophication of Water in Taihu Lake and the Control of Agricultural Non-Point Source Pollution in Watershed. J. Agro-Environ. Sci. 2005, Z1, 118–124. [Google Scholar]
- Zhang, W.L.; Wu, S.X.; Ji, H.J.; Kolbe, H. Estimation of Agricultural Non-Point Source Pollution in China and the Alleviating Strategies I. Estimation of Agricultural NonPoint Source Pollution in China Early 21 Century. Sci. Agric. Sin. 2004, 37, 1008–1017. [Google Scholar]
- Pang, Y.; Zhang, Q.J.; Ye, Y.G.; Ou, M.H. Quantitative Economic Analysis of China’s Cultivated Land Use Efficiency. Geogr. Geogr. Inf. Sci. 2004, 4, 40–43. [Google Scholar]
- Wang, K.; Zhang, P. The Research on Impact Factors and Characteristic of Cultivated Land Resources Use Efficiency—Take Henan Province, China as a Case Study. IERI Procedia 2013, 5, 2–9. [Google Scholar] [CrossRef]
- Ye, H.; Pu, L.J. Regional Difference and Convergence of Cultivated Land Use Efficiency in China. J. Nat. Resour. 2011, 26, 1467–1474. (In Chinese) [Google Scholar]
- Wang, L.J.; Li, H. Regional differences of arable land use efficiency and its influencing factors in China: Panel data and stochastic frontier production function method based on 281 cities. Geogr. Res. 2014, 33, 1995–2004. [Google Scholar]
- Bonfiglio, A.; Arzeni, A.; Bodini, A. Assessing eco-efficiency of arable farms in rural areas. Agric. Syst. 2017, 151, 114–125. [Google Scholar] [CrossRef]
- Song, X.Q.; Ou, Y.Z.; Li, Y.S.; Li, F.D. Cultivated land use change in China, 1999–2007: Policy development perspectives. J. Geogr. Sci. 2012, 22, 1061–1078. [Google Scholar] [CrossRef]
- Chen, L.; Song, G.; Meadows, M.E.; Zou, C. Spatio-temporal evolution of the early-warning status of cultivated land and its driving factors: A case study of Heilongjiang Province, China. Land Use Policy 2018, 72, 280–292. [Google Scholar] [CrossRef]
- Liang, L.T.; Qu, F.T.; Wang, C.H. Analysis on cultivated land use efficiency based on DEA. Resour. Environ. Yangtze Basin 2008, 2, 242–246. [Google Scholar]
- Yang, C.H.; Wu, L.; Lin, H.L. Analysis of total-factor cultivated land efficiency in China’s agriculture. Agric. Econ. 2010, 5, 231–242. [Google Scholar] [CrossRef]
- Zhang, R.T.; Jiao, H.F. Analysis of the spatial-temporal pattern and mechanism of inter-provincial arable land use efficiency in China. Chin. J. Agric. Eng. 2015, 31, 277–287. [Google Scholar]
- Zhang, X.; Liu, X.H.; Liu, Y. Research on Cultivated Land Use Efficiency and Its Influencing Factors in Gaojia Town Based on DEA. J. Southwest China Normal Univ. 2012, 37, 72–77. [Google Scholar]
- Dai, J.; Peng, W.Y.; Lian, L.; Li, Z.W. Cultivated Land Use Efficiency Based on DEA in Black Soil Region of Northeast China: A Case Study of Nenjiang County. J. Arid Land Resour. 2017, 31, 38–43. [Google Scholar]
- Feng, X.H.; Zhou, B.T.; Chen, H. Analysis of Cultivated Land Use Efficiency Based on DEA Method—A Case Study of Fengdu County, Chongqing. Chin. Agric. Sci. B 2011, 27, 249–253. [Google Scholar]
- Li, X.; Ou, M.H.; Ma, X.L. Study on Effects of Fragmentation on Cultivated Land Use Efficiency Based on Landscape Index—A Case Study of Lixia River Region in Yangzhou City. J. Nat. Resour. 2011, 26, 1758–1767. [Google Scholar]
- Lu, X.H.; Kuang, B.; Li, J. The Regional Differences and Impact Factors of Cultivated Land Use Efficiency under Carbon Emission Constraints. J. Nat. Resour. 2018, 33, 657–668. [Google Scholar]
- Liu, Y.H.; Wu, P. Analysis on the Farmland Utilization Efficiency of China’s Agricultural Total Factor and Its Influencing Factors in the Transitional Period. Financ. Res. 2011, 7, 114–127. [Google Scholar]
- Feng, Y.G.; Peng, Y.; Deng, Z.B.; Wang, J. Spatiotemporal differentiation of China’s arable land use efficiency from the dual perspective of non-point source pollution and carbon emissions. China Popul. Resour. Environ. 2015, 25, 18–25. [Google Scholar]
- Yang, S.; Li, S.P.; Nie, P. Regional Difference and Convergence of Total Factor Productivity of Cultivated Land in Shaanxi Province. Forum Stat. Inf. 2013, 28, 82–88. [Google Scholar]
- Xie, H.; Wang, W.; Yang, Z.; Choi, Y. Measuring the sustainable performance of industrial land utilization in major industrial zones of China. Technol. Forecast. Soc. 2016, 112, 207–219. [Google Scholar] [CrossRef]
- He, Y.; Xie, H.; Fan, Y.; Xie, X. Forested Land Use Efficiency in China: Spatiotemporal Patterns and Influencing Factors from 1999 to 2010. Sustainability 2016, 8, 772. [Google Scholar] [CrossRef]
- Xie, H.; Chen, Q.; Wang, W.; He, Y. Analyzing the green efficiency of arable land use in China. Technol. Forecast. Soc. 2018. [Google Scholar] [CrossRef]
- Yue, L.; Li, W.B. The Cultivated Land Use Efficiency and Its Influence Caused by Environmental Constraints in China: Based on Global Malmquist-Luenberger Index Method. Agric. Econ. Manag. 2017, 6, 25–35. [Google Scholar]
- Du, J.; Wang, R.; Wang, X.H. Environmental Total Factor Productivity and Agricultural Growth: A Two-Stage Analysis Based on DEA-GML Index and Panel Tobit Model. Chin. Rural Econ. 2016, 3, 65–81. [Google Scholar]
- Xie, H.; Wang, W. Spatiotemporal differences and convergence of urban industrial land use efficiency for China’s major economic zones. J. Geogr. Sci. 2015, 25, 1183–1198. [Google Scholar] [CrossRef]
- Li, G.; Zeng, X.; Zhang, L. Study of Agricultural Productivity and Its Convergence across China’s Regions. Rev. Reg. Stud. 2008, 38, 361–379. [Google Scholar]
- Tian, W.M.; Wan, G.H. Technical efficiency and its determinants in China’s grain production. J. Prod. Anal. 2000, 13, 159–174. [Google Scholar] [CrossRef]
- Zhao, C.P. Analysis of Cultivated Land Production Efficiency and Its Influencing Factors in Henan Province. J. Henan Agric. Univ. 2012, 46, 469–472. (In Chinese) [Google Scholar]
- Zhang, W.Y.; Song, G. Characteristics of Cultivated Land Utilization Benefits in Harbin City. Res. Soil Water Conserv. 2009, 16, 79–83. [Google Scholar]
- Zhang, L.X.; Zhu, D.L.; Xie, B.P.; Du, T.; Wang, X. Spatio-Temporal Pattern Evolution and Influencing Factors of Cultivated Land Use Efficiency in Major Grain-producing Areas of China: An Empirical Study Based on 180 Prefectural Cities. Resour. Sci. 2017, 39, 608–619. [Google Scholar]
- Gai, Z.X.; Sun, P.; Zhang, J.Q. Temporal and Spatial Evolution of Cultivated Land Use Efficiency in Main Grain-producing Areas under Environmental Constraints. Econ. Geogr. 2017, 37, 163–171. (In Chinese) [Google Scholar]
- Wang, K.L.; Liu, Y.; Shi, L.J.; Liu, L.; Meng, X.R.; Yang, B.C. Spatio-temporal differentiation and influencing factors of industrial green water resources efficiency in the Yangtze River Economic Belt: Two-stage analysis based on EBM-Tobit model. Resour. Sci. 2017, 39, 1522–1534. [Google Scholar]
- Shi, F.; Shen, K. Urbanization, Industrial Agglomeration and EBM Energy Efficiency. Ind. Econ. Resid. 2012, 6, 10–16, 67. [Google Scholar]
- Tone, K.; Tsutsui, M. An Epsilon-based Measure of Efficiency in DEA-A Third Pole of Technical Efficiency. Eur. J. Oper. Res. 2010, 207, 1554–1563. [Google Scholar] [CrossRef]
- Li, L.B.; Liu, B.L. Efficiency Evaluation and Cause Identification of High-tech Industry in China. Econ. Dev. Trend 2014, 9, 56–65. [Google Scholar]
- Zofio, J.L. Malmquist Productivity Index Decompositions: A Unifying Framework. Appl. Econ. 2007, 39, 2371–2387. [Google Scholar] [CrossRef]
- Gu, L.L.; Guo, Q.H. Research on the Evolution and Development of China’s Grain Production Area. Agric. Econ. 2011, 32, 4–9. [Google Scholar]
- Jiang, L.; Zhu, F.S. Food Production Status and Policy Suggestions in Main Production Areas of China. Agric. Econ. 2015, 36, 17–24. [Google Scholar]
- Jiang, H.P.; Wu, Z.P. The Policy Suggestions on Establishing Grain Transfer Area for Transferring Payment in Main Production Areas. China Dev. Obs. 2009, 12, 24–25. (In Chinese) [Google Scholar]
- Guo, S.M.; Ma, S.; Chen, Y.J. Research on Comparative Advantages and Development Strategies of Main Grain Crops in China’s Main Grain-producing Areas. Chin. Agric. Sci. B 2006, 1, 391–396. [Google Scholar]
- Jiang, H.P.; Cui, K. Construction and Estimation of Agricultural Modernization Index System in Main Grain-producing Areas of China and Assessment of Development Level. Res. Agric. Mod. 2011, 32, 646–651. [Google Scholar]
- Hou, L.J. Construction of Grain Production Areas in China Based on Food Security Protection. Econ. Probl. 2008, 7, 55–57. [Google Scholar]
- Wang, W.; Deng, W.P. The Three-stage Innovation Efficiency of High-tech Industry and Its Influence Factors—Based on EBM Model and Tobit Model. Soft Sci. 2017, 31, 16–20. [Google Scholar]
- Andersen, P.; Petersen, N.C. A procedure for ranking efficient units in data envelopment analysis. Manag. Sci. 1993, 39, 1261–1264. [Google Scholar] [CrossRef]
- Chung, Y.H.; Fare, R.; Grosskopf, S. Productivity and undesirable outputs: A directional distance function approach. J. Environ. Manag. 1997, 51, 229–240. [Google Scholar] [CrossRef]
- Qi, Y.W. Measurement and Decomposition of China’s Total Factor Productivity Growth under Carbon Emission Constraint—Based on SBM Directional Distance Function and GML Index. Ind. Technol. Econ. 2013, 32, 137–146. [Google Scholar]
- Oh, D.H. A Global Malmquist-Luenberger Productivity index. J. Prod. Anal. 2010, 34, 1345–1355. [Google Scholar] [CrossRef]
- Fare, R.; Grosskopf, S.; Norris, M. Productivity Growth, Technical Progress, and Efficiency Change in Industrialized Countries: Reply. Am. Econ. Rev. 1997, 87, 1040–1044. [Google Scholar]
- Hu, H.; Zhang, F. Research on the Utilization and Efficiency Change of Farmland Resources of Chinese Farmers. China Popul. Resour. Environ. 2009, 19, 131–136. [Google Scholar]
- Pan, D. Research on China’s Agricultural Productivity Considering Resource and Environment Factors. Ph.D. Thesis, Nanjing Agricultural University, Nanjing, China, 2012. [Google Scholar]
- Li, B.; Zhang, J.B. Study on carbon effect characteristics and spatial differences based on the changes of agricultural land use patterns in China. Econ. Geogr. 2012, 32, 135–140. [Google Scholar]
- You, H.Y.; Wu, C.F. Carbon emission efficiency analysis and low carbon optimization of intensive agricultural land use. Trans. Chin. Soc. Agric. Eng. 2014, 30, 224–234. [Google Scholar]
- Liang, L.T. Temporal and Spatial Characteristics of Rural Eco-Environment and Its Evolution. Ph.D. Thesis, Nanjing Agricultural University, Nanjing, China, 2009. [Google Scholar]
- Deng, X.Q.; Cui, Y.P.; Xia, M.P.; Liu, S.J.; Li, N.; Zhao, F. Analysis of Cultivated Land Mechanization and Wealthy Labor in Henan Province. Chin. J. Agric. Mech. 2018, 39, 99–102. (In Chinese) [Google Scholar]
- Wei, H.K.; Wang, Y.Q. The Theoretical Basis and Policy Guidance of the Central Government in Supporting the Development of Major Grain Production Areas. New Econ. Dev. 2012, 11, 49–55. [Google Scholar]
- Tu, Z.G. The coordination of environment, resources and industrial growth. Econ. Res. 2008, 2, 93–105. [Google Scholar]
- Chen, F. Study on Threshold Effect of Arable Land Scale Applied in Agricultural Production Technology. Res. Financ. Econ. Issue 2015, 6, 78–86. [Google Scholar]
- Shi, C.Y. Climate change, investment in agricultural water conservancy and analysis of China’s arable land output efficiency. Agric. Technol. Econ. 2015, 11, 62–68. (In Chinese) [Google Scholar]
- “China’s Agricultural Technology Extension System Reform” Research Group. China’s Agricultural Technology Extension: Status Quo, Problems and Solutions. Manag. World 2004, 5, 50–57. (In Chinese) [Google Scholar]
- Zhang, D.W.; Zhu, R.S. On the Innovation of Agricultural Technology Extension System. Sci. Res. Manag. 2006, 3, 141–145. [Google Scholar]
- Lu, X.; Niu, S.D.; Li, Z.B.; Huang, X.J.; Zhong, T.Y. Study on the status quo and trend analysis of intensive land use in China. Trans. Chin. Soc. Agric. Eng. 2015, 31, 212–224. [Google Scholar]
- Wang, J.; Guo, X.D. Scientific Regulation of Sustainable Land Use at County Scale in China. Progr. Geogr. 2002, 3, 216–222. [Google Scholar]
- Yang, Z.H.; Li, P.; Wang, Y.P. Effects of Aging Rural Labor on the Farmers’ Utilization Efficiency of Cultivated Land. Area Res. Dev. 2015, 34, 167–171. [Google Scholar]
- Yu, W.D. Application of new energy in agriculture. Agric. Equip. Technol. 2014, 40, 7–10. (In Chinese) [Google Scholar]
- Xu, Y.G.; Yang, G.Q.; Wen, G.H. Impact of Cultivated Land Fractionation on Cultivated Land Use Efficiency: An Empirical Analysis Based on Farmers with Different Management Scales. Res. Agric. Mod. 2017, 38, 688–695. [Google Scholar]
- Zu, J.; Zhang, H.; Kong, X.B. Fragmentation characteristics and utilization efficiency of cultivated land in hilly areas of Southwest China: A case study of Caohai Village, Guizhou Province. J. China Agric. Univ. 2016, 21, 104–113. [Google Scholar]

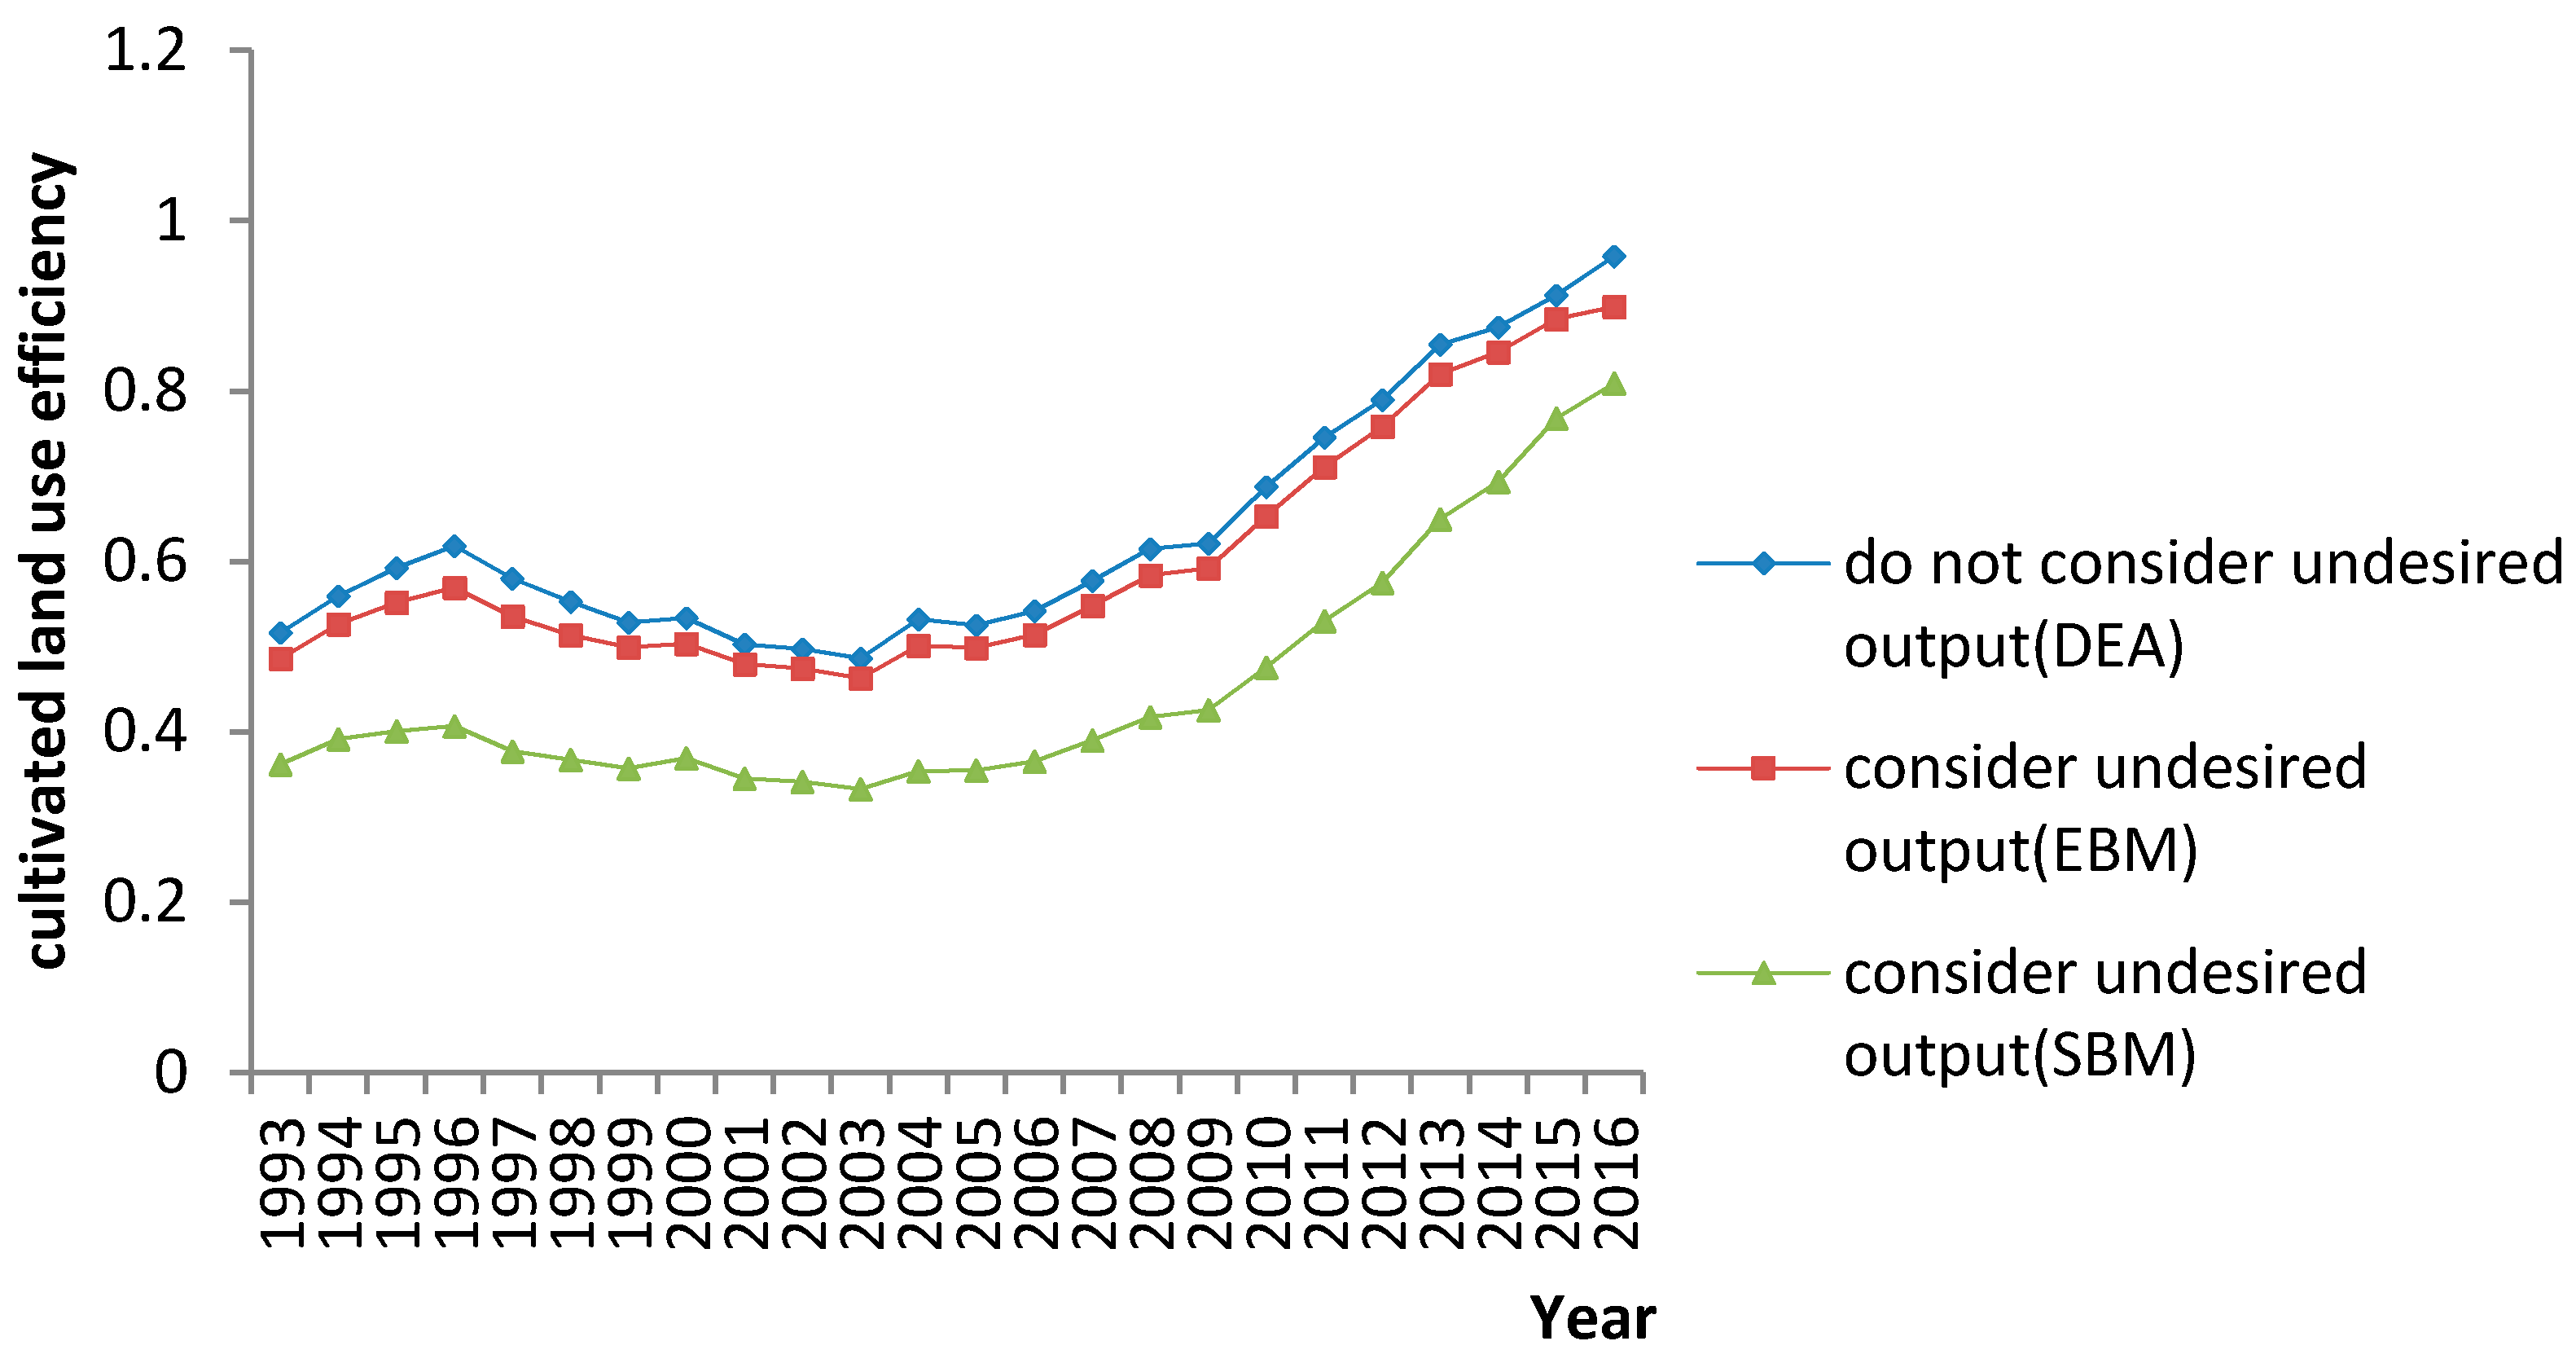


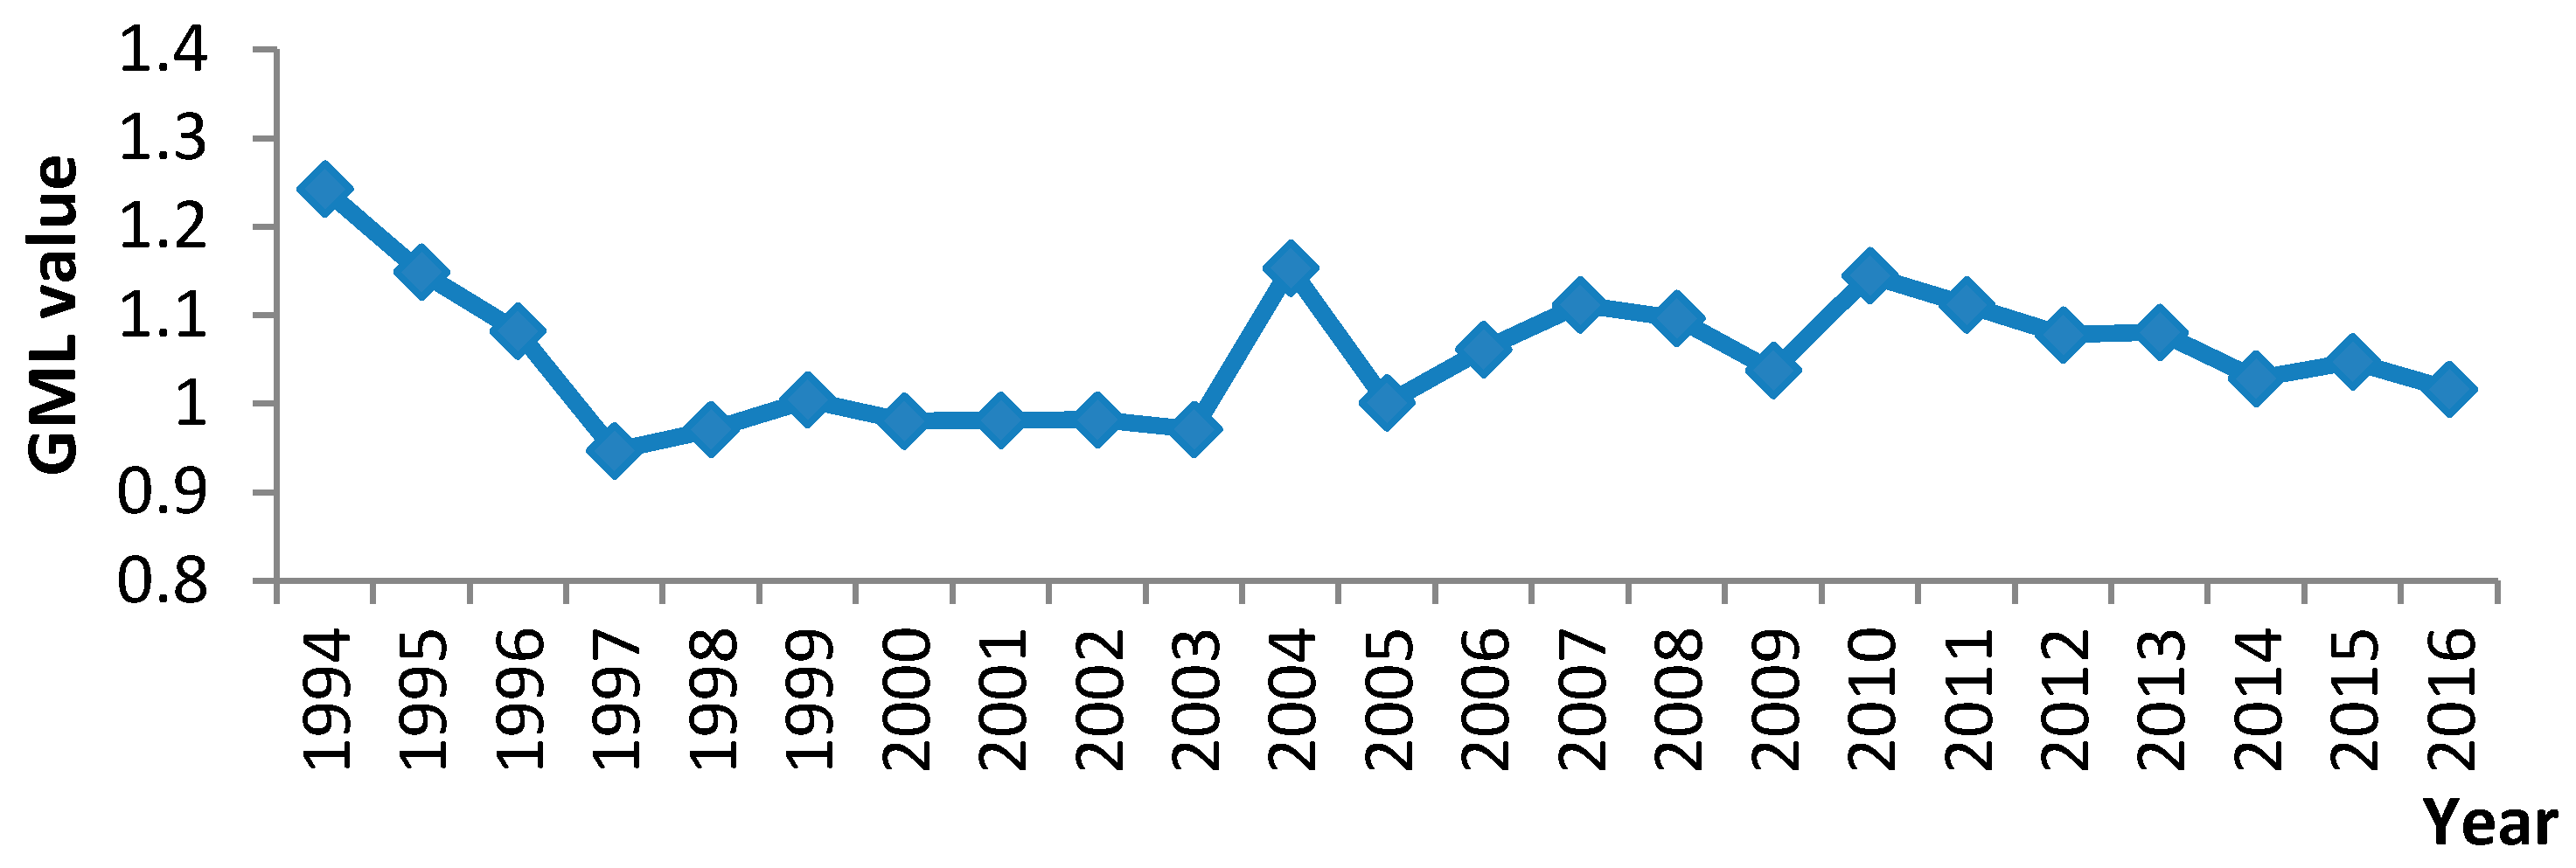
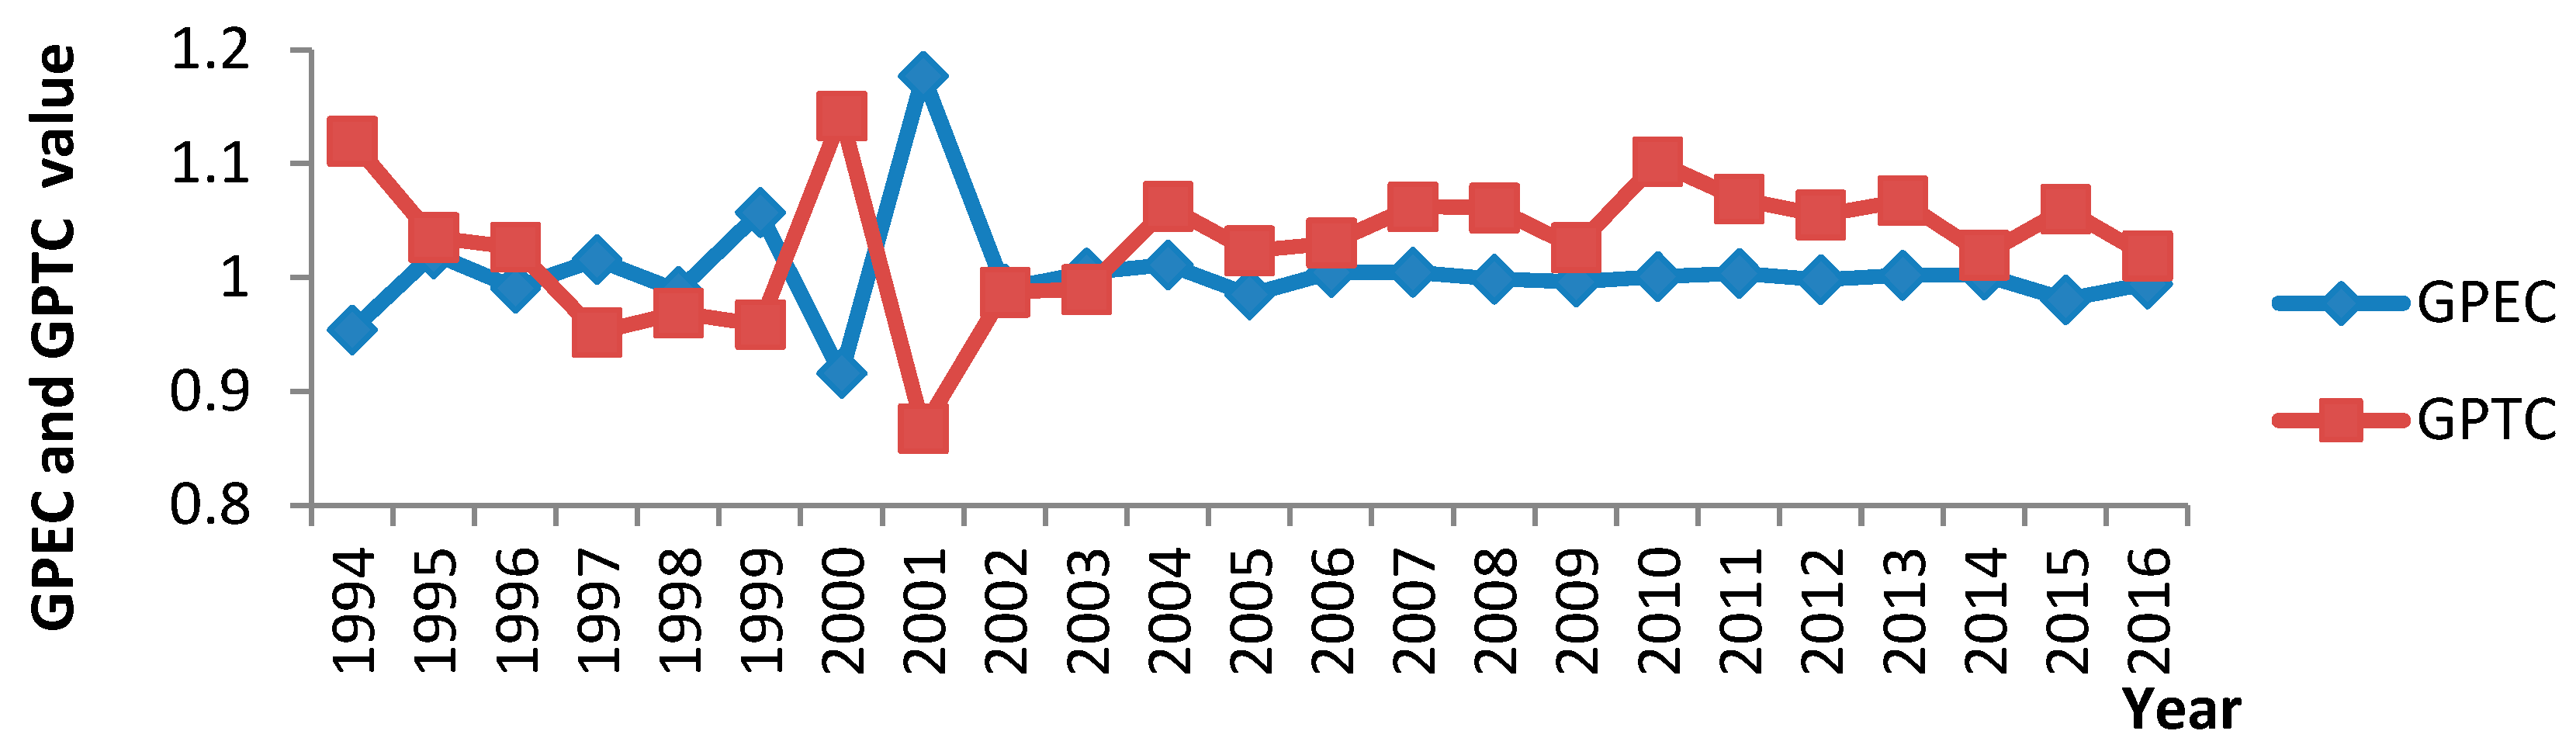
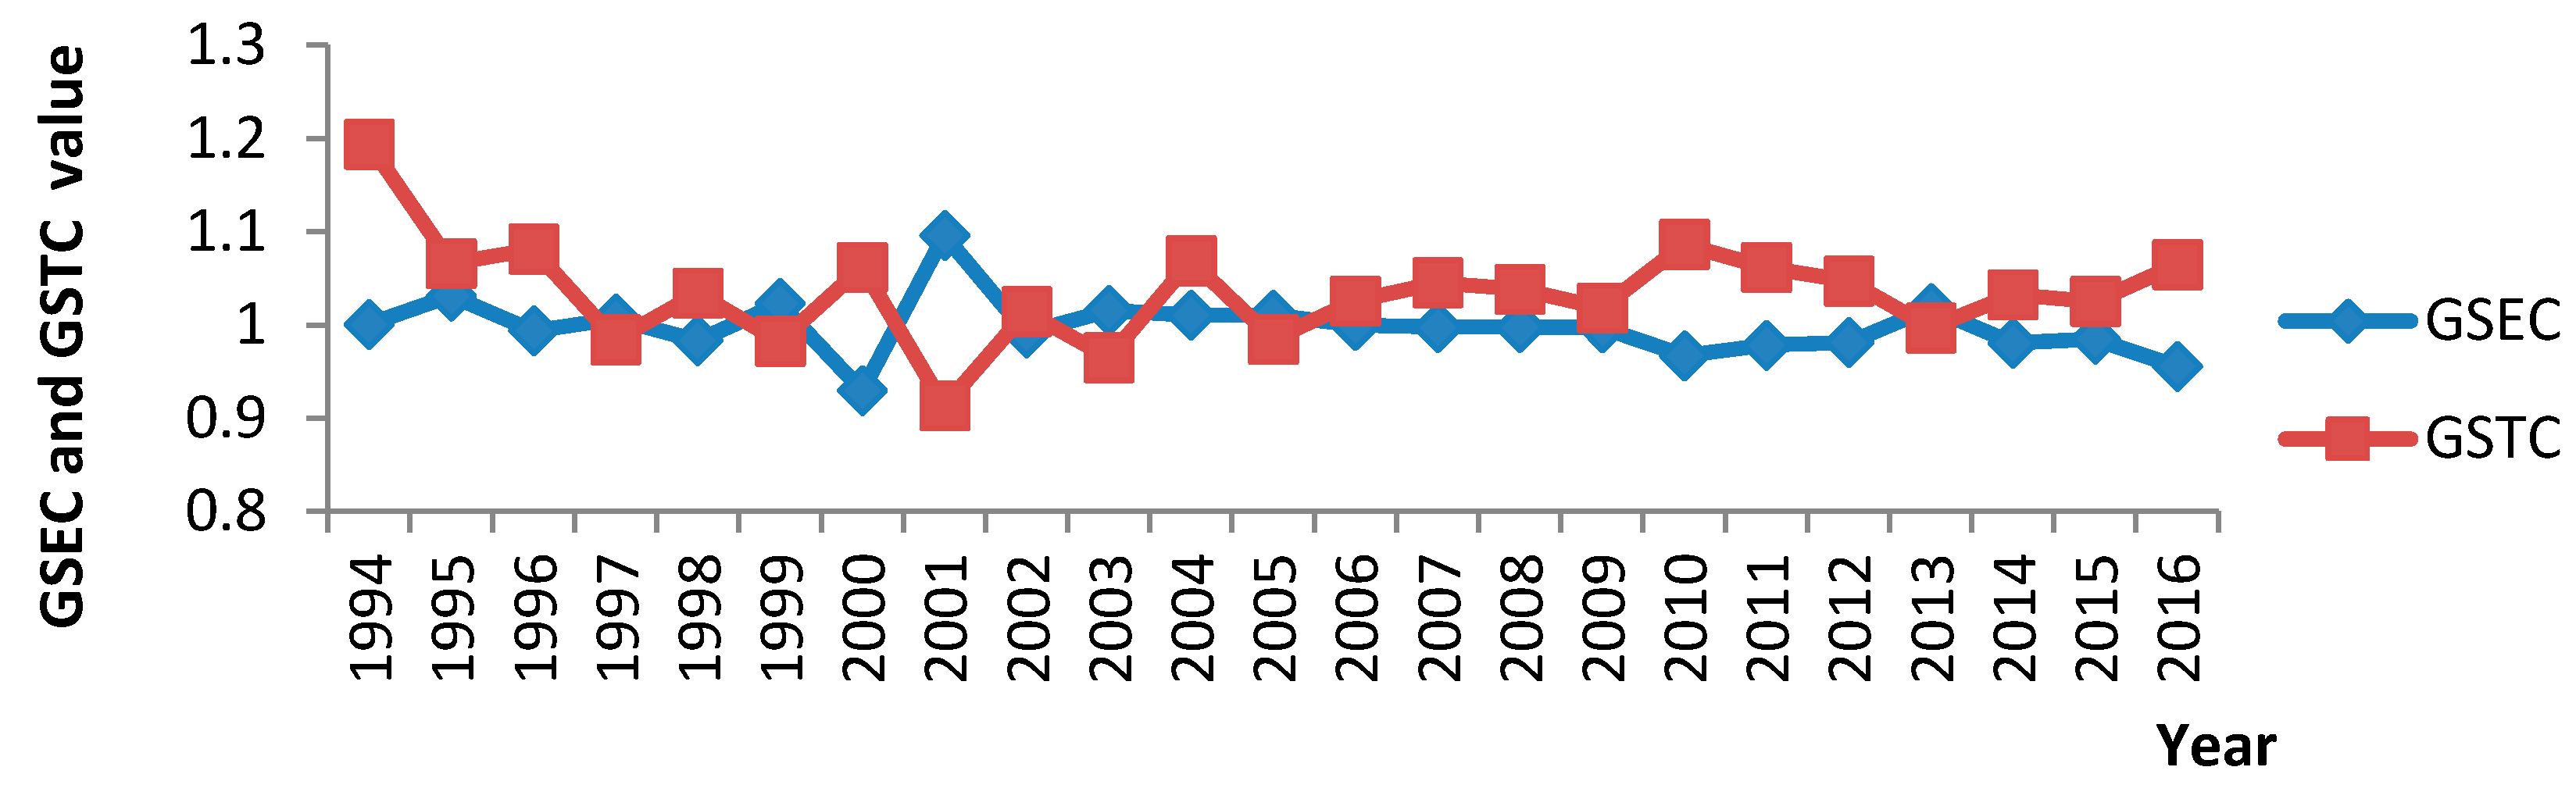
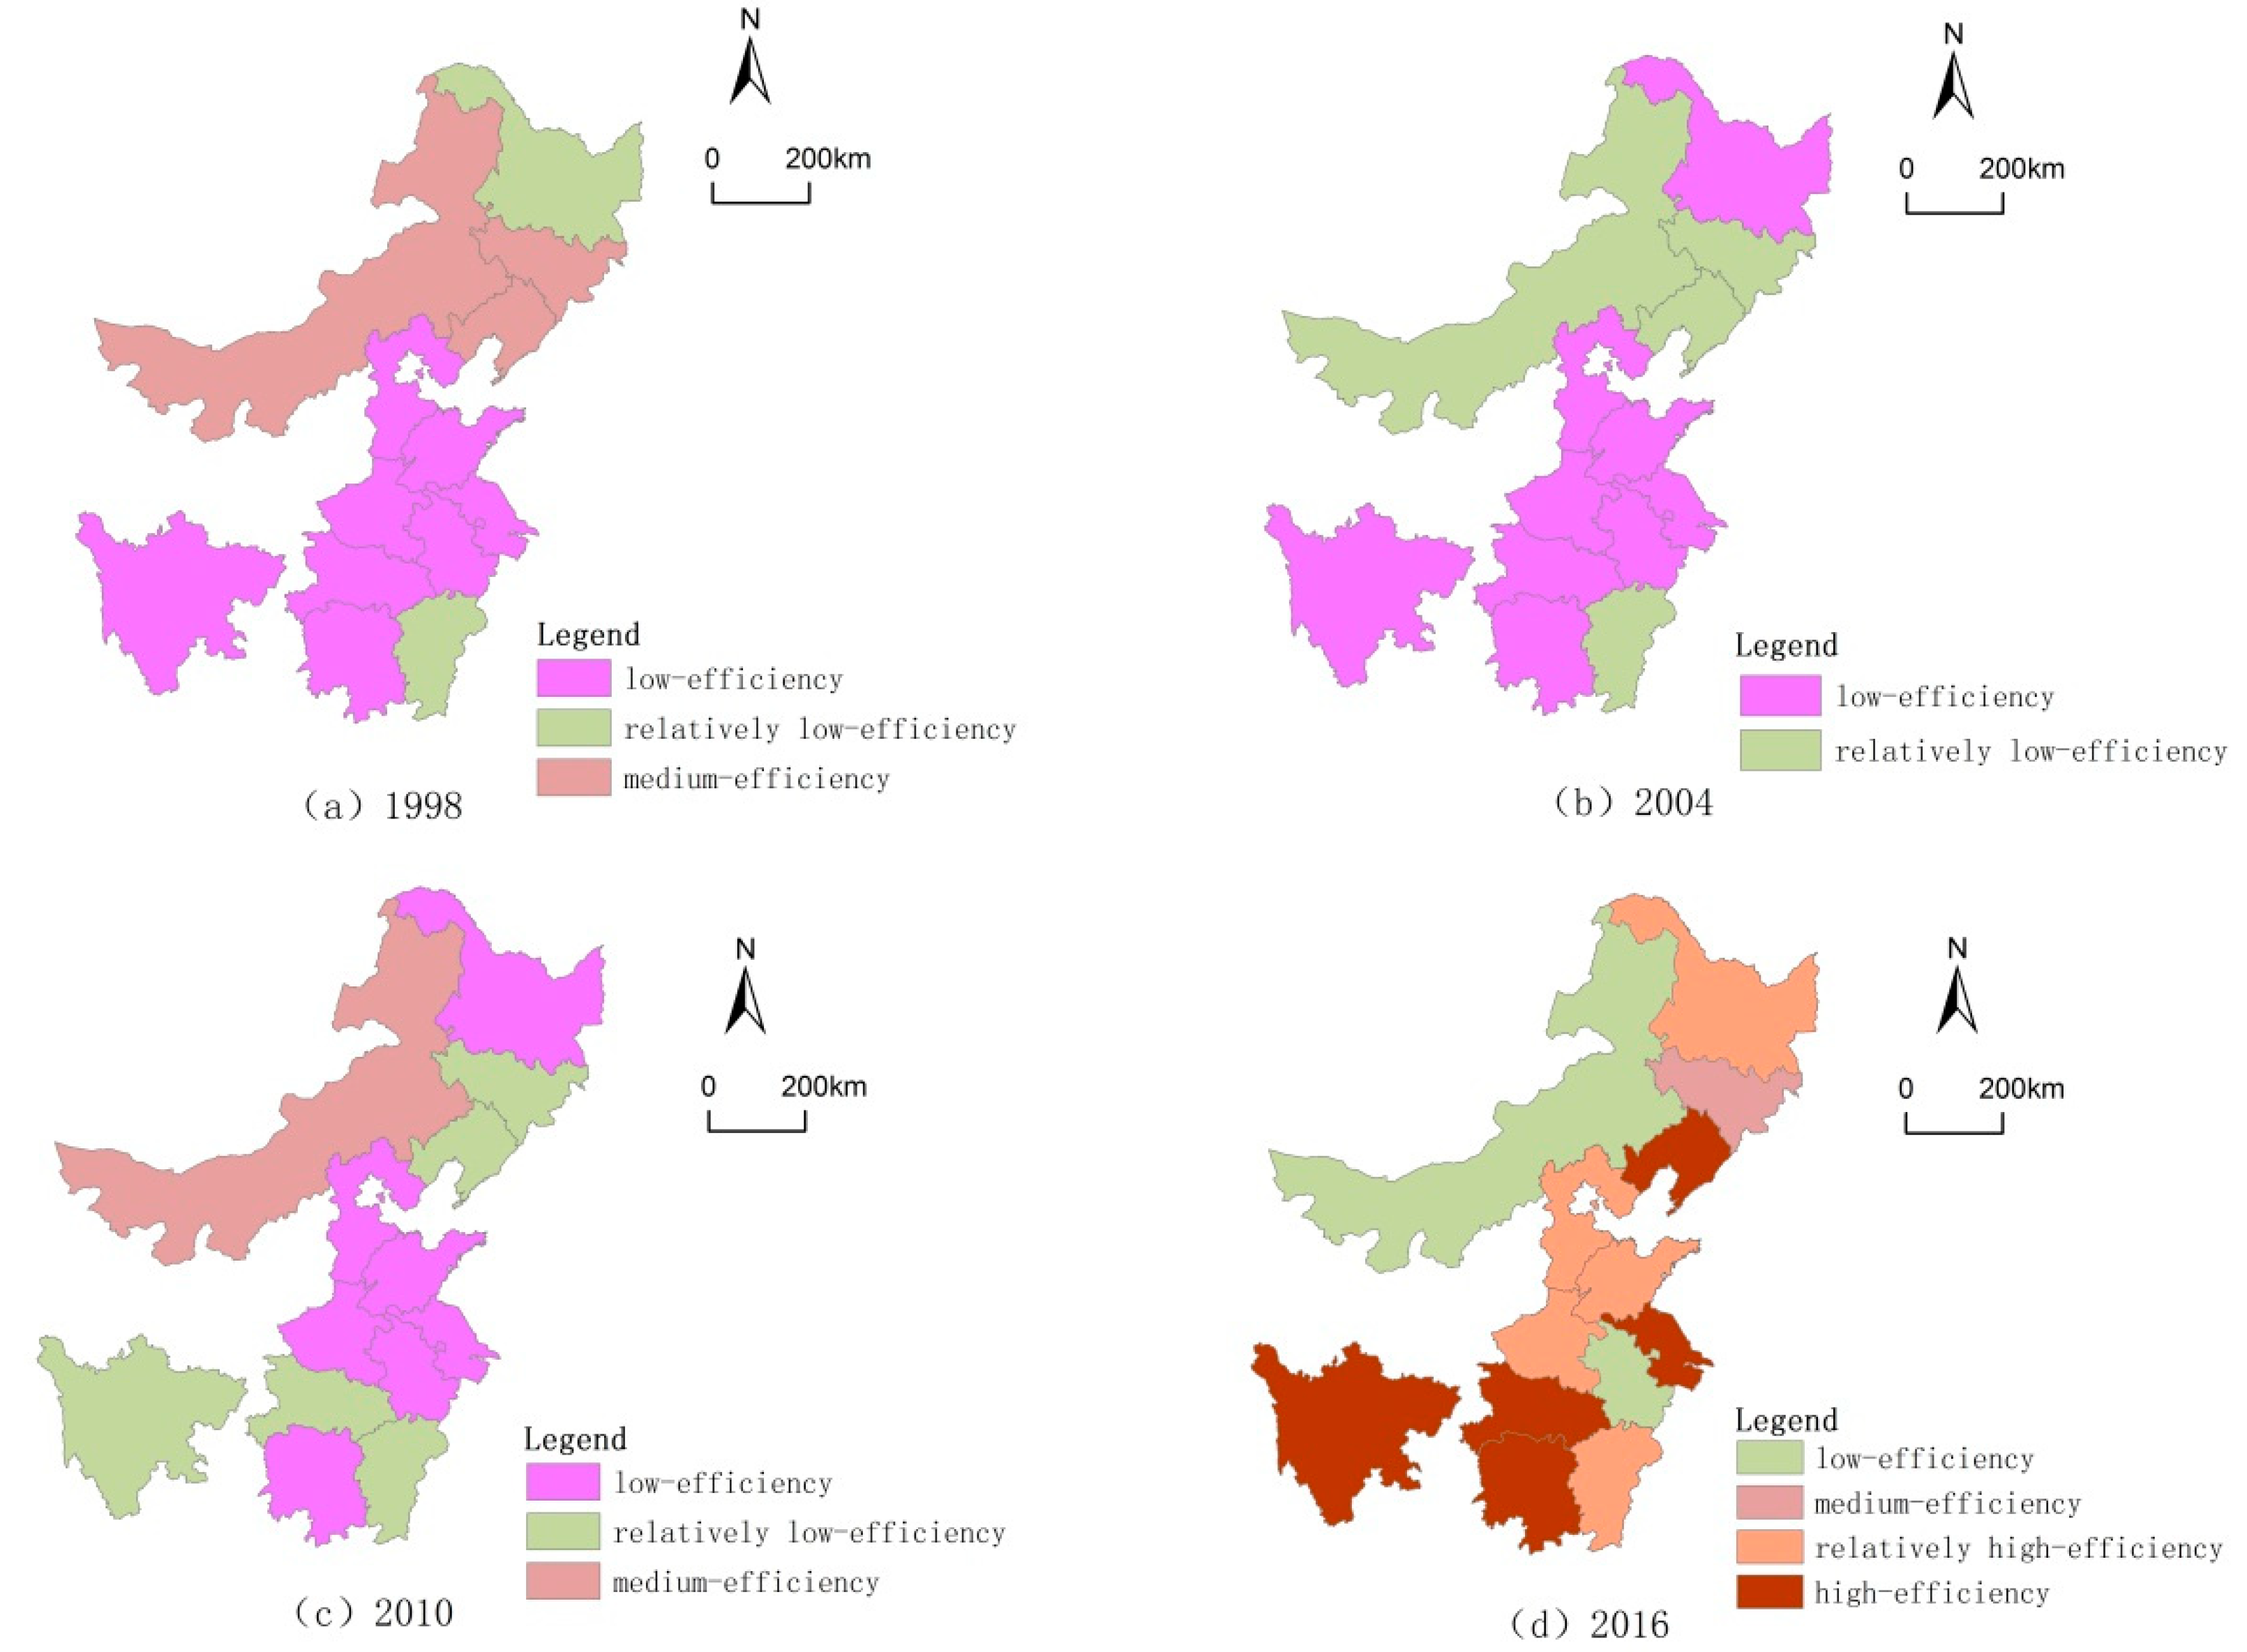
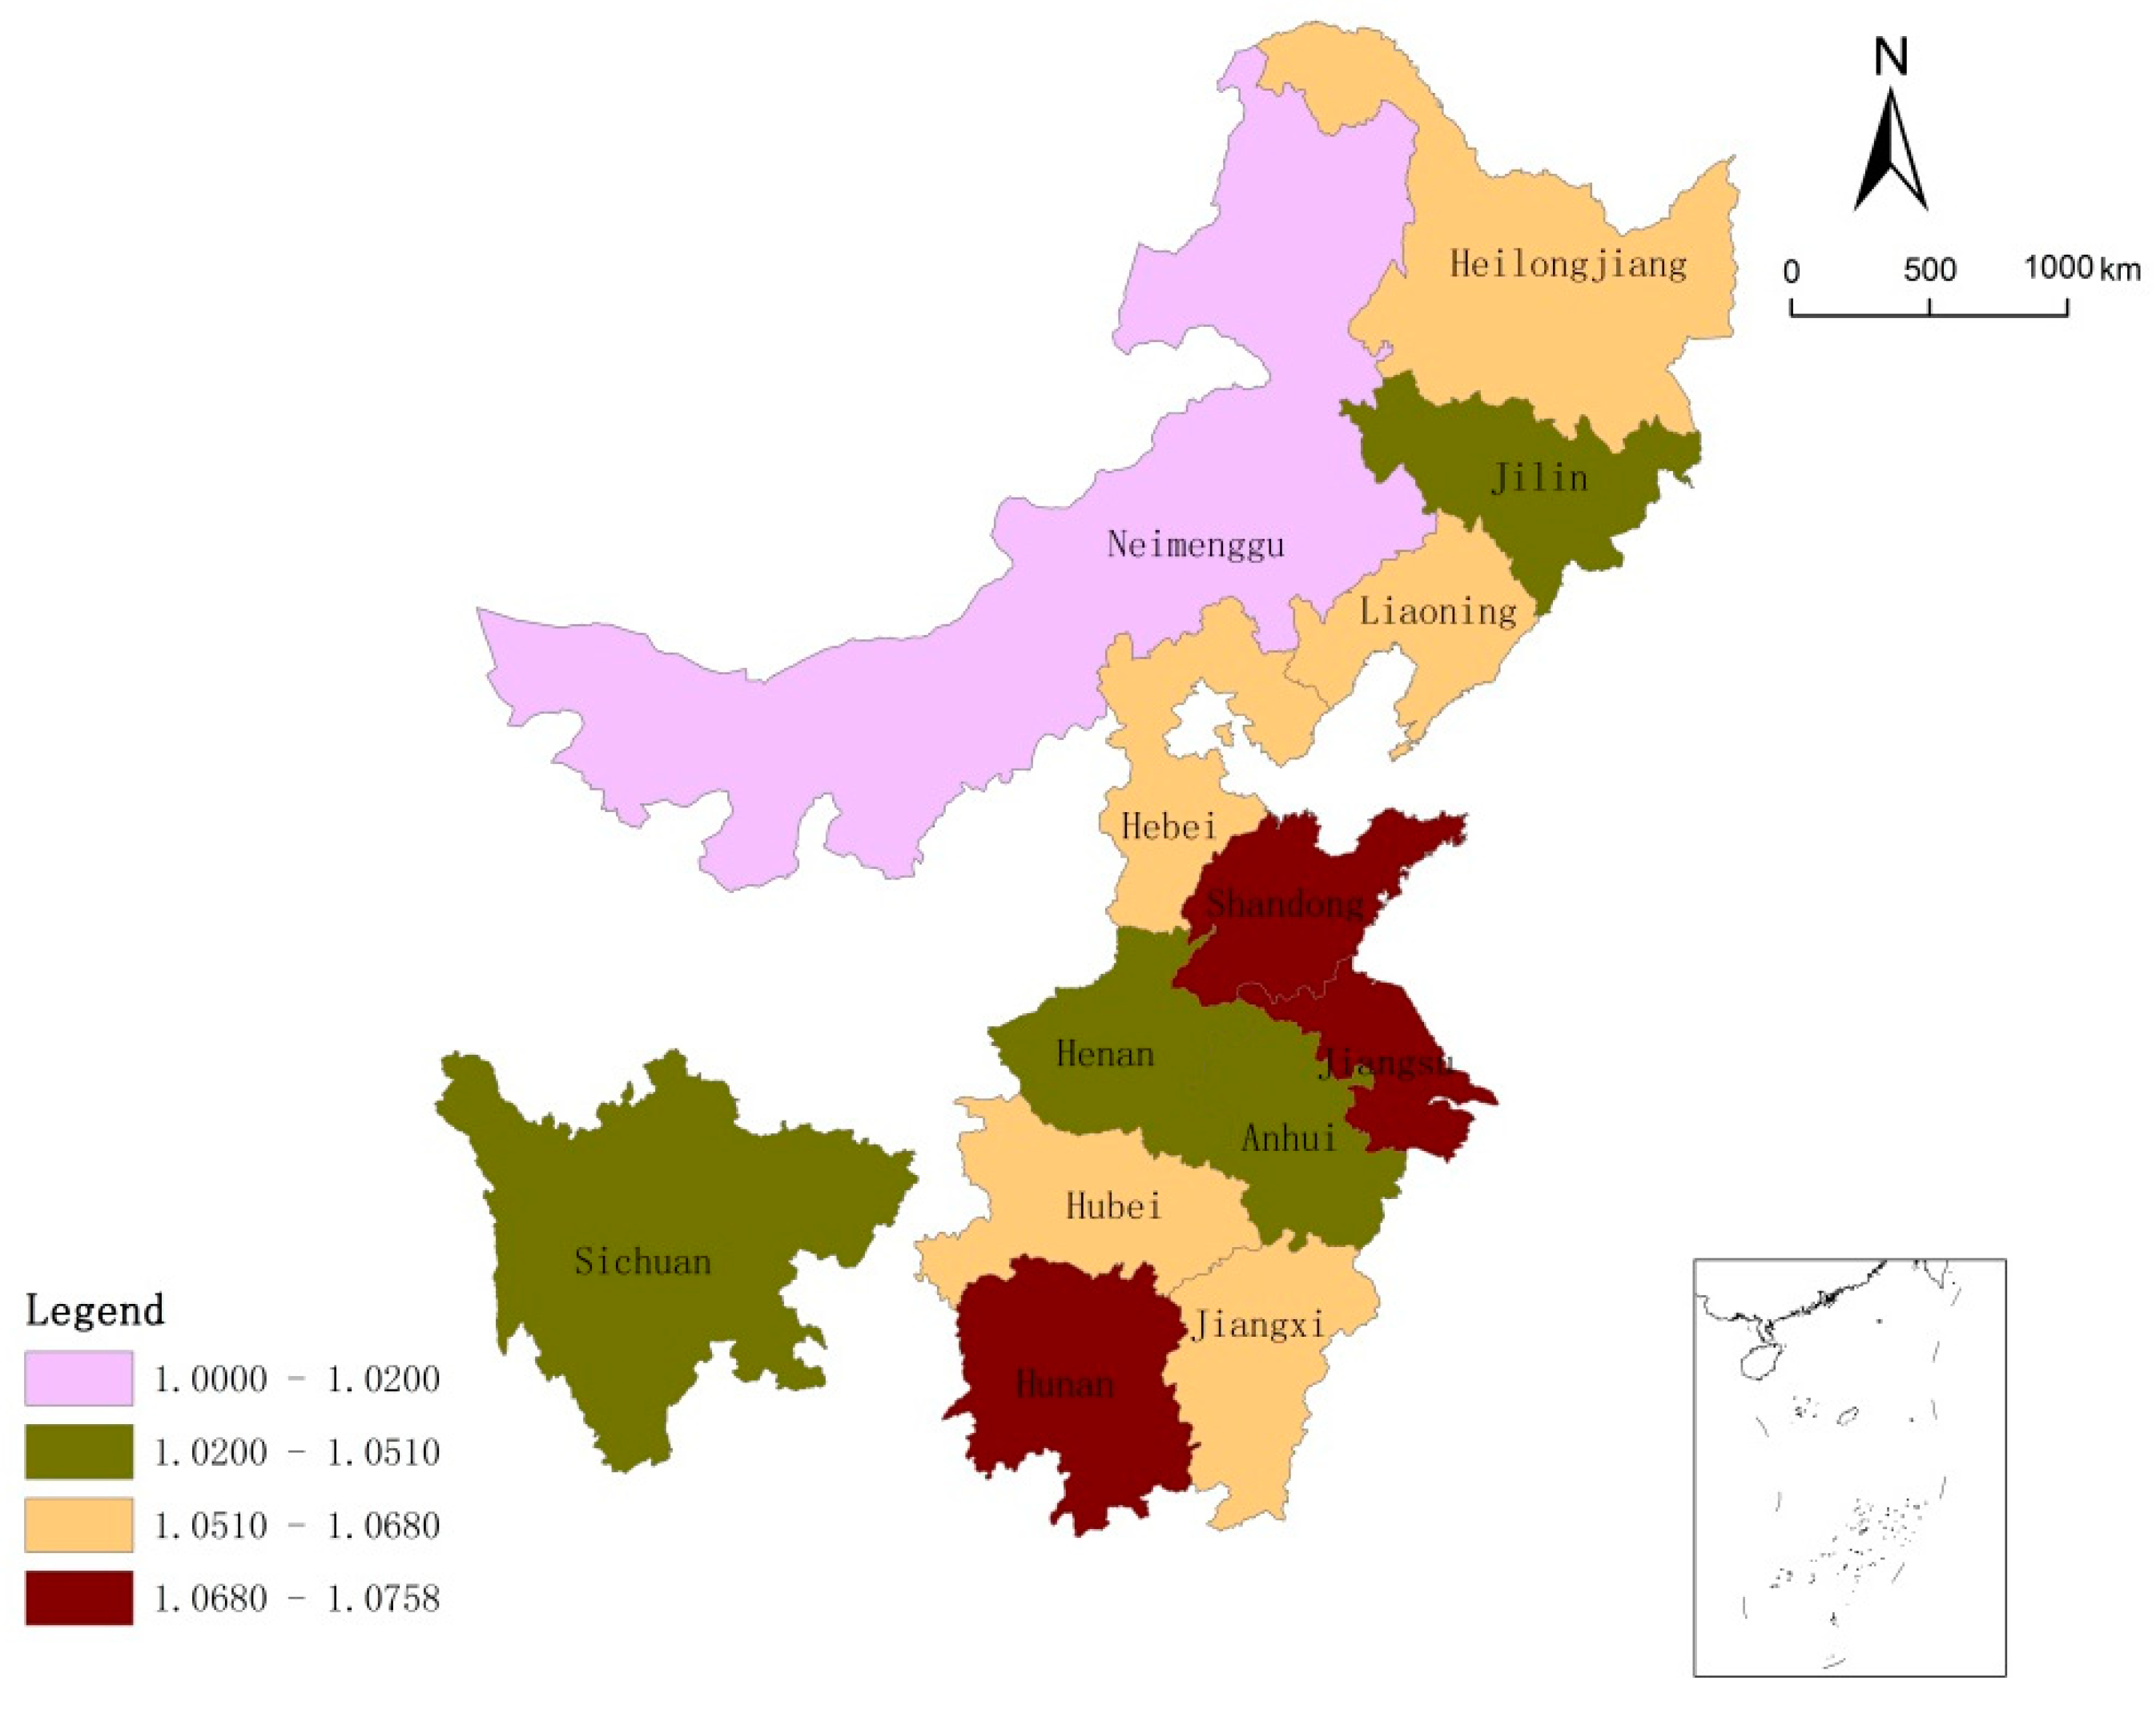
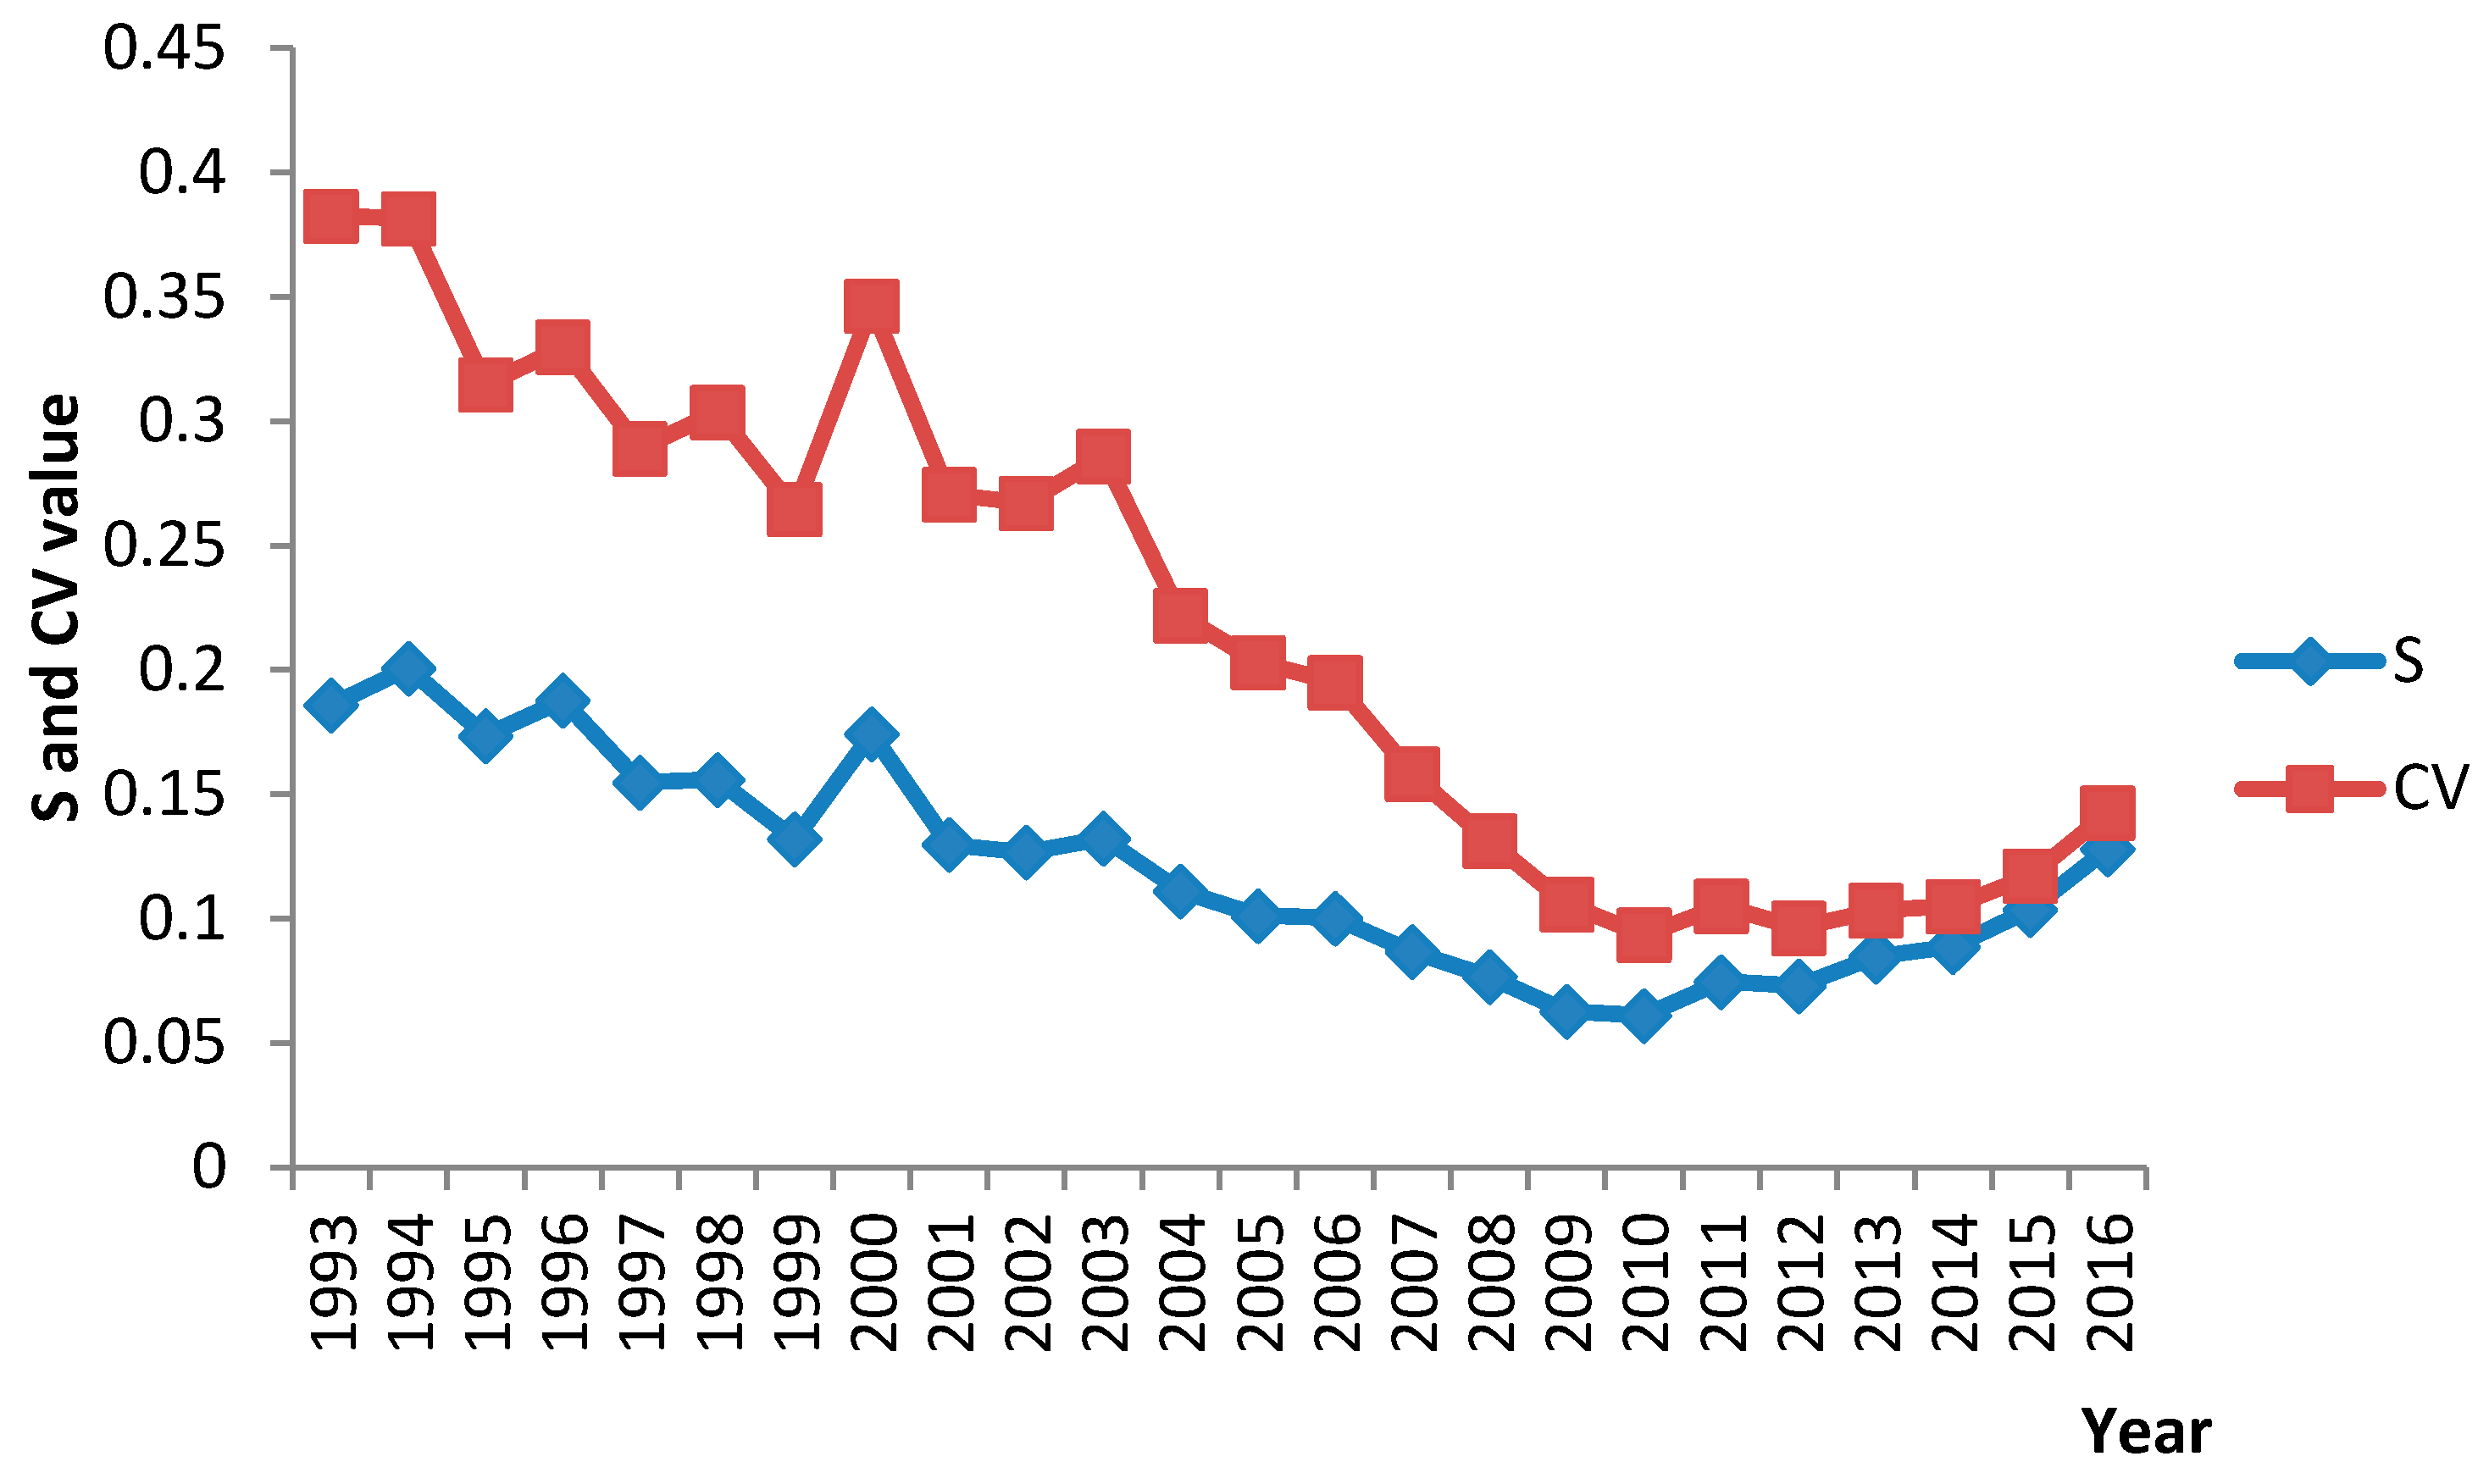
© 2018 by the authors. Licensee MDPI, Basel, Switzerland. This article is an open access article distributed under the terms and conditions of the Creative Commons Attribution (CC BY) license (http://creativecommons.org/licenses/by/4.0/).