Article

Greenhouse Gas Emission Intensities for the Livestock Sector in Indonesia, Based on the National Specific Data

1
College of Animal Life Sciences, Kangwon National University, Chuncheon 24341, Korea
2
Center for Resources Information & Management, Korea Institute of Industrial Technology, Seoul 06211, Korea
3
Animal Environment Division, National Institute of Animal Science, RDA, Wanju 55365, Korea
*
Author to whom correspondence should be addressed.
Sustainability 2018, 10(6), 1912; https://doi.org/10.3390/su10061912
Submission received: 29 April 2018 / Revised: 28 May 2018 / Accepted: 5 June 2018 / Published: 7 June 2018

Abstract

:
The aims of this study were to calculate greenhouse gas (GHG) emissions and to identify the trends of GHG emission intensity, based on meat production from the livestock sector in Indonesia, which had not been done before. The total emissions from the livestock sector from 2000 to 2015 in Indonesia were calculated using the 2006 Intergovernmental Panel on Climate Change Guideline (2006 IPCC GL) using Tier 1 and Tier 2, with its default values and some of the country specific data that were found in the grey literature. During 2000 to 2015, the change from the Tier 1 to Tier 2 methods resulted in an approximately 7.39% emission decrease from enteric fermentation and a 4.24% increase from manure management, which resulted in a 4.98% decrease in the total emissions. The shared emission from manure management increased by about 9% and 6% using Tier 1 and Tier 2, respectively. In contrast with the total emissions, the overall emission intensity in Indonesia decreased (up to 60.77% for swine), showing that the livestock productivity in Indonesia has become more efficient. In order to meet the meat demand with less GHG emissions, chicken farming is one option to be developed. The increased emission and share from manure management indicated that manure management system needs to be of concern, especially for beef cattle and swine.

1. Introduction

Climate change has become a major environmental problem. Since the Industrial Revolution, anthropogenic greenhouse gasses (GHG), such as carbon dioxide (CO2), methane (CH4), and nitrous oxide (N2O) have increased in the atmosphere and have caused climate change. CH4 and CO2 levels have increased by 148% and 38%, respectively, as of 2009, above preindustrial levels, resulting in an increase in the average temperature of the Earth’s surface by 0.6 °C, since the late 1800s [1]. In 2010, the total anthropogenic GHG emission was 49 ± 4.5 GtCO2-eq/year [2]. The agricultural sector was the largest contributor to the global anthropogenic CH4 and N2O, accounting for 56% of the emissions in 2005. The annual CH4 and N2O emissions from agriculture in 2010 were estimated to be 5.2 to 5.8 GtCO2-eq/year and comprised about 10 to 12% of the global anthropogenic emissions [1].
In 2007, the World Bank and the Department for International Development of the United Kingdom (DFID) released data, which suggested Indonesia as the third largest CO2 emitter country [3]. In 2000, Indonesia’s agriculture contributed to 5% of the national GHG emissions, with the emissions from enteric fermentation and manure management accounting for 18.14% and 2.57%, respectively, of the agricultural contribution [3]. In 2009, following the commitment of the Government of Indonesia (GOI) to actively participate in reducing its emissions through the National Appropriate Mitigation Action (NAMA), Indonesia committed to a 26% reduction in carbon emissions from Business-As-Usual (BAU) by 2020 [3]. Moreover, Indonesia through the first Nationally Determined Contribution (NDC) in 2016, also committed that, beyond 2020, it would contribute to the concerted effort to prevent a 2 °C increase in the global average temperature and to pursue efforts to limit the temperature increase to 1.5 °C above the pre-industrial levels. Indonesia has adopted the 2006 Intergovernmental Panel on Climate Change Guideline (2006 IPCC GL), using the Tier 1 approach [3], and plans to use Tier 2 for its national GHG emission inventory.
Population growth, increases in per capita consumption, and changes in diets, lead to the consumption of more livestock products and are the main drivers of agriculture product demand growth [2], thus, an increase in the livestock population. This leads to an increase of manure production and GHG emissions from the livestock sector. From 2009 to 2014, the meat consumption in Indonesia increased by 21.43% [4,5]. In 2015, the total livestock population in Indonesia increased by 40.08%, compared to the 2000 population [5,6]. The largest population of livestock in Indonesia is chicken, followed by duck, goats, sheep, beef cattle, swine, buffalo, dairy cattle, and horse [6].
Mitigation for GHG emissions can be applied in various levels, including in the commodity level. A commodity-specific assessment helps to show the potential impact of promising farm mitigation measures when extrapolated across the whole industry [7]. An option for reducing GHG emissions from agriculture is to minimize the impact of the various commodities on the environment [7]. In the context of human food security, the most relevant measure is ‘emissions intensity’, which expresses the quantity of gases that are produced per animal for a unit of production. This measurement reflects most accurately the management, feeding, and manure systems of the livestock in developing countries, and the effects of the given mitigation practices [8].
Therefore, this study was conducted (i) to calculate the GHG emissions from the livestock sector, using the Tier 1 and Tier 2 methods of the 2006 IPCC GL, and (ii) to identify the trends of emission intensity from each commodity, by calculating the emission intensity from the livestock sector. This study has focused on manure management because the livestock sector in Indonesia is growing, which produces a large amount of manure, and if it is improperly handled, it can cause an environmental problem. Therefore, this study is expected to help reflect the actual emission from the livestock sector. Moreover, the trends of the emission intensity in Indonesia can help the decision-making that is related to the livestock sector in Indonesia.

2. Materials and Methods

2.1. Country-Specific CH4 EF for Manure Management in Indonesia

In order to calculate the country-specific emission factor (EF) for CH4 for manure management, volatile solid (VS) data were needed. The VS data were collected from the Indonesian literature, such as from research reports, theses, working papers, etc. (Table 1). The calculation for CH4 EF, based on the 2006 IPCC GL, is as follows:
E F ( T ) = ( V S ( T ) × 365 ) × [ B o ( T ) × 0.67   kg / m 3 × S , k MCF ( S , k ) 100 × M S ( T , S K ) ]
In Equation (1), EF(T) is the annual CH4 emission factor for the livestock category, T (kg CH4/animal/year); VS(T) is the daily volatile solid that is excreted for livestock category, T (kg dry matter/animal/day); Bo(T) is the maximum methane producing capacity for manure that is produced by livestock category, T (m3 CH4/kg of VS excreted); MCF(s,k) is the methane conversion factors for each manure management, S, by the climate region, k (%); and MS(T,S,k) is a fraction of the livestock category’s, T’s, manure that is handled using the manure management system, S, in the climate region, k. The country-specific Bo, MCF, and MS for Indonesia were unavailable and, thus, the default values from the 2006 IPCC GL were used. The default values from the 2006 IPCC GL were based on the Asian region’s characteristic for dairy cattle, beef cattle, buffalo, and swine, and were based on developing countries for other livestock, such as goat, sheep, duck, chicken, and horse. The annual average temperature in Indonesia from 1961 to 2015 was 26 °C [9,10], so the warm characteristic (26 °C) MCF was used.

2.2. Country-Specific Nex for Manure Management in Indonesia

The country-specific nitrogen excretion (Nex) data were needed to calculate the country-specific N2O emission from the manure management. The country-specific nitrogen excretion rates were either taken directly from the documents or reports, such as the agricultural industry and scientific literature, or were derived from the information on the animal nitrogen intake and retention [10]. The official country-specific Nex from the Indonesian government was unavailable, therefore, in this study, the country-specific Nex data were obtained from Indonesian documents, such as non-peer reviewed papers and the theses, referred to as grey literature [20] by the IPCC (Table 1). The default Nex from the 2006 IPCC GL was expressed per 1000 kg animal mass, so that in order to calculate the Nex, the average body weight (ABW) was needed. The country-specific ABW for the livestock that was unavailable was replaced by the default ABW from the 2006 IPCC GL.

2.3. GHG Emissions from the Livestock Sector in Indonesia

The emissions from the livestock sector were calculated using the Tier 1 and Tier 2 methods. The Tier 1 method used the default values from the 2006 IPCC GL. Because of the lack of availability of country-specific data, the Tier 2 method was calculated using country-specific data and the default values from the 2006 IPCC GL. After the emissions were calculated, the unit was converted to the CO2 equivalent (CO2-eq) by multiplying the emission with the global warming potential (GWP) for each gas. The GWP for CH4 was 25 and for N2O it was 298 in a 100 year basis [21]. The total GHG emissions from the livestock sector in Indonesia were calculated based on the livestock population of all of the livestock categories in Indonesia (Table 2). To determine the emission intensity, the total GHG emissions were calculated, based on the number of slaughtered animals that were meat-producing livestock (beef cattle, buffalo, sheep, goat, swine, horse, and broiler chicken). The number of slaughtered animals was obtained based on the calculation of the living animal populations in Indonesia, from the Livestock and Animal Health Data Collection Guideline [21], as follows:
Pt = Po + B − D − S − E + I
where Pt is animal population in year t; Po is the early population (early population in year t or last population from the year before t); B is the birth of livestock in year, t (Po × birth percentage); D is the death of livestock in year, t (Po × death percentage); S is slaughtered animals; E is exported animals; and I is imported livestock. The calculation is shown in Table 3.

2.4. Methane Emissions

Methane was emitted from two sources, namely, enteric fermentation and manure management. The CH4 emission was calculated by multiplying the emission factor and the number of livestock for each category. The CH4 emissions were calculated using Equation (3) from the 2006 IPCC GL [10], as follows:
C H 4   Emission = ( T ) ( EF ( T ) × N ( T ) ) 10 6
CH4 emission is the CH4 emission emitted (Gg/year), EF(T) is the emission factor for each livestock category (kg CH4/head/year), while N(T) is the animal population for each livestock category (head). The emission factors (EFs) for the enteric fermentation were the default EFs of the regional characteristic in Asia, for dairy and beef cattle, and were the developing countries’ characteristics for the other livestock. The country-specific EF for the enteric fermentation in Indonesia was available for the weaning beef cattle (18.18 kg CH4/head/year), growing beef cattle (27.18 kg CH4/head/year), and mature beef cattle (55.89 CH4/head/year) [23].
The calculation of the CH4 emissions from the manure management using the Tier 1 method used the default values from the 2006 IPCC GL. The GHG emissions using the Tier 2 method were calculated using available the country-specific EFs and the default EFs if the country-specific EFs for some of the livestock were unavailable. The default EFs for the CH4 from the manure management were based on the Asian characteristics with an average temperature 26 °C and from the developing countries from the 2006 IPCC GL.

2.5 Nitrous Oxide Emissions

The calculation for N2O was consisted in two ways, namely, direct and indirect emission. Direct emission was emission that occurred via nitrification and denitrification of nitrogen that was contained in the manure during the storage and treatment [10]. The emission was calculated using Equation (4) from the 2006 IPCC GL [10], as follows:
N 2 O D ( MM ) = [ S [ T ( N ( T ) × N ex ( T ) × MS ( T , S ) ) ] × EF 3 ( S ) ] × 44 28
N2OD(MM) is the direct N2O emissions from the manure management in the country (kg N2O/year); N(T) is the number of heads of livestock species per category, T, in the country; Nex(T) is the annual average, N, excretion per head of the species per category, T, in the country (kg N/animal/year); MS(T,S) is the fraction of the total annual nitrogen excretion for each livestock species per category, T, that is managed in the manure management system, S, in the country; and EF3(S) is the emission factor for direct N2O emissions from manure management system, S, in the country (kg N2O-N/kg N). The MS for Indonesia was unavailable so the MS value was based on the default from the 2006 IPCC GL.
Indirect emission was the result of the volatile nitrogen losses that occurred primarily in the forms of ammonia (NH3) and nitrogen oxide (NOx) [10]. Indirect N2O emission was generated by the manure deposited on pasture, range, and paddock by grazing animals. Indirect N2O emission from the livestock manure management was included in the emissions from the managed soils, therefore, the indirect N2O in this study was excluded.

2.6. GHG Emission Intensity

Emission intensity represented the amount of emissions by livestock per production unit. In this study, the emission intensity was based on the total emissions for the meat production. The use of meat production in the emission intensity measurement could reflect the management, feeding, and manure systems of the livestock. The livestock that were included in the emission intensity calculation were meat-producing commodities, such as beef cattle, buffalo, sheep, goat, swine, horse, and broiler chicken (Table 4). The total GHG emissions were calculated using the number of slaughtered animals. The meat production data were obtained from the Statistic on Livestock [6,22], and the Statistic of Livestock and Animal Health [4,5]. Meat production was defined as the carcass that resulted from livestock slaughtered, plus the edible offal during a certain period and in a certain region [23]. The GHG emission intensities were calculated using Equation (5), as follows:
Emission   intensity   ( kgCO 2 eq / kg   meat ) = Total   GHG   emission   of   slaughtered   animals   per   category   ( kgCO 2 eq ) Meat   production   ( kg )

3. Results and Discussion

3.1. Country-Specific Data Source

Indonesia planned to use the 2006 IPCC GL Tier 2 to calculate the emissions from the livestock sector. Hence, Indonesia through that the Indonesian Research Institute of Animal Production had started to develop country-specific data, such as the CH4 EF from the enteric fermentation in beef cattle and the VS in swine, for the CH4 emissions from manure management [12]. However, the country-specific data for the CH4 and N2O emissions from the manure management in other livestock categories were not developed yet. Non-published/non-peer-reviewed sources, often called grey literature (e.g., industry journals, internal organizational publications, non-peer-reviewed reports, or working papers of research institutions, proceedings of workshops, etc.) may have contained highly relevant information [21]. Therefore, the grey literature that was available in Indonesia could be used to complete the previous data for calculating the emissions, using Tier 2 method. However, the use of this literature brought an extra responsibility for the author teams, to ensure the quality and validity of the cited sources and information [21].
In this study, the data were collected from published papers in Indonesia. Those papers were considered to be grey literature, because they were mostly published by organizations or research institutions in Indonesia. However, the data showed the actual situation of the livestock in Indonesia, because the research was conducted based on their actual conditions, including feed, breed, and climate.

3.2. Country-Specific CH4 EF for Manure Management in Indonesia

Country-specific VS data from the Indonesian grey literature were available for dairy cattle and swine. The country-specific VS in swine varied from the average by 0.45 kg/head/year [12]. The average CH4 EF in swine was 9.63 kg CH4/head/year. The country-specific CH4 EF for dairy cattle and swine were 1.25 and 1.6 times higher, respectively, than the default EF (Table 1). This might have been attributed to the difference of the feeding type between Indonesia and the countries that the IPCC had used to determine the default value. The default values of Asia and the developing countries characteristics’ from the 2006 IPCC GL covered information from several countries. However, the difference in the region and livestock species varied among these countries, so that the type of feed, including roughage and forages, also varied. This variation resulted in a different excretion of VS. In Indonesia, the ruminants were mostly raised by traditional farmers. The feed for livestock was low-quality feed or crop waste, which was low in digestibility and high in fiber, resulting in the high excretion of the nutrients that were contained in the manure. Dustan [25] stated that the VS of manure from the animal category would vary with diet and other factors, such a straw addition.

3.3. Country-Specific Nex for Manure Management in Indonesia

The Nex data from Indonesia were available for mature dairy cattle (>3 years), growing beef cattle (1–2 years), growing buffalo (1–2 years), weaning sheep (<6 months), weaning goat (<6 months), and broiler chicken [22] (Table 1). The default Nex showed a higher value than the country-specific Nex. The default Nex from the mature dairy cattle, growing beef cattle, growing buffalo, weaning sheep, weaning goat, and chicken broiler were 2.18, 2.11, 4.12, 6.82, 3.84, and 2.46 times higher, respectively, than the country-specific Nex (Table 1). In general, the differences of the Nex between default from the 2006 IPCC GL and the country-specific might have been attributed to the feeding system, including the type of feed. In Indonesia, the livestock, mostly ruminants, were raised by small farmers. The farmers mostly used sources around the neighborhood or used crop waste like straw, which was low in nutrition, especially protein. Furthermore, additional feed, such as high protein feed, usually was not given to the livestock. Low protein intake resulted in the low Nex. Nevertheless, chicken farms were mostly run by medium to big farmers, with a concern for the quality and nutritional value of the feed, as well as the high digestible feed that affected the amount of nutrients that were excreted. Feeding with high quality protein sources and balancing amino acids allowed producers to reduce the amount of nitrogen that needed to be fed and also decreased the Nex [26].

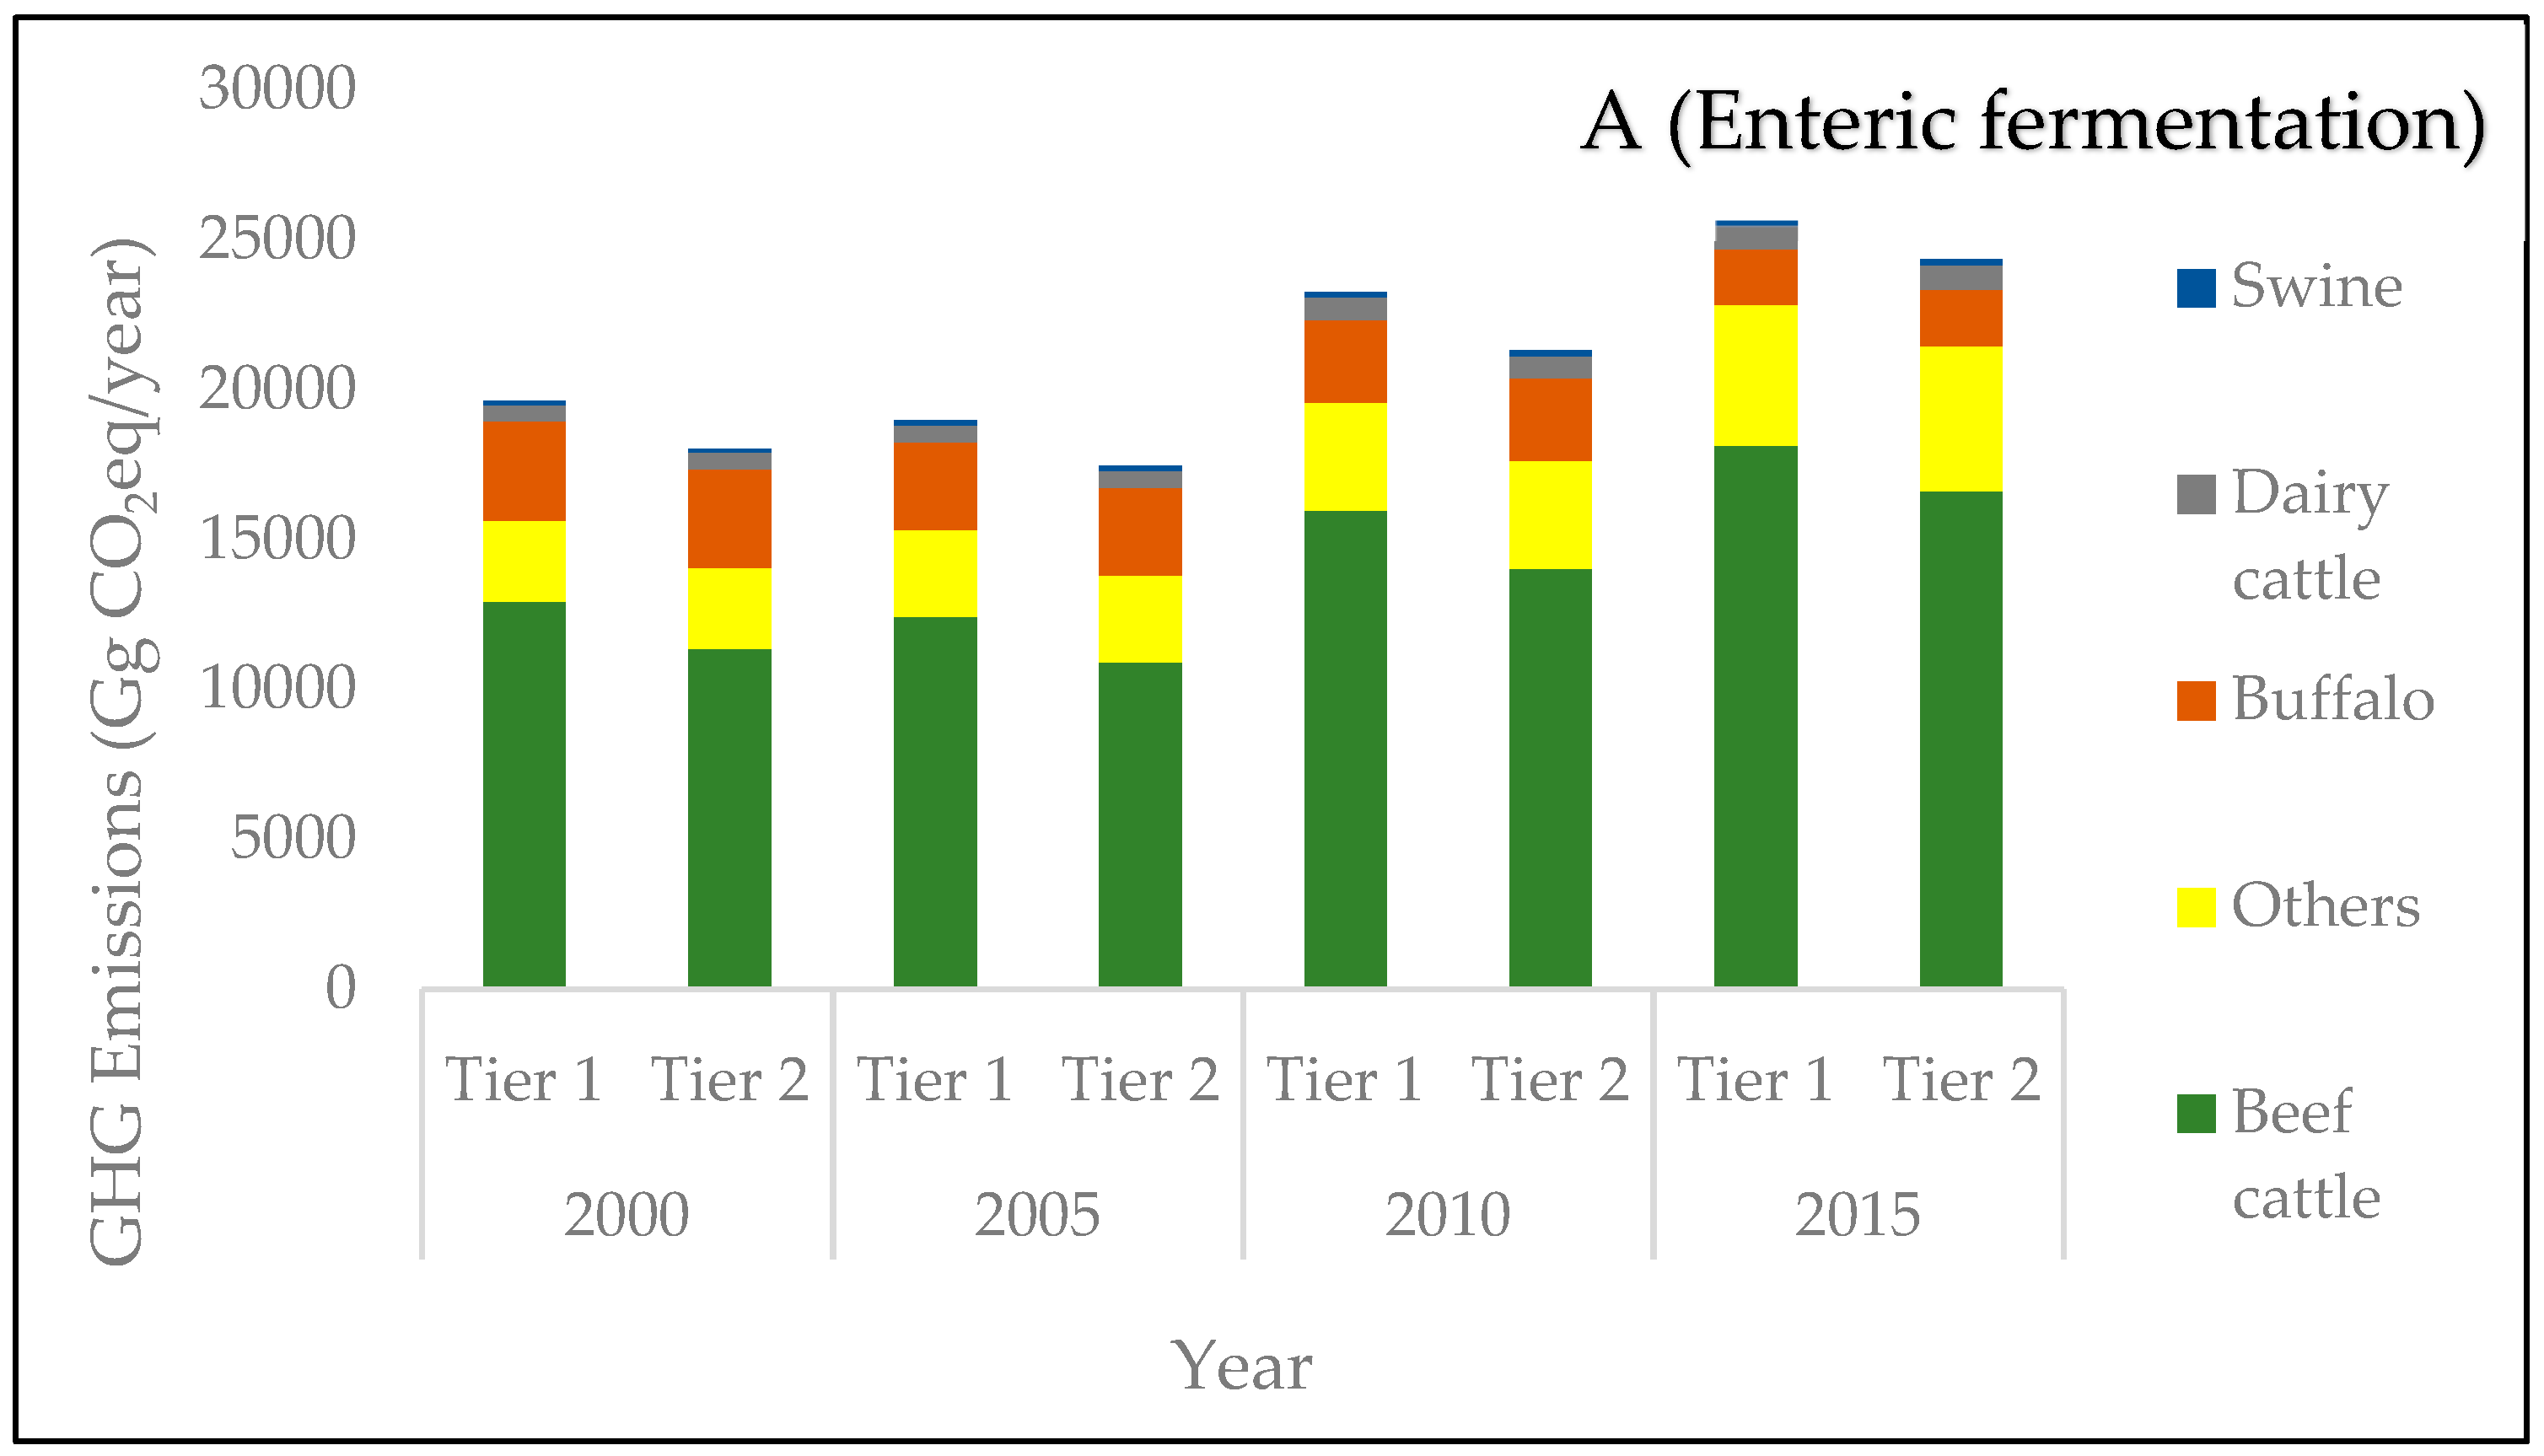
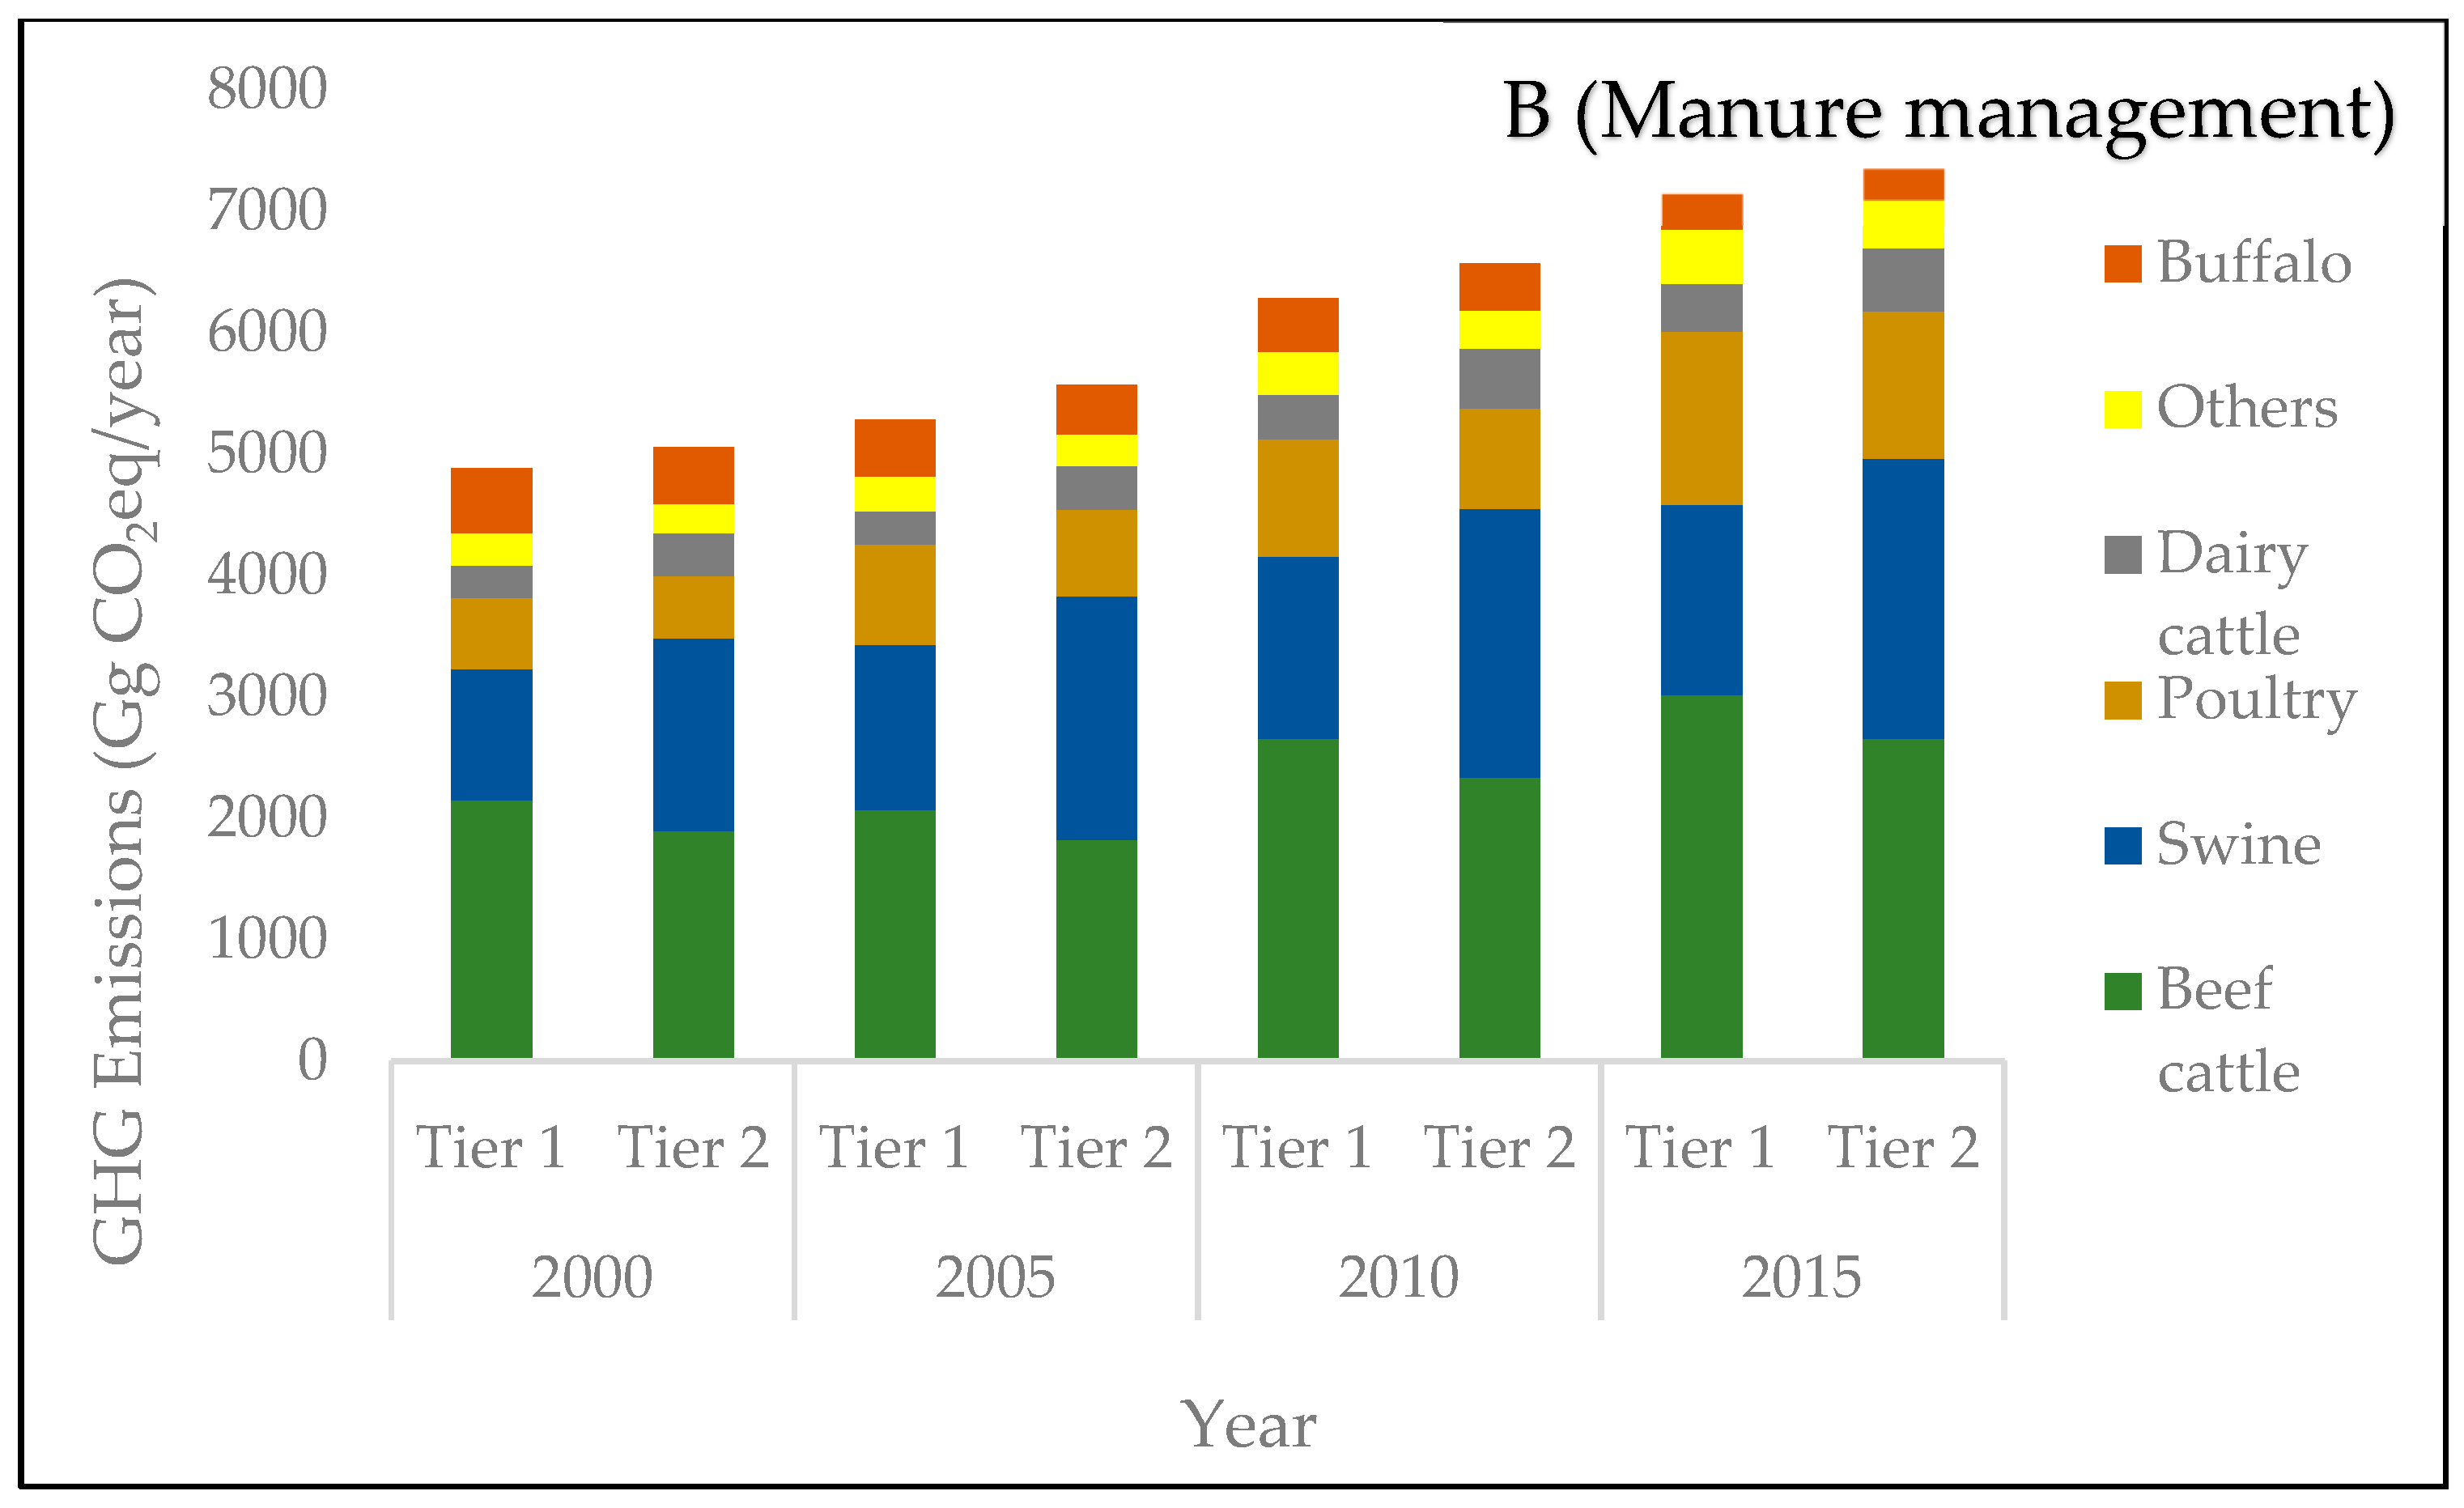
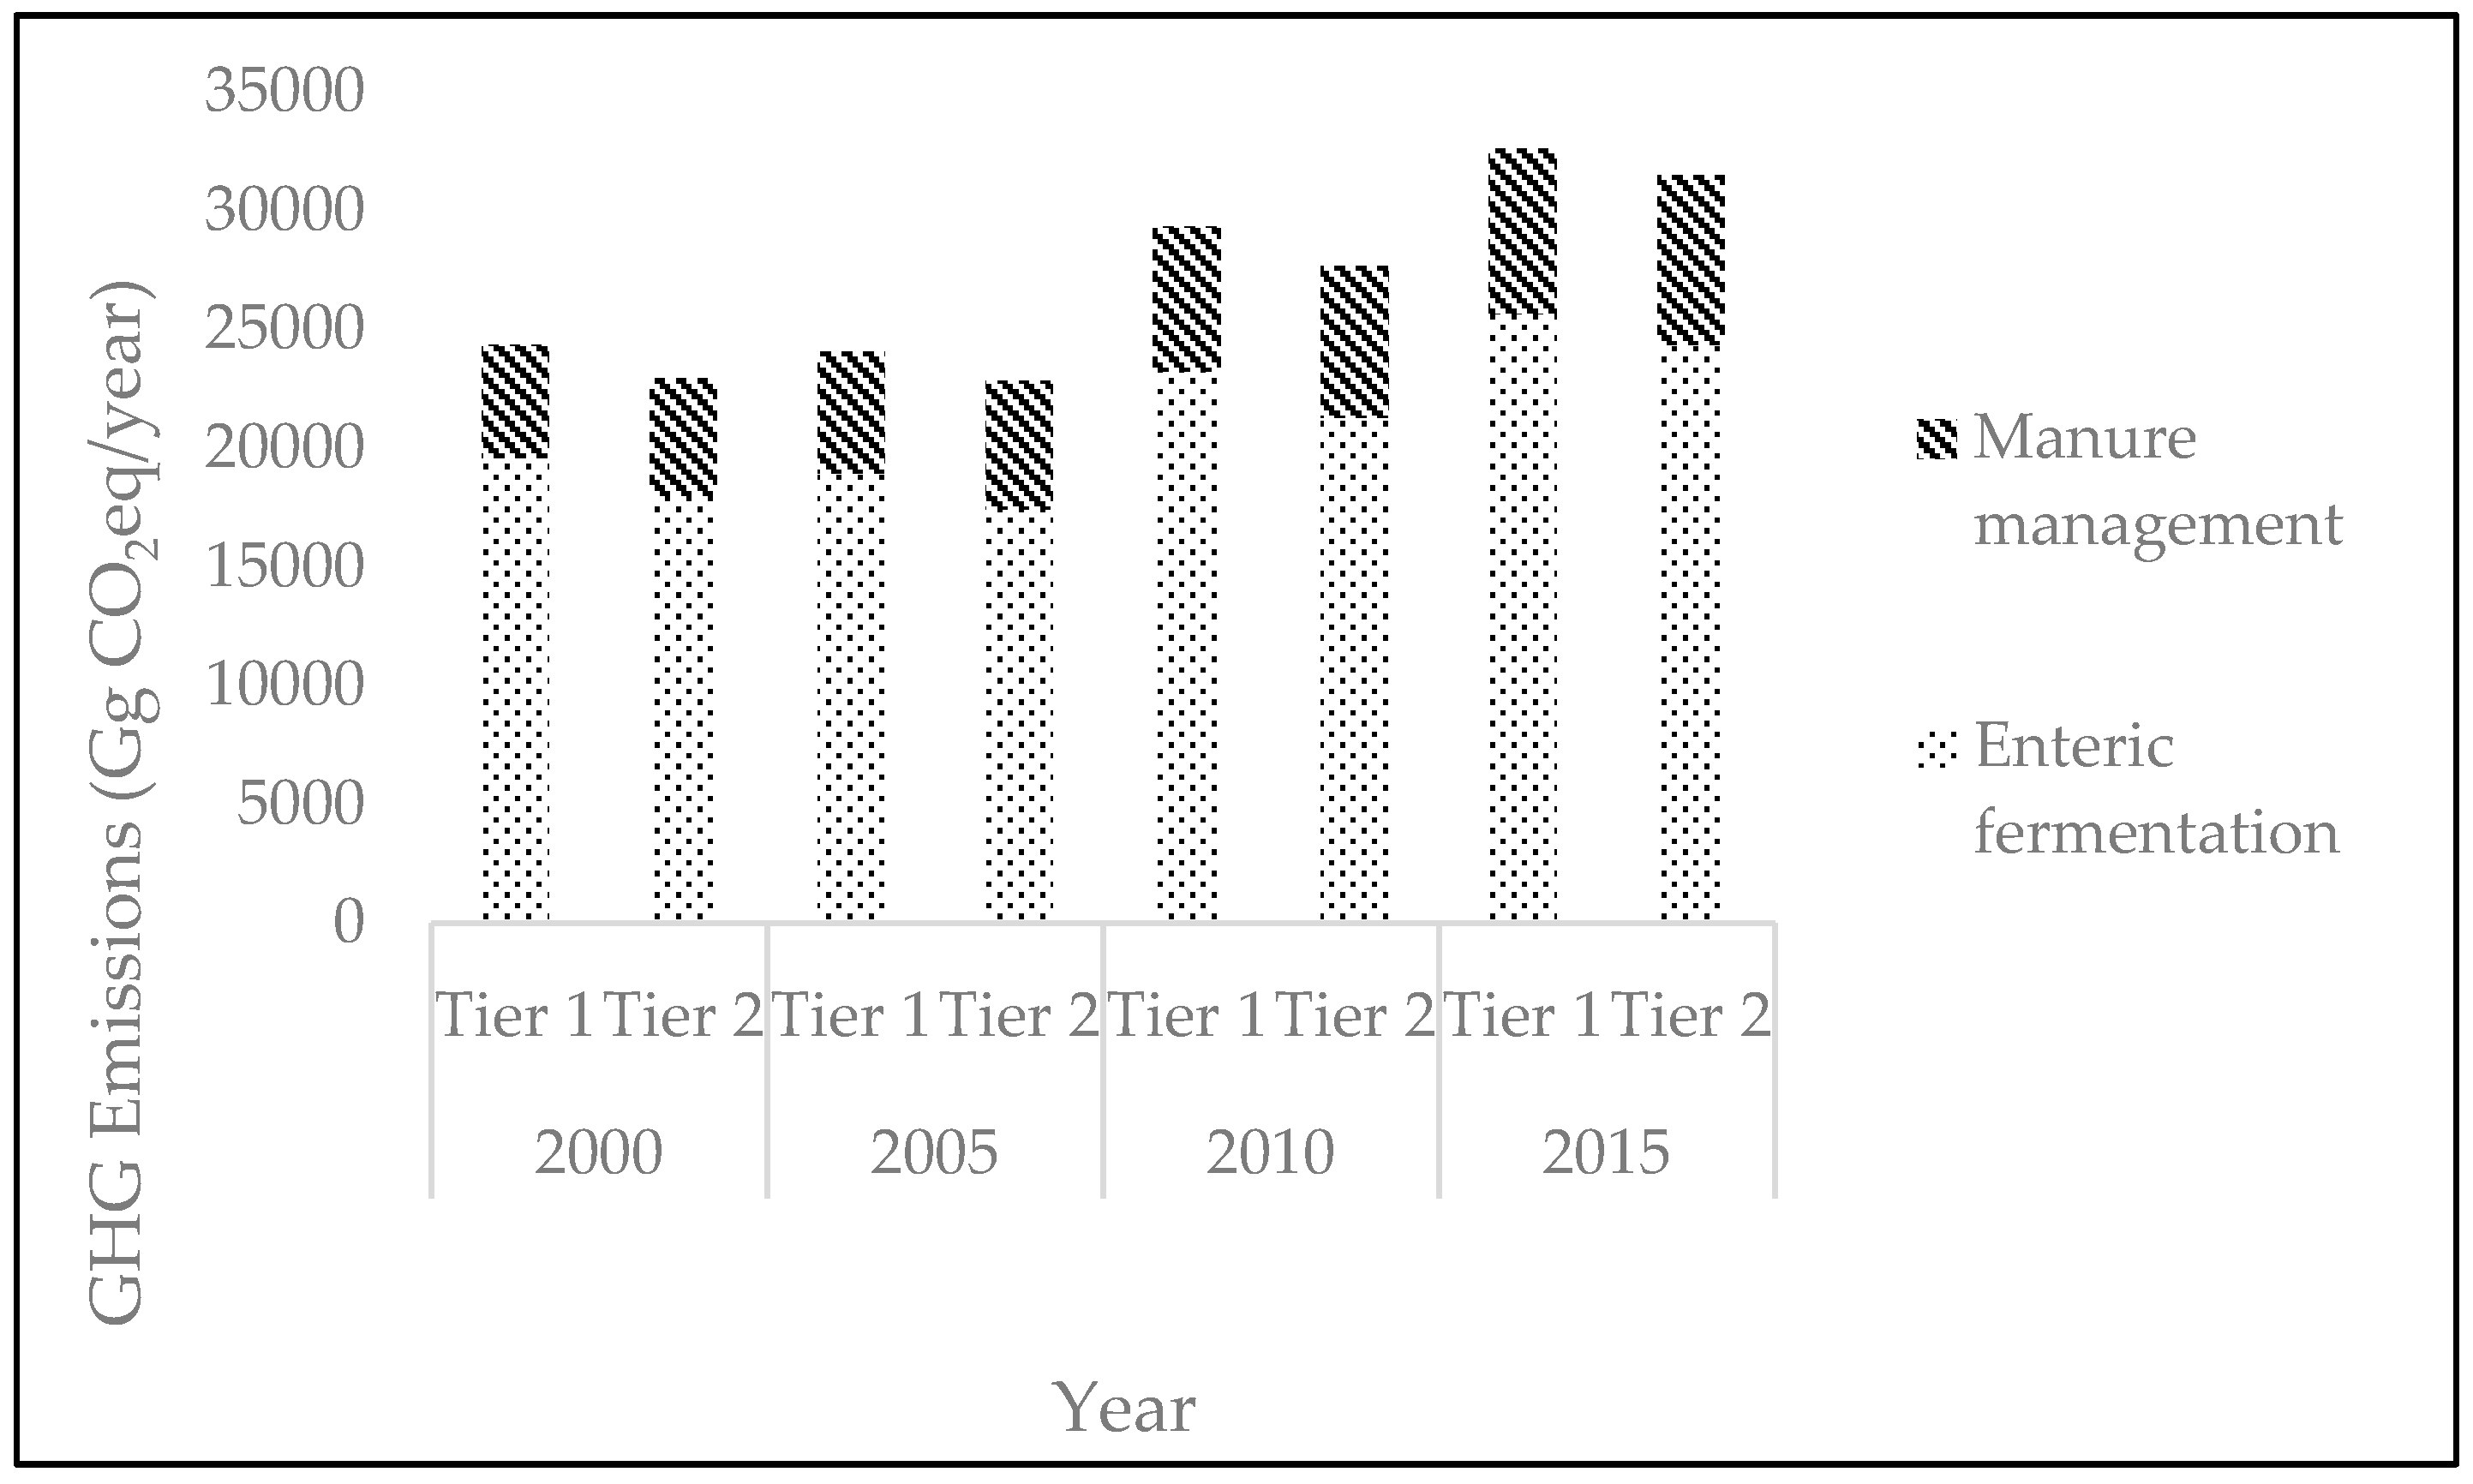
3.4. GHG Emissions from Livestock Sector in Indonesia

Beef cattle was the major emitter of the emissions from enteric fermentation in 2000 to 2015, accounting for 66 to 71% of the Tier 1 and 63 to 68% of the Tier 2 methods (Figure 1A). This high contribution was attributed to the higher EF for the enteric fermentation in beef, compared with other animals in Indonesia. Emission from enteric fermentation had shown a decrease when the Tier 1 was changed to Tier 2 method. From 2000 to 2015, the decrease was approximately 7.39% in average. The cause of this decrease was the lower country-specific EF for beef cattle than for the default EF. The reason was that even though the beef cattle in Indonesia was still raised by small farmers without proper feed management, farmers had started to adopt a supplementation of feed by using leguminous leaves or concentrate, which would increase the quality of the basal feed [23]. Other reasons that were attributed to the low EF were the different of average live weight in Indonesia and the default. The livestock live weight in Indonesia varied between 100 to 400 kg, depending on the growth phase [23], while the default live weight varied from 200 kg to 450 kg, depending on the growth phase, sex, and feeding situation [10]. The nutritional need of the animal depended on the live weight of the animal itself. The large animals consumed more feed than the small animals, resulting in a higher emission of the gases that were produced by digestion, including CH4.
Beef cattle and swine were the major contributors of the emission from the manure management (Figure 1B). The nitrogen excretion from beef cattle was high compared with other livestock, except for dairy cattle, buffalo, and horse, however the beef cattle population was higher than the dairy cattle, buffalo, and horse population, so the beef cattle contributed more N2O emissions than the dairy cattle, buffalo, and horse. This also applied to the swine. The methane EF for the swine was the second highest after dairy cattle. Dairy cattle had the highest CH4 EF, but its population was less than the swine population, so the emission from the dairy cattle was less than that of the swine. Additionally, even though chicken had the largest population among all of the livestock, the VS and Nex values were low. This resulted in a lower contribution of the total emissions from manure management than the beef cattle and swine. High CH4 EF was affected by the high value of methane conversion factor (MCF) and the fraction of manure management system (MS). MCF was the percentage of the manure’s methane-producing capacity. According to IPCC [10], 40% of the manure from swine was handled using liquid/slurry with MCF by 78%, resulting in a high CH4 EF. This showed that the CH4 was highly produced in the liquid/slurry manure handling system, resulting in high CH4 emissions. There was an increase of 4.24% in the emissions from manure management when the calculation method was changed from Tier 1 to Tier 2, during 2000 to 2015 period (Figure 1B). This increase was attributed to the high emission, especially the CH4 emission, by the major emissions contributors, beef cattle and swine, because of the higher country-specific VS excretion than the default VS contribution, which caused higher CH4 EF.
The total emissions from the livestock sector had decreased by approximately 4.98% during 2000 to 2015, when the calculation was changed from the Tier 1 to Tier 2 method. This was attributed to the lower emissions from enteric fermentation using the Tier 2 method, compared with using the Tier 1 method, especially from the highest contributor, beef cattle. The shared emissions from the enteric fermentation and the total emissions from the livestock sector showed a decrease by as much as approximately 2.27% and 1.64% for the Tier 1 or Tier 2 methods, from the period 2000 to 2015 (Figure 2). However, during the same period, the shared emissions from the manure management to the total emissions from the manure management increased by 9% and 6%, using the Tier 1 and Tier 2 methods, respectively (Figure 2). This indicated that the manure management in Indonesia became more important and needed more attention than before, as it could cause environmental problems if improperly handled. In many cases in Indonesia, running water coming from livestock stalls or as the result of watering, flooded the surrounded terrain, which caused pollution of water bodies. Moreover, it caused air pollution, because of the decomposition of livestock organic waste that was disposed of and, when stacked and mounted improperly, could produce harmful gas [27]. There were several options to reduce GHG emissions from manure management, including physical process, such as drying and manure separation, chemical process using additives, or biological process such as anaerobic and aerobic treatment [28]. However, manure separation, aerobic digestion, aeration, and the use of additives and inhibitors to treat the manure from livestock were considered as modern technology and were generally are not feasible because of the high cost, low accessibility, the requirement of high technology, and a lack of knowledge. Simple techniques such as piling, compacting, and covering the manure could be options and have positive effects on reducing emissions and nutrient losses [29].

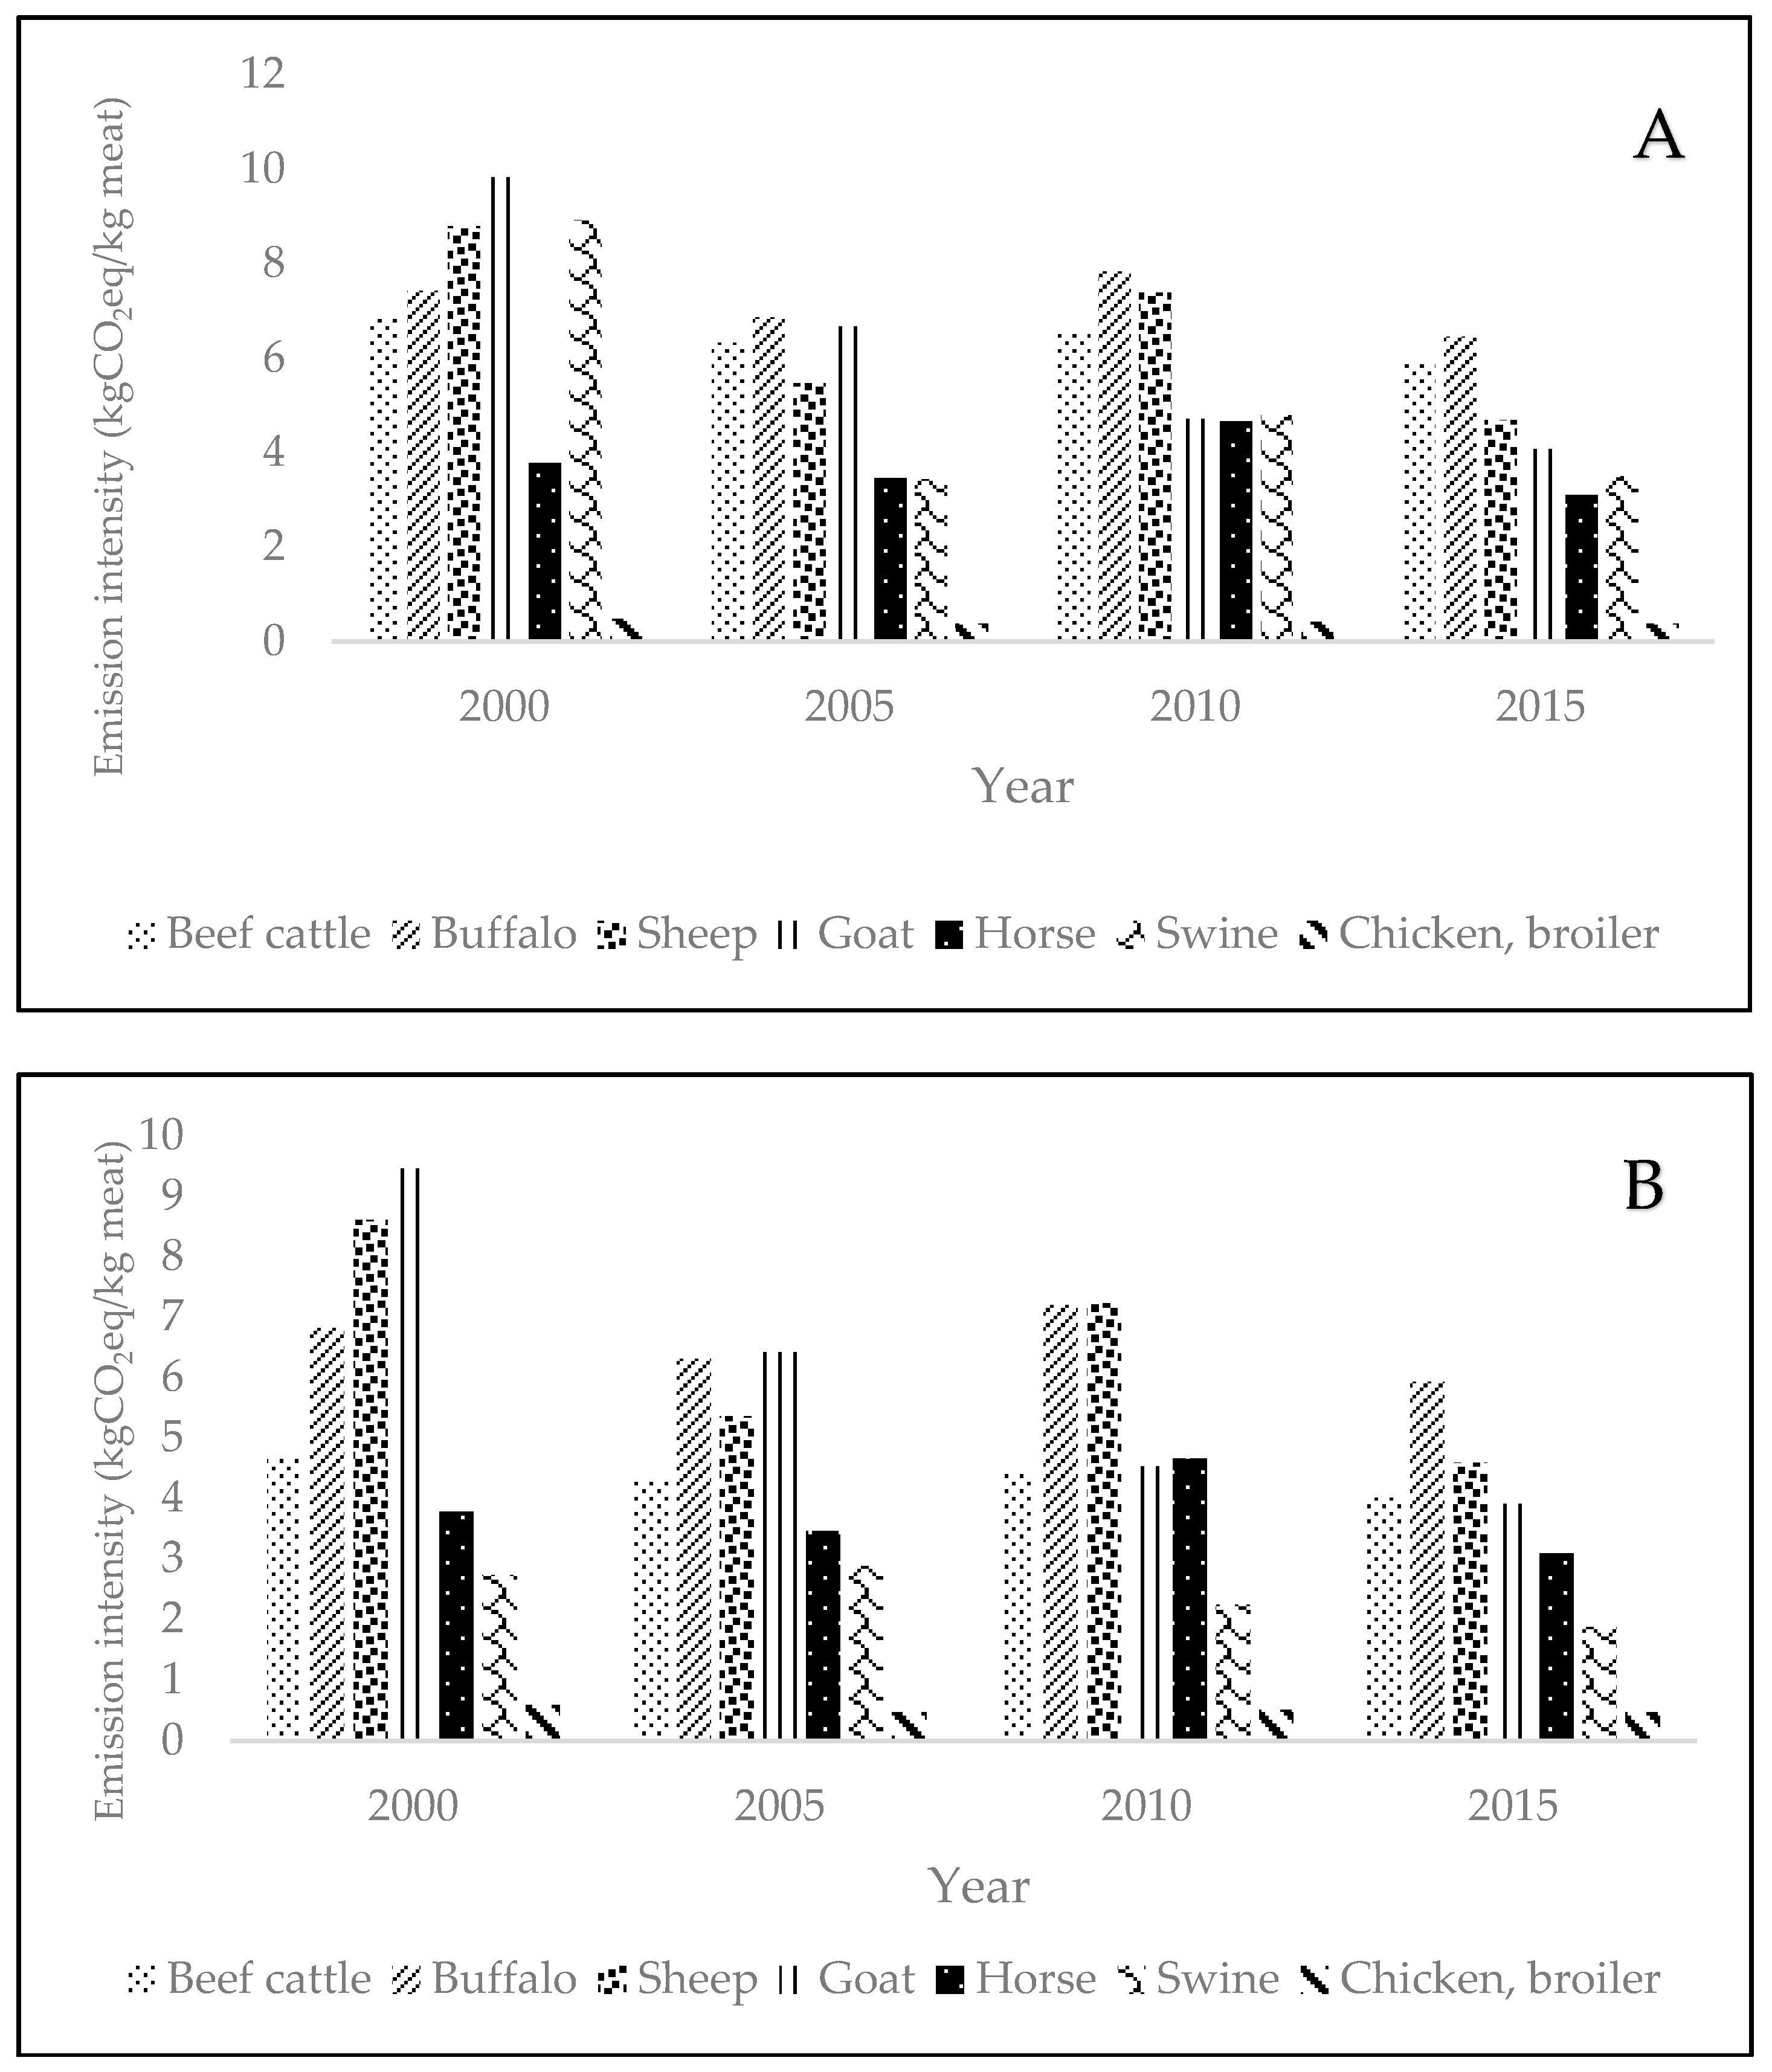
3.5. GHG Emission Intensity

Overall, the emission intensity for livestock in Indonesia showed a reduction from 2000 to 2015. The highest reduction was shown for swine, by 60.77%, from 2000 to 2015 (Figure 3). The decrease of the emission intensity showed that the livestock management became more efficient. The efficiency was reflected from the increase of production (the increase of carcass weight per head of slaughtered animal) that compensated the increase of the GHG emissions that were produced by the livestock, resulting in the decrease of the emission intensity. The carcass weight was calculated by dividing the meat production by the number of slaughtered animals. However, the increase of carcass weight in swine, based on the Livestock Statistic, was unreasonable. The reason was that when the meat production data were divided by the number of slaughtered swine, to determine the carcass weight, the result was higher than the average carcass weight in Indonesia. The carcass weight reached 162.4 kg in 2015. The average carcass weight in Indonesia varied depending on the species and age of slaughter. For example, the carcass weight for Landrace swine, slaughtered at 3 to 4 months of age, was 48 to 50 kg [30] and the Duroc pig varied between 80.38 kg to 112.18 kg for slaughter from 8 to 12 months of age [31]. The unreasonable carcass weight from the Livestock Statistic might have been caused by the irrelevant number of slaughtered animals from the statistic. Compared with the swine population each year, the number of slaughtered swine was small. This was because of the unavailable records of the number of livestock that were slaughtered in the slaughter house, since the data were obtained only from the registered slaughter house and at the certain period of time. In this study, the number of slaughtered swine was calculated using the equation for livestock population from the Livestock and Animal Health Data Collection Guideline (Equation (2), Table 3). In Equation (2), the number of slaughtered animals was determined from several indicators, such as the livestock population, birth and death rate, and the export and import of livestock. Using Equation (2), the swine carcass weight showed a reasonable number and was in the range of the average swine carcass weight in Indonesia when the meat production was divided by the number of slaughtered swine (Table 4), indicating that the number of slaughtered swine from the calculation was correct.
Ruminants, such as buffalo, beef cattle, sheep, and goat, showed a high emission intensity. High emission intensity is caused by the low productivity, compared to the emission produced. Emission intensity was usually related to management practices. The high GHG emission intensities were driven by low animal productivity across large areas of arid lands, the use of low-quality feeds, feed scarcity, and animals with low productive potential that were often used for draft power and to manage household risk, as well as for production [32]. In Indonesia, ruminants were mostly raised traditionally by smallholders and more than 90% of the beef cattle production in Indonesia were derived from small holder cattle operations, often with only 2–3 cattle per household [33]. Beef and dairy cattle, especially in developing countries, represented the largest source of livestock-related emissions because of both the abundance of these animals and the fact that emissions per animal were substantially higher for cows than for the other livestock categories [34]. For this reason, the substitution of swine and poultry for beef was an option for mitigating livestock emissions [34]. However, considering Indonesia as the largest Muslim country, the substitution of swine for beef was hardly possible. The possible mitigations would have been development from ruminant farming, following intensification and better management practices, and the development of chicken farming.
The broiler chickens showed the lowest emission intensity. The low emission intensity in chicken was caused by the equality of the increase of the GHG emissions and the increased production. Low emission intensity reflected that there was a more efficient production because of the compensation of productivity to the GHG emission [35]. In most cases, swine and poultry farms were industrial farms that used the ideal feed ration to meet the nutritional need of the livestock, resulting in feed efficiency that led to greater production. In the application of the livestock industry, the enzymes were widely added to the feeds for the pigs and poultry, and these contributed (with breeding) to the substantial gains in the feed conversion efficiency that were achieved [36]. The industrial pig and poultry sectors consumed high quality, balanced concentrate diets, and tended to use animals of high genetic potential [35].

4. Conclusions

In the process of the 2006 IPCC GL Tier 2 method application, Indonesia requires more observation on the country-specific data, especially for manure management, which are VS and Nex. Country-specific data are more certain than the default values, thus the improvement of the country-specific data is needed. Data presented in any grey literature such as publication, research papers, and theses, can be obtained and used to estimate the GHG emissions with the Tier 2 method, in accordance with the rules and regulations that have been set by the IPCC. However, further research should be taken to assure the use of grey literature as a data source for building up country-specific data in Indonesia. There was an irrelevant number of slaughtered swine from the Livestock Statistic. Hence, to calculate the carcass weight of swine in Indonesia, the number of slaughtered swine can be calculated using Equation (2) from the Livestock and Animal Health Data Collection Guideline, in order to get the correct number. For this reason, Indonesia needs to improve its livestock statistic, in order to provide the accurate information. In this study, although only some of the country-specific data were used, there was an increase in emissions from the manure management when the Tier 1 method was changed to the Tier 2 method, with beef cattle and swine as major emitters. Moreover, enteric fermentation was the main source for GHG emissions from the livestock sector, but the share of GHG emissions from the manure management had increased during 15 years period, indicating that manure production increased and manure should be handled more seriously. The overall emission intensity in Indonesia decreased, indicating there had been better production. Higher emission intensities were showed by ruminants, whereas the lowest emission intensity was shown by chicken. Emission intensity could be lowered by increasing the production along with a decrease in emissions. This could be achieved by the improvement of livestock management practices, such as diets, genetic, health, and manure management. Management improvement can increase production and lower the emission, and thus, lower the emission intensity. In conclusion, in order to supply the meat demand and reduce the environmental impact of the livestock industry, chicken farming could be the first option to be developed considering its efficiency, while the improvement of management practices is needed for other livestock, especially ruminants, to increase productivity. Manure management should also be of concern, especially for beef cattle and swine. Simple techniques such as pile stocking or covering can be applied to reduce the GHG emissions in Indonesia.

Author Contributions

E.N. conducted literature review and data collection, analyzed data, and drafted the manuscript. C.Y.B. and H.J.J. applied life cycle assessment, analyzed data, and revised the manuscript. J.H.J. conducted literature review and data collection. K.H.P. designed the study, and drafted and revised manuscript.

Acknowledgments

This work was carried out with the support of ‘Cooperative Research Program for Agriculture Science & Technology Development’ (Project title: Livestock productivity change analysis with climate change, Project No. PJ01277101), Rural Development Administration, Republic of Korea, and this study was supported by the ‘2014 Research Grant from Kangwon National University’.

Conflicts of Interest

The authors declare no conflict of interest.

References

  1. Smith, P.; Bustamante, M. Agriculture, Forestry, Forestry and Other Land Use (AFOLU). In Climate Change 2014: Mitigation of Climate Change. Contribution of Working Group III to the Fifth Assessment Report of the Intergovernmental Panel on Climate Change; Cambridge University Press: Cambridge, UK; New York, NY, USA, 2014. [Google Scholar]
  2. Alexandratos, N.; Bruinsma, J. World Agriculture towards 2030/2050: The 2012 Revision; ESA Working Paper; FAO: Rome, Italy, 2012. [Google Scholar]
  3. Ministry of Environment. Indonesia Second National Communication under the United Nations Framework Convention on Climate Change; Indonesian Ministry of Environment: Jakarta, Indonesia, 2010.
  4. Ministry of Agriculture. Livestock and Animal Health Statistic; Directorate General of Livestock and Animal Health, Indonesian Ministry of Agriculture: Jakarta, Indonesia, 2013.
  5. Ministry of Agriculture. Livestock and Animal Health Statistic; Directorate General of Livestock and Animal Health, Indonesian Ministry of Agriculture: Jakarta, Indonesia, 2016.
  6. Department of Agriculture. Livestock Statistic; Directorate General of Livestock and Animal Health, Indonesian Ministry of Agriculture: Jakarta, Indonesia, 2001.
  7. Verge, X.P.C.; Dyer, J.A.; Desjardins, R.L.; Worth, D. Long-term trends in greenhouse gas emissions from the Canadian poultry industry. J. Appl. Poult. Res. 2009, 18, 210–222. [Google Scholar] [CrossRef] [Green Version]
  8. Gerber, P.J.; Henderson, B.; Makkar, H.P. Mitigation of Greenhouse Gas Emissions in Livestock Production—A Review of Technical Options for Non-CO2 Emission; FAO Animal Production and Health Paper; FAO: Rome, Italy, 2013. [Google Scholar]
  9. World Bank. Climate Historical Data. Available online: http://sdwebx.worldbank.org/climateportal/index.cfm?page=downscaled_data_download&menu=historica (accessed on 28 April 2018).
  10. IPCC. 2006 IPCC Guidelines for National Greenhouse Gas Inventories; Eggleston, H.S., Buendia, L., Miwa, K., Ngara, T., Tanabe, K., Eds.; Prepared by the National Greenhouse Gas Inventories Programme; IGES: Kanagawa, Japan, 2006. [Google Scholar]
  11. Sukardi, S. Metabolisme Protein dan Laju Penurunan Produksi Susu Akibat Pemberian Souropus androgimus Men (Katu) pada Ransum Sapi Perah Friesian Holstein (Protein Metabolism and Decrease Milk Production Consequence Intake Sauropus androgynus Men (Katu) on Milk Cow Friesian Holstein Feeding). Ph.D. Thesis, Diponegoro University, Semarangg, Indonesia, 2005. [Google Scholar]
  12. Boonyanuwat, K.; Lavan, K.; Sithambaram, S.; Widyawati, Y. Improved Inventory and Mitigation of Greenhouse Gases in Livestock Production in South East Asia; A Final Report Submitted to Livestock Emissions & Abatement Research Network (LEARN); LEARN: Palmerston North, New Zealand, 2013. [Google Scholar]
  13. Widodo, S.; Rianto, E.; Purnomoadi, A. Nitrogen Balance in You Buffalo Fed with Rice Straw as Basal Ration Supplemented with Urea Molasses. Seminar Nasional Teknologi Peternakan dan Veteriner. 2002. Available online: http://peternakan.litbang.pertanian.go.id/fullteks/semnas/pronas02-22.pdf?secure=true (accessed on 28 April 2018).
  14. Yulistiani, D.; Mathius, I.W.; Puastuti, W. Bungkil kedelai terproteksi tannin cairan batang pisang dalam pakan domba sedang tumbuh. Substitution of commercial concentrate with soy bean meal protected by tannin from banana stem juice for lambs. JITV Indones. J. Anim. Vet. Sci. 2011, 16, 33–40. [Google Scholar]
  15. Tahuk, P.K.; Baliarti, E.; Hartadi, H. Keseimbangan nitrogen dan kandungan urea dalam darah kambing Bligon pada penggemukan dengan level protein pakan berbeda (Nitrogen balance and blood urea nitrogen in bligon goats fed finishing diet with different protein level). J. Indones. Top. Anim. Agric. 2008, 33, 290–298. [Google Scholar]
  16. Dinata, A.A.N.B.S.; Putra, S. Neraca Nitrogen Kambing Peranakan ETAWA yang Diberikan Tingkat Konsentrat dan Hijauan Berbeda (The Nitrogen Balance in Ettawah Descendant Goat Is Fed Different Level of Concentrate and Forage Diets); Indonesian Publication Index: Yogyakarta, Indonesian, 2015. [Google Scholar]
  17. Praceka, G.N. Pemberian Tepung Kencur (Kaemferia galangal linn) Dalam Ransum Ayam Broiler Rendah Energy dan Protein Terhadap Energy Metabolis dan Retensi Nitrogen (The Effects of Kaemferia galangal linn Supplementation in Low Dietary Energy and Protein Broiler Diets on Metabolizable Energy and Protein Retention). Master’s Thesis, Bogor Institute of Agriculture, Bogor, Indonesia, 2008. [Google Scholar]
  18. Yusuf, M.S.; Arfah, E. Pemanfaatan Kotoran Ternak Sebagai Energy Alternative Untuk Pembangkit Listrik Tenaga Biogas di Desa Nongkojajar Kabupaten Pasuruan (Biogas Power Plant Based on Dairy Cow Manure in Nongkojajar). Seminar Nasional Sains dan Teknologi Terapan II. 2014. Available online: http://jurnal.itats.ac.id/wp-content/uploads/2016/04/PEMANFAATAN-KOTORAN-TERNAK-SEBAGAI-ENERGI-ALTERNATIF-UNTUK-PEMBANGKIT-LISTRIK-TENAGA-BIOGASDI-DESA-NONGKOJAJAR-KABUPATEN-PASURUAN.pdf (accessed on 28 April.2018).
  19. Hindratiningrum, H.; Bata, M.; Suparwi, S. Microbial protein production and nitrogen balance of local streed fed ammoniated rice straws added. Indones. J. Anim. Prod. Anim. Prod. 2011, 11, 116–121. [Google Scholar]
  20. IPCC. Working Group I Approach to the Use of Literature in IPCC Reports: 2010. Available online: wg1.ipcc.ch/guidancepaper/AR5GuidanceNotes_Literature.pdf (accessed on 28 May 2018).
  21. IPCC. Climate Change 2007: The Physical Science Basis. Contribution of Working Group I to the Fourth Assessment Report of the Intergovernmental Panel on Climate Change; Cambridge University Press: Cambridge, UK; New York, NY, USA, 2007. [Google Scholar]
  22. Department of Agriculture. Livestock Statistic; Directorate General of Livestock and Animal Health, Indonesian Ministry of Agriculture: Jakarta, Indonesia, 2006.
  23. Ministry of Agriculture. Pedoman Pengumpulan Data Peternakan dan Kesehatan Hewan Tahun 2011; Directorate General of Livestock and Animal Health, Indonesian Ministry of Agriculture: Jakarta, Indonesia, 2011.
  24. Widiawati, Y.; Rofiq, M.N.; Tiesnamurti, B. Methane emission factors for enteric fermentation in beef cattle using IPCC Tier-2 method in Indonesia. Jurnal Ilmu Ternak dan Veteriner 2016, 21, 101–111. [Google Scholar] [CrossRef]
  25. Dustan, A. Review of Methane and Nitrous Oxide Emission Factors from Manure Management in Cold Climates; JTI: Uppsala, Sweden, 2002; ISSN 1401-4963. [Google Scholar]
  26. Manitoba Agriculture Food and Rural Development. Manitoba Agriculture Food and Rural Development. 2015. Available online: https://www.gov.mb.ca/agriculture/environment/nutrient-management/pubs/properties-of-manure.pdf (accessed on 28 April 2018).
  27. Sudiarto, B. Integrated Livestock Waste Management and Environmentally Agribusiness. 2008. Available online: http://peternakan.litbang.pertanian.go.id/fullteks/semnas/pro08-8.pdf?secure=1 (accessed on 28 April 2018).
  28. Ogejo, J.A. Selecting a Treatment Technology for Manure Management; Virginia Cooperative Extension: York County, VA, USA, 2009. [Google Scholar]
  29. Forabosco, F.; Chitchyan, Z.; Mantovani, R. Methane, nitrous oxide emissions, and mitigation strategies for livestock in developing countries: A review. S. Afr. J. Anim. Sci. 2017, 47, 268–280. [Google Scholar] [CrossRef]
  30. Gerungan, M.S.; Lapian, M.T.R.; Kalele, J.A.D.; Poli, Z. Kualitas karkas ternak babi grower yang menggunakan tepung kulit kopi sebagai pengganti sebagian dedak pada ransum (Effect of coffee skin flour as a substitute for rice bran in the ration on carcass quality of grower pigs). Zootek J. 2017, 37, 386–394. [Google Scholar]
  31. Aritonang, S.N.; Pinem, J.; Pelawi, T.A. Pendugaan bobot karkas, persentase karkas, dan tebal lemak punggung babi duroc jantan berdasarkan umur ternak. The prediction of carcass weight, percentage of carcass, and back fat thickness of male duroc pig based on their age. Jurnal Peternakan Indonesia 2011, 13, 120–124. [Google Scholar]
  32. Herrero, M.; Henderson, B.; Havlík, P.; Thornton, P.K.; Conant, R.T.; Smith, P.; Wirsenius, S.; Hristov, A.N.; Gerber, P.; Gill, M.; et al. Greenhouse gas mitigation potentials in the livestock sector. Nat. Clim. Chang. 2016, 6, 452. [Google Scholar] [CrossRef]
  33. Priyanti, A.; Hanifah, V.W.; Mahendri, I.G.A.P.; Cahyadi, F.; Cramb, R.A. Small-scale beef cattle production in East Java Indonesia. In Proceedings of the 56th AARES Annual Conference, Fremantle, Australia, 7–10 February 2012. [Google Scholar]
  34. Henry, B.; Charmley, E.; Eckard, R.; Gaughan, J.B.; Hegarty, R. Livestock production in a changing climate: Adaptation and mitigation research in Australia. Crop Pasture Sci. 2012, 63, 191–202. [Google Scholar] [CrossRef]
  35. Verge, X.P.C.; Dyer, J.; Desjardins, R.L.; Worth, D. Greenhouse gas emissions from the Canadian swine industry. Livest. Sci. 2009, 121, 92–101. [Google Scholar] [CrossRef]
  36. Thornton, P.K. Livestock production: Recent trends, future prospects. Philos. Trans. R. Soc. B 2010, 465, 2853–2867. [Google Scholar] [CrossRef] [PubMed]
Figure 1. Greenhouse gas emissions from enteric fermentation and manure management system in Indonesia. (A) Year 2000 to 2015 emissions from enteric fermentation in Indonesia; Tier 1: default value, Tier 2: default and country-specific data; (B) Year 2000 to 2015 emissions from manure management in Indonesia. Other included sheep, goat, and horse livestock. Poultry included broiler chicken, layer chicken, native chicken, and duck.
Sustainability 10 01912 g001aSustainability 10 01912 g001b
Figure 2. Year 2000 to 2015 greenhouse gas (GHG) emissions from the livestock sector in Indonesia.
Sustainability 10 01912 g002
Figure 3. Total emissions were based on slaughtered animals from 2000 to 2015 by livestock categories. (A) Trends of emission intensity using the Tier 1 method from 2000 to 2015; (B) trends of emission intensity using the Tier 2 method.
Sustainability 10 01912 g003
Table 1. Comparison of country-specific volatile solid (VS), nitrogen excretion (Nex) and the 2006 Intergovernmental Panel on Climate Change Guideline (2006 IPCC GL) default VS and Nex for manure management.
CategorySub CategoryABW (kg)VS (kg VS/Head/Day)EF (kg CH4/Head/Year)N Value
C-SDC-SDC-SDC-S Nex (kg N/Head/Year/)D Nrate (kg N/1000 kg/Day)D Nex (kg N/Head/Year)
Dairy cattleWeaningNA3503.80 (g)2.838.6228NA0.4760.04
GrowingNANA
Mature415.42 (a)27.59 (a)
Beef cattleWeaningNA319NA2.3NA1NA0.3439.59
Growing200 (b)NANA18.76 (h)
MatureNANANANA
BuffaloWeaningNA380NA3.9NA2NA0.3244.38
Growing164.1 (c)NANA10.77 (c)
MatureNANANANA
SheepWeaning15.5 (d)28NA0.32NA0.202.38 (d)1.1711.96
GrowingNANANANA
MatureNANANANA
GoatWeaning21.53 (e)30NA0.35NA0.224.15 (e)1.3715.00
GrowingNANANANA
MatureNANANANA
SwineWeaning16 (b)280.14 (b)0.33.006NA0.424.29
Growing60 (b)0.51 (b)10.92NA
Mature100 (b)0.70 (b)14.98NA
Chicken, broilerFinisher1.46 (f)NRNA0.01NA0.020.24 (f)1.100.59 *
(a) [11]; (b) [12]; (c) [13]; (d) [14]; (e) [15,16]; (f) [17]; (g) [18]; (h) [19]; ABW—average body weight; C-S—country-specific; D—default; NR—not reported; NA—not available; * Nex were calculated based on default Nex (kg 1000 kg mass/animal/day) and default ABW; ** Calculated using ABW from country-specific data; NA—not available.
Table 2. The 2000 to 2015 livestock population in Indonesia.
Livestock CategorySub-CategoryPortion (a) (%)Population (×1000 Heads) (b)
2000200520102015
Dairy cattleWeaning2277.979.4107.5114.1
Growing2485.086.6117.2124.5
Mature54191.2194.9263.8280.1
Beef cattleWeaning192091.52008.12580.52929.7
Growing262862.12747.93531.24009.1
Mature556054.45813.07469.98480.8
BuffaloWeaning16384.8340.5319.9215.5
Growing21505.1446.9419.9282.9
Mature631515.21340.61259.8848.6
SheepWeaning282079.62331.63003.14766.9
Growing261931.02165.02788.64426.4
Mature463416.43830.44933.77831.4
GoatWeaning273392.83620.44487.35133.5
Growing273392.83620.44487.35133.5
Mature465780.46168.17645.08745.9
SwineWeaning321714.22176.32392.52498.6
Growing331767.82244.32467.32576.7
Mature351875.02380.42616.82732.8
Chicken, broilerFinisher100530,874.0811,189.0986,871.71,528,329.2
Chicken, nativeWeaning3693,332.5100,423.492,715.9102,709.5
Growing3282,962.289,265.382,414.191,297.4
Mature3282,962.289,265.382,414.191,297.4
Chicken, layerWeaning106936.68479.010,521.015,500.7
Growing117630.39326.911,573.117,050.8
Mature7954,799.166,984.183,115.9122,455.8
DuckWeaning164645.65184.87088.37251.5
Growing216097.46805.19303.49517.6
Mature6318,292.120,415.227,910.328,552.9
HorseWeaning1978.373.579.581.8
Growing2394.889.096.399.0
Mature58239.0224.5242.8249.6
Total928,061.01,249,320.01,445,237.92,075,524.1
(a) [5]; (b) [4,5,6,22].
Table 3. Calculation for the number of slaughter animal for swine.
YearPo
(heads)
%B aB
(heads)
%D aD
(heads)
E
(heads)
I
(heads)
Pt
(heads)
S
(heads)
20007,041,820 b95.126,698,17919.591,379,493443,322 b227,263 b5,356,8346,787,614
20055,980,148 c95.125,688,31719.591,171,5111,145,434 c239,341 c6,800,6982,790,163
20106,975,000 d95.126,634,62019.591,366,403226,533 d219,694 d7,477,0004,759,379
20157,694,000 e95.127,318,53319.591,507,255486,541 e202,971 e7,808,0875,413,621
Based on the survey of the livestock household from 2008 by BPS-Statistic Indonesia and the Directorate General of Livestock Services (a–e): a [5]; b [6]; c [22]; d [4]; e [5].
Table 4. The 2000–2015 livestock production in Indonesia.
LivestockYearMeat Production
Total Slaughter (Heads)Average Carcass Weight (kg)Total Meat Production (Tonnes) a
Beef cattle20001,695,374200.5339,900
20051,653,770216.9358,700
20102,068,706211.0436,500
20152,175,000233.0506,700
Buffalo2000213,450215.045,900
2005163,848232.538,100
2010176,198203.735,900
2015143,000247.635,400
Sheep20001,873,36824.044,900
20051,228,27738.547,300
20101,574,82628.544,900
2015990,00044.944,500
Goat20002,385,02514.033,400
20052,451,58420.650,600
20102,354,54229.268,800
20151,919,00033.864,900
Swine *20001,459,214111.3162,400
20051,646,482105.5173,700
20101,563,353135.6212,000
20152,033,000162.4330,200
Swine **20006,787,61423.93162,400
20052,790,16362.25173,700
20104,759,37944.54212,000
20155,413,62160.99330,200
Chicken, broiler ***2000530,874,0001.0555,218
2005811,189,0001.31,080,500
2010986,872,0001.21,214,300
20151,528,329,0001.32,030,900
Horse20007219138.51000
200510,565151.41600
201017,790112.42000
201513,000169.22200
a [4,5,6,24]; * The number of slaughtered animals based on the livestock statistics; ** The number of slaughtered animals based on the calculations from the Livestock and Animal Health Data Guideline (2011); *** The slaughtered population was considered as much as the total population.

