Abstract
In response to global climate change, China has voluntarily assumed responsibility and has pledged to reach its peak in carbon emissions by 2030. Industrial structure and urbanization have important impacts on energy consumption. This paper empirically analyzes the dynamic influence of industrial structure and urbanization on energy consumption in the Zhejiang Province of China by constructing a structural vector auto regressive model using impulse response function and variance decomposition. The results show a positive impact of urbanization on energy consumption, which increases and then gradually decreases, and an impact of industrial structure on energy consumption. The results also indicate that it will take a certain period of time for an increase in the proportion of tertiary industry to curb the growth of energy consumption. Urbanization has a greater impact on energy consumption than does industrial structure.
1. Introduction
Although China is a developing country, it has assumed responsibility for addressing the problem of global climate change. In July 2015, China officially announced its Intended Nationally Determined Contributions (INDC) and determined its 2030 targets in accordance with its respective national conditions, stages of development, strategy of sustainable development, and international responsibility. One target is that China will reduce its carbon dioxide emissions per unit of GDP by 60–65% of 2005 levels, and non-fossil energy will account for 20% of primary energy consumption []. China’s goals have been well received by the international community, and it has contributed to the Paris Agreement. Furthermore, China’s 13th Five-Year Plan for Energy specifically noted that China will implement a dual-control policy of total energy consumption and energy intensity. The plan also clearly indicated that China’s total energy consumption will remain less than 5 billion tons of standard coal, and coal consumption will reach less than 4.1 billion tons by 2020 []. China has established a decomposition mechanism for each province; consequently, controlling total energy consumption has been incorporated into the development requirements of the provinces as an important binding target [].
According to the BP Statistical Review of World Energy 2017 [], much of the substantial improvement in global carbon emissions from energy consumption can be attributed to changes in the patterns of energy consumption in China. However, this report also revealed that China remained the world’s largest growth market for energy. In 2016, total energy consumption in China amounted to 4.36 billion tons of standard coal, which represents a growth rate of 1.4%, and coal consumption accounted for 62% of total energy consumption. Some studies [,,] predict that China’s carbon emissions and energy will increase in the coming decades, and almost all of the conclusions claim that China still needs to make even greater changes. Because of the high levels of carbon emissions, coupled with political and technological uncertainties during the process, China should dedicate greater effort to meeting its scheduled emission-reduction targets [,].
Providing insight into the impact of energy consumption is essential for analyzing the mechanisms of increased energy use. The relationship between energy consumption and industrial structure changes is an important and challenging issue for policy makers [,]. Industrial restructuring, particularly when secondary industry unceasingly declines and tertiary industry rises, may reduce energy intensity and CO2 emission [,,]. Based on research into the relationship among industrial structure, energy structure, and carbon emission in China, Zhang [] emphasized that energy-saving emission reduction should occur mainly through improvements in products and energy-saving technologies in secondary industry. Nevertheless, increasing the proportion of tertiary industry is modestly challenging for social resources, energy planning and technological innovation under environmental regulation []. Zhu et al. [] used Tianjin, China as a case study and found that the growing importance of tertiary industry and services (including producer services and consumer services) led to an increase in CO2 emissions because of their growing share of net exports and final demand on the industrial structure. Thus, it is necessary to study the impact of tertiary industry on energy consumption.
Many scholars are concerned that, as a corollary of the relationship between urbanization, urban environments and energy consumption are under growing pressure [,,]. Urbanization is characterized by rapid population transfer from rural to urban areas, and it ameliorates production methods and the lifestyles of residents, but also increases the personal consumption of energy as well as the consumption of energy used for the construction of public infrastructure and for transportation and its infrastructure, which causes a tremendous increase in total energy demand [,,]. Phetkeo and Shinji [] used the stochastic impacts by regression on population, affluence, and technology (STIRPAT) model to study the impact of urbanization on energy using the different stages of 99 countries, and their findings suggest that the impact of urbanization on energy use and emissions varies across the stage of development. The negative influence of urbanization on energy consumption has also been studied by some scholars in China [,]. However, it has positive impact when the rate of urbanization surpasses 73.8% []. With the advancement of urbanization, the concentration of various factors of production has also contributed to the scale of production. Xi et al. [] compared the ecological environment carrying capacity and the urbanization of both developed and major developing countries and found that cities with more than one million people reported more sustainability of ecological resources; therefore, China should fully consider the economic effect of each metropolis.
How do industrial structure optimization and urbanization development affect energy consumption, especially in Zhejiang Province of China, where carbon emissions from energy activities account for approximately 78–80% of total carbon emissions? []. The growth rate of urbanization in Zhejiang ranks third out of 34 provinces in China, and it is one of the few provinces in China where tertiary industry has surpassed secondary industry. All of these new challenges have a profound impact on energy consumption and make it much more difficult to realize energy-saving potential. Therefore, we focus on Zhejiang Province and measure the impact of urbanization and industrial structure on energy consumption separately by impulse response function and variance decomposition using a structural vector auto regression (SVAR) model. Quantifying the dynamic response of energy consumption to tertiary industry and urbanization might provide a reference for Zhejiang Province to better understand the characteristics of energy consumption and to enhance the scientific basis of decision-making regarding energy conservation. The policy recommendations made in this paper have certain adaptability to some provinces or regions that have been implementing energy conservation and emission reduction for many years, but where the energy saving space is shrinking. The structure of this paper is as follows. In the next section, we explain the energy-saving status of Zhejiang by describing the data. Then the vector auto regression (VAR) model and a SVAR model are described in section three. The fourth section describes the empirical process and results, and the final section provides the conclusion.
2. Data
2.1. Energy Consumption Levels
Energy-saving and CO2 emission-reduction efforts in Zhejiang province have achieved remarkable results over the past decade. The polyline in Figure 1 shows the decoupling elastic coefficient of environmental and energy consumption in Zhejiang (for more on this method, see Tapio [] and Gao []). The formula is , where ec represents energy consumption, the unit is ten thousand tons of standard coal, and ep represents the GDP level (in 1990 constant prices). In accordance with the classification diagram of Tapio’s decoupling index, we found that Zhejiang province has been in a weak decoupling state since 2006, and the pressure on the environment from energy consumption has been weakened. However, total energy consumption continues to steadily increase. In 2016, energy consumption in Zhejiang reached 2.03 million tons of coal, and the growth rate was 3.4%, which was significantly higher than the overall level of 1.4% in China.
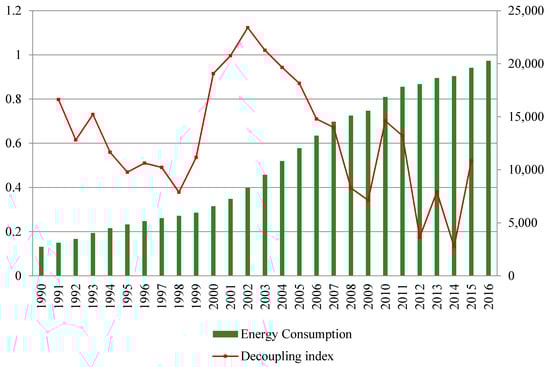
Figure 1.
Elastic coefficient and energy consumption of decoupling of Zhejiang Province. Note: The original data were obtained from the Zhejiang Statistical Yearbook [] and the China Energy Statistics Yearbook [].
2.2. Industrial Structure
The proportion of secondary industry has successively declined since 2009 in Zhejiang Province, while the tertiary industry simultaneously experienced accelerated growth and surpassed secondary industry in 2014, forming a “321” industrial structure pattern (see Figure 2). The level of industrial structure rationalization in Zhejiang Province is currently quite reasonable [], although it may experience greater resistance to industrial restructuring []. The growth of tertiary industry brought about by changes in energy consumption is also worthy of further study. In this paper, we use data on the proportion of tertiary industries to GDP to represent the optimization of industrial structure, which is expressed as is.
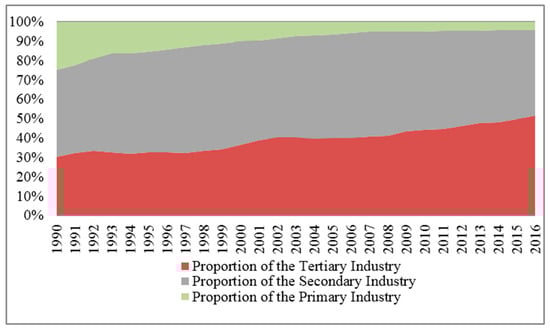
Figure 2.
Proportional contribution to the GDP of Zhejiang Province (1990–2016). Note: The original data were obtained from the Zhejiang Statistical Yearbook.
2.3. Level of Urbanization
In the last several years, there have been relatively large population changes in Zhejiang, and the rate of urbanization has increased to 67% (see Figure 3). In the last two years, for instance, a large number of people poured into Hangzhou, the provincial capital city, and its population increased by 296,000. The acceleration of urbanization places greater demands on urban transportation, housing, and materials, as well as household energy consumption, and these issues place a great strain on the carrying capacity of urban resources and the environment. To enhance the accuracy of the data, the urbanization data for all years up to 2006 are the data that were modified by Zhou and Tian []. The data for all other years were obtained from the Zhejiang Statistical Yearbook and the China Statistical Yearbook. The level of urbanization is represented by u and is expressed as a percentage.
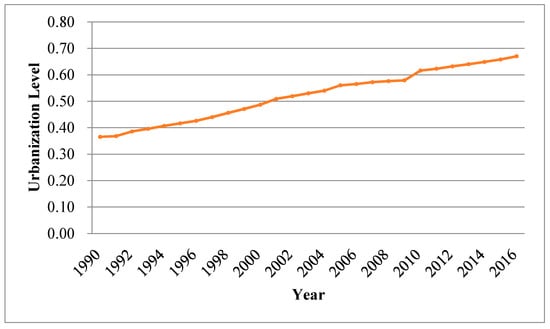
Figure 3.
Urbanization rate of Zhejiang Province (1990–2016).
3. Methodology
3.1. SVAR Model
Although industrial structure and urbanization affect energy consumption differently, they both significantly affect energy consumption. Based on the above review of the opinions of scholars (Chen and Lei, 2017; Xiao et al., 2017; Phetkeo and Shinji, 2010; Liu et al., 2017) and considering the level of energy consumption in Zhejiang Province, we found that an effective energy consumption model should include variables for industrial structure and urbanization. A more useful method for determining the endogenous and exogenous variables in a modeling process was to build an unconstrained multivariate time series model instead of a static regression model. Zellner [] noted that any simultaneous equations modeled with one or more endogenous lag variables will eventually lead to a model that treats each exogenous variable in the system as a function of the lagged value of the endogenous variable model. Sims [] proposed the vector autoregressive model in 1980, which has subsequently been commonly used in econometrics. This type of model can support a macroeconomic structural analysis. Therefore, we considered a general VAR model:
where p is the lag length, and is the stochastic disturbance term or interest. However, the VAR model has some limitations in describing the contemporaneous relationships among the variables; it hides the contemporaneous correlation to , which makes it impractical for the impulse response function to explain the economic meaning. The monograph of Amisano and Giannini [] was, to a certain extent, of monumental significance to the SVAR model because these two econometricians in their monograph summarized the establishment, identification, estimation, and application of SVAR models. The SVAR model not only depicts the influence of each variable on each lag item but also captures the instantaneous structural relationship among variables in the model system. In recent studies, the authors further validated and expanded the SVAR, and the identification conditions were further explained [,]. The expression of SVAR is:
which can reflect the contemporaneous correlation, . Considering the lag between the impact of the variables, we introduced a hysteresis operator L and express it as:
(L) = L …, which was also expressed as a moving average form
Since D(L) = = + + +…, we can obtain =
The final expression of the SVAR model was:
where C(L) and D(L) are lag variables for the VAR model and the SVAR model, respectively. If we want to obtain the estimated number of the VAR model that is not less than the estimated amount of the SVAR model, it is necessary to impose certain constraints, which involves the use of the recognition process of the SVAR model. Constraints should be based on reality and theory [].
3.2. ADF Test, Lag Order Determination and Model Stationarity Test
Ensuring the applicability of the data is critical in econometric analysis. Variations in the economic structure caused by irregular economic growth, the discontinuity of energy policy and technical instability could cause most energy-related variables to fluctuate. To eliminate the heteroscedasticity of time series data and to facilitate the economic interpretation of the results, we used the logarithmic function for certain data: lnec, lnu, and lnis. The traditional VAR model required that all variables must be stationary. In addition, differential data processing was the most commonly used method, but some sequential information may be lost. Gao [] stressed that the VAR model can also be established directly as long as the variables are cointegrated, even if the time series is nonstationary. Therefore, we performed a cointegration test on the sequence and used the trace statistic to inspect and judge relationships of the variables. The results showed that the hypothesis of there existing at most two cointegrated relationship was very significant at 0.05 level (Prob. = 0.0130).
Next, the lag order must be determined. Table 1 shows the results for the VAR lag order selection in terms of the criterion for diverse information. By using the lag criteria of LR, FPE, AIC, SC, and HQ, we set the lag order of the VAR model at 5 because three criteria selected the 5th order.

Table 1.
Lag order selection criteria of the VAR Model.
A stationary test of the VAR model was conducted. Figure 4 shows the results of the test of model stationarity by AR root, and clearly, the VAR model’s inverse roots of the AR characteristic polynomial were all within the unit circle, which satisfied stationarity. Therefore, the VAR model can be further developed into the SVAR model.
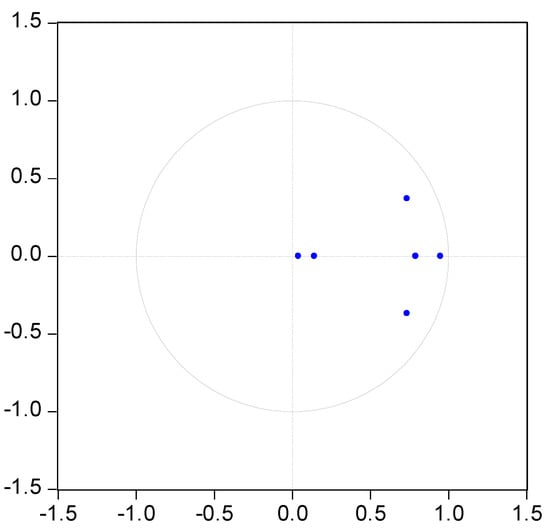
Figure 4.
Test of model stationarity.
3.3. Identification of Constraints
We constructed an SVAR model with three endogenous variables (i.e., k = 3), imposing short-term constraints by the recursive form of Cholesky. In this paper, we chose the AB-matrix because the characteristics of AB- can clearly establish the contemporaneous structure relationship of each endogenous variable in the system and can also intuitively analyze the influences of orthonormal random shocks on the system after impact. Additionally, the AB-matrix requires at least 2(k + 1)/2 = 12 constraints to make the model recognizable. In Formula (2), the diagonal element of matrix was 1 (i.e., matrix C in Formula (5)). According to [], a uniquely identified model requires a sufficient set of restrictions on matrix D, so we further assumed that there was no correlation between the structural perturbation terms in the SVAR model; therefore, matrix D was a diagonal matrix.
The constraints imposed on the matrix effectively constrained the contemporaneous correlations among the variables. Watson suggested that constraints should be determined by the economic implications on which the model is based. Regrettably, energy-ecology is a complex system, and there is not a perfectly applicable economic theory that explains the constraints proposed in this paper. Therefore, we referred to previous studies and the basic influence mechanisms of the variables when determining the constraints. Apparently, changes in urbanization are mostly caused by demographic changes [,], while transformations in industrial structure are often caused by policies, investments, and technology [,,]. Moreover, a time lag in the impact of industrial structure on urbanization cannot be ruled out because tertiary industry appears to be expanding rapidly and disorderly, and it cannot match the urbanization plan in China. Therefore, based on the influence transmission mechanism of urbanization-industrial institutions-energy consumption (see Figure 5), the constraints were as follows: (1) Urbanization does not respond to changes in contemporaneous energy consumption, and = 0; (2) the industrial structure does not respond to changes in contemporaneous energy consumption, and = 0; and (3) urbanization does not respond to changes in the contemporaneous industrial structure, and = 0. The results of the parameter estimation of the SVAR model were expressed as a matrix, as follows:
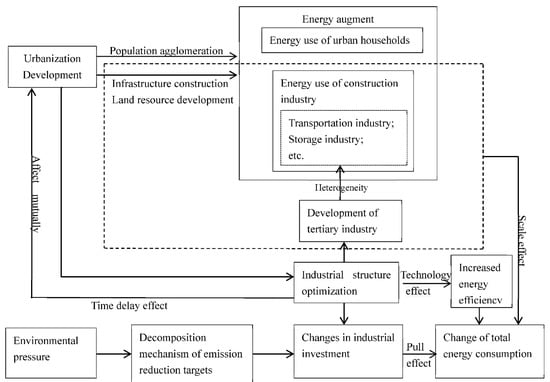
Figure 5.
Influence transmission mechanism of urbanization-industrial institutions-energy consumption.
4. Findings
The orthogonalized impulse response function could be obtained by using the SVAR model. Therefore, we separately analyzed the impact of each variable on the other variables. In this paper, we selected the impulse response function of lag 20 to analyze the dynamic impact of urbanization and industrial structure on energy consumption (see Figure 6 and Figure 7). The variance decomposition was used to characterize the relative importance of urbanization and industrial structure for energy consumption (see Figure 8 and Figure 9).
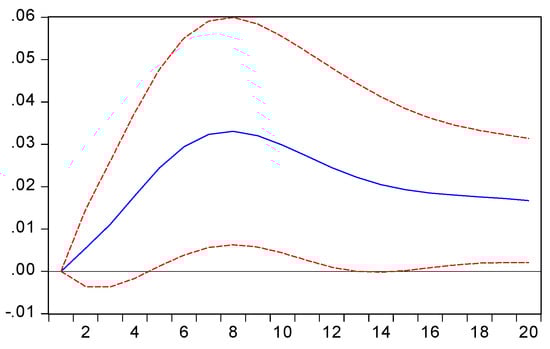
Figure 6.
Response of energy consumption to urbanization.
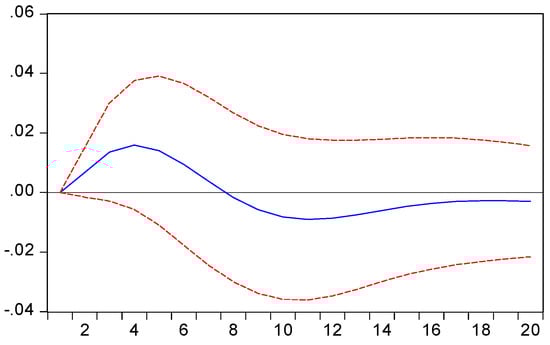
Figure 7.
Response of energy consumption to industrial structure.
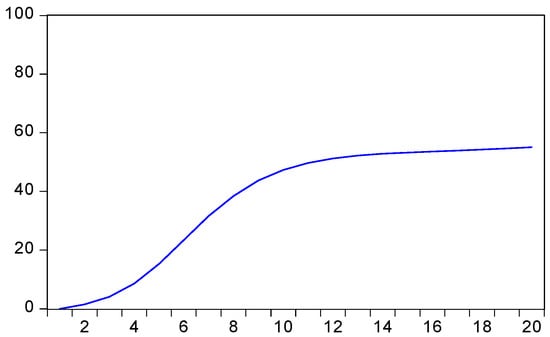
Figure 8.
Percent of energy consumption variance due to urbanization.
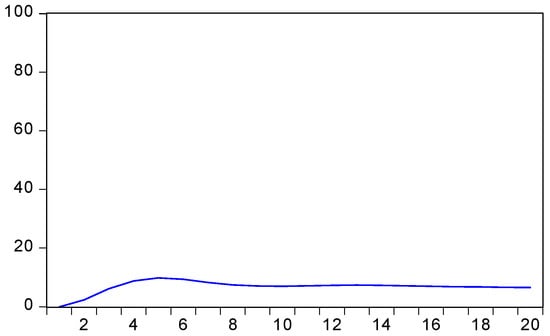
Figure 9.
Percent of energy consumption variance due to industrial structure.
Figure 6 depicts the response of energy consumption to an urbanization shock. The positive impact of urbanization on energy consumption in the early period increased rapidly and peaked in the eighth period, which was in line with the actual situation. The increase in the population caused by urbanization will clearly cause a considerable increase in energy demand in the early stage. Increasing the quality of urbanization and increasing urban resource allocation efficiency can weaken the impact of urbanization on energy consumption and may cause the impacts to slowly weaken in the future []. However, the sustained impact appeared a relatively long period, which poses a challenge to the target constraints of energy consumption for a provincial energy planning.
Figure 7 indicates that the impact of industrial structure on energy consumption was positive then became negative. The impact increased from the first period and decreased after the fourth period, becoming negative in the eighth period and continuing in this pattern. The results could be explained by the fact that an increase in the tertiary industry did not immediately reduce energy consumption. One of the main reasons is the heterogeneity of tertiary industry, the development of industries such as transportation, storage and postal services caused the continued growth of coal and oil and other types of high-carbon energy use. The negative impact of the later period indicates that an adjustment in the long-term industrial structure will eventually inhibit the increase in energy consumption.
Figure 8 and Figure 9 show that the contributions of the shocks of urbanization and industrial structure to the energy consumption. After the first lag period, the main contribution of urbanization shock increased quickly, and tended to stabilize since the tenth lag period. The shock contributors of industrial structure were slightly lower than for urbanization, the impacts of industrial structure shock showed slow modifications after the tenth period. Therefore, Zhejiang should pay more attention to the impact of urbanization when making plans regarding energy consumption.
5. Conclusions
Empirical results showed that urbanization has caused a significant increase in energy consumption, which poses a certain challenge to the layout of urban ecological space. In the process of urbanization, in addition to the use of radiation in the metropolis, the energy use mode of microbodies should also be a focus. The energy-saving potential of energy consuming subjects, such as the public sectors and families remains to be tapped. However, it may be difficult for the government to exert its influence on families. Family consumption patterns that are related to urbanization need guidance and improvement, such as actively building low-carbon transportation, developing low-carbon communities, advocating for low-carbon travel, green living, and so on. The public sector, including government and schools, can help raise awareness in the energy market and in energy enterprises regarding changes in energy demand caused by urbanization by cooperating with industry and helping them construct low-carbon production facilities in a timely manner to improve energy efficiency and achieve low-carbon urban development.
The response of energy consumption to the optimization of industrial structure was relatively large in the early periods, and the increase in tertiary industry will eventually curb the growth of energy consumption. Zhejiang Province is at the forefront of China’s provinces by optimizing and upgrading its industrial structure. However, an increase in the proportion of the tertiary industry does not necessarily mean that the industrial structure has been optimized or upgraded. For example, the “cost-sickness” that may result from the development of the service sector will affect the overall improvement in total factor productivity. Therefore, it is especially important to develop and improve the efficiency of tertiary industry. The trend of industrial structure evolution under environmental constraints is bound to be a transformation that includes low-carbon technology. At present, the technology potential of Zhejiang’s tertiary industry has not yet been realized. Therefore, sustained and effective policy support can prompt the rapid growth of low-carbon energy technologies from a niche market and achieve environmental benefits as soon as possible. However, as traditional industries transform and upgrade, the fairness and adaptability of their policies should also be considered in the process.
Author Contributions
H.J. and J.B. conceived and designed the study. X.Z. and X.S. processed the data and performed the experiments. H.J. and X.Z. reviewed and edited the manuscript. All authors read and approved the manuscript.
Funding
This research is supported by the Natural Science Foundation of Zhejiang Province (No. LQ15G030008) and the National Social Science Foundation of China (No. 15BGL169).
Conflicts of Interest
The authors declare no conflict of interest.
References
- Intended Nationally Determined Contributions (INDC). National Development and Reform Commission. Intended Nationally Determined Contributions. The State Council Information Office of the People’s Republic of China. 2017. Available online: http://www.scio.gov.cn/xwfbh/xwbfbh/wqfbh/2015/20151119/xgbd33811/Document/1455864/1455864.htm (accessed on 12 April 2017).
- Energy Development “13th Five-Year Plan”. National Development and Reform Commission & National Energy Administration. 2016. Available online: http://www.ndrc.gov.cn/zcfb/zcfbtz/201701/t20170117_835278.html (accessed on 26 December 2016).
- Liu, Y.; Xiao, H.; Lv, Y.; Zhang, N. The effect of new-type urbanization on energy consumption in China: A spatial econometric analysis. J. Clean. Prod. 2017, 163, S299–S305. [Google Scholar] [CrossRef]
- BP. BP Statistical Review of World Energy. 2017. Available online: https://www.bp.com/content/dam/bp/en/corporate/pdf/energy-economics/statistical-review-2017/bp-statistical-review-of-world-energy-2017-full-report.pdf (accessed on 10 December 2017).
- Yuan, X.C.; Wei, Y.M.; Mi, Z.; Sun, X.; Zhao, W.; Wang, B. Forecasting China’s regional energy demand by 2030: A Bayesian approach. Resour. Conserv. Recycl. 2017, 127, 85–95. [Google Scholar] [CrossRef]
- Xiao, B.; Niu, D.; Wu, H. Exploring the impact of determining factors behind CO2 emissions in China: A CGE appraisal. Sci. Total Environ. 2017, 581, 559–572. [Google Scholar] [CrossRef] [PubMed]
- Wang, J.; Li, L. Sustainable energy development scenario forecasting and energy saving policy analysis of China. Renew. Sustain. Energy Rev. 2016, 58, 718–724. [Google Scholar] [CrossRef]
- Andrews Speed, P. China’s Ongoing energy energy efficiency drive: Progress and prospects. Energy Policy 2009, 37, 1331–1344. [Google Scholar] [CrossRef]
- Kahrl, F.; Roland-Holst, D. Growth and structural change in China’s energy economy. Energy 2009, 34, 894–903. [Google Scholar] [CrossRef]
- Juan Antonio, D.; Alcántara, V.; Padilla, E. International inequality in energy intensity levels and the role of production composition and energy efficiency an analysis of OECD countries. Ecol. Econ. 2010, 69, 2468–2474. [Google Scholar]
- Li, Z.; Sun, L.; Geng, Y.; Dong, H.; Ren, J.; Liu, Z.; Tian, X.; Yabar, H.; Higano, Y. Examining industrial structure changes and corresponding carbon emission reduction effect by combining input-output analysis and social network analysis: A comparison study of China and Japan. J. Clean. Prod. 2017, 162, 61–70. [Google Scholar] [CrossRef]
- Li, K.; Lin, B.Q. The nonlinear impacts of industrial structure on China’s energy intensity. Energy 2014, 69, 258–265. [Google Scholar] [CrossRef]
- Chen, W.H.; Lei, Y.L. Analysis of the impact path on factors of China’s energy-related CO2 emissions: A path analysis with latent variables. Environ. Sci. Pollut. Res. 2017, 24, 5757–5772. [Google Scholar] [CrossRef] [PubMed]
- Fisher, K.; Jefferson, G.; Liu, H.; Tao, Q. What is driving China’s decline in intensity? Resour. Energy Econ. 2004, 26, 77–97. [Google Scholar] [CrossRef]
- Zhang, L. Relations among the industry structure, energy structure and carbon emissions. J. Arid Land Resour. Environ. 2011, 5, 1–7. [Google Scholar]
- Jorgenson, D.W.; Timmer, M.P. Structural Change in Advanced Nations: A New Set of Stylised Fact. Scand. J. Econ. 2011, 113, 1–29. [Google Scholar] [CrossRef]
- Zhu, Z.; Liu, Y.; Tian, X.; Wang, Y.; Zhang, Y. CO2 emissions from the industrialization and urbanization processes in the manufacturing center Tianjin in China. J. Clean. Prod. 2017, 168, 867–875. [Google Scholar] [CrossRef]
- Parikh, J.; Shukla, V. Urbanization, energy use and greenhouse effects in economic development. Results from a cross-national study of development countries. Fuel Energy Abstr. 1995, 5, 87–103. [Google Scholar]
- Martínez-Zarzoso, I.; Maruotti, A. The Impact of Urbanization on CO2 Emissions: Evidence from Developing Countries. Ecol. Econ. 2011, 70, 1344–1353. [Google Scholar] [CrossRef]
- Al-Mulali, U.; Che, N.; Fereidouni, H. Exploring the bi-directional long run relationship between urbanization, energy consumption, and carbon dioxide emission. Energy 2012, 46, 156–167. [Google Scholar] [CrossRef]
- Liddle, B. Impact of population, age structure, and urbanization on carbon emissions/energy consumption: Evidence from macrolevel, cross-country analyses. Popul. Environ. 2014, 35, 286–304. [Google Scholar] [CrossRef]
- Otsuka, A. Population Agglomeration and Residential Energy Consumption: Evidence from Japan. Sustainability 2018, 10, 469. [Google Scholar] [CrossRef]
- Reinhard, M.; Yasin, S. Impacts of urbanization on urban structures and energy demand: What can we learn for urban energy planning and urbanization management? Sustain. Cities Soc. 2011, 1, 45–53. [Google Scholar]
- Phetkeo, P.; Shinji, K. Does urbanization lead to less energy use and lower CO2 emissions? A cross-country analysis. Ecol. Econ. 2010, 70, 434–444. [Google Scholar]
- Fan, J.L.; Zhang, Y.J.; Wang, B. The impact of urbanization on residential energy consumption in China, An aggregated and disaggregated analysis. Renew. Sustain. Energy Rev. 2017, 75, 220–233. [Google Scholar] [CrossRef]
- Wang, H.L.; Ou, X.M.; Zhang, X.L. Mode, technology, energy consumption, and resulting CO2 emissions in China’s transport sector up to 2050. Energy Policy 2017, 109, 719–733. [Google Scholar] [CrossRef]
- Zhang, N.; Yu, K.; Chen, Z. How does urbanization affect carbon dioxide emissions? A cross-country panel data analysis. Energy Policy 2017, 107, 678–687. [Google Scholar] [CrossRef]
- Xi, X.; Qiao, Y.B.; Wu, K.P.; Li, C. The Selection of Metropolises or Towns in Urbanization in the Perspective of Sustainable Development: Based on the Research of the International Ecological Footprint Panel Data. China Popul. Resour. Environ. 2015, 25, 47–56. [Google Scholar]
- Bao, J.Q.; Yu, T.Y. Zhejiang should take the lead in meeting the “carbon emissions peak”. Zhejiang Econ. 2015, 12, 26–27. [Google Scholar]
- Tapio, P. Towards a theory of decoupling: Degrees of decoupling in the EU and the case of road traffic in Finland between 1970 and 2001. Transp. Policy 2005, 12, 137–151. [Google Scholar] [CrossRef]
- Gao, W. China’s Energy Consumption Growth Mechanism and Regional Characteristics; Chemical Industry Press: Beijing, China, 2016. [Google Scholar]
- Zhejiang Statistical Yearbook; China Statistics Press: Beijing, China; 1990–2017. (In Chinese).
- China Statistical Yearbook; China Statistics Press: Beijing, China; 1990–2017. (In Chinese).
- Yang, Y.L.; Zhao, R.J. Study on the Evaluations System of Industrial Structure Rationalization in China. J. Ind. Technol. Econ. 2017, 1, 62–65. [Google Scholar]
- Wang, Y.; Cui, Y.T.; Wang, Z.Q. A comparative study of the industrial structure characteristics of China’s provinces-based on the perspective of industrial space structure. Mod. Manag. Sci. 2016, 3, 6–8. [Google Scholar]
- Zhou, Y.X.; Tian, S. Data Revision of Urbanization Level of China’s provinces Based on “The fifth census” Data. Stat. Res. 2017, 36, 74–82. [Google Scholar]
- Zellner, A.; Palm, F.C. Time Series Analysis and Simultaneous Equation Econometric Models. J. Econ. 1974, 2, 17–54. [Google Scholar] [CrossRef]
- Sims, C. Macroeconomics and Reality. Econometrica 1980, 48, 1–48. [Google Scholar] [CrossRef]
- Amisano, G.; Giannini, C. Topics in Structural VAR Econometrics; Springer: New York, NY, USA, 1997. [Google Scholar]
- Soccorsi, S. Measuring nonfundamentalness for structural VARs. J. Econ. Dyn. Control 2016, 71, 86–101. [Google Scholar] [CrossRef]
- Luetkepohl, H.; Milunovich, G. Testing for identification in SVAR-GARCH models. J. Econ. Dyn. Control 2016, 73, 241–258. [Google Scholar] [CrossRef]
- Watson, M.W. Vector Autoregressions and Cointegration. In Handbook of Econometrics; Engle, R.F., McFadden, D., Eds.; North Holland: Amsterdam, The Netherlands, 1994. [Google Scholar]
- Gao, T.M. Econometric Methods and Modeling-Eviews Applications and Examples, 2nd ed.; Tsinghua University Press: Beijing, China, 2009. [Google Scholar]
- Fu, K.; Allen, M.; Archibald, R. Evaluating the Relationship between the Population Trends, Prices, Heat Waves, and the Demands of Energy Consumption in Cities. Sustainability 2015, 7, 15284–15301. [Google Scholar] [CrossRef]
© 2018 by the authors. Licensee MDPI, Basel, Switzerland. This article is an open access article distributed under the terms and conditions of the Creative Commons Attribution (CC BY) license (http://creativecommons.org/licenses/by/4.0/).