Comprehensive Assessment for Post-Disaster Recovery Process in a Tourist Town

Abstract
:1. Introduction
2. Related Work and Study Area
2.1. Literature Review
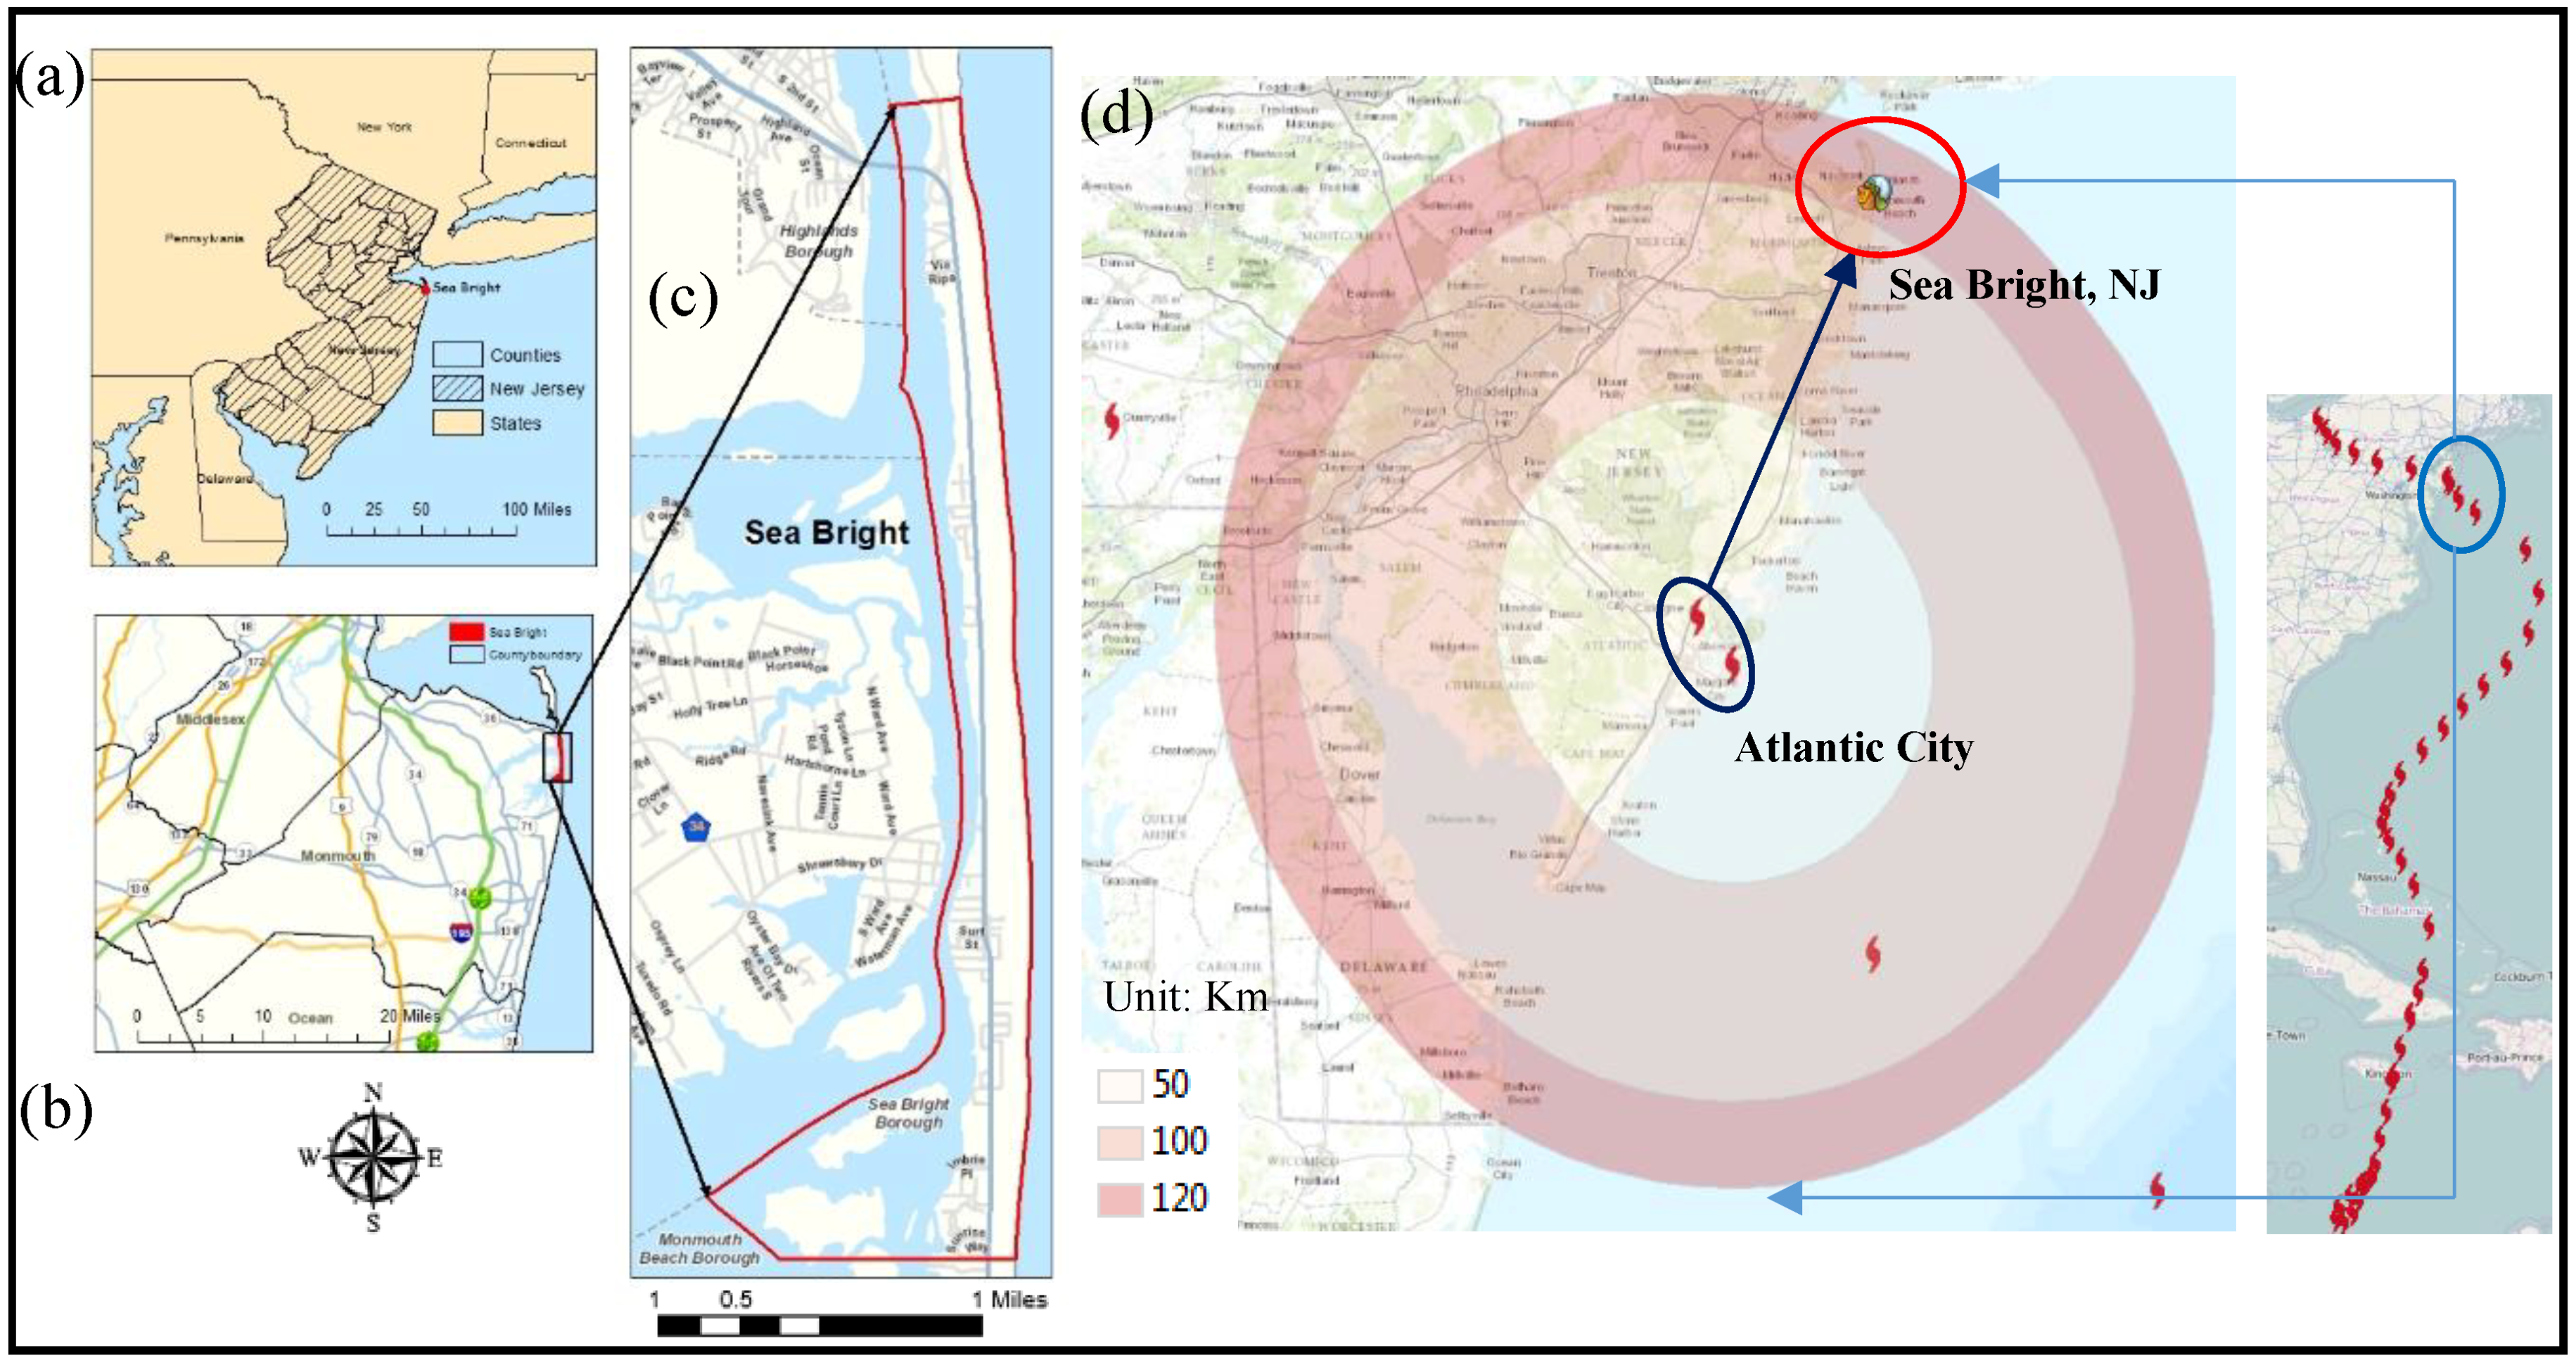
2.2. Sea Bright, New Jersey
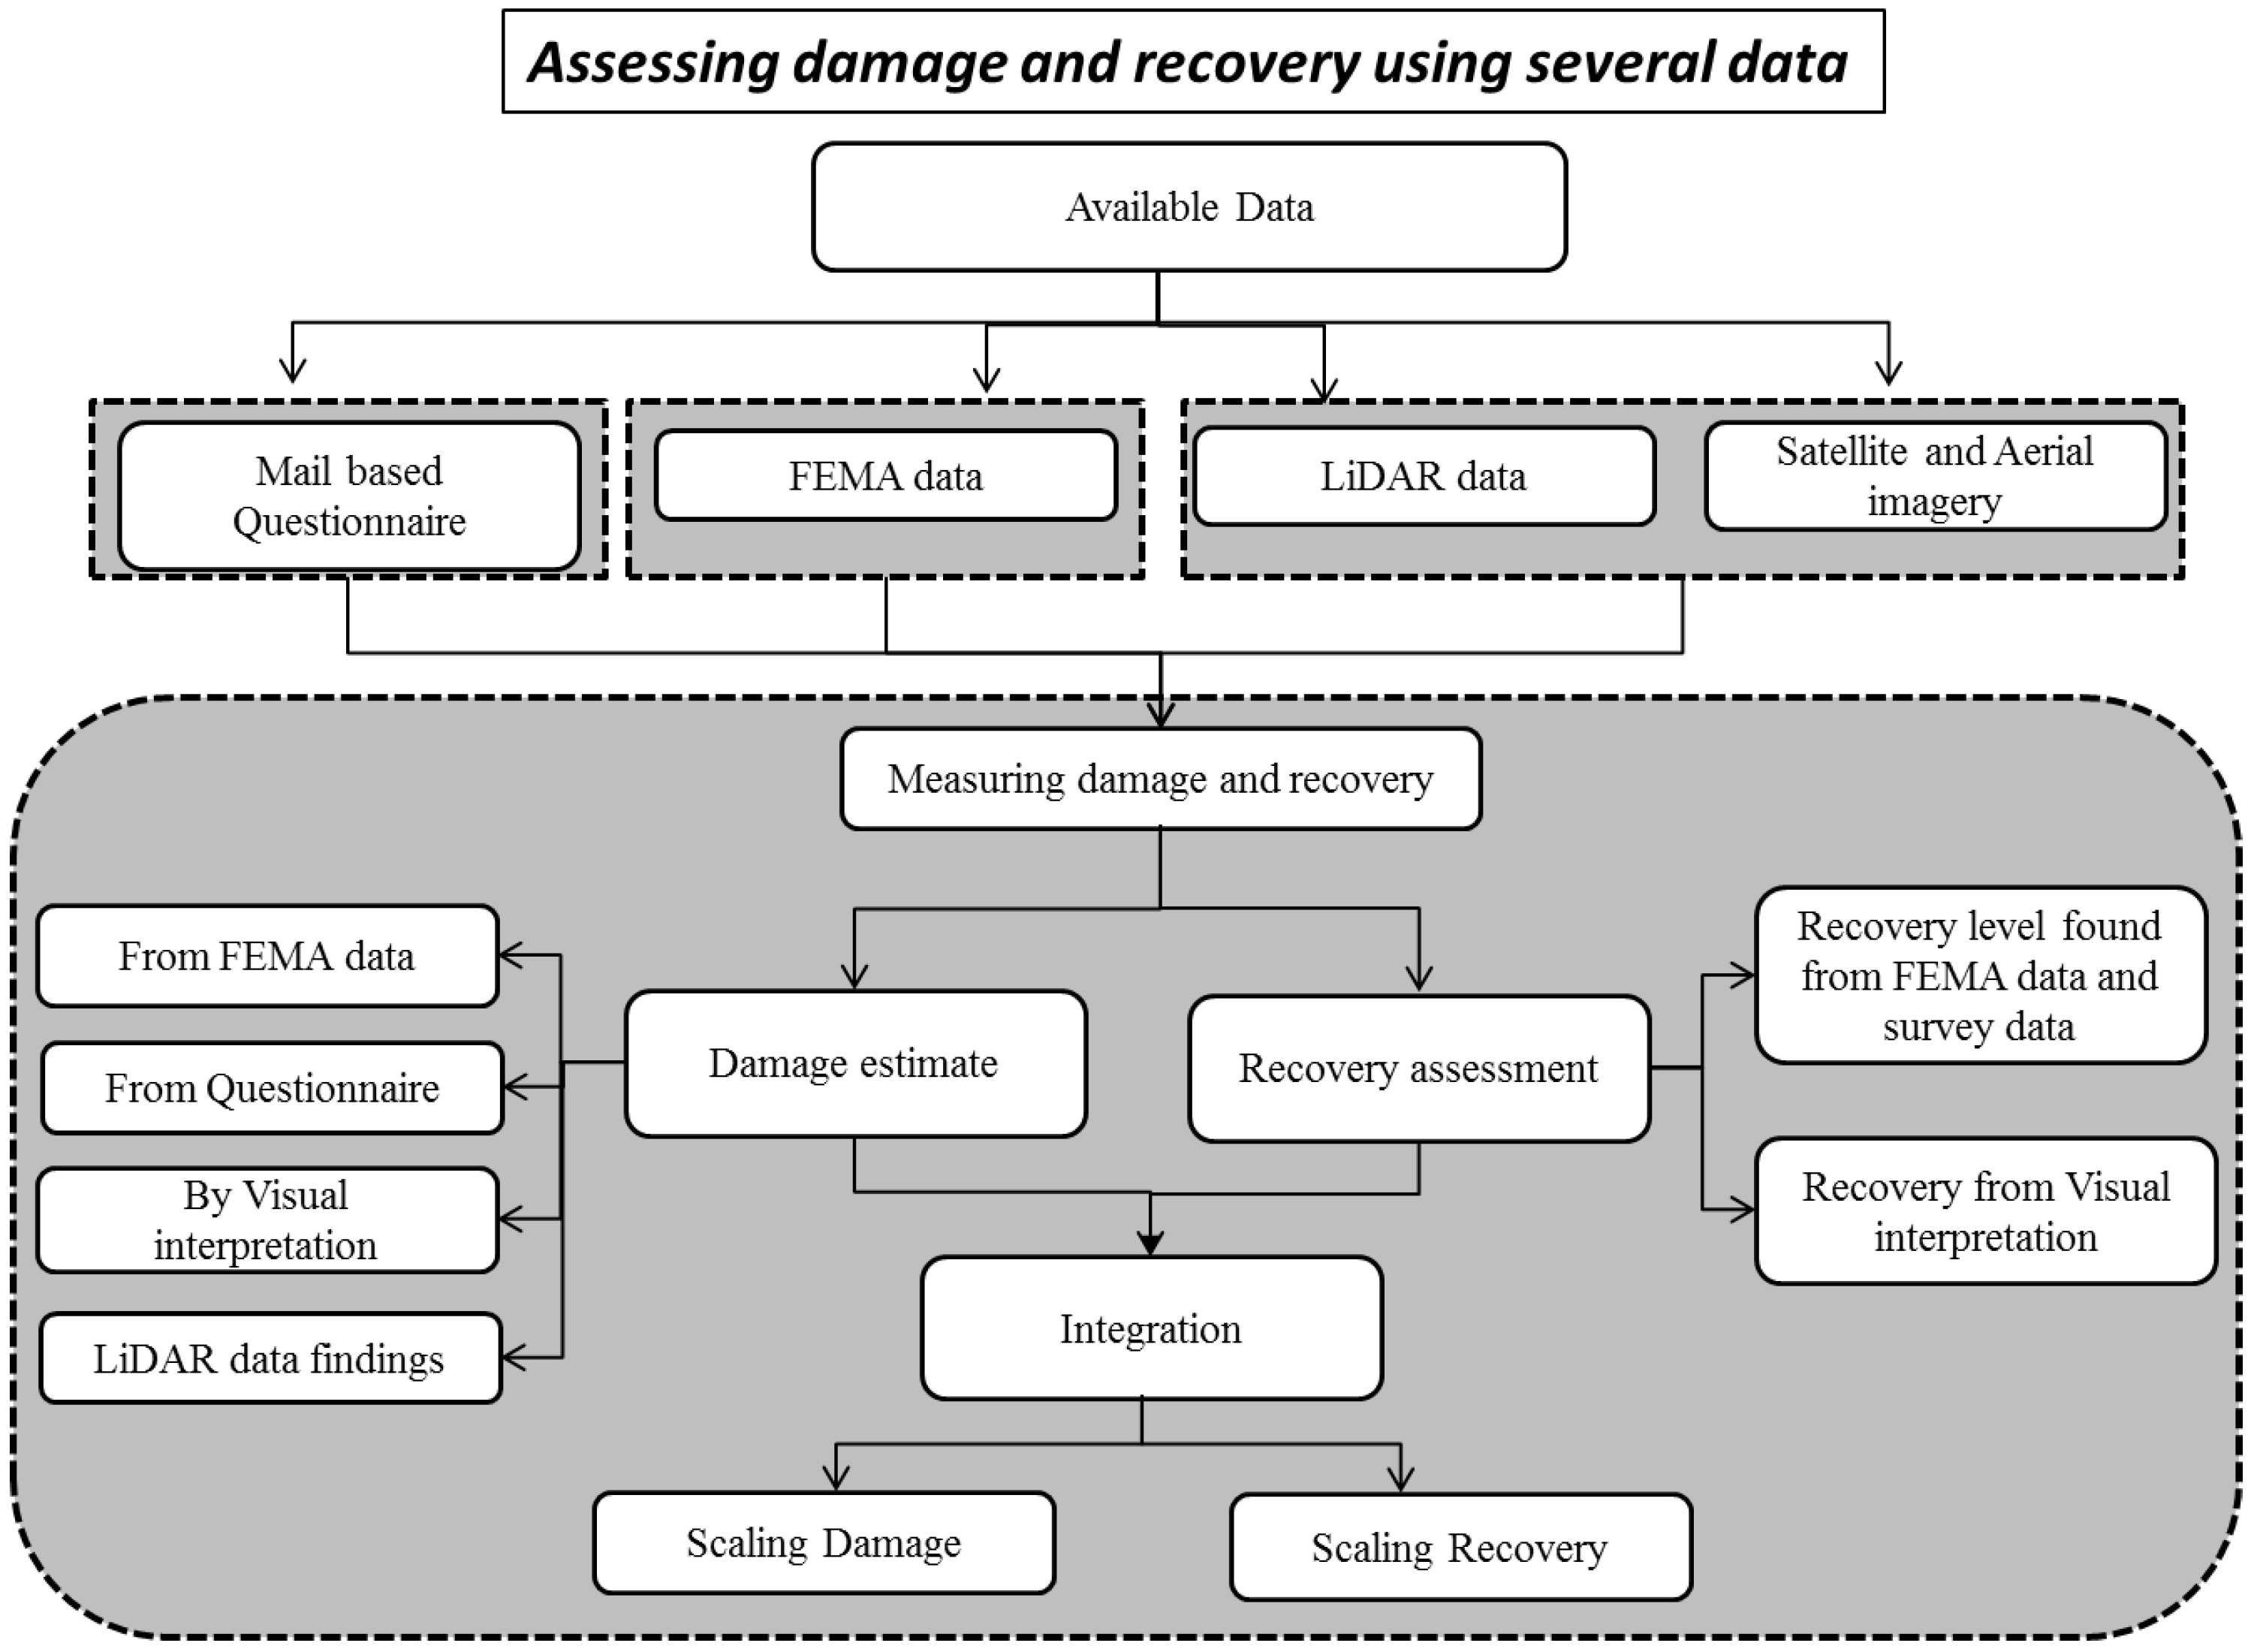
3. Methods
3.1. Developing Workflow and Data Collection
- i.
- Affected—total full verified loss (FVL) $0 to $5000
- ii.
- Minor—total FVL $5000 to $17,000
- iii.
- Major—total FVL more than $17,000
- iv.
- Destroyed—if indicated by Individual Assistance (IA) inspector
3.2. Measuring Damage and Recovery
4. Results
4.1. Damage to Structures
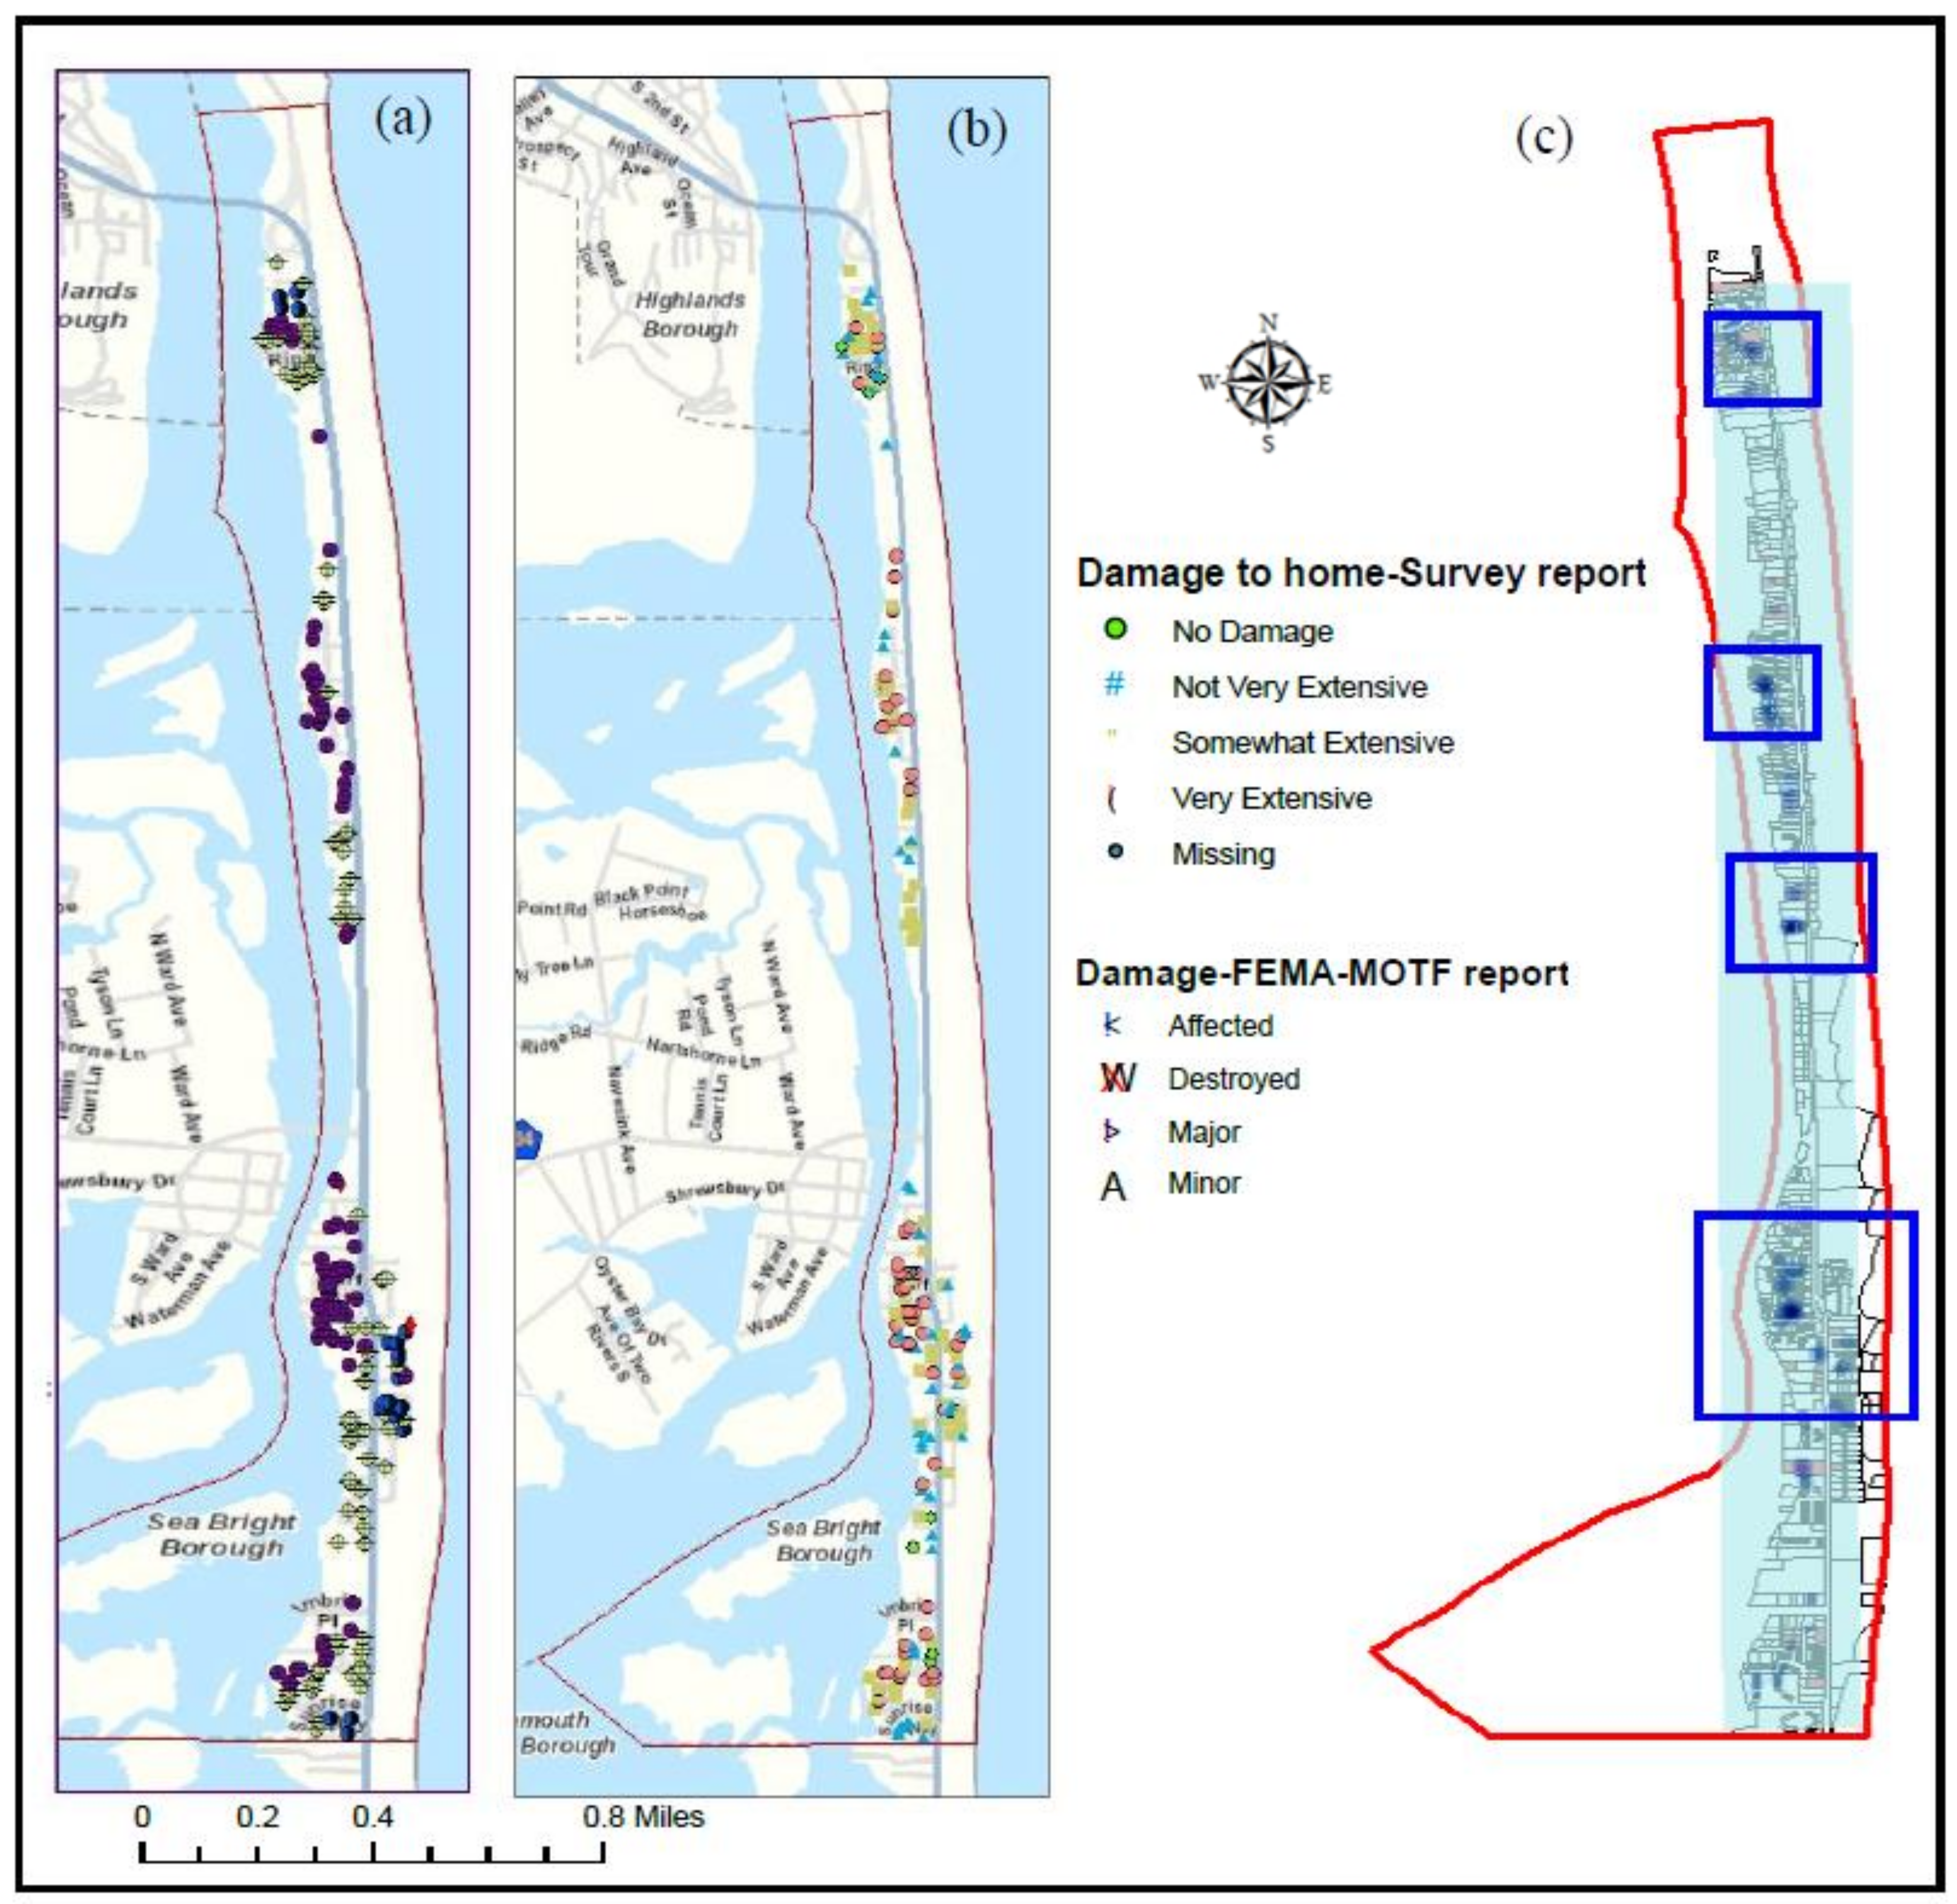
4.1.1. Damage Estimates from FEMA Data and Questionnaire
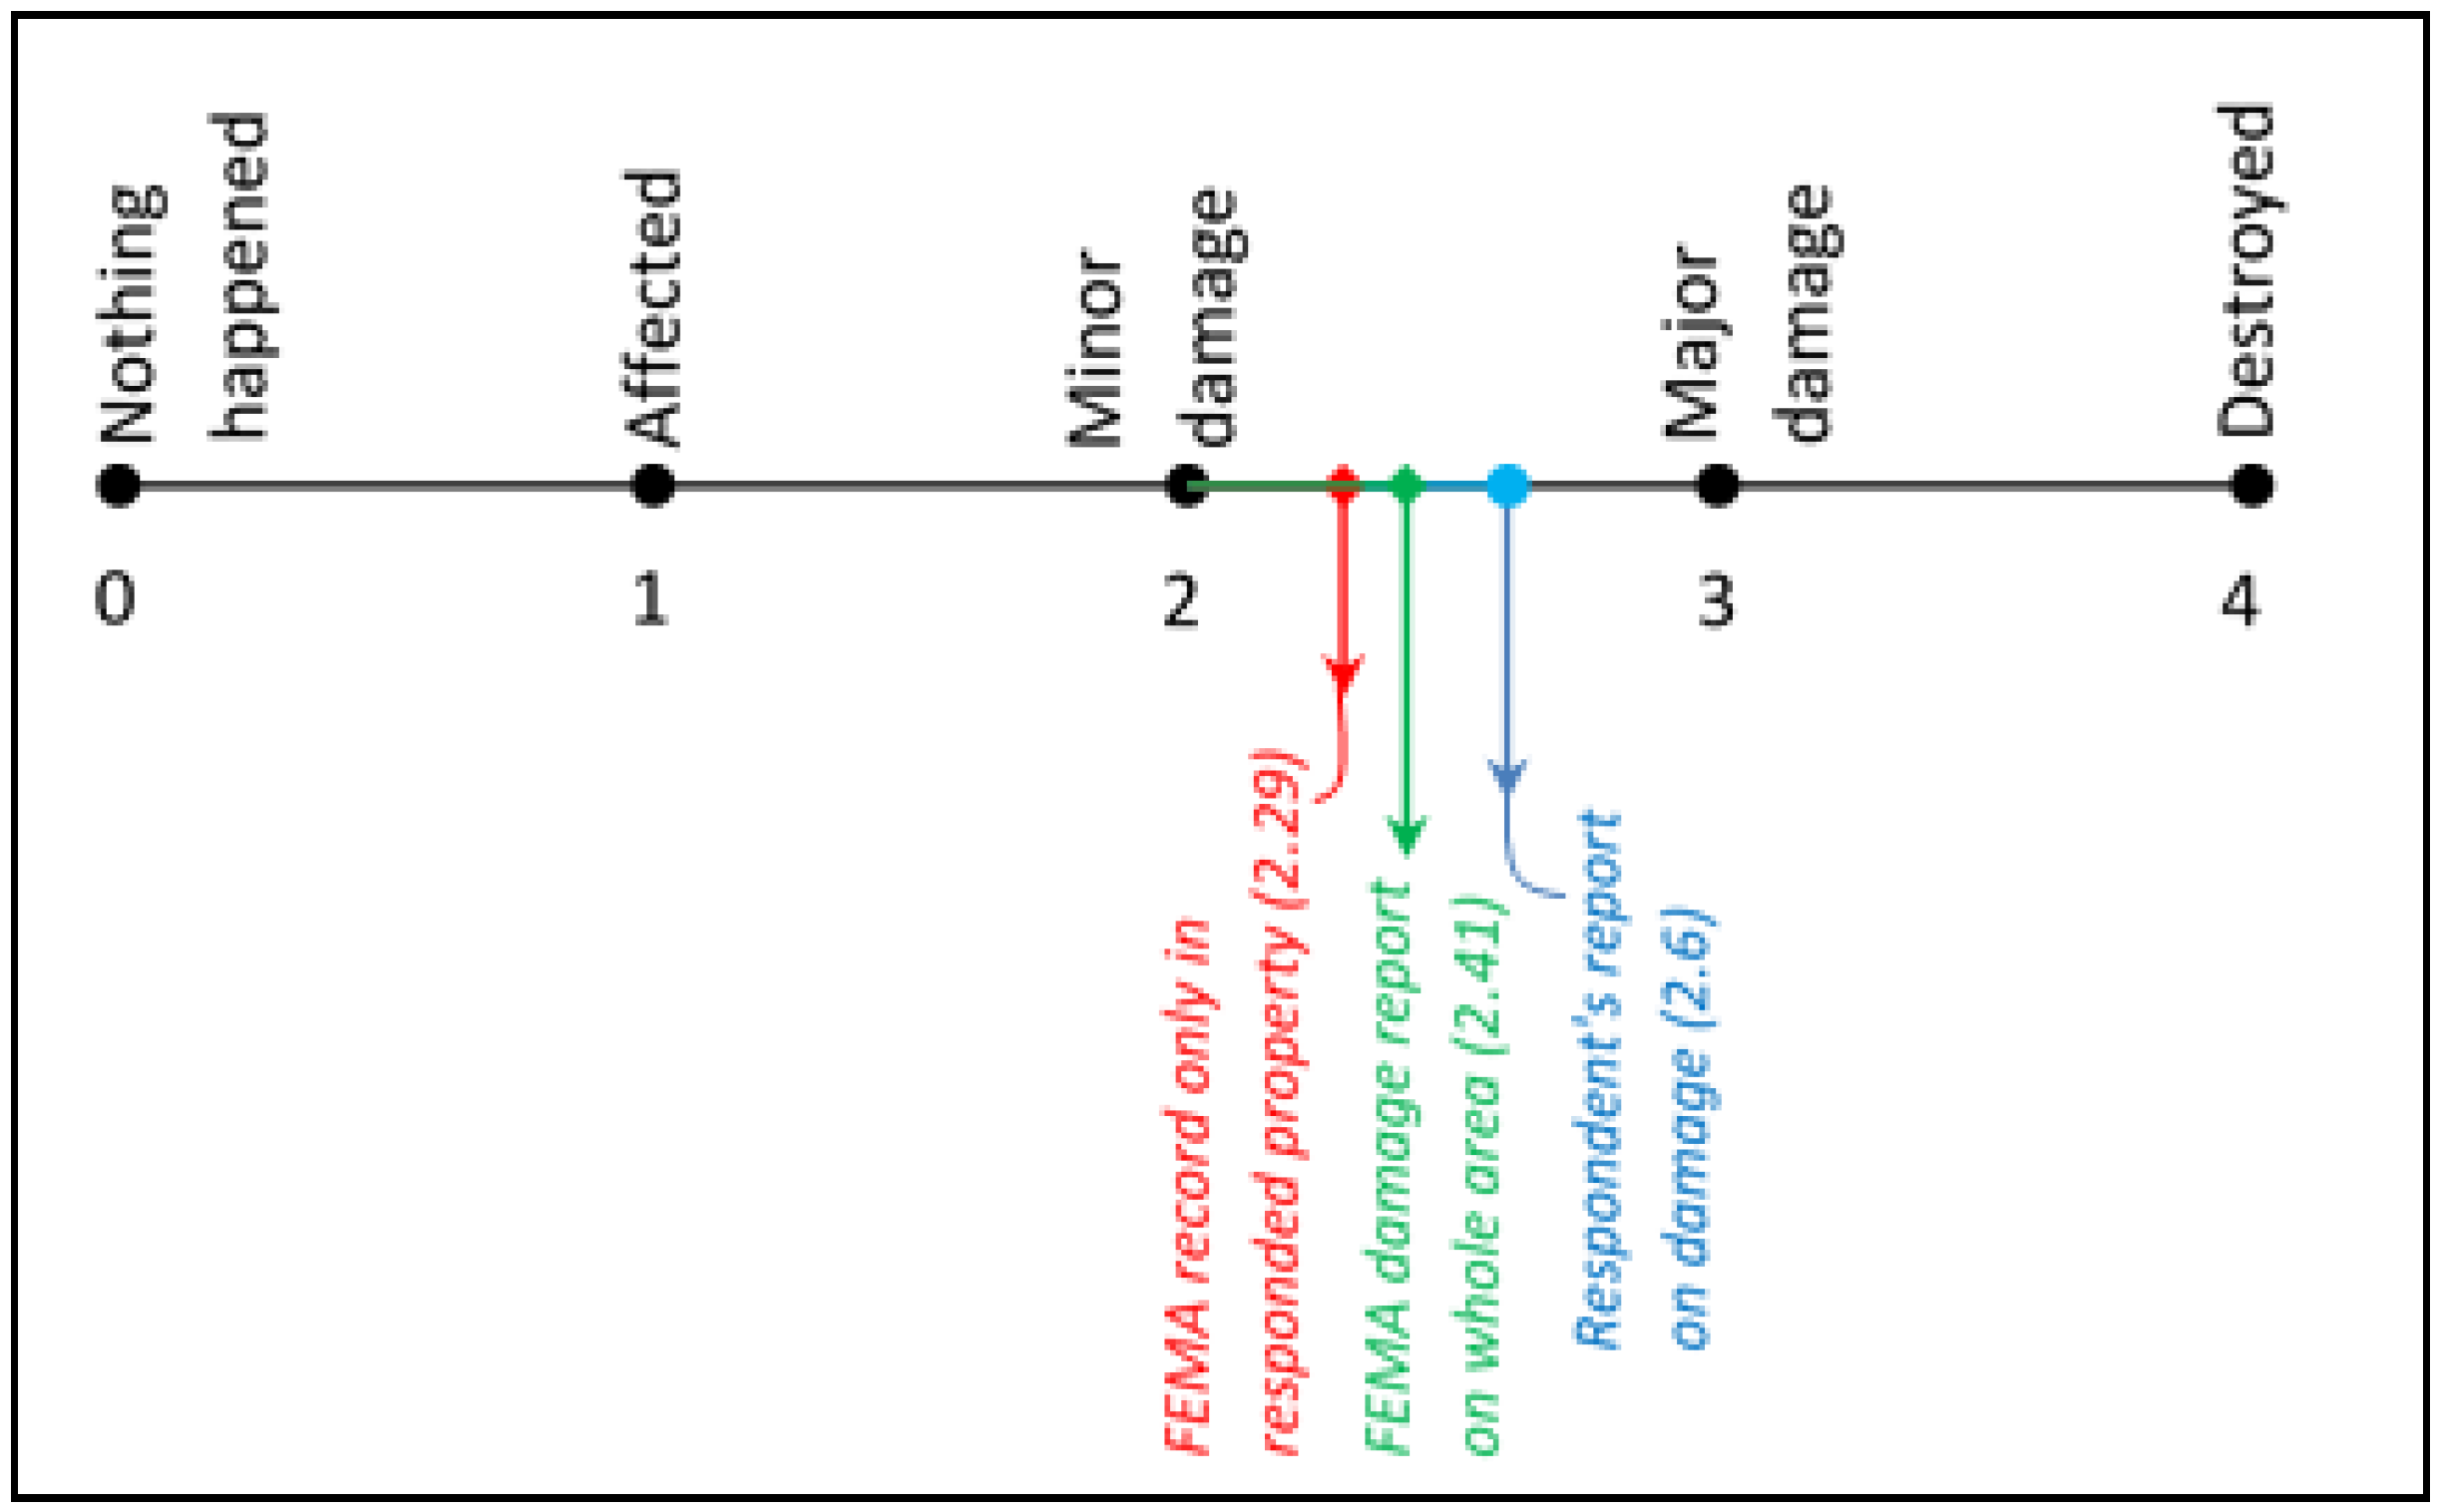
4.1.2. Scaling Damage Using Multiple Data
4.1.3. Visual Interpretation for Tourism Resources
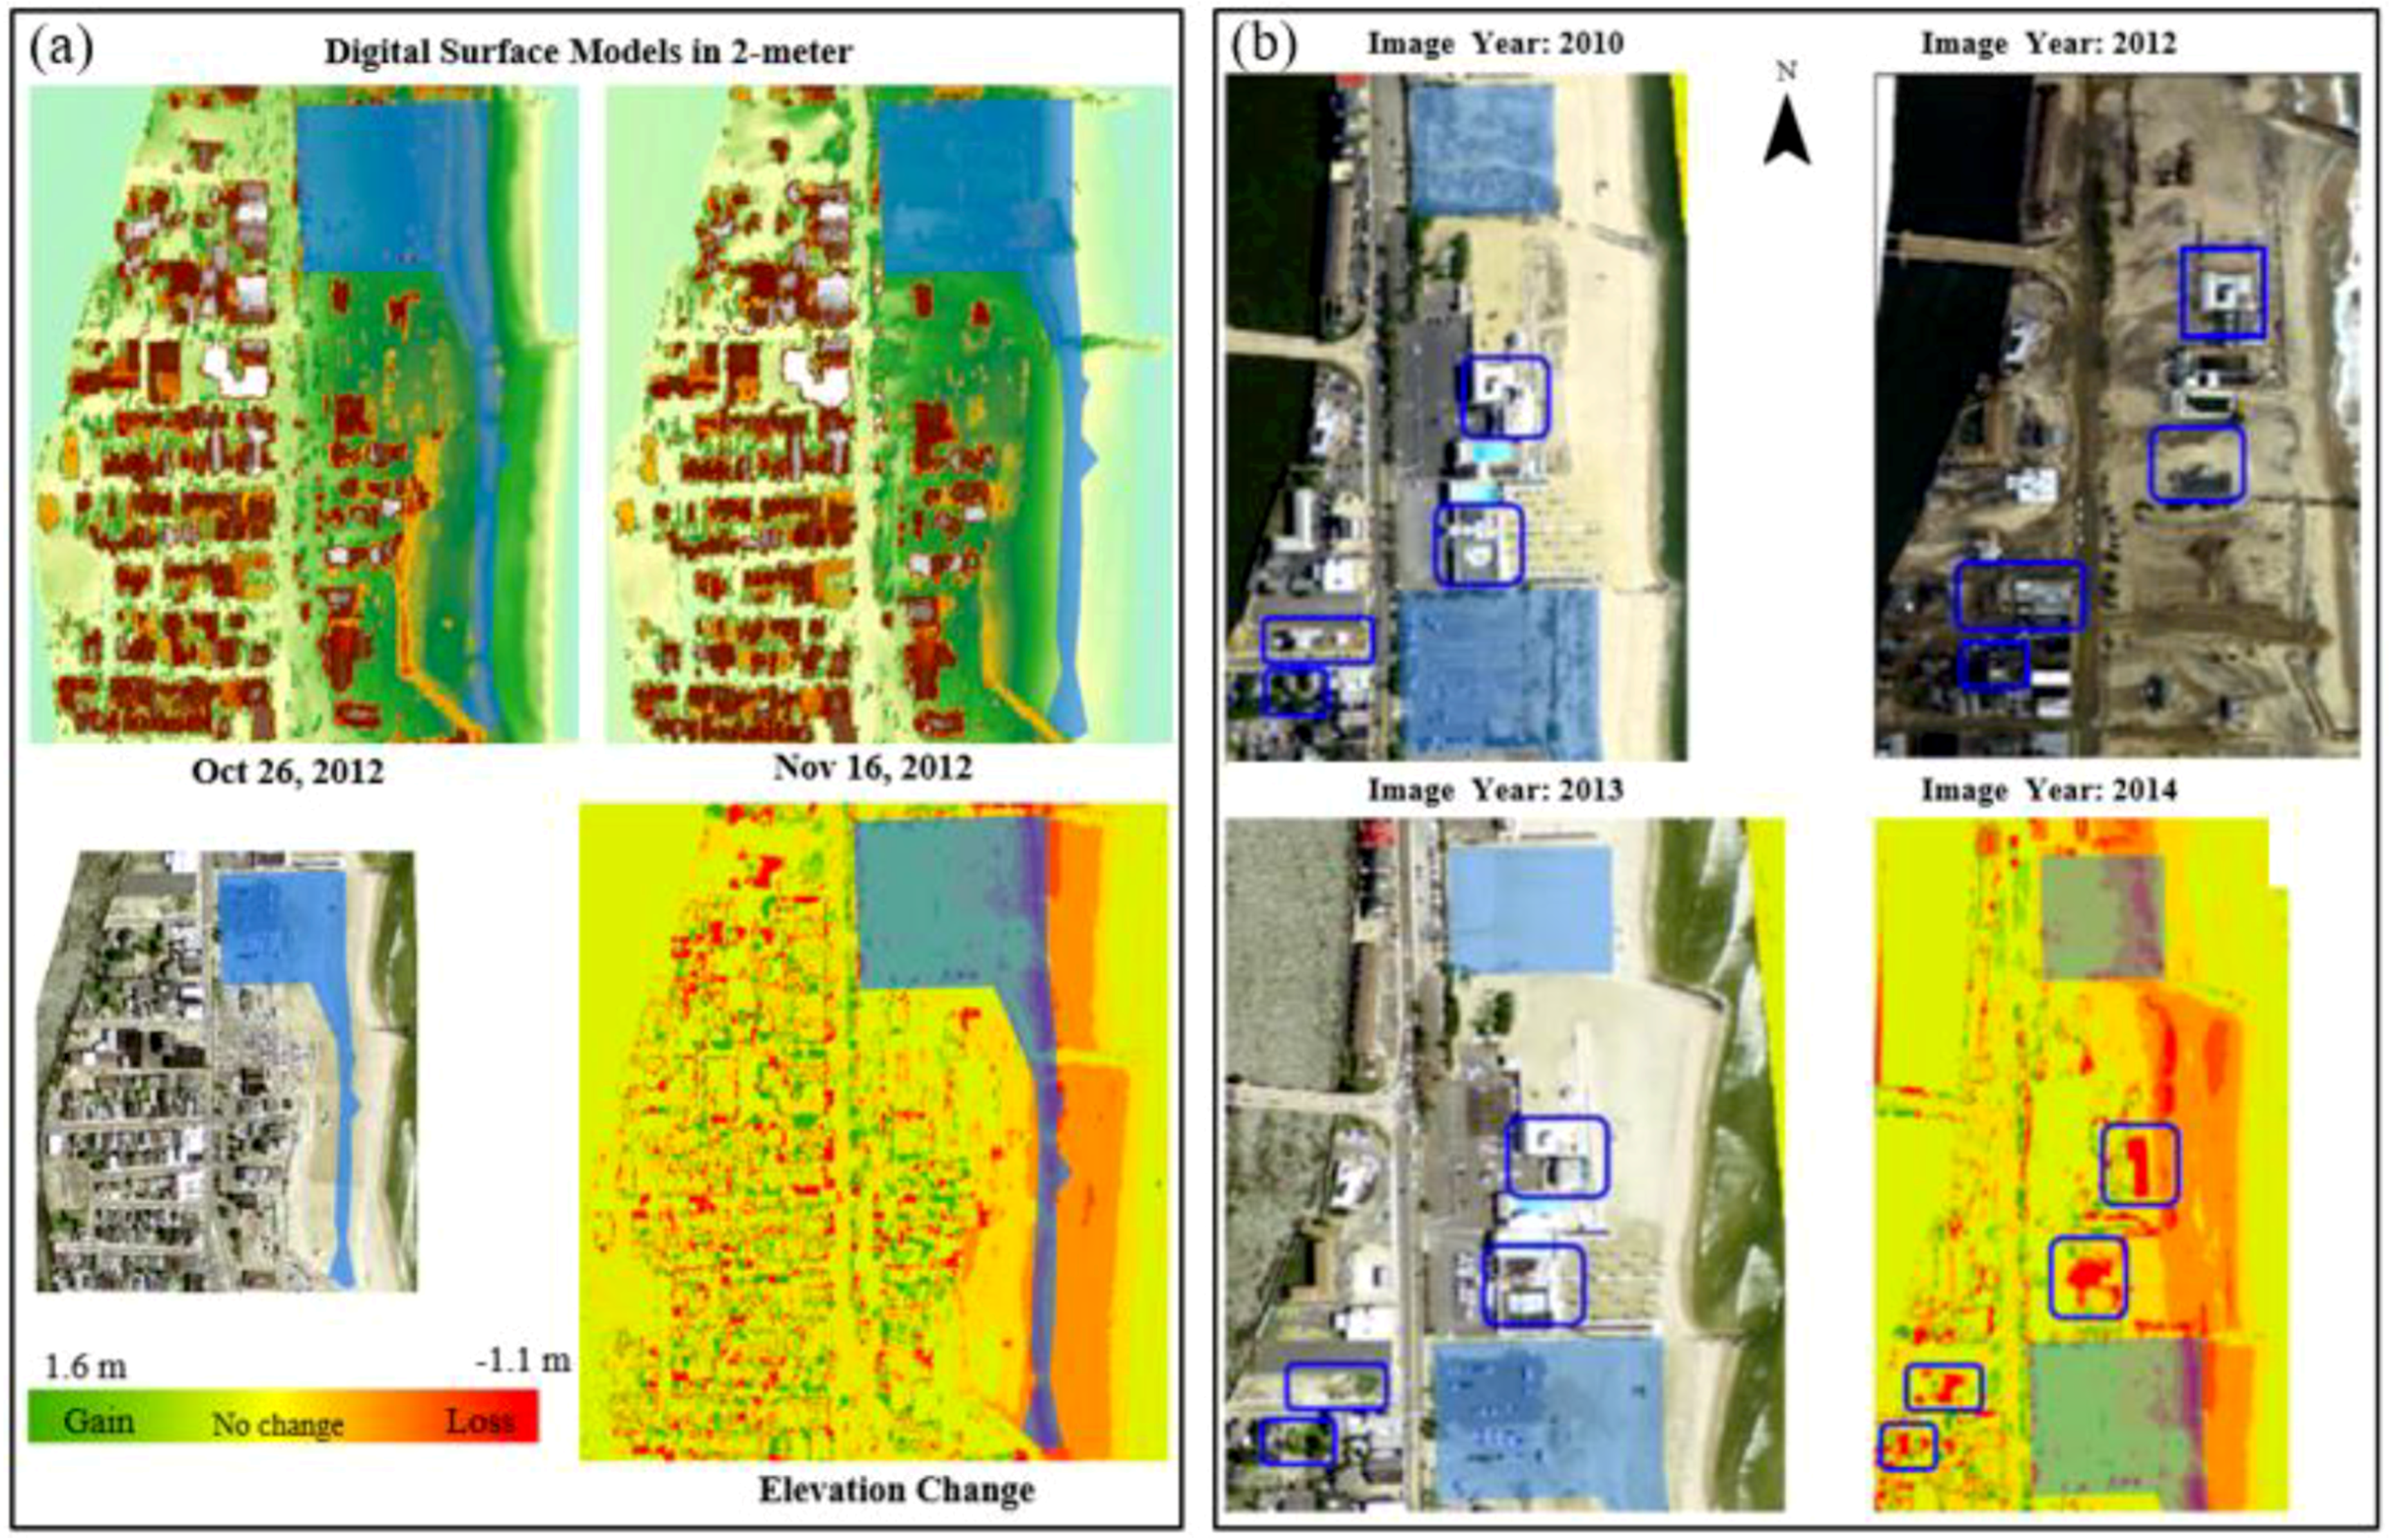
4.1.4. Change Detection Using LiDAR Data
4.2. Progress in Recovery
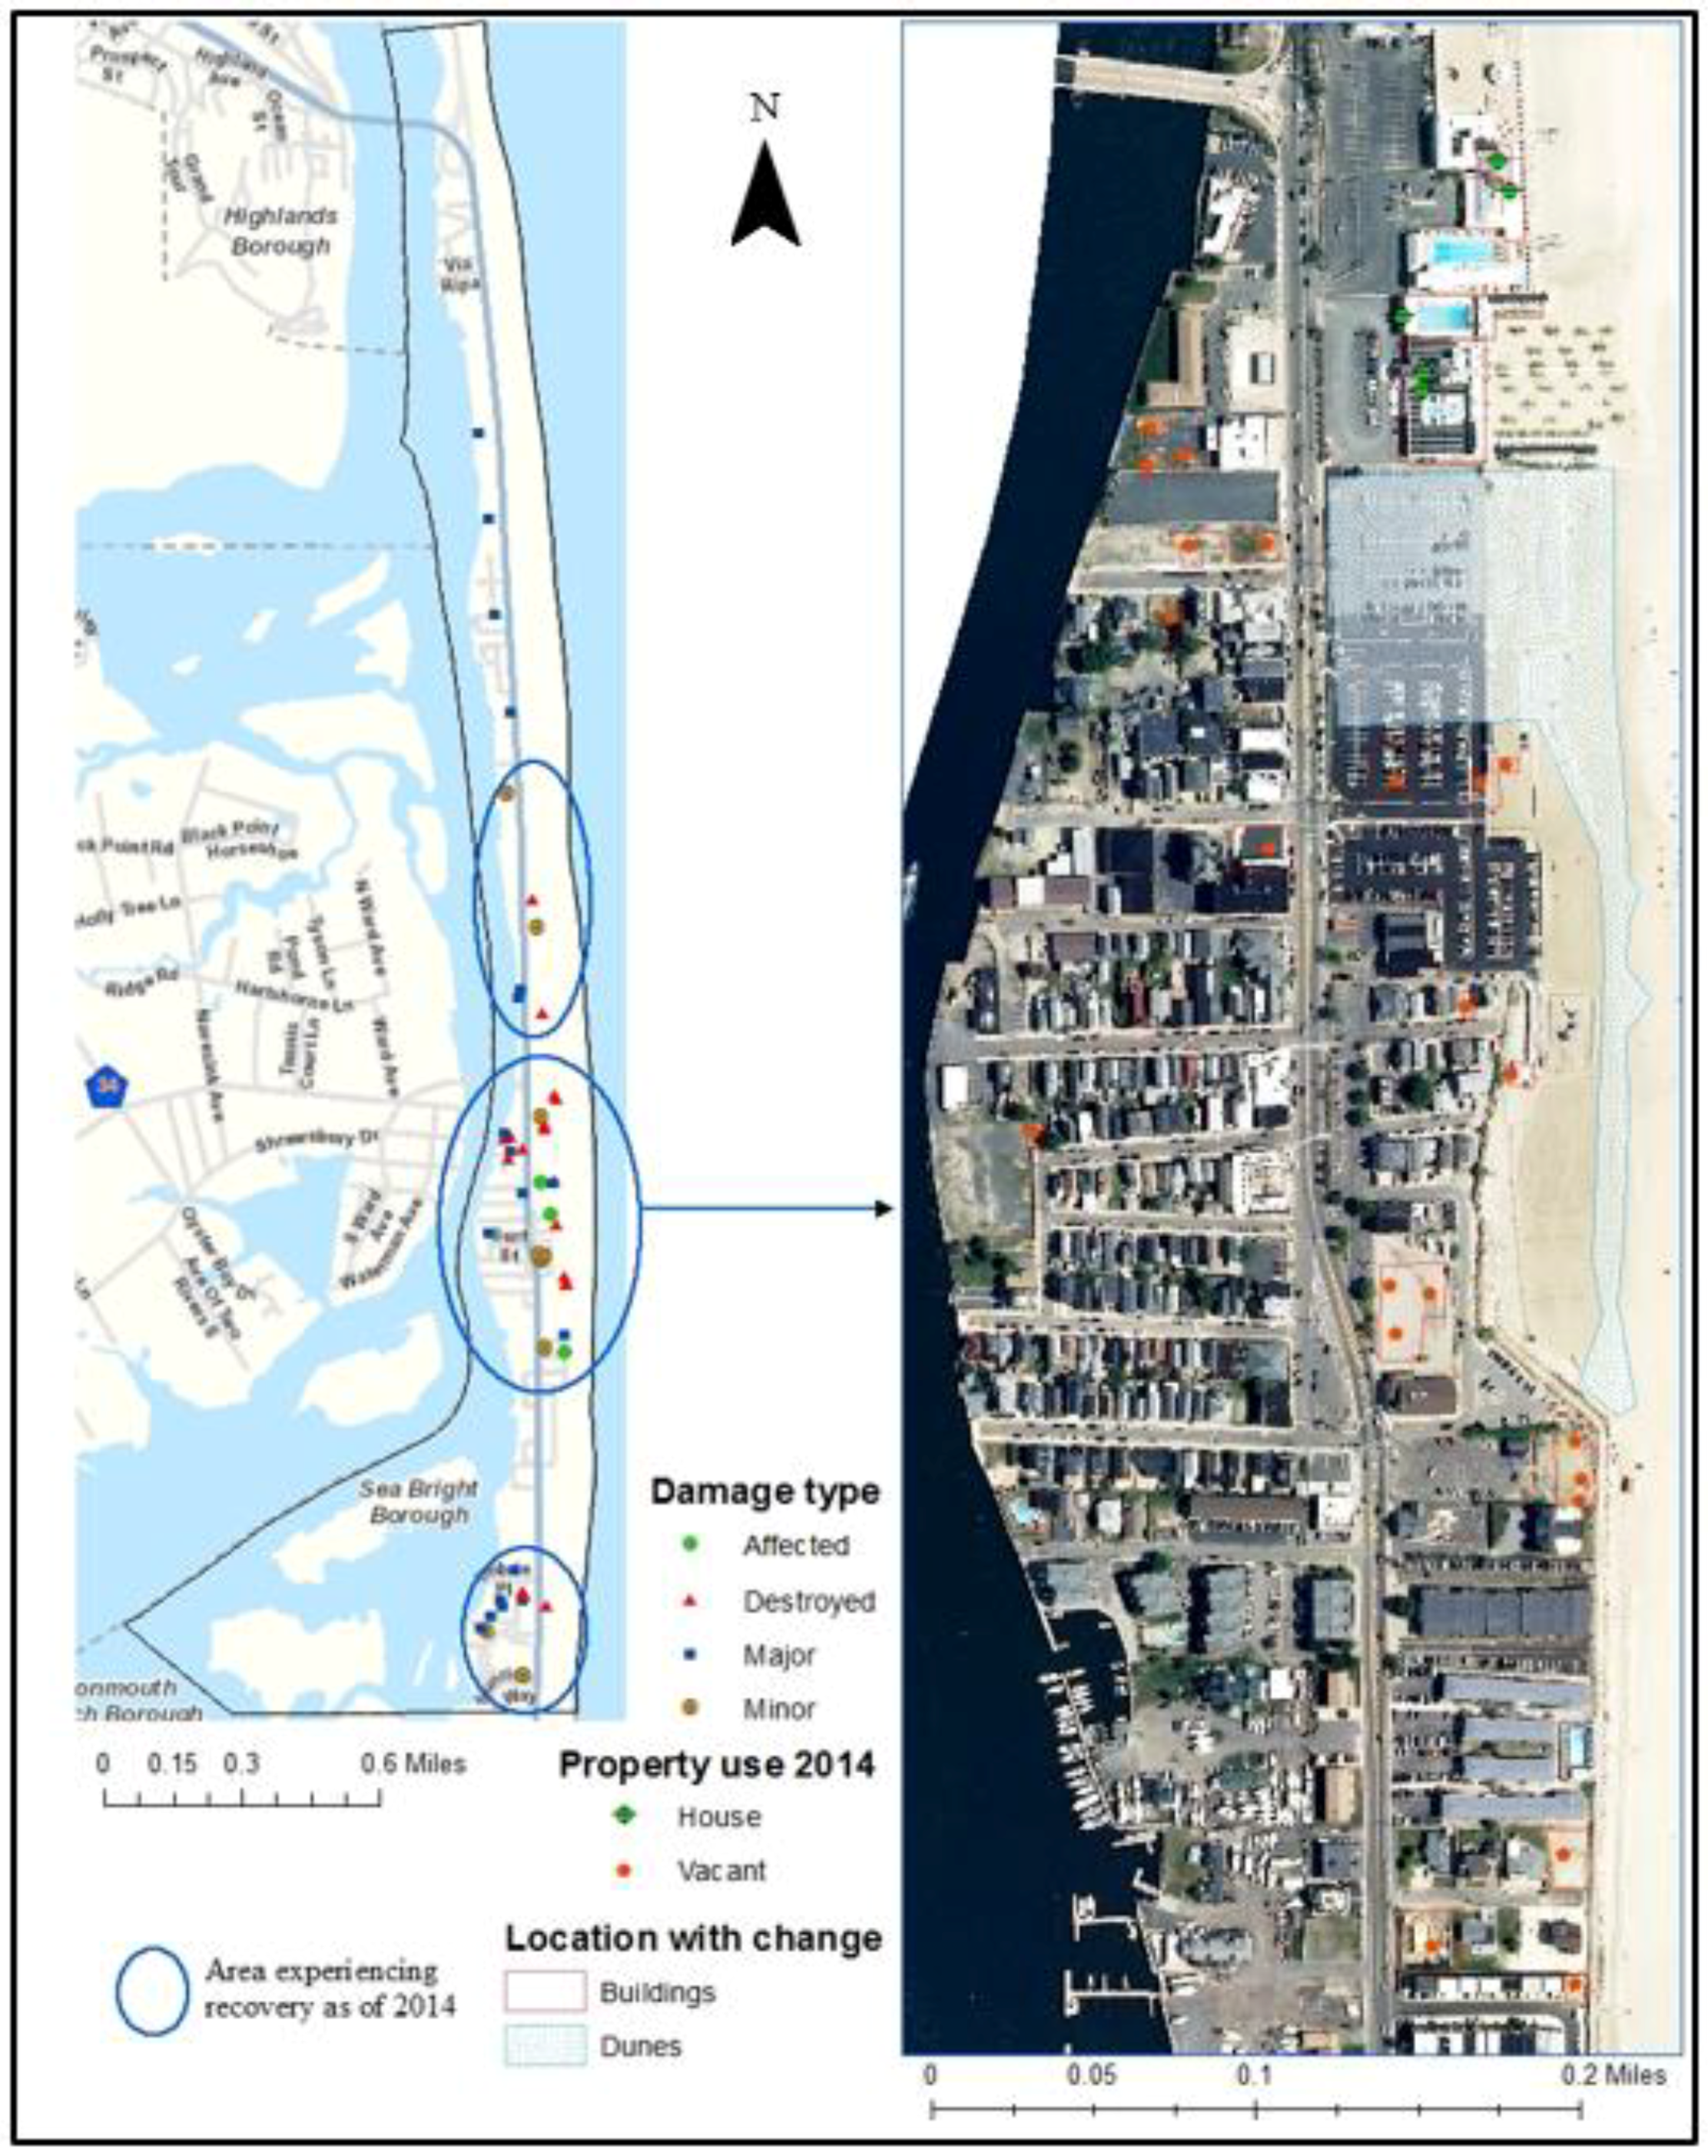
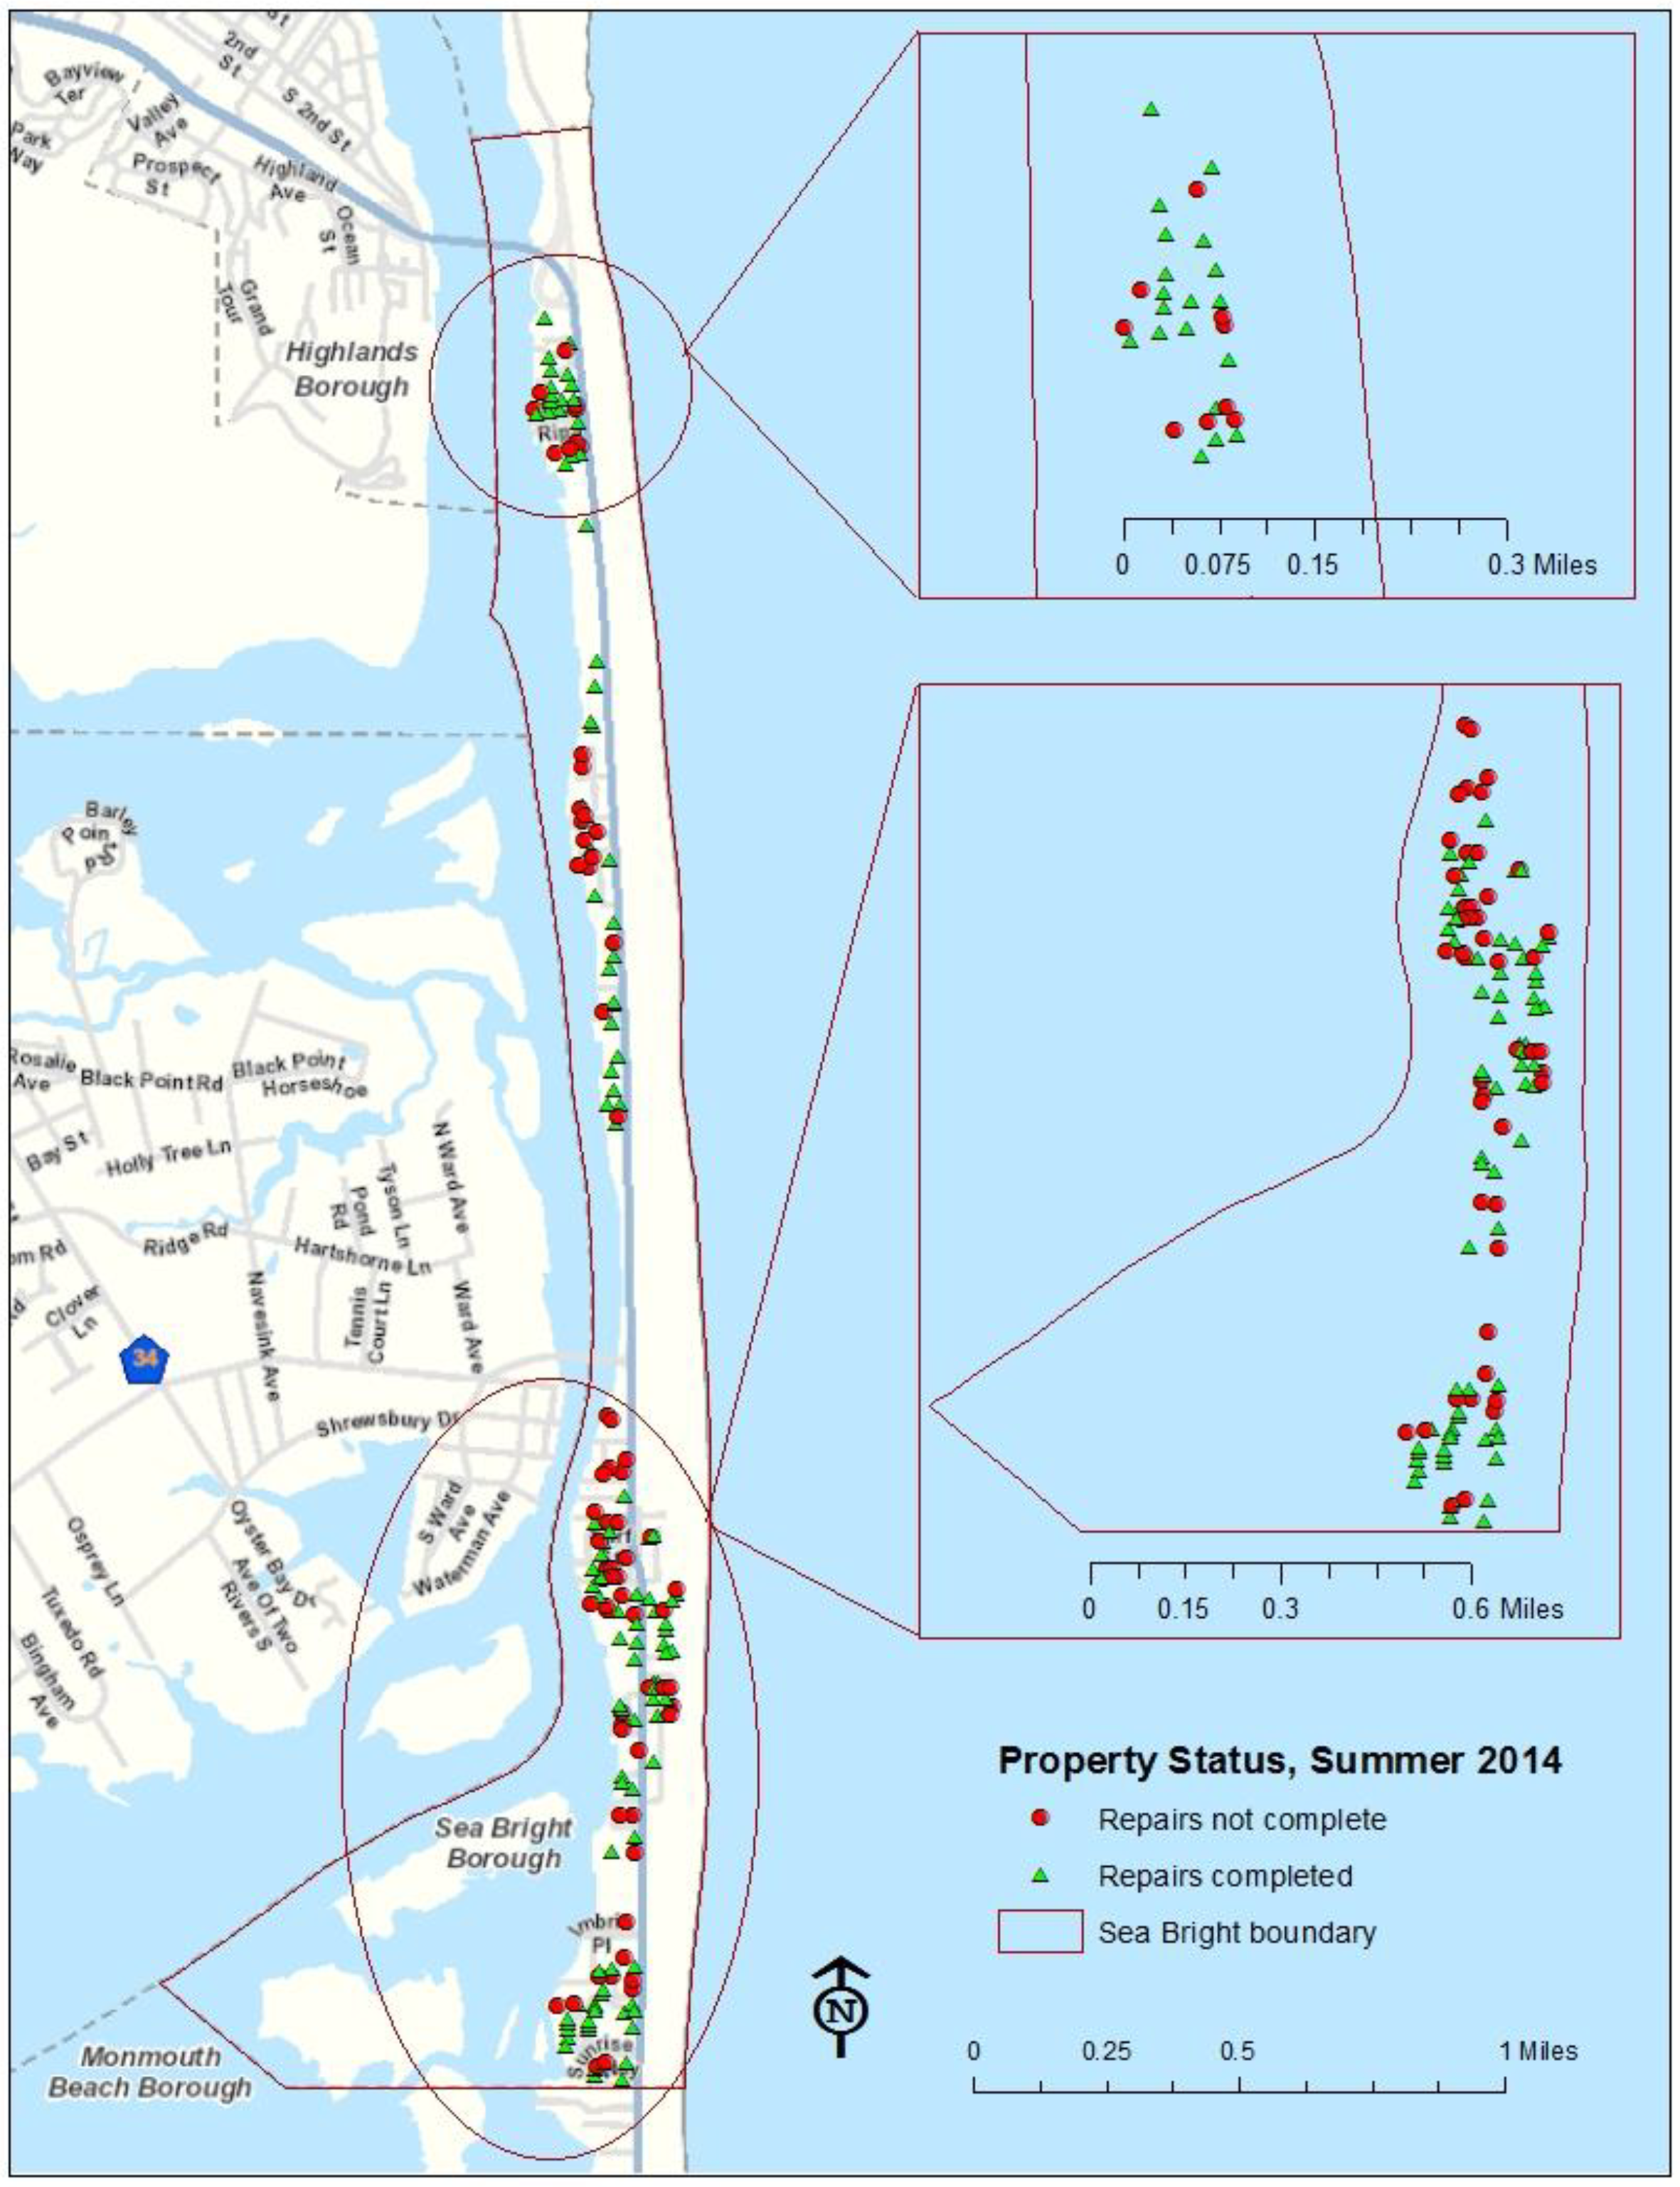
4.2.1. Property Status Comparing Survey Data and FEMA Damage Data
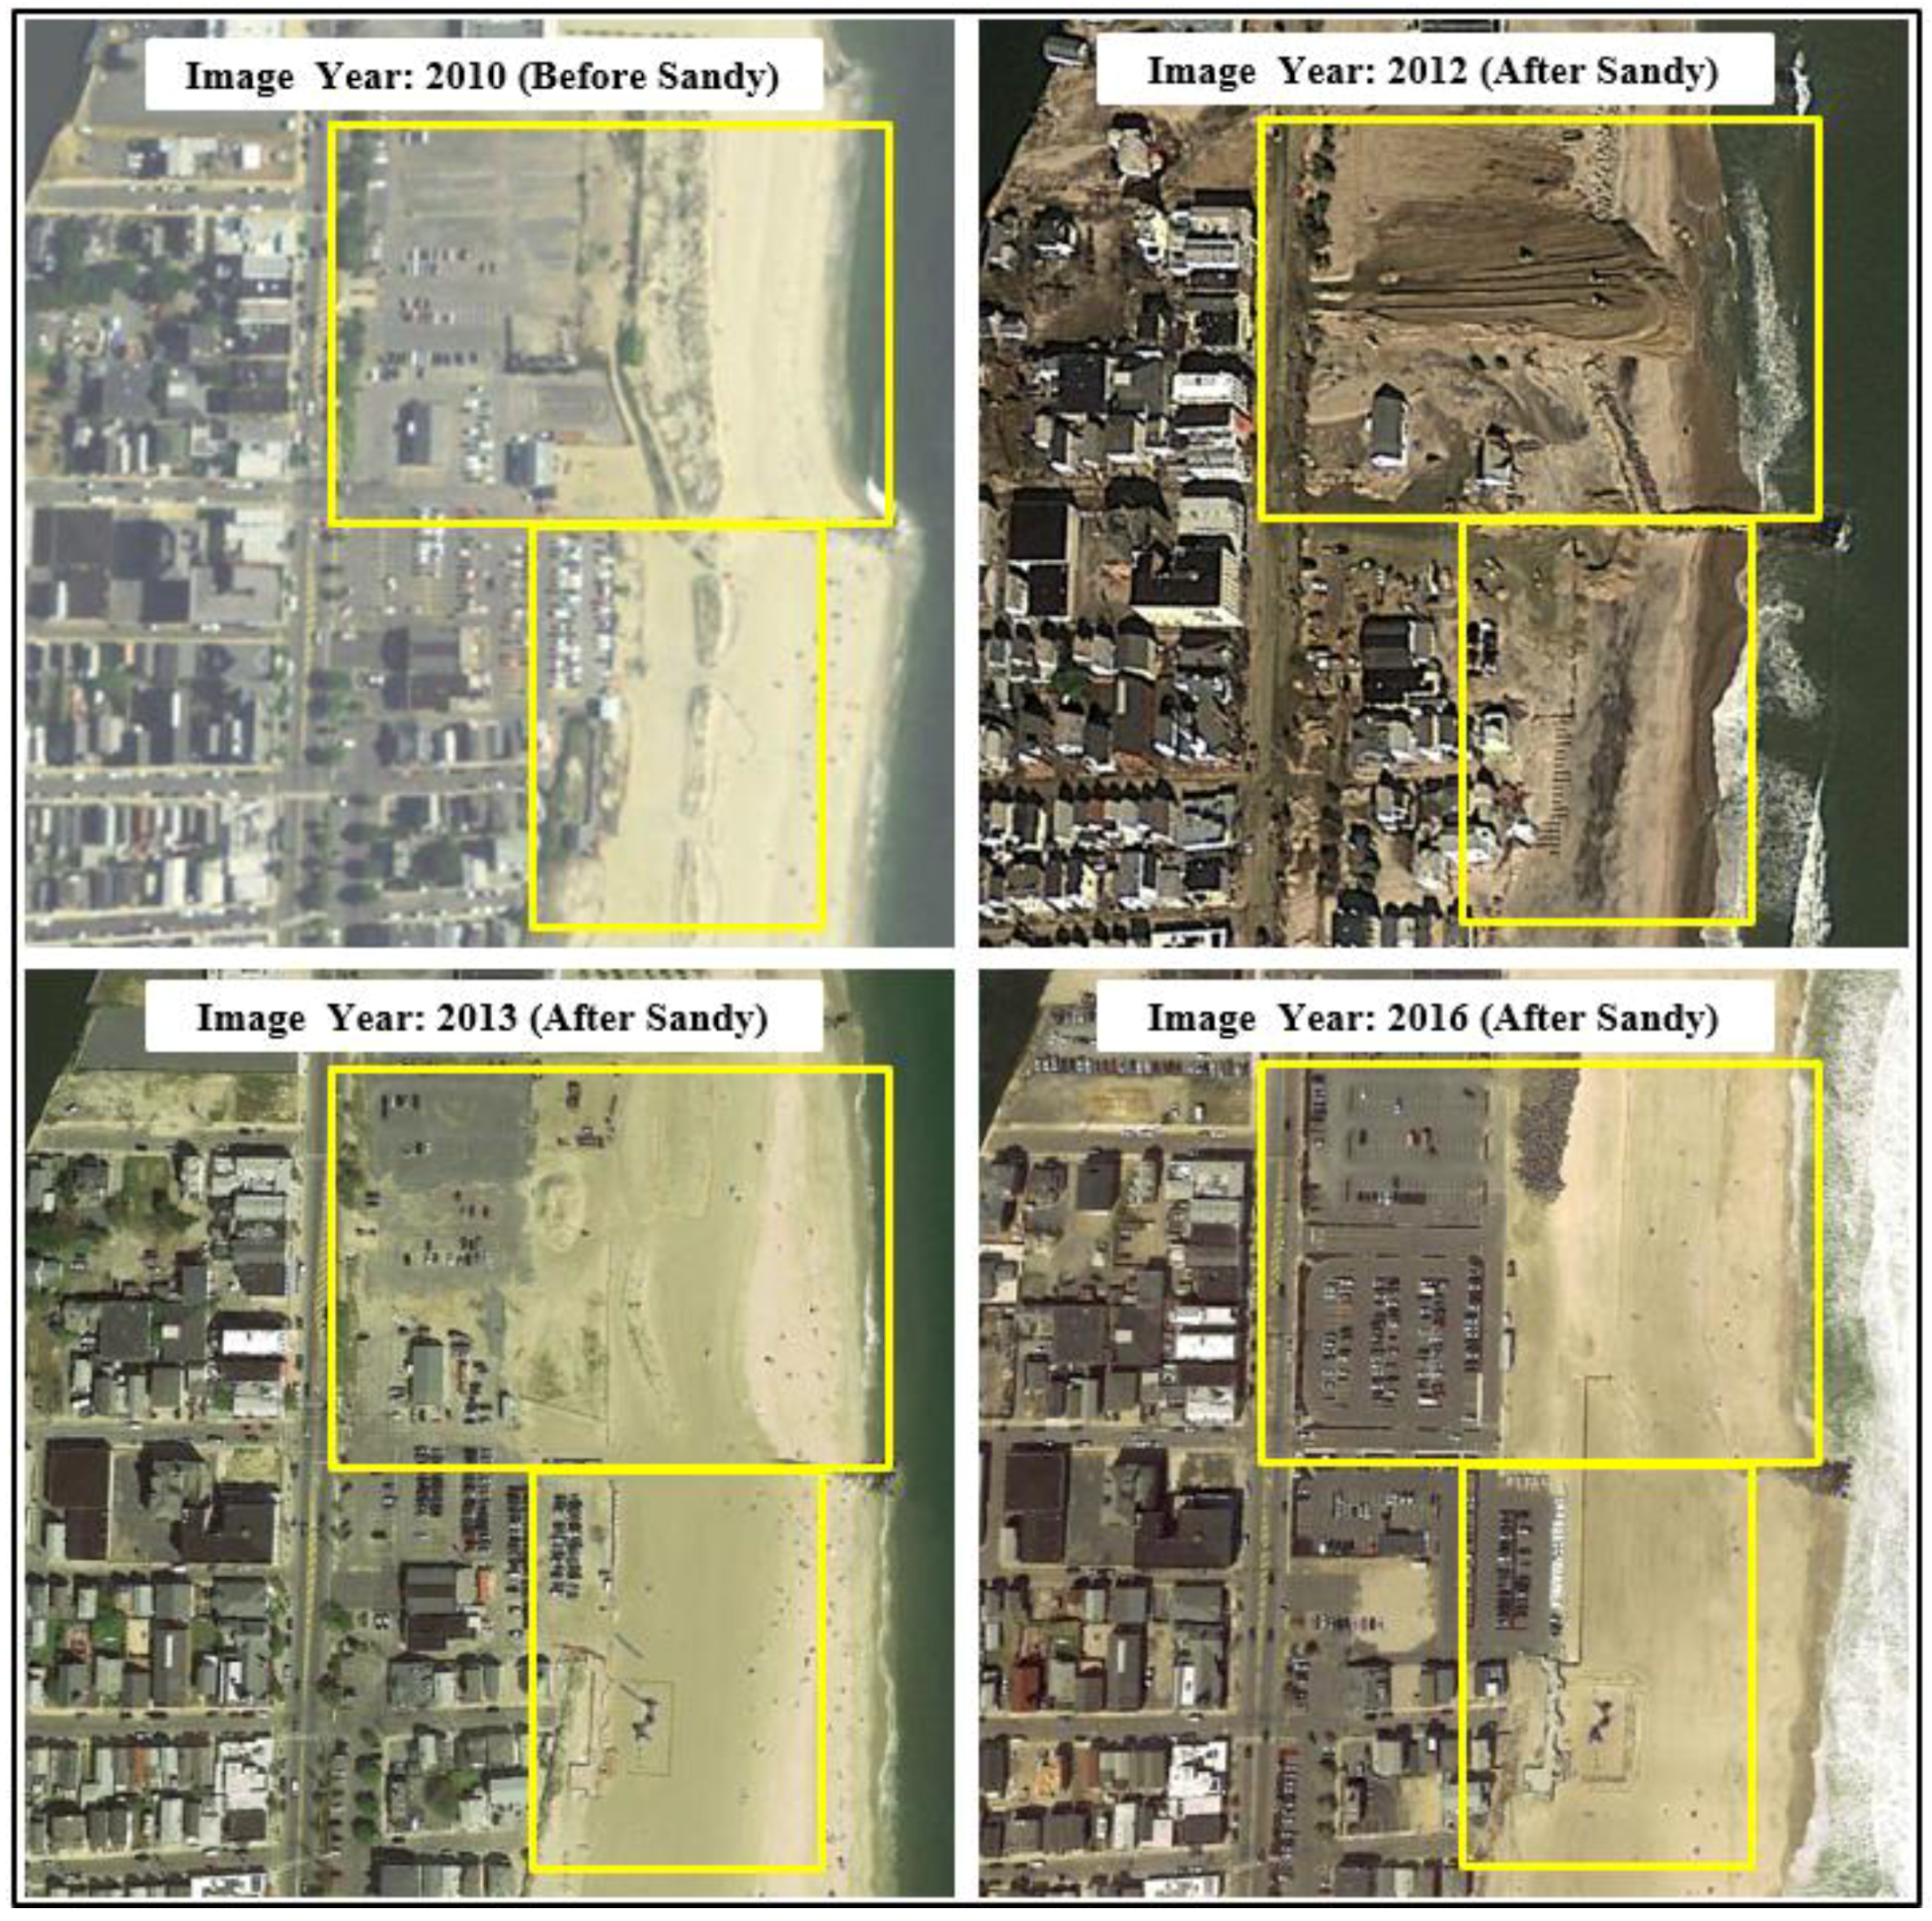
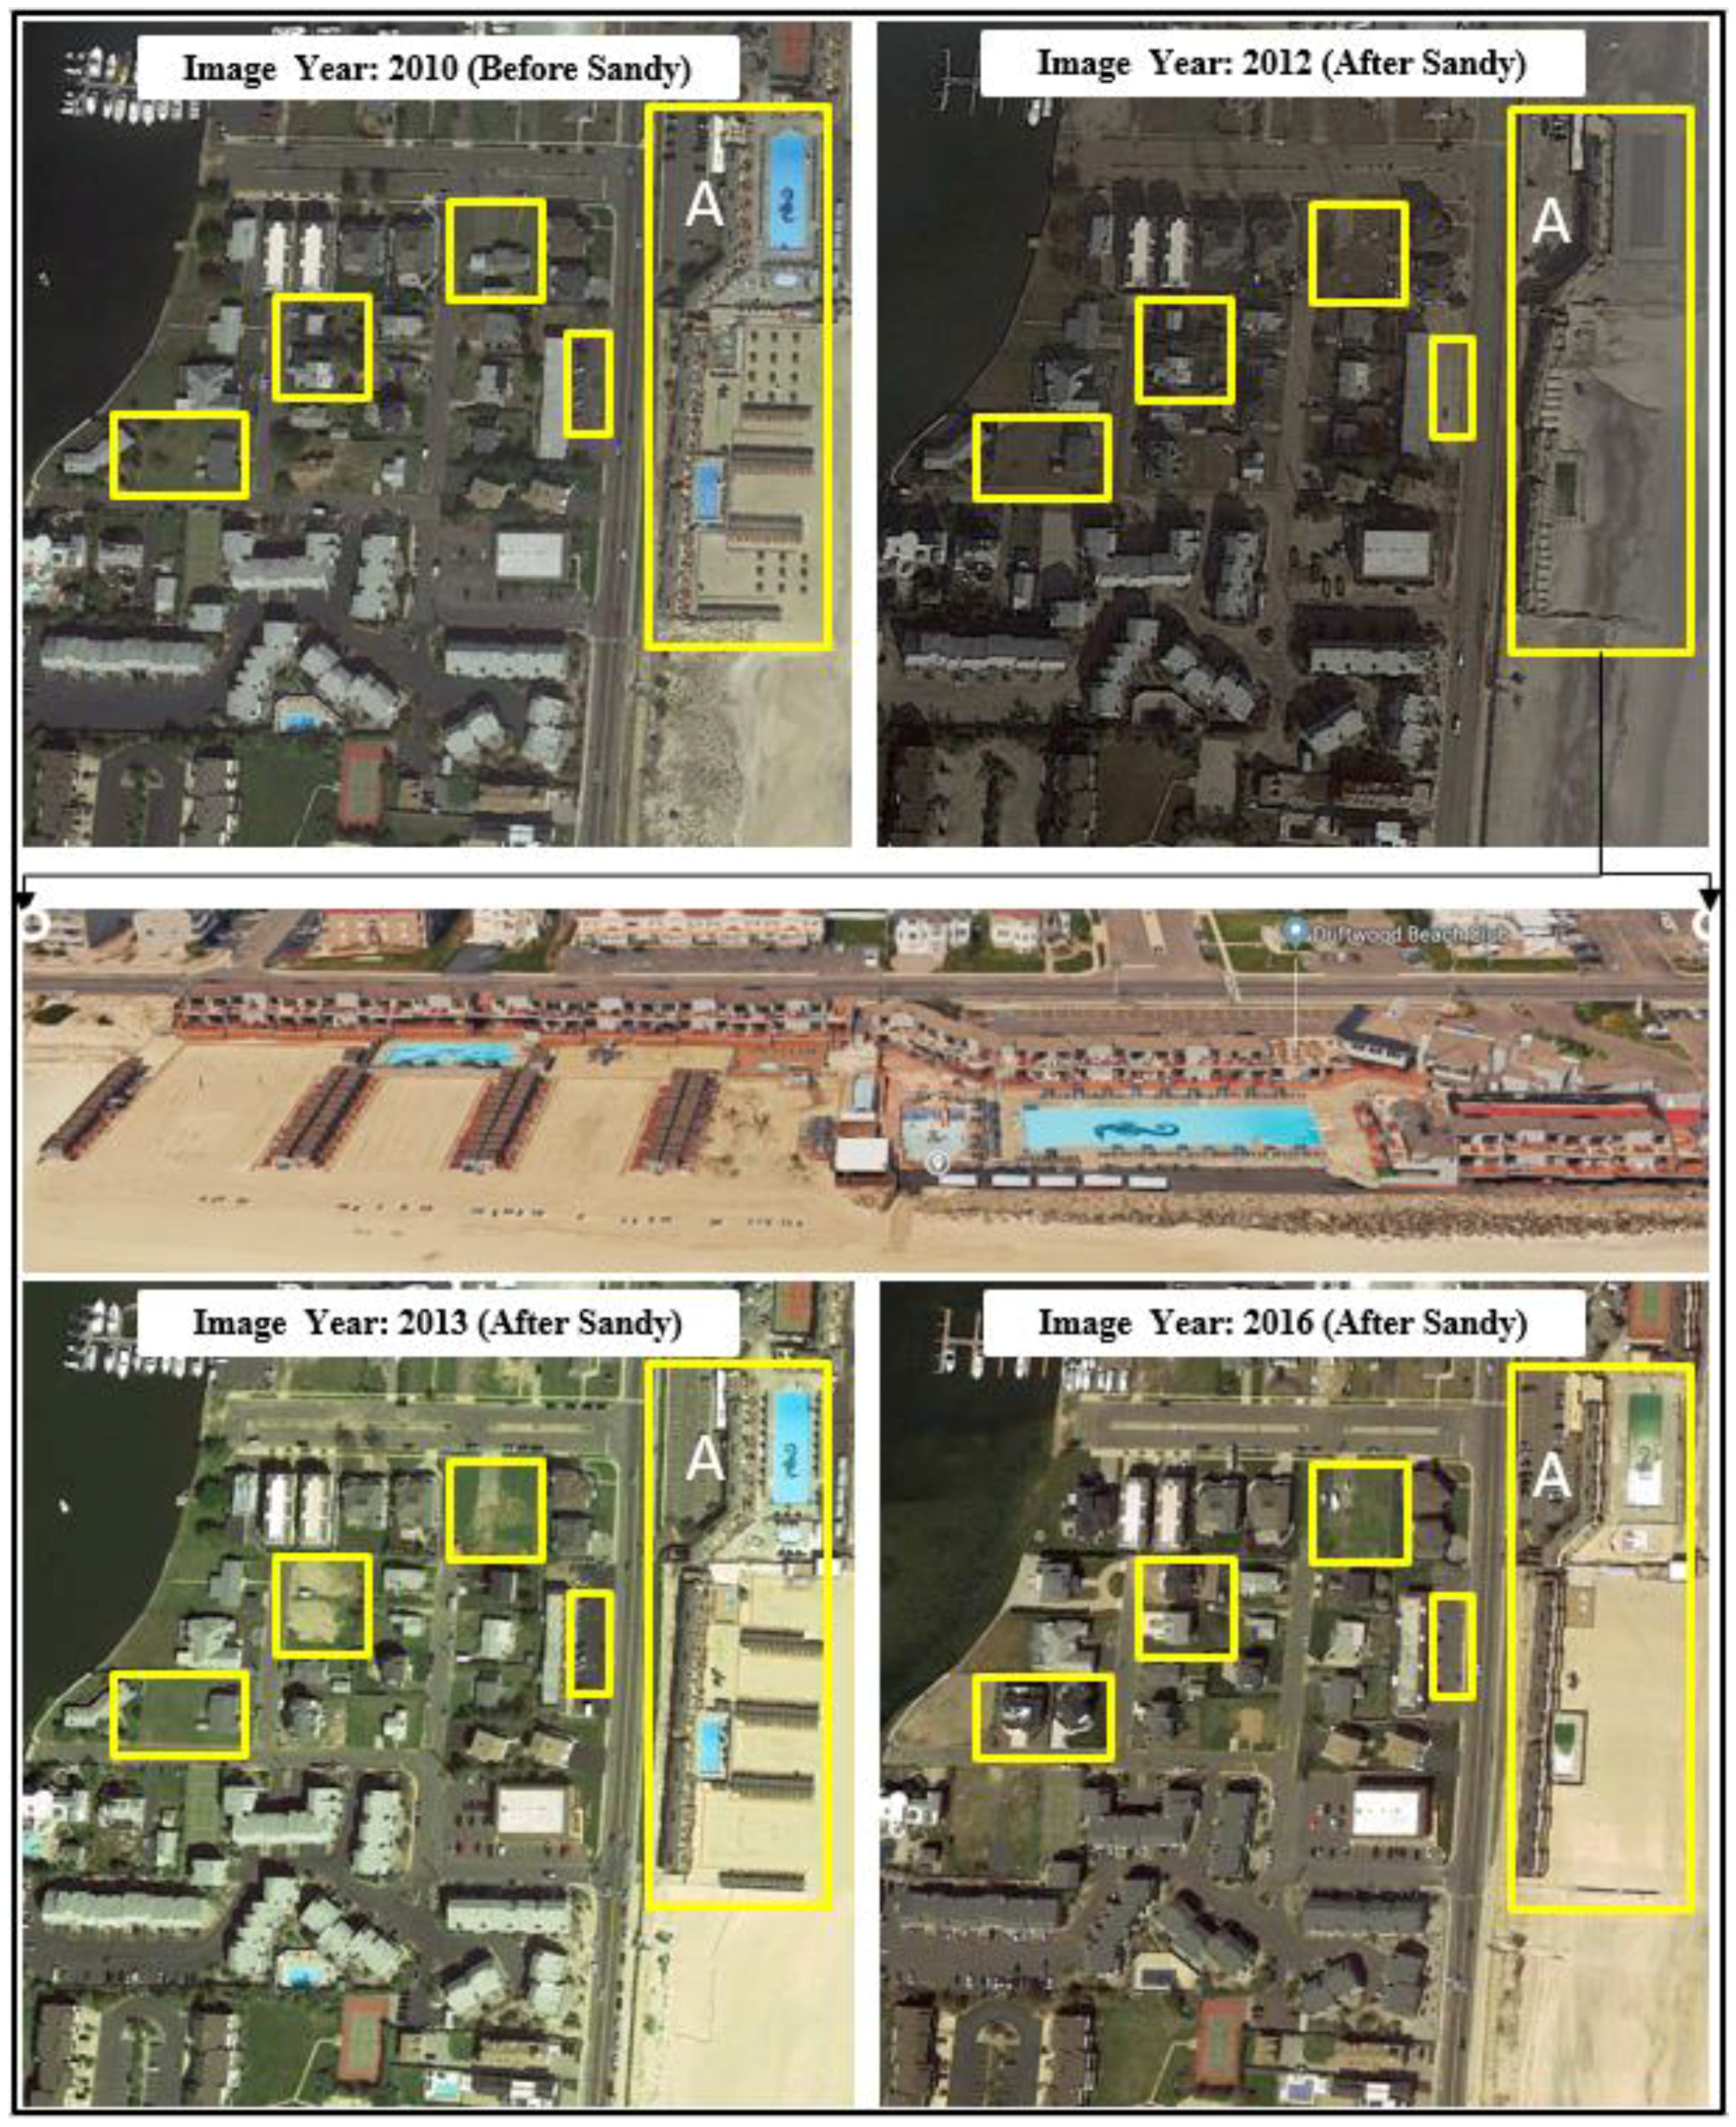
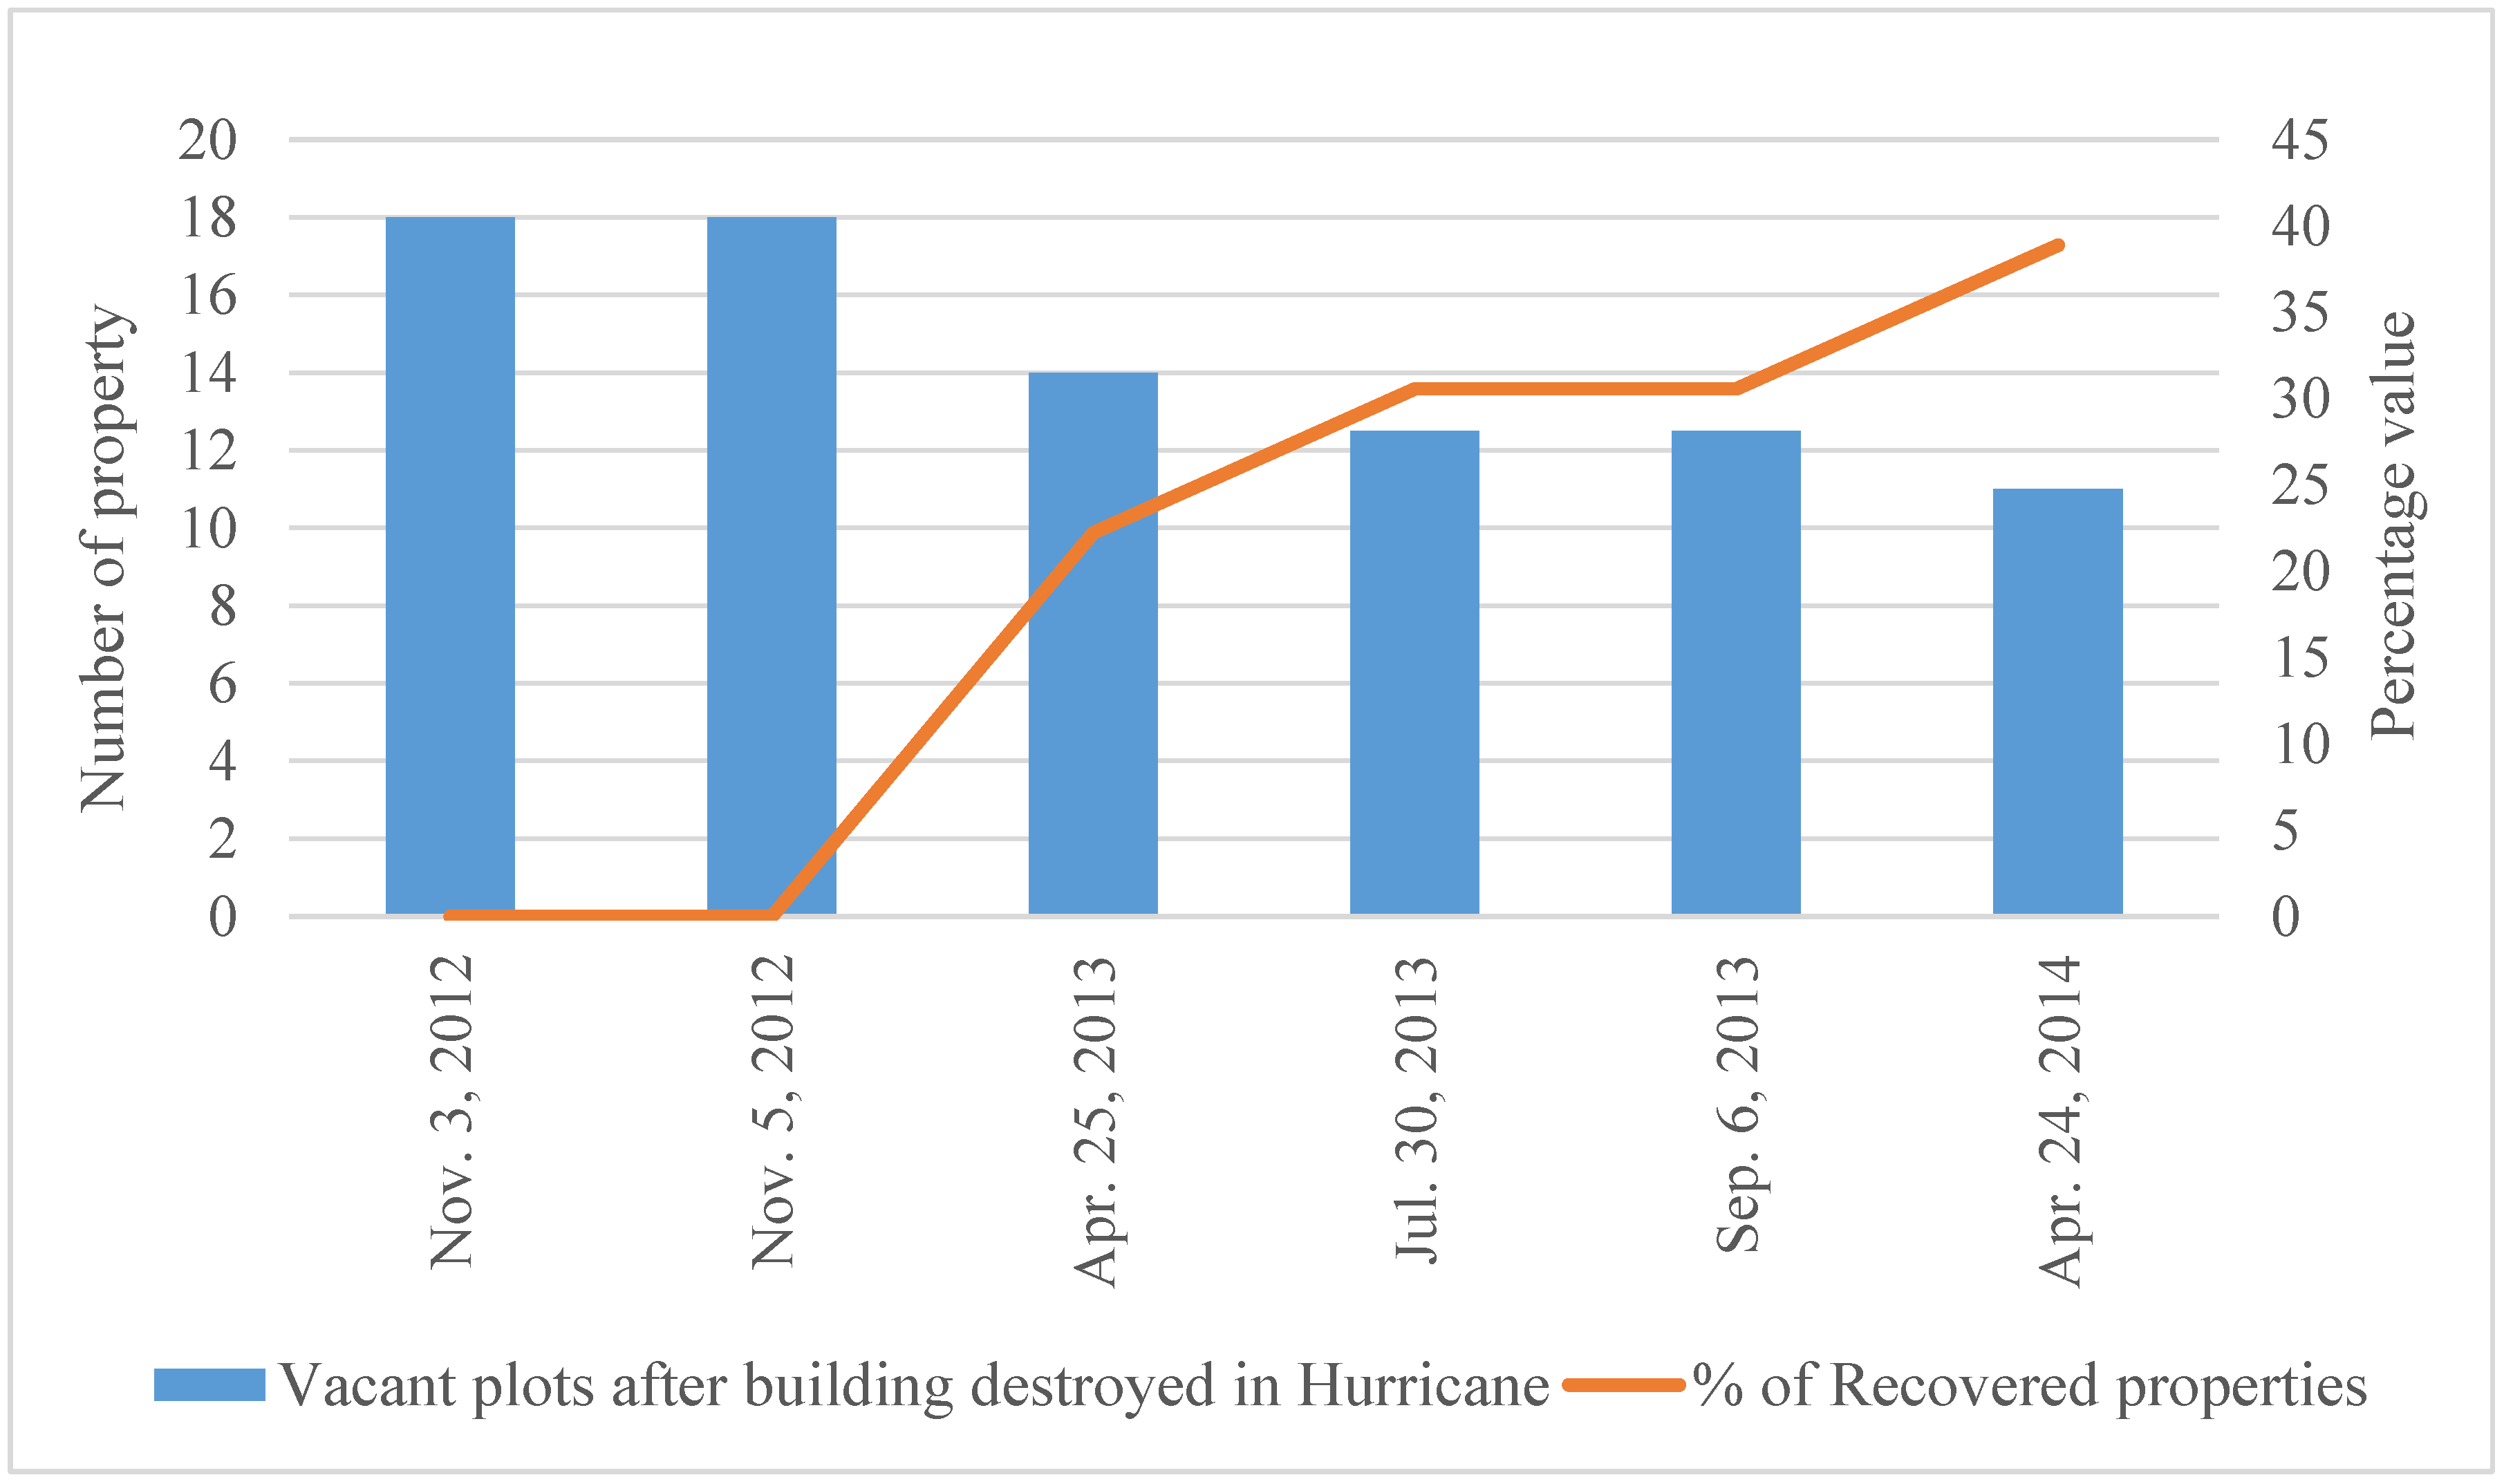
4.2.2. Recovery of Destroyed Property Assessed from Aerial and Satellite Imagery
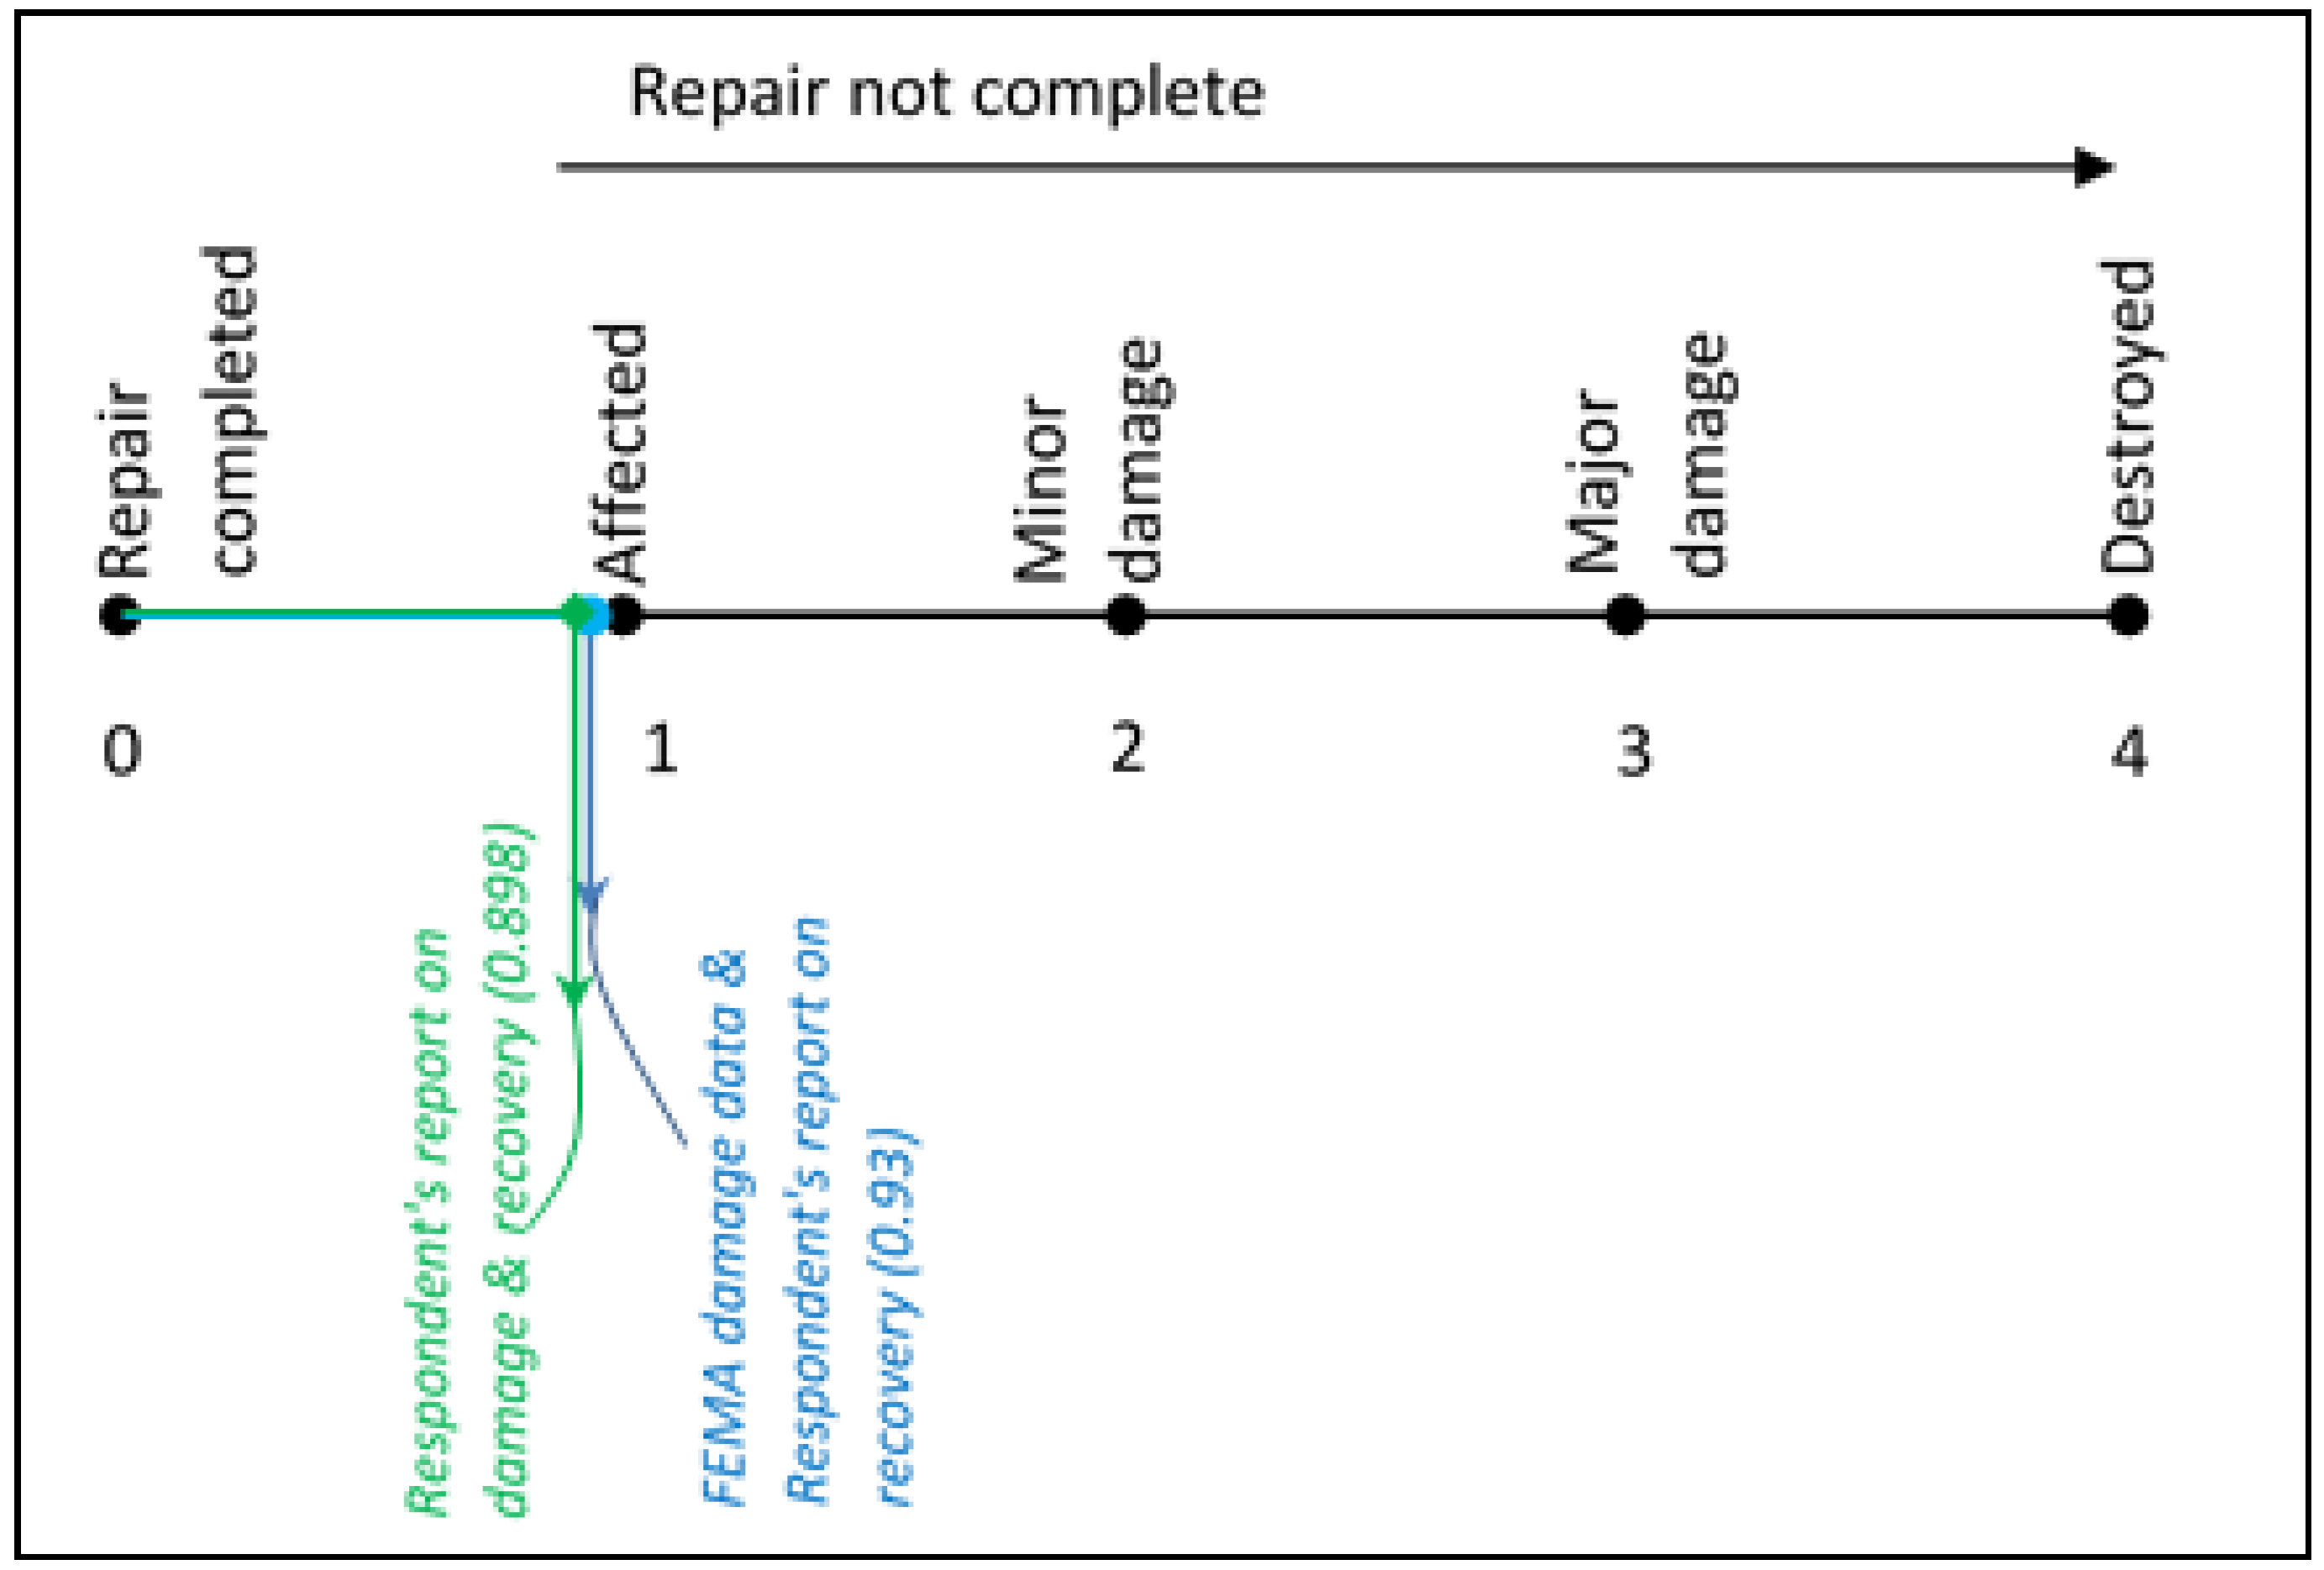
4.2.3. Scaling Recovery in the Study Area
5. Discussion
6. Conclusions
Author Contributions
Acknowledgments
Conflicts of Interest
References
- Page, S.; Connell, J. Tourism: A Modern Synthesis, 4th ed.; Cengage Learning EMEA: Andover, UK, 2014. [Google Scholar]
- Orchiston, C.; Higham, J.E.S. Knowledge management and tourism recovery (de) marketing: The Christchurch earthquakes 2010–2011. Curr. Issues Tour. 2016, 19, 64–84. [Google Scholar] [CrossRef]
- FEMA. Sandy Recovery Continues over the Holidays. 2014. Available online: http://www.fema.gov/disaster/4086/updates/sandy-recovery-continues-over-holidays (accessed on 20 June 2015).
- Peacock, W.G.; Dash, N.; Zhang, Y. Sheltering and housing recovery following disaster. In Handbook of Disaster Research; Springer: New York, NY, USA, 2007; pp. 258–274. [Google Scholar]
- Phillips, B.D.; Neal, D.M.; Webb, G. Introduction to Emergency Management; CRC Press: Boca Raton, FL, USA, 2011. [Google Scholar]
- Faulkner, B. Towards a framework for tourism disaster management. Tour. Manag. 2001, 22, 135–147. [Google Scholar] [CrossRef]
- Smith, G.P.; Wenger, D. Sustainable disaster recovery: Operationalizing an existing agenda. In Handbook of Disaster Research; Springer: New York, NY, USA, 2007; pp. 234–257. [Google Scholar]
- Rubin, C.B.; Saperstein, M.D.; Barbee, D.G. Community Recovery from a Major Natural Disaster; University of Colorado: Denver, CO, USA, 1985. [Google Scholar]
- Geipel, R. Disaster and Reconstruction: The Friuli (Italy) Earthquake of 1976; Allen & Unwin: London, UK, 1980. [Google Scholar]
- Haddow, G.; Bullock, J.; Coppola, D.P. Introduction to Emergency Management; Butterworth-Heinemann: Oxford, UK, 2007. [Google Scholar]
- Rathfon, D.; Davidson, R.; Bevington, J.; Vicini, A.; Hill, A. Quantitative assessment of post-disaster housing recovery: A case study of Punta Gorda, Florida, after hurricane charley. Disasters 2013, 37, 333–355. [Google Scholar] [CrossRef] [PubMed]
- Barton, A.H. Communities in Disaster: A Sociological Analysis of Collective Stress Situations; Doubleday: New York, NY, USA, 1969. [Google Scholar]
- Schwab, J. Planning for Post-Disaster Recovery and Reconstruction; Federal Emergency Management Agency: Washington, DC, USA; American Planning Association: Chicago, IL, USA, 1998. [Google Scholar]
- Haas, J.E.; Kates, R.W.; Bowden, M.J. Reconstruction following disaster. In Reconstruction Following Disaster; US The Massachusetts Institute of Technology: Cambridge, MA, USA, 1997. [Google Scholar]
- Olshansky, R.B. Toward a theory of community recovery from disaster: A review of existing literature. In Proceedings of the 1st International Conference of Urban Disaster Reduction, Kobe, Japan, 18–22 January 2005. [Google Scholar]
- Quarantelli, E.L. Patterns of sheltering and housing in US disasters. Disaster Prev. Manag. 1995, 4, 43–53. [Google Scholar] [CrossRef]
- Becker, W.S.; Stauffer, R.F. Rebuilding for the Future: A Guide to Sustainable Redevelopment for Disaster-Affected Communities; Department of Energy: Washington, DC, USA, 1994.
- Thieler, E.R.; Bush, D.M. Hurricanes Gilbert and Hugo send powerful messages for coastal development. J. Geol. Educ. 1991, 39, 291–299. [Google Scholar] [CrossRef]
- Nigg, J.M. Disaster recovery as a social process. In Wellington after the ‘Quake’: The Challenge of Rebuilding Cities; The Earthquake Commission: Wellington, New Zealand, 1995. [Google Scholar]
- Chang, S.E.; Miles, S.B. The dynamics of recovery: A framework. In Modeling Spatial and Economic Impacts of Disasters; Springer: Berlin/Heidelberg, Germany, 2004; pp. 181–204. [Google Scholar]
- Olson, R.S. Toward a politics of disaster: Losses, values, agendas, and blame. Crisis Manag. 2000, 18, 154. [Google Scholar]
- Olson, R.S.; Olson, R.A. “The rubble’s standing up” in Oroville, California: The politics of building safety. Int. J. Mass Emerg. Disasters 1993, 11, 163–188. [Google Scholar]
- Foley, D.L. The Sociology of Housing. Annu. Rev. Sociol. 1980, 6, 457–478. [Google Scholar] [CrossRef]
- Berke, P.R.; Kartez, J.; Wenger, D. Recovery after disaster: Achieving sustainable development, mitigation and equity. Disasters 1993, 17, 93–109. [Google Scholar] [CrossRef] [PubMed]
- Smith, G.; Birkland, T. Building a Theory of Recovery: Institutional Dimensions. Int. J. Mass Emerg. Disasters 2012, 30, 147–170. [Google Scholar]
- Chang, S.E. Urban disaster recovery: A measurement framework and its application to the 1995 Kobe earthquake. Disasters 2010, 34, 303–327. [Google Scholar] [CrossRef] [PubMed]
- Sword-Daniels, V.L.; Twigg, J.; Loughlin, S.C. Time for change? Applying an inductive timeline tool for a retrospective study of disaster recovery in Montserrat, West Indies. Int. J. Disaster Risk Reduct. 2015, 12, 125–133. [Google Scholar] [CrossRef]
- FEMA. National Disaster Recovery Framework: Strengthening Disaster Recovery for the Nation. (Policy); Federal Emergency Management Agency, 2011. Available online: http://www.fema.gov/media-library-data/20130726-1820-25045-5325/508_ndrf.pdf (accessed on 20 May 2015).
- Kaku, K.; Aso, N.; Takiguchi, F. Space-based response to the 2011 Great East Japan Earthquake: Lessons learnt from JAXA’s support using earth observation satellites. Int. J. Disaster Risk Reduct. 2015, 12, 134–153. [Google Scholar] [CrossRef]
- Morgan, J.; Begg, A.; Beaven, S.; Schluter, P.; Jamieson, K.; Johal, S.; Sparrow, M. Monitoring wellbeing during recovery from the 2010–2011 Canterbury earthquakes: The CERA Wellbeing Survey. Int. J. Disaster Risk Reduct. 2015, 14, 96–103. [Google Scholar] [CrossRef]
- Stevenson, J.R.; Emrich, C.T.; Mitchell, J.T.; Cutter, S.L. Using building permits to monitor disaster recovery: A Spatio-temporal case study of coastal Mississippi following hurricane Katrina. Cartogr. Geogr. Inf. Sci. 2010, 37, 57–68. [Google Scholar] [CrossRef]
- Zhang, Y.; Peacock, W.G. Planning for housing recovery? Lessons learned from Hurricane Andrew. J. Am. Plan. Assoc. 2008, 76, 5–24. [Google Scholar] [CrossRef]
- Yang, B. GIS based 3-D landscape visualization for promoting citizen’s awareness of coastal hazard scenarios in flood prone tourism towns. Appl. Geogr. 2016, 76, 85–97. [Google Scholar] [CrossRef]
- Yang, B.; Lee, J. Improving accuracy of automated 3-D building models for smart cities. Int. J. Digit. Earth 2017, 1–19. [Google Scholar] [CrossRef]
- Tourism Economics. The Economic Impact of Tourism in New Jersey. An Oxford Economics Company. 2014. Available online: https://www.visitnj.org/sites/default/master/files/2014-nj-economic-impact.pdf (accessed on 20 May 2018).
- McNeil, S.; Trainor, J.; Greer, A.; Jahan, I.; Mininger, K. Understanding the Relationships between Household Decisions and Infrastructure Investment in Disaster Recovery: Cases from Superstorm Sandy; Final Report; Center for Advanced Infrastructure and Transportation, Rutgers University: Piscataway, NJ, USA, December 2016. [Google Scholar]
- FEMA-MOTF. Hurricane Sandy Impact Analysis. 2014. Available online: https://content.femadata.com/MOTF/Hurricane_Sandy/FEMA%20MOTF-Hurricane%20Sandy%20Products%20ReadME%20FINAL.pdf (accessed on 20 June 2015).
- HUD. Sandy Damage Estimates by Block Group. 2014. Available online: http://www.huduser.org/maps/map_sandy_blockgroup.html (accessed on 20 June 2015).


| Damage Level | All Responses from the Survey | Response Addresses Located Only in Sea Bright | Damage Level | FEMA-MOTF Data Corresponding to the Response in Sea Bright | FEMA-MOTF Data for Entire Sea Bright | ||||
|---|---|---|---|---|---|---|---|---|---|
| n | % | n | % | n | % | n | % | ||
| No Damage | 20 | 6.69 | 7 | 3.94 | Affected | 22 | 12.22 | 108 | 14.23 |
| Not Very Extensive | 73 | 24.42 | 46 | 25.84 | Minor | 86 | 47.78 | 252 | 33.2 |
| Somewhat Extensive | 113 | 37.79 | 68 | 38.20 | Major | 69 | 38.33 | 381 | 50.2 |
| Very Extensive | 93 | 31.10 | 57 | 32.02 | Destroyed | 3 | 1.67 | 18 | 2.37 |
| Total | 299 | 100 | 178 | 100 | Total | 180 | 100 | 759 | 100 |
| Missing | 4 | 2 | |||||||
| FEMA Data for Whole Area and Survey-Responded Locations | Response Category in Survey | ||||||||
|---|---|---|---|---|---|---|---|---|---|
| Damage Type | No. of Damaged Properties | Scale | Impact of Damage | Damage Type | No. of Damaged Properties | Scale | Impact on Properties | ||
| Survey Location | Entire Borough | Survey Location | Entire Borough | ||||||
| Affected | 22 | 108 | 1 | 0.12 | 0.14 | No Damage | 20 | 0 | 0 |
| Minor | 86 | 252 | 2 | 0.07 | 0.66 | Not Very Extensive | 73 | 1 | 0.26 |
| Major | 69 | 381 | 3 | 1.15 | 1.51 | Somewhat Extensive | 113 | 2.5 | 1.01 |
| Destroyed | 3 | 18 | 4 | 0.96 | 0.09 | Very Extensive | 93 | 4 | 1.33 |
| Total | 180 | 759 | 2.29 | 2.41 | Total | 279 (excluding no damage) | 2.6 | ||
| FEMA Damage Record | No. of Damaged Properties | Repair Not Complete | Scale | Impact | Extensive Damage to Home from Survey | No. of Damaged Properties | Repair Not Complete | Scale | Impact |
|---|---|---|---|---|---|---|---|---|---|
| Affected | 22 | 7 | 1 | 0.04 | Not very Extensive | 73 | 29 | 1 | 0.104 |
| Minor | 86 | 24 | 2 | 0.27 | Somewhat Extensive | 113 | 23 | 2.5 | 0.206 |
| Major | 69 | 35 | 3 | 0.58 | Very Extensive | 93 | 41 | 4 | 0.588 |
| Destroyed | 3 | 2 | 4 | 0.04 | Total | 279 | 109 | 0.898 | |
| Total | 180 | 68 | 0.93 |
© 2018 by the authors. Licensee MDPI, Basel, Switzerland. This article is an open access article distributed under the terms and conditions of the Creative Commons Attribution (CC BY) license (http://creativecommons.org/licenses/by/4.0/).
Share and Cite
Yang, B.; Jahan, I. Comprehensive Assessment for Post-Disaster Recovery Process in a Tourist Town. Sustainability 2018, 10, 1842. https://doi.org/10.3390/su10061842
Yang B, Jahan I. Comprehensive Assessment for Post-Disaster Recovery Process in a Tourist Town. Sustainability. 2018; 10(6):1842. https://doi.org/10.3390/su10061842
Chicago/Turabian StyleYang, Byungyun, and Israt Jahan. 2018. "Comprehensive Assessment for Post-Disaster Recovery Process in a Tourist Town" Sustainability 10, no. 6: 1842. https://doi.org/10.3390/su10061842
APA StyleYang, B., & Jahan, I. (2018). Comprehensive Assessment for Post-Disaster Recovery Process in a Tourist Town. Sustainability, 10(6), 1842. https://doi.org/10.3390/su10061842