Mediating Role of the Six Sigma Implementation Strategy and Investment in Human Resources in Economic Success and Sustainability

 ,
,  ,
, 
 ,
,  and
and 
Abstract
1. Introduction
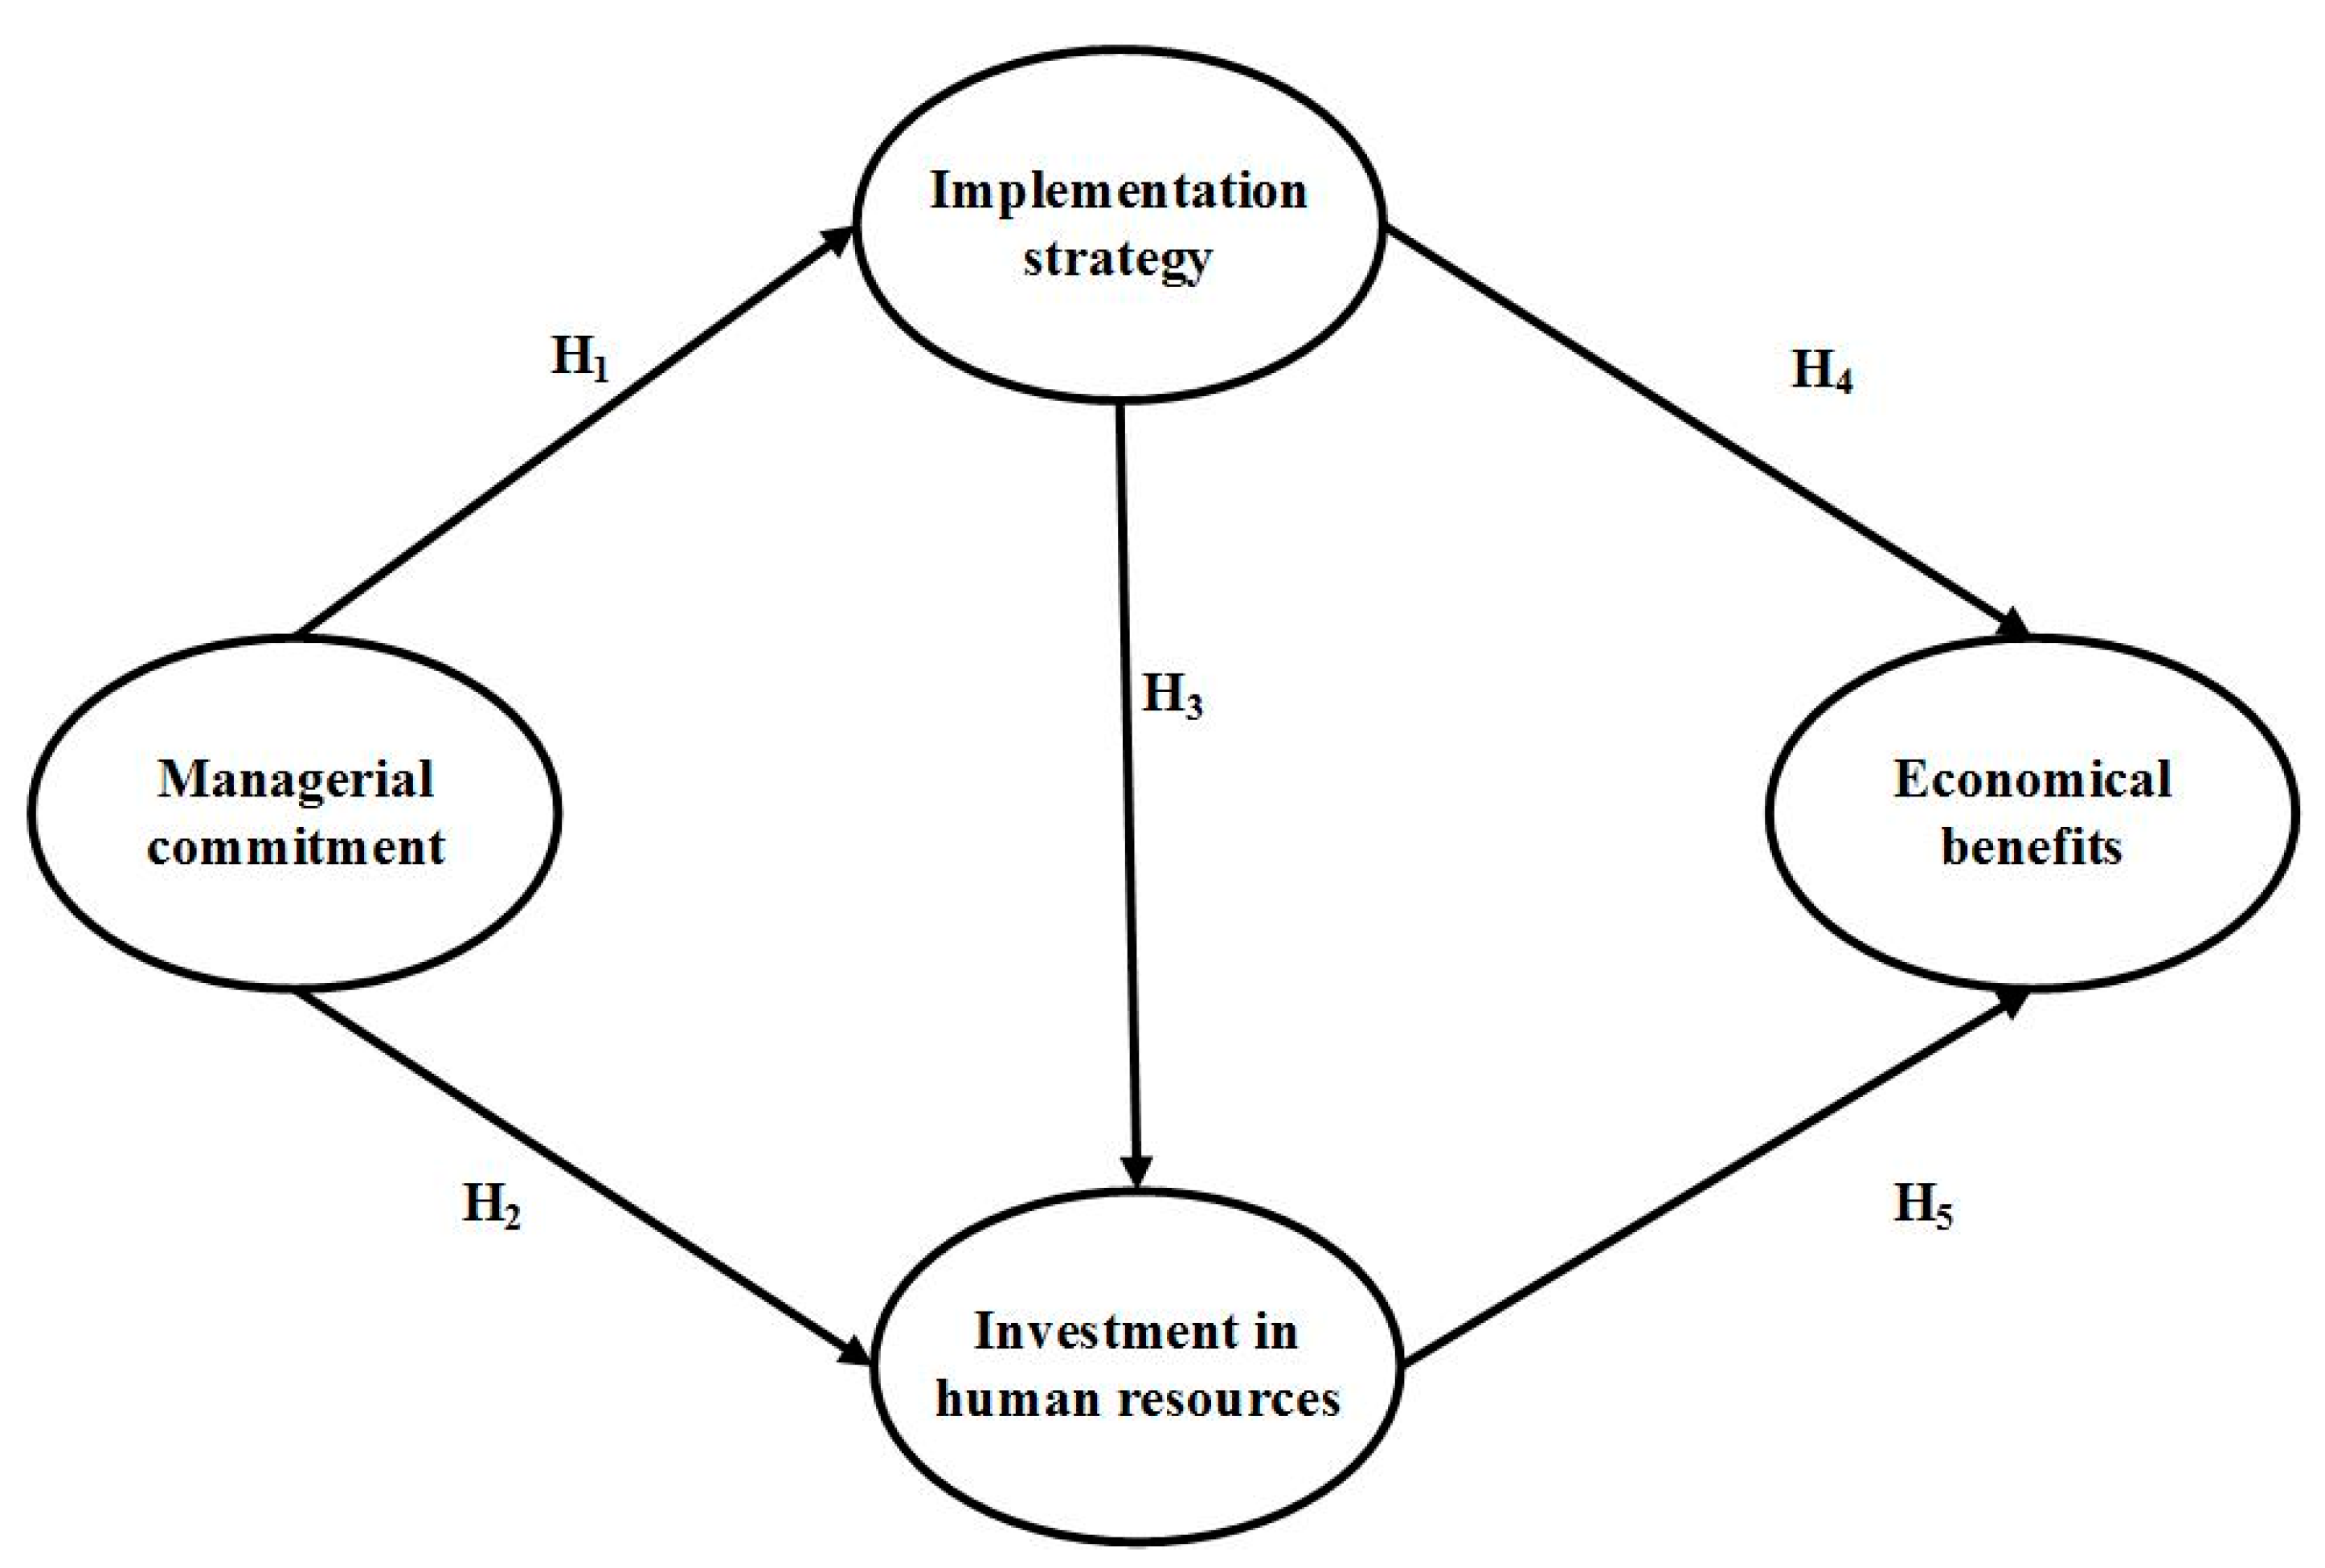
2. Literature Review and Hypotheses
2.1. Managerial Commitment (MC)
- Management regularly reviews the progress of six sigma projects (MC1);
- Management encourages knowledge transfer across different departments and the organisational structure (MC2);
- Management encourages interdepartmental cooperation in planning six sigma projects (MC3);
- Management requests reports on the progress of projects in each department (MC4);
- Management assigns the appropriate personnel for each project (MC5).
2.2. Six Sigma Implementation Strategy (IS)
- There is an organisational structure that supports six sigma, including Black Belts, Green Belts and Yellow Belts (IS1);
- Meetings are held between six sigma project leaders and project team members to enable monitoring (IS2);
- Six Sigma projects are related to clients’ demands (IS3);
- Improvement teams are aware of clients’ requirements (IS4);
- Department heads review clients’ demands and complaints before creating a six sigma project (IS5).
2.3. Investment in Human Resources for SS (HRI)
2.3.1. Education and Training (ET)
- There is a regular training schedule (ET1);
- Blank belts (BBs) and Green belts (GBs) are assigned to advise on six sigma projects (ET2);
- BBs and GBs are involved in the analysis of problems associated with the six sigma project (ET3);
- The workload is adjusted to allow time for education and training (ET4);
- Materials and software are provided for analysing the information (ET5).
2.3.2. Incentives (IN)
- Award ceremonies are held for certification as GBs, BBs, etc. (IN1);
- Regular awards are presented for the best six sigma projects (IN2);
- Project outcomes are considered in career performance and impact on the income of project members (IN3);
- The abandonment of an six sigma project affects promotion to higher positions (IN4);
- The outcomes of an six sigma project affect annual bonuses or salary increases at year end (IN5).
2.4. Six Sigma Economical Benefits
- there are savings in production costs (ECB1);
- a competitive advantage is created for the company (ECB2);
- there are increased returns on investment (ECB3);
- there are increased sales (ECB4);
- there is reduced wastage (ECB5).
2.5. Sustainability and Environmental Benefits
3. Materials and Methods
3.1. Stage 1: Information Collection
3.2. Stage 2: Analysis of Information
- For parametric predictive validity, R-squared and adjusted R-squared were used, expecting values higher than 0.02, while for non-parametric predictive validity, Q-squared was used, with values expected to be similar to those of R-squared.
- For internal validity, Cronbach’s alpha and the composite reliability index were used, accepting values higher than 0.7.
- For convergent validity, average variance extracted (AVE) was used, accepting values higher than 0.5.
- For measuring collinearity, variance inflation factors were used, accepting values lower than 3.3.
- For predictive validity, Average R-Squared (ARS) and Average Adjusted R-Squared (AARS) were used, associated with a p-value that must be less than 0.05.
- For measuring the collinearity between the latent variables, the average variance inflation factor (AVIF) and the average full collinearity VIF (AFVIF) were used, which must have values less than 3.3.
- For measuring the fitness of the data obtained for the model proposed, the Tenenhaus Goodness of Fit (GoF) index was used, which must have values greater than 0.36.
4. Results
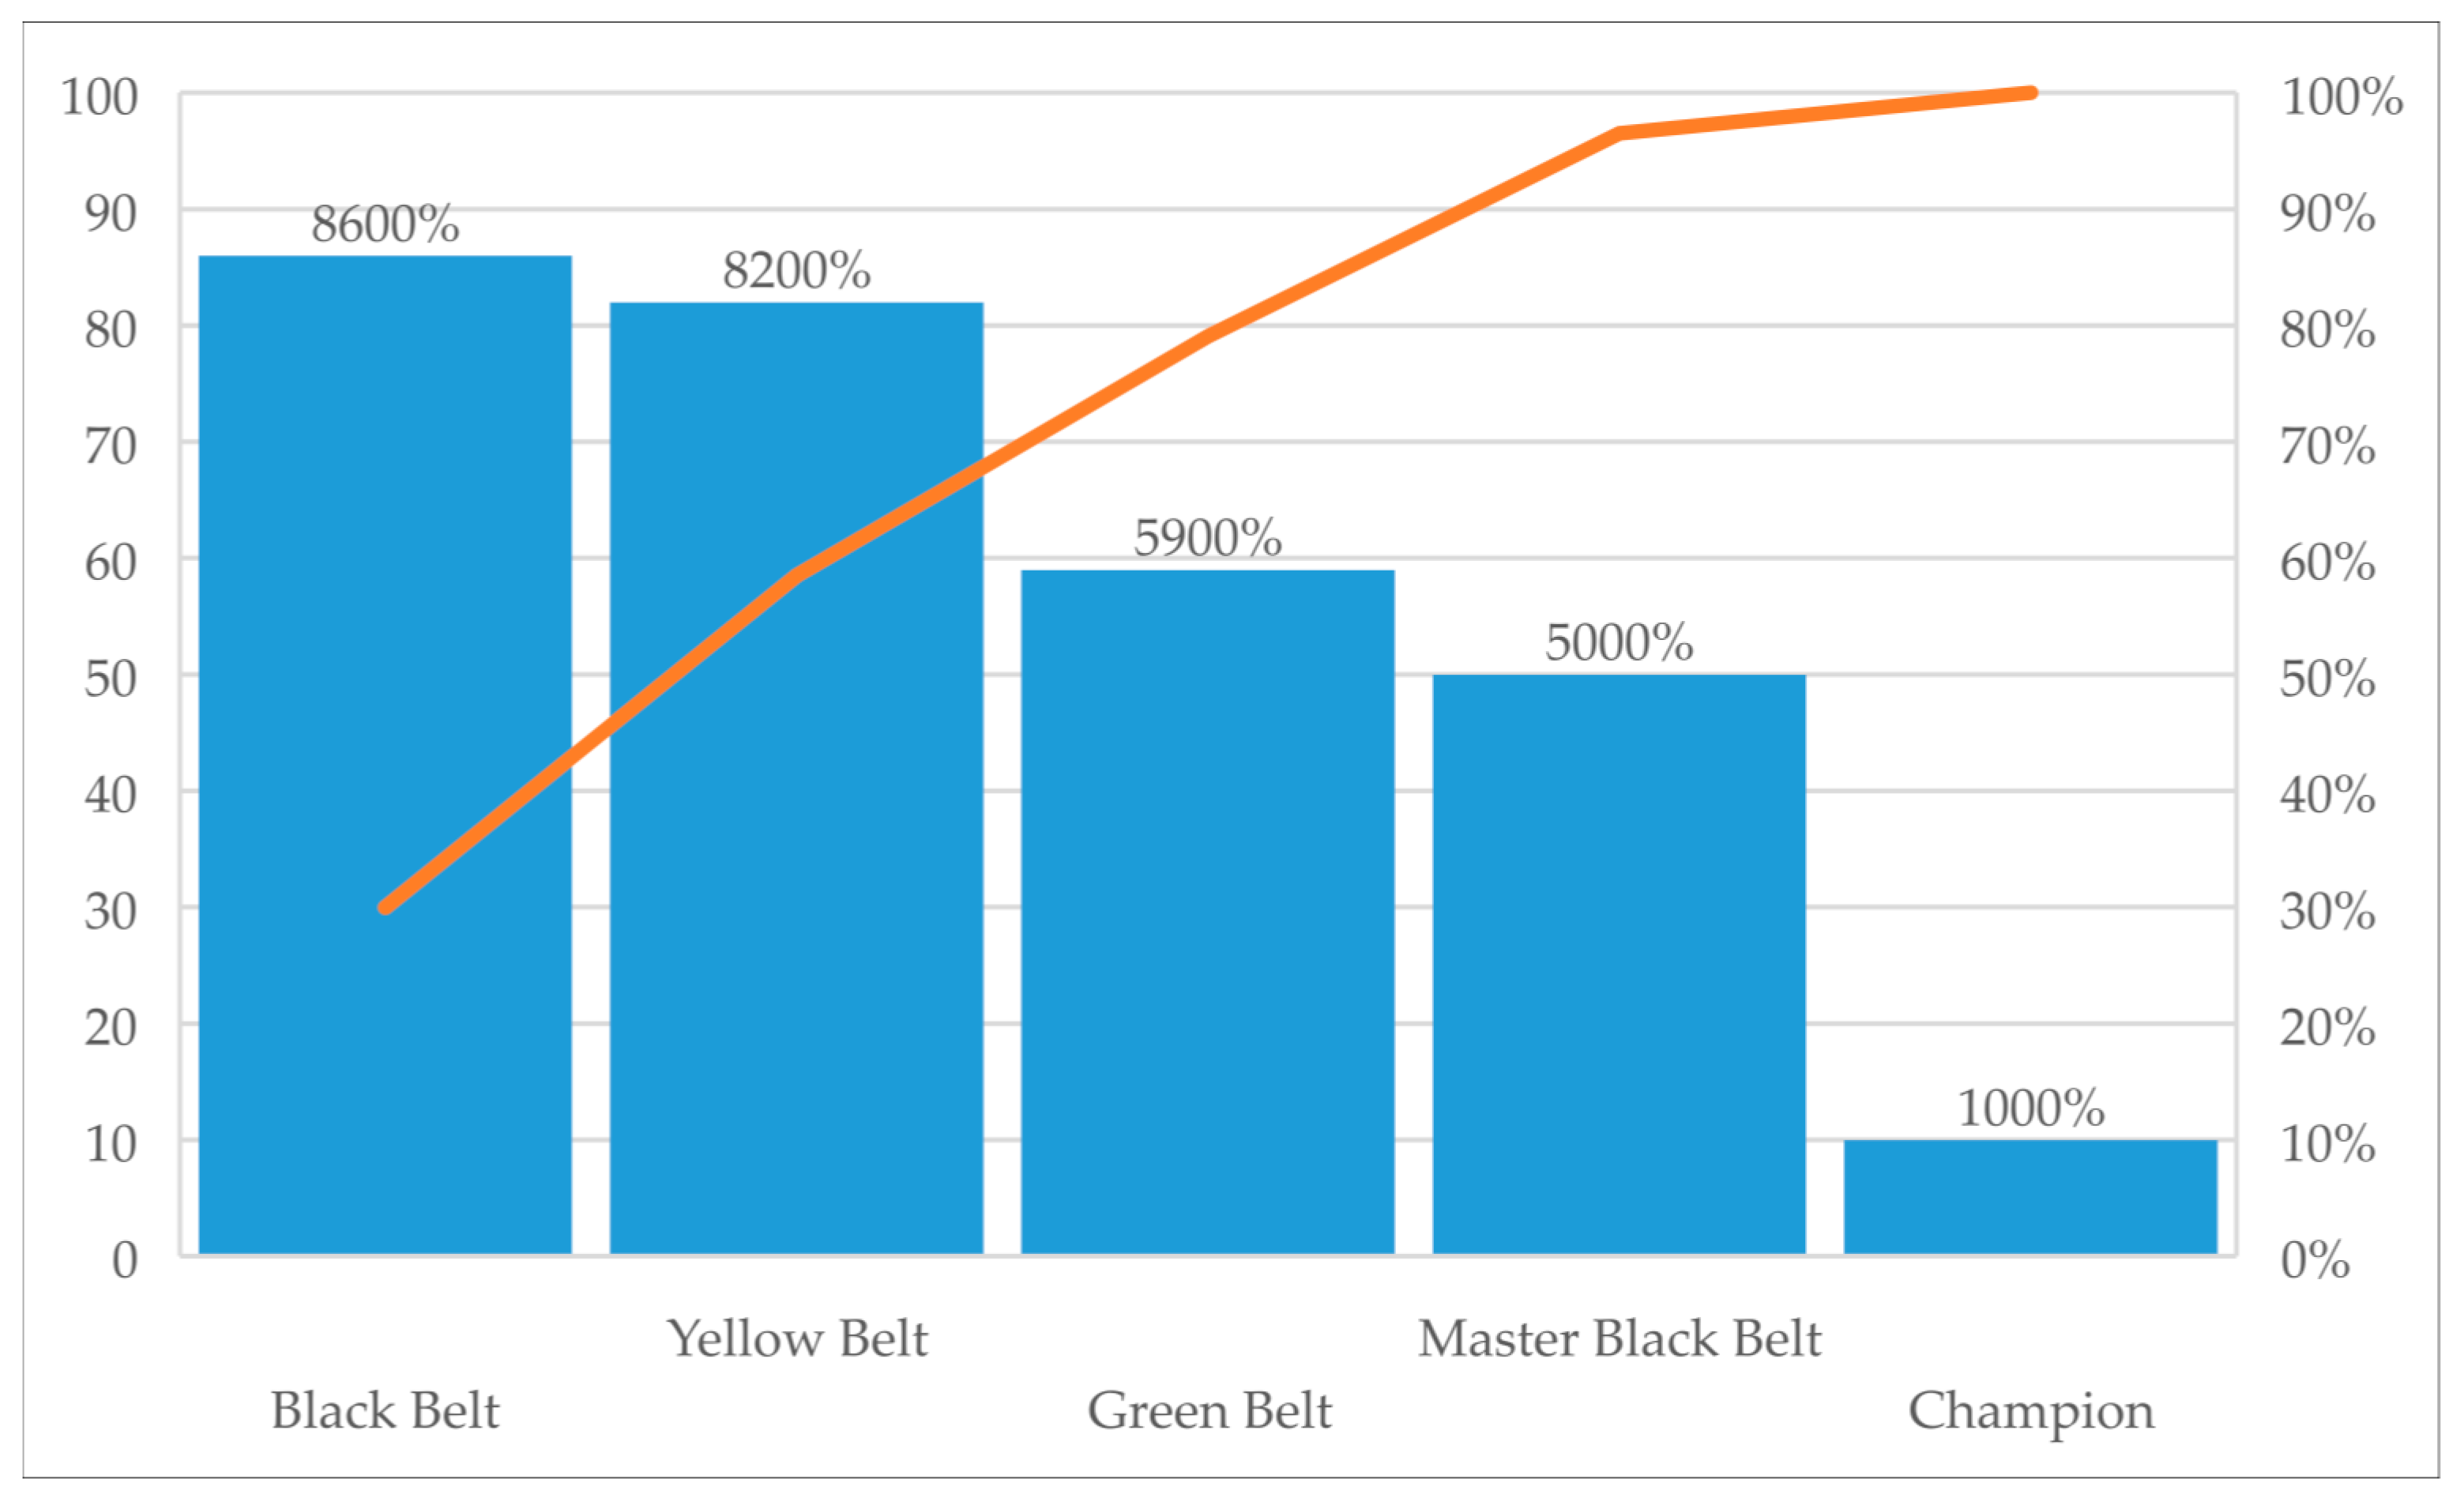
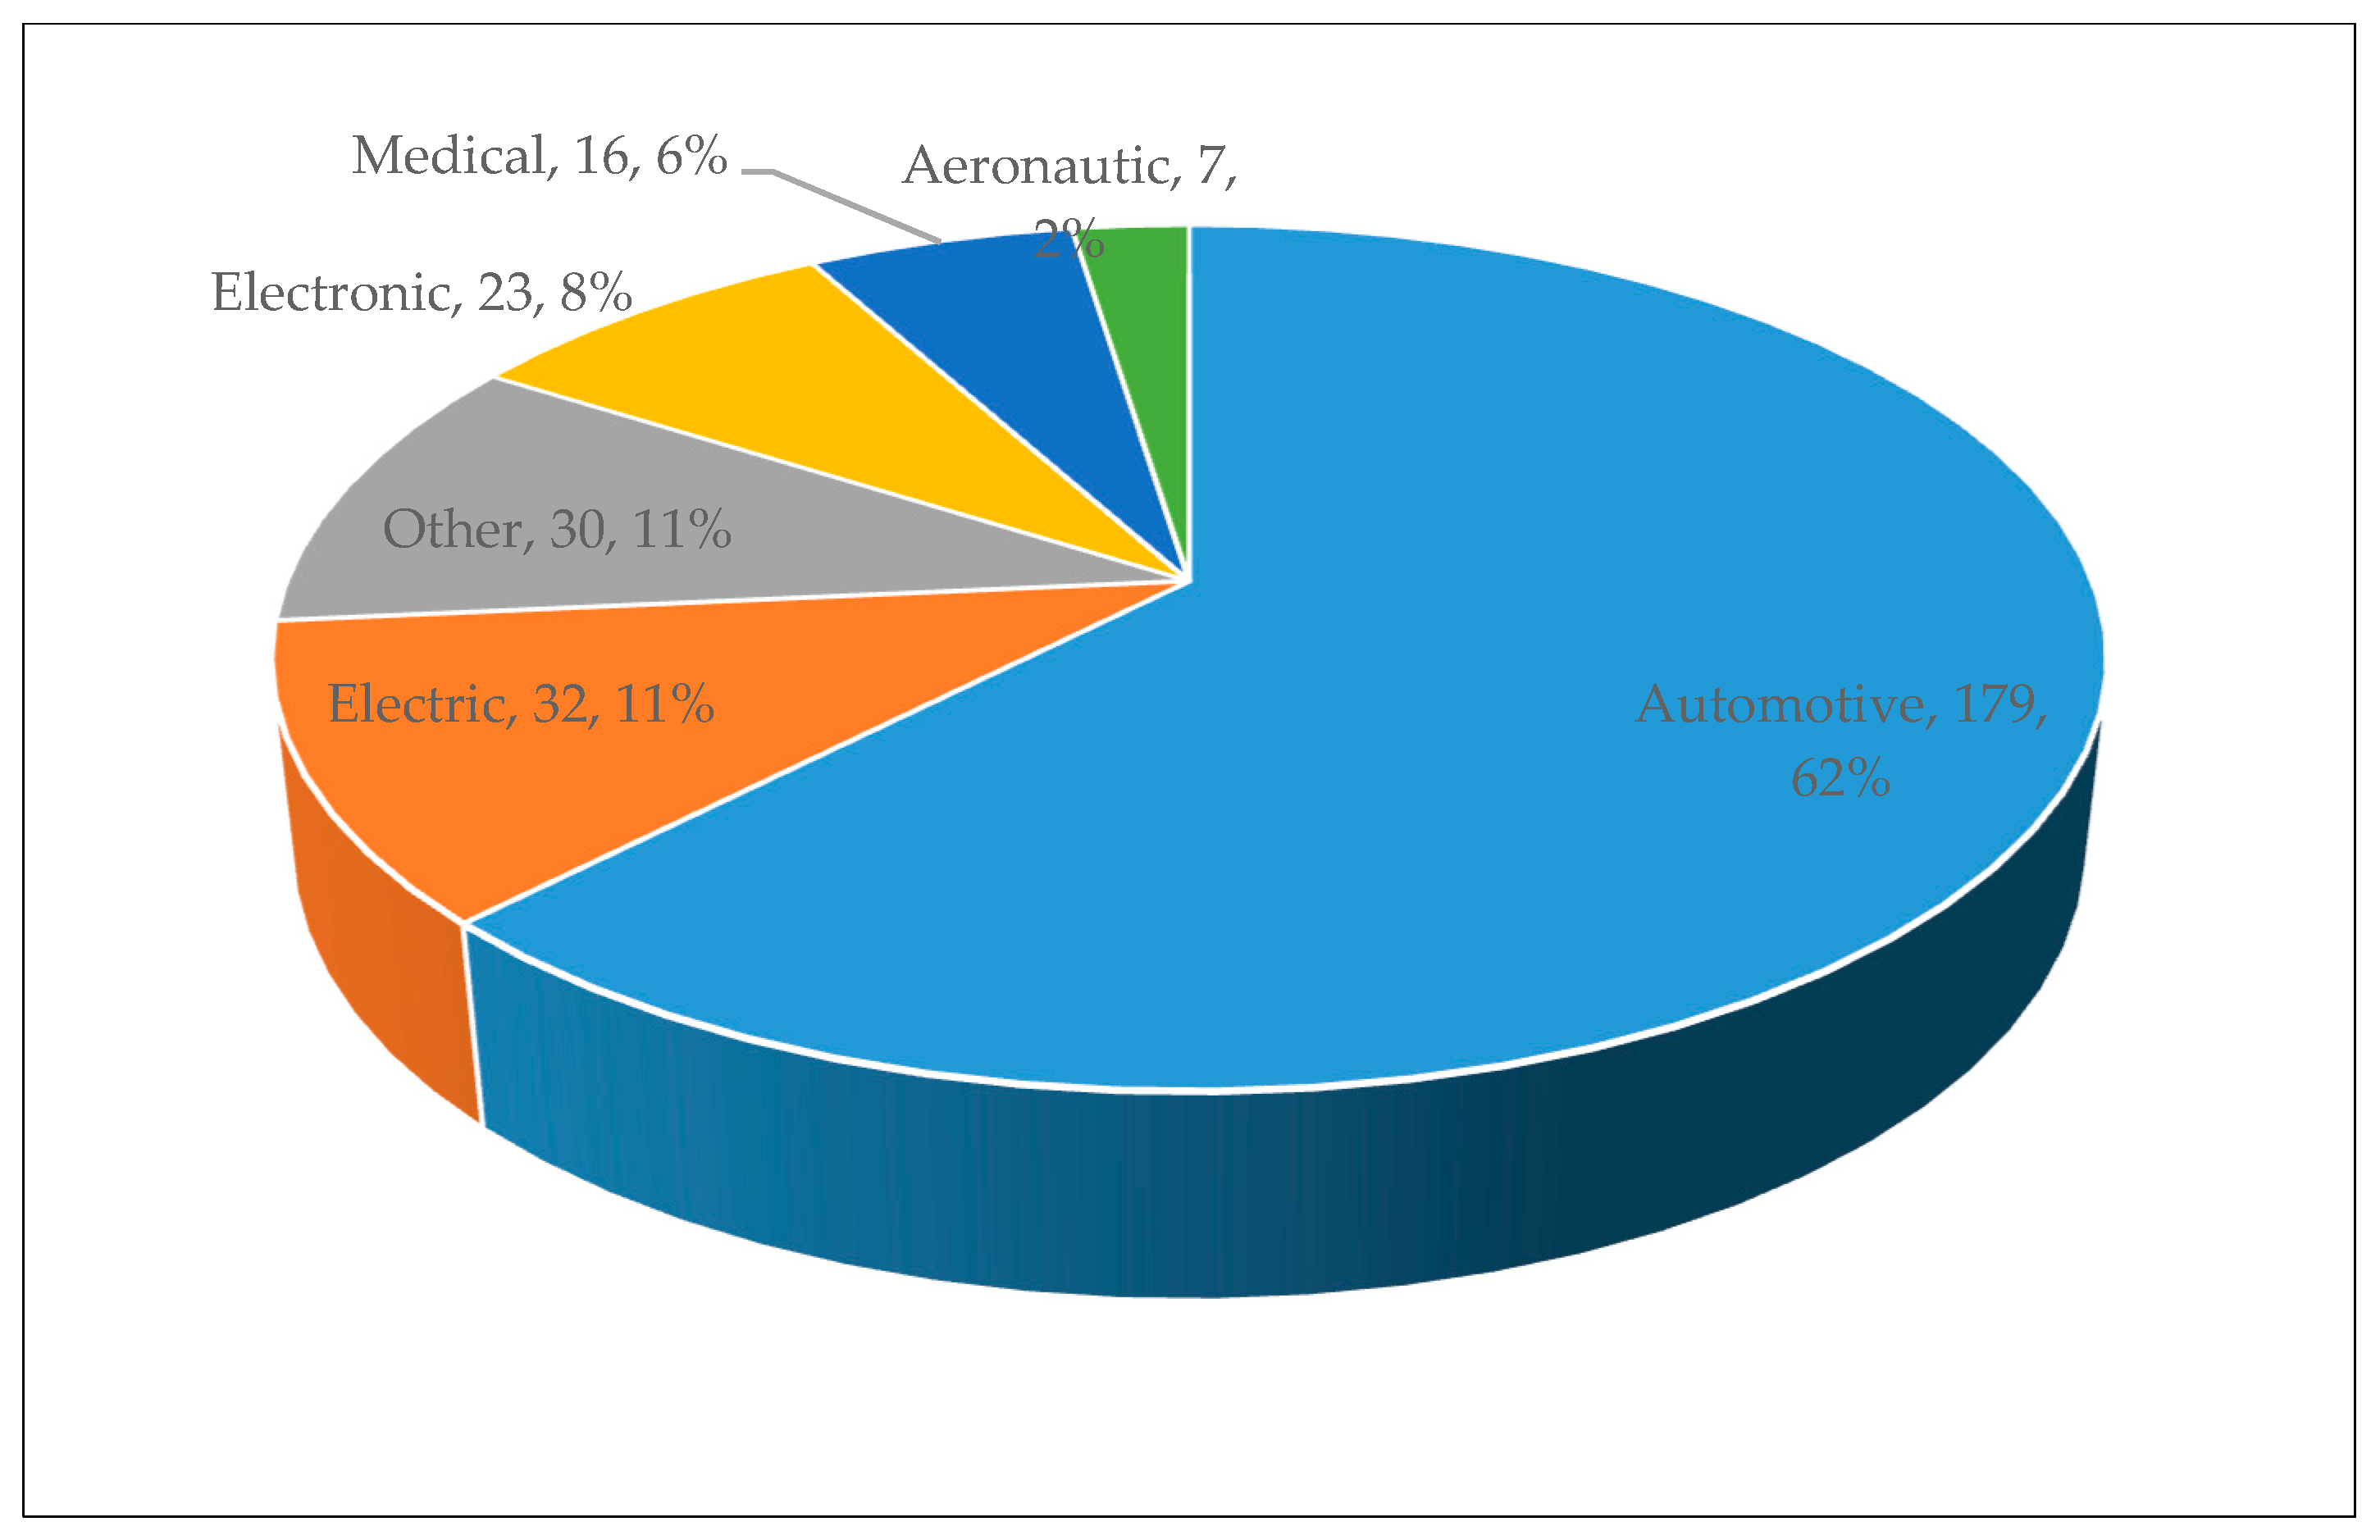
4.1. The Sample
4.2. Descriptive Analysis of the Sample
4.3. Data Validation
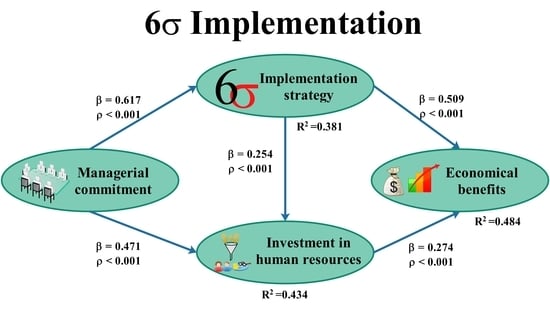
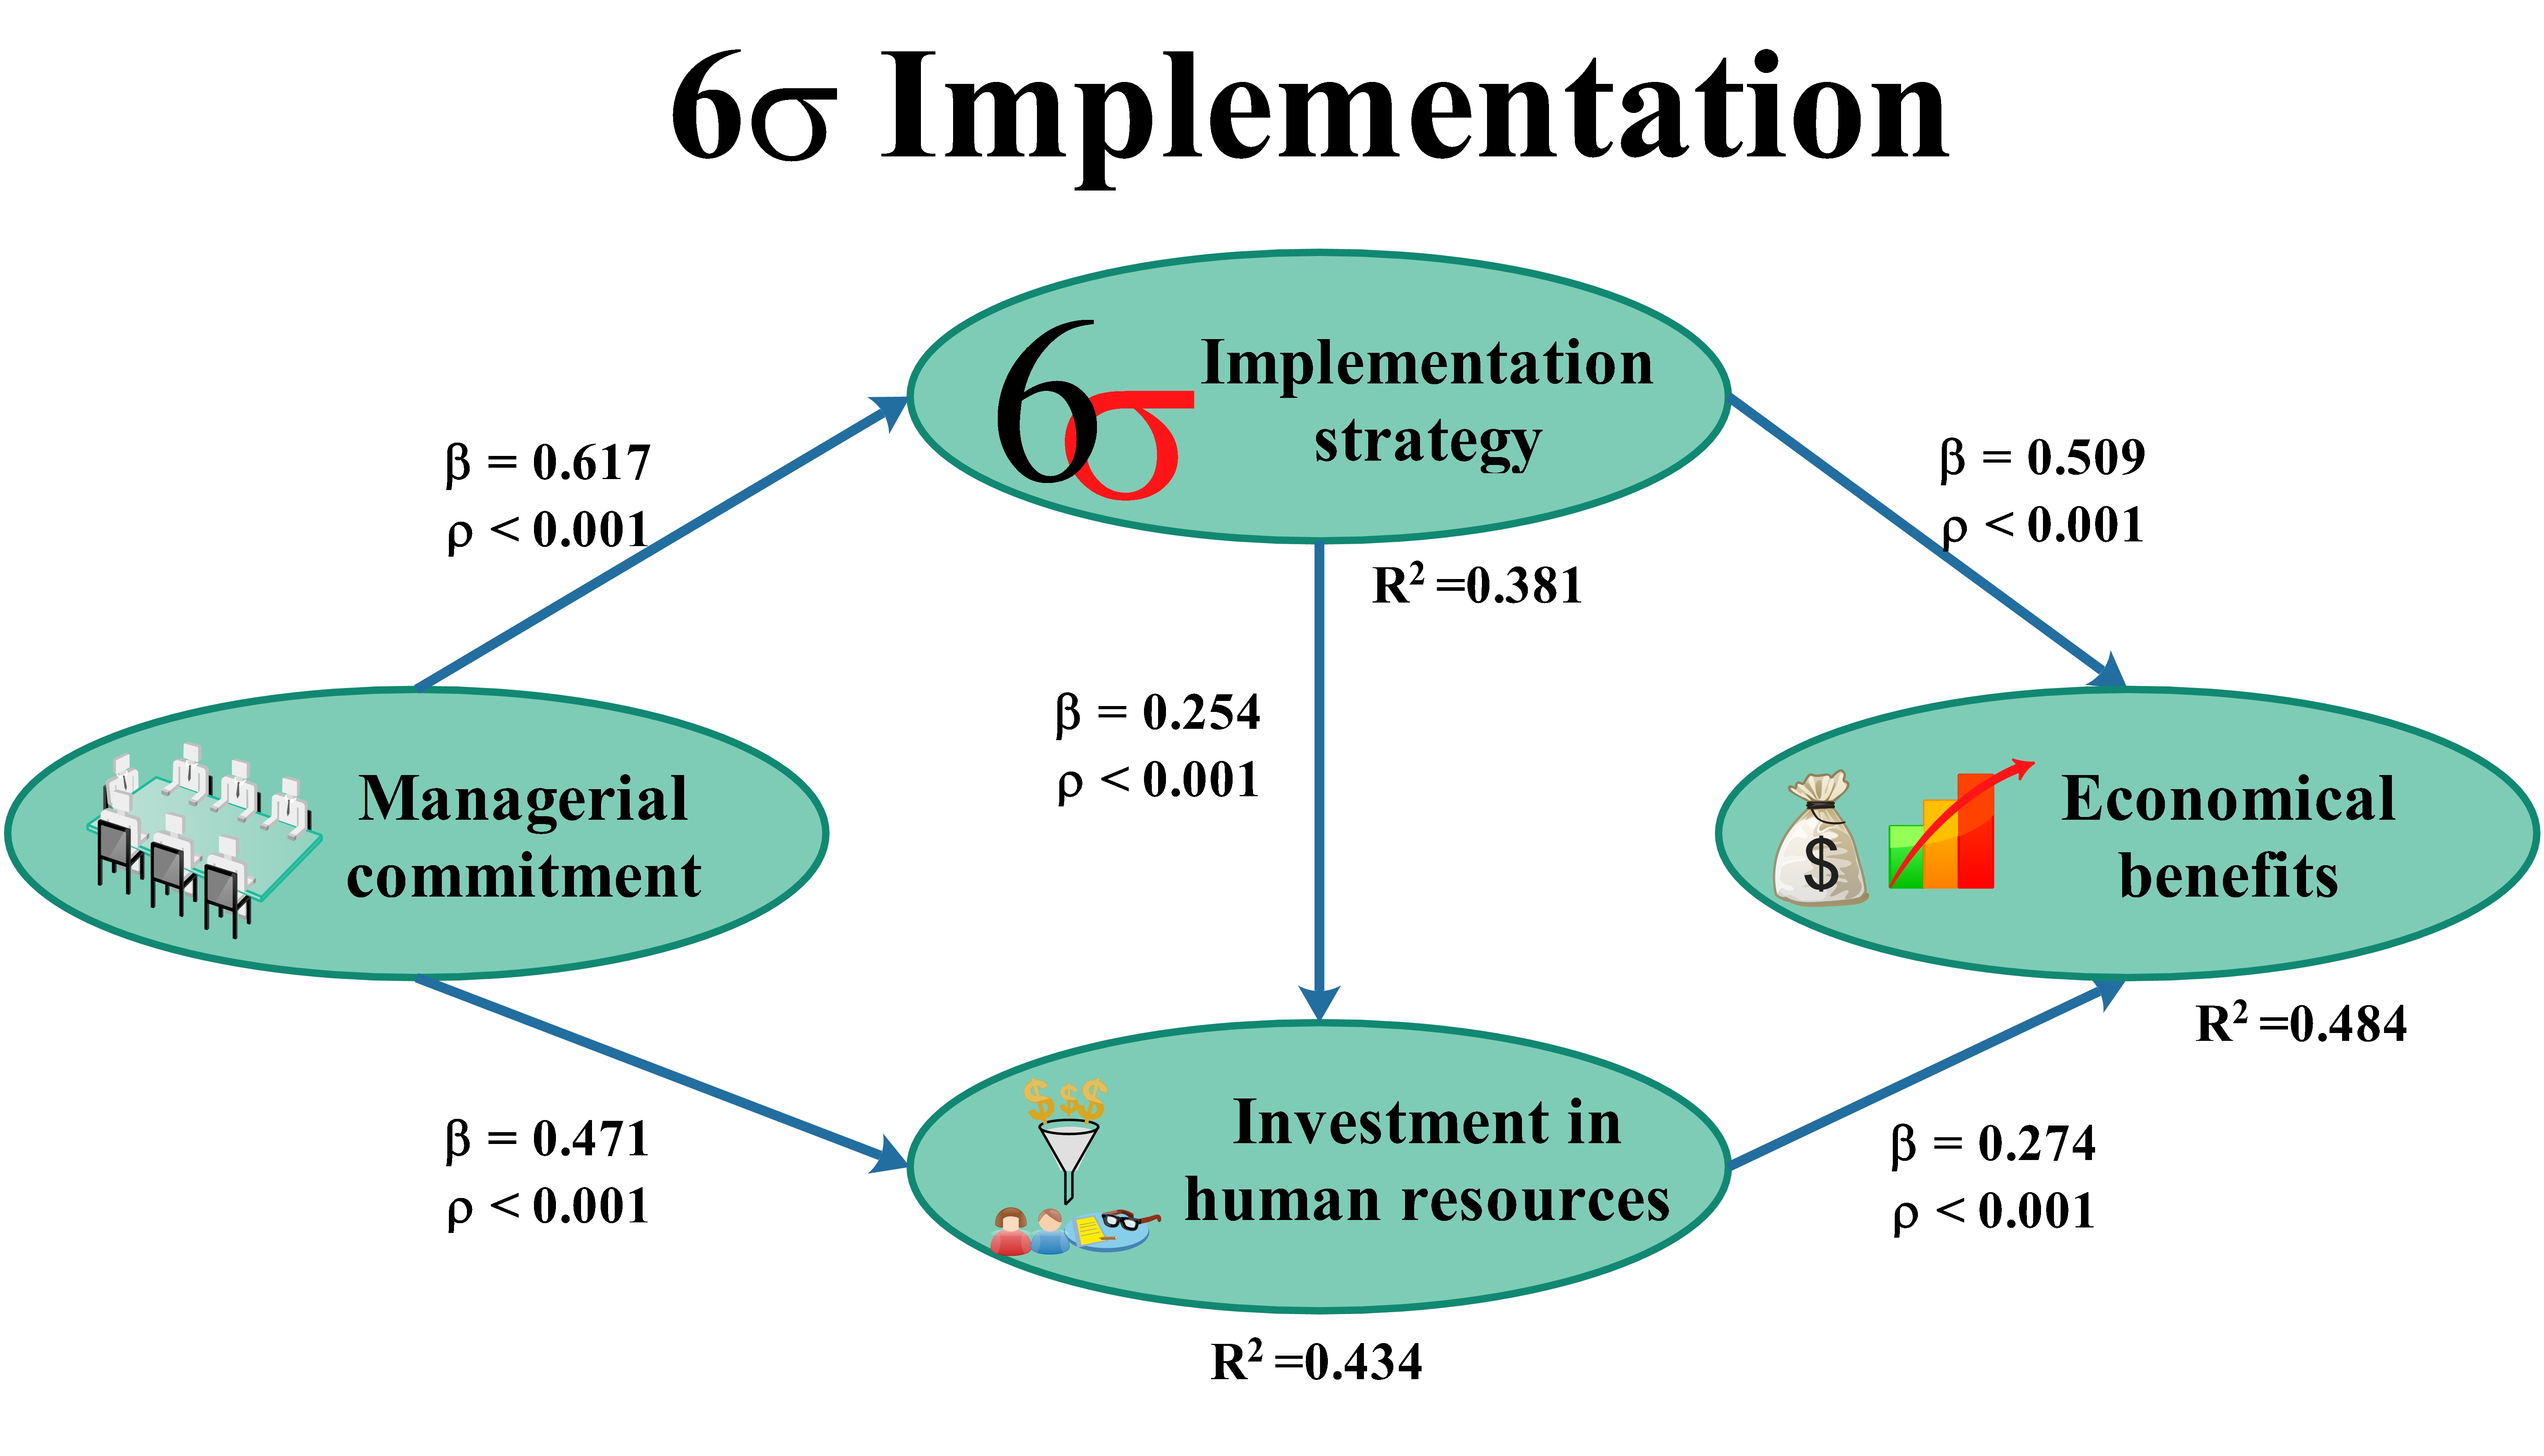
4.4. Structural Equation Model
- Average path coefficient (APC) = 0.425, p < 0.001
- Average R-squared (ARS) = 0.433, p < 0.001
- Average adjusted R-squared (AARS) = 0.430, p < 0.001
- Average block VIF (AVIF) = 1.514, acceptable if ≤5, ideally ≤3.3
- Average full collinearity VIF (AFVIF) = 1.974, acceptable if ≤5, ideally ≤3.3
- Tenenhaus GoF (GoF) = 0.565, small ≥ 0.1, medium ≥ 0.25, large ≥ 0.36
4.4.1. Direct Effects
4.4.2. Size of Effects
4.4.3. Sum of Indirect Effects
4.4.4. Total Effects
5. Discussion and Industrial Implications
6. Limitations and Future Research
Author Contributions
Funding
Acknowledgments
Conflicts of Interest
References
- Mustafa, Z.; Jamaluddin, Z. Six sigma critical success factors in manufacturing industries. AIP Conf. Proc. 2017, 1830, 1–8. [Google Scholar]
- Rizzuti, S.; de Napoli, L. An interactive robust design approach in product development. Int. J. Interact. Des. Manuf. 2018, 12, 677–688. [Google Scholar] [CrossRef]
- De-Felipe, D.; Benedito, E. A review of univariate and multivariate process capability indices. Int. J. Adv. Manuf. Technol. 2017, 92, 1687–1705. [Google Scholar] [CrossRef]
- Inal Tamer, C.; Goruroglu Ozturk, O.; Kibar, F.; Cetiner, S.; Matyar, S.; Daglioglu, G.; Yaman, A. Lean six sigma methodologies improve clinical laboratory efficiency and reduce turnaround times. J. Clin. Lab. Anal. 2018, 32, e22180. [Google Scholar] [CrossRef] [PubMed]
- Randell, E.W.; Short, G.; Lee, N.; Beresford, A.; Spencer, M.; Kennell, M.; Moores, Z.; Parry, D. Autoverification process improvement by six sigma approach: Clinical chemistry & immunoassay. Clin. Biochem. 2018, 55, 42–48. [Google Scholar] [PubMed]
- Smętkowska, M.; Mrugalska, B. Using six sigma dmaic to improve the quality of the production process: A case study. Procedia-Soc. Behav. Sci. 2018, 238, 590–596. [Google Scholar] [CrossRef]
- Cherrafi, A.; Elfezazi, S.; Govindan, K.; Garza-Reyes, J.A.; Benhida, K.; Mokhlis, A. A framework for the integration of green and lean six sigma for superior sustainability performance. Int. J. Prod. Res. 2017, 55, 4481–4515. [Google Scholar] [CrossRef]
- Zhu, Q.; Johnson, S.; Sarkis, J. Lean six sigma and environmental sustainability: A hospital perspective. Supply Chain Forum 2018, 19, 25–41. [Google Scholar] [CrossRef]
- Radziwill, N.M. A Six Sigma Approach to Sustainability: Continual Improvement for Social Responsibility. Qual. Manag. J. 2016, 23, 56. [Google Scholar] [CrossRef]
- Madhani, P.M. Six Sigma Deployment in Sales and Marketing: Enhancing Competitive Advantages. IUP J. Bus. Strategy 2017, 14, 40–63. [Google Scholar]
- Kwak, Y.H.; Anbari, F.T. Benefits, obstacles, and future of six sigma approach. Technovation 2006, 26, 708–715. [Google Scholar] [CrossRef]
- Montgomery Douglas, C. Why do lean six sigma projects sometimes fail? Qual. Reliabil. Eng. Int. 2016, 32, 1279. [Google Scholar] [CrossRef]
- Nourelfath, M.; Aldowaisan, T.; Hassan, J. Evaluating six sigma failure rate for inverse gaussian cycle times. Int. J. Prod. Res. 2016, 54, 6092–6101. [Google Scholar] [CrossRef]
- Chakravorty, S.S. Six Sigma failures: An escalation model. Oper. Manag. Res. 2009, 2, 44. [Google Scholar] [CrossRef]
- Coronado, R.B.; Antony, J. Critical success factors for the successful implementation of six sigma projects in organisations. TQM Mag. 2002, 14, 92–99. [Google Scholar] [CrossRef]
- Revere, L.; Kadipasaoglu, S.N.; Zalila, F. An empirical investigation into six sigma critical success factors. Int. J. Product. Qual. Manag. 2006, 1, 224–252. [Google Scholar] [CrossRef]
- Vest, J.R.; Gamm, L.D. A critical review of the research literature on six sigma, lean and studergroup’s hardwiring excellence in the United States: The need to demonstrate and communicate the effectiveness of transformation strategies in healthcare. Implement. Sci. 2009, 4, Art.35. [Google Scholar] [CrossRef] [PubMed]
- Chow Ann, T.; Moseley James, L. Comparisons of six sigma, lean, and human performance technology/performance improvement. Perform. Improv. 2017, 56, 6–13. [Google Scholar] [CrossRef]
- Brun, A. Critical success factors of six sigma implementations in italian companies. Int. J. Prod. Econ. 2011, 131, 158–164. [Google Scholar] [CrossRef]
- Desai, D.A.; Antony, J.; Patel, M.B. An assessment of the critical success factors for six sigma implementation in indian industries. Int. J. Product. Perform. Manag. 2012, 61, 426–444. [Google Scholar] [CrossRef]
- Habidin, N.F.; Yusof, S.R.M. Critical success factors of lean six sigma for the Malaysian automotive industry. Int. J. Lean Six Sigma 2013, 4, 60–82. [Google Scholar] [CrossRef]
- Chakraborty, A.; Chuan Tan, K. Case study analysis of six sigma implementation in service organisations. Bus. Process Manag. J. 2012, 18, 992–1019. [Google Scholar] [CrossRef]
- Ribeiro de Jesus, A.; Antony, J.; Lepikson, H.A.; Peixoto, A.L.A. Six sigma critical success factors in Brazilian industry. Int. J. Qual. Reliabil. Manag. 2016, 33, 702–723. [Google Scholar] [CrossRef]
- Cano, M.; Viza, E.; Kourouklis, A. Critical success factors for implementing continuous improvement approaches within public sector organisations. In Proceedings of the 20th Excellence in Services International Conference, Verona, Italy, 7–8 September 2017; pp. 131–146. [Google Scholar]
- Alhuraish, I.; Robledo, C.; Kobi, A. A comparative exploration of lean manufacturing and six sigma in terms of their critical success factors. J. Clean. Prod. 2017, 164, 325–337. [Google Scholar] [CrossRef]
- Psomas, E. The underlying factorial structure and significance of the six sigma difficulties and critical success factors. TQM J. 2016, 28, 530–546. [Google Scholar] [CrossRef]
- Marzagão, D.S.L.; Carvalho, M.M. Critical success factors for six sigma projects. Int. J. Project Manag. 2016, 34, 1505–1518. [Google Scholar] [CrossRef]
- Lande, M.; Shrivastava, R.L.; Seth, D. Critical success factors for lean six sigma in smes (small and medium enterprises). TQM J. 2016, 28, 613–635. [Google Scholar] [CrossRef]
- Kumar, M.; Khurshid, K.K.; Waddell, D. Status of quality management practices in manufacturing smes: A comparative study between Australia and the UK. Int. J. Prod. Res. 2014, 52, 6482–6495. [Google Scholar] [CrossRef]
- Fairul-Anwar, A.; Mohd Amran, M. Critical success factors of lean six sigma deployment: A current review. Int. J. Lean Six Sigma 2015, 6, 339–348. [Google Scholar]
- Antony, J.; Jiju Antony, F.; Kumar, M.; Rae Cho, B. Six sigma in service organisations: Benefits, challenges and difficulties, common myths, empirical observations and success factors. Int. J. Qual. Reliabil. Manag. 2007, 24, 294–311. [Google Scholar] [CrossRef]
- Raman, R.S.; Basavaraj, Y.; Prakash, A.; Garg, A. Analysis of six sigma methodology in exporting manufacturing organizations and benefits derived: A review. In Proceedings of the 2017 3rd International Conference on Computational Intelligence & Communication Technology (CICT), Ghaziabad, India, 9–10 February 2017; pp. 1–5. [Google Scholar]
- García-Alcaraz, J.; Avelar-Sosa, L.; Latorre-Biel, J.; Jiménez-Macías, E.; Alor-Hernández, G. Role of human knowledge and communication on operational benefits gained from six sigma. Sustainability 2017, 9, 1721. [Google Scholar] [CrossRef]
- Prasad, V.M. Human resource factors for six sigma success. Rev. Manag. Econ. Eng. 2011, 10, 91–105. [Google Scholar]
- Laureani, A.; Antony, J. Leadership—A critical success factor for the effective implementation of lean six sigma. Total Qual. Manag. Bus. Excell. 2018, 29, 502–523. [Google Scholar] [CrossRef]
- Tata, R.M.; Jones, G.D. Six sigma culture as a management principle. Transfusion 2011, 51, 1604–1608. [Google Scholar] [CrossRef] [PubMed]
- Harold, K. Six sigma and the project management office. In Project Management Best Practices; John Wiley & Sons, Inc.: Hoboken, NJ, USA, 2014; pp. 565–580. [Google Scholar]
- Johannsen, F.; Leist, S.; Zellner, G. Six sigma as a business process management method in services: Analysis of the key application problems. Inf. Syst. e-Bus. Manag. 2011, 9, 307–332. [Google Scholar] [CrossRef]
- Sabet, E.; Adams, E.; Yazdani, B. Quality management in heavy duty manufacturing industry: Tqm vs. Six sigma. Total Qual. Manag. Bus. Excell. 2016, 27, 215–225. [Google Scholar] [CrossRef]
- Harry, M.J. Six sigma: A breakthrough strategy for profitability. Qual. Prog. 1998, 31, 60–64. [Google Scholar]
- Drohomeretski, E.; Gouvea da Costa, S.E.; Pinheiro de Lima, E.; Garbuio, P.A.D.R. Lean, six sigma and lean six sigma: An analysis based on operations strategy. Int. J. Prod. Res. 2014, 52, 804–824. [Google Scholar] [CrossRef]
- Fatemi, S.; Franchetti, M.J. An application of sustainable lean and green strategy with a six sigma approach on a manufacturing system. Int. J. Six Sigma Compet. Advant. 2016, 10, 62–75. [Google Scholar] [CrossRef]
- Andersson, R.; Hilletofth, P.; Manfredsson, P.; Hilmola, O.-P. Lean six sigma strategy in telecom manufacturing. Ind. Manag. Data Syst. 2014, 114, 904–921. [Google Scholar] [CrossRef]
- Kumar, M.; Antony, J.; Antony, F.J.; Madu, C.N. Winning customer loyalty in an automotive company through six sigma: A case study. Qual. Reliabil. Eng. Int. 2007, 23, 849–866. [Google Scholar] [CrossRef]
- Niemes, J. Taking sales success to new heights with six sigma. Natl. Product. Rev. 1999, 18, 37–41. [Google Scholar] [CrossRef]
- De Jesus, A.R.; Antony, J.; Lepikson, H.A.; Teixeira Cavalcante, C.A.M. Key observations from a survey about six sigma implementation in brazil. Int. J. Product. Perform. Manag. 2015, 64, 94–111. [Google Scholar] [CrossRef]
- Douglas, A.; Douglas, J.; Ochieng, J. Lean six sigma implementation in east Africa: Findings from a pilot study. TQM J. 2015, 27, 772–780. [Google Scholar] [CrossRef]
- Kavčič, K.; Gošnik, D. Lean six sigma education in manufacturing companies: The case of transitioning markets. Kybernetes 2016, 45, 1421–1436. [Google Scholar] [CrossRef]
- Laureani, A.; Antony, J. Leadership characteristics for lean six sigma. Total Qual. Manag. Bus. Excell. 2017, 28, 405–426. [Google Scholar] [CrossRef]
- Arumugam, V.; Antony, J.; Linderman, K. The influence of challenging goals and structured method on six sigma project performance: A mediated moderation analysis. Eur. J. Oper. Res. 2016, 254, 202–213. [Google Scholar] [CrossRef]
- Zu, X.; Robbins, T.L.; Fredendall, L.D. Mapping the critical links between organizational culture and tqm/six sigma practices. Int. J. Prod. Econ. 2010, 123, 86–106. [Google Scholar] [CrossRef]
- Chen, S.; Fan, S.; Xiong, J.; Zhang, W. The design of JMP/SAP based six sigma management system and its application in smed. Procedia Eng. 2017, 174, 416–424. [Google Scholar] [CrossRef]
- De Freitas, J.G.; Costa, H.G.; Ferraz, F.T. Impacts of lean six sigma over organizational sustainability: A survey study. J. Clean. Prod. 2017, 156, 262–275. [Google Scholar] [CrossRef]
- Parast, M.M. The effect of six sigma projects on innovation and firm performance. Int. J. Project Manag. 2011, 29, 45–55. [Google Scholar] [CrossRef]
- Swink, M.; Jacobs, B.W. Six sigma adoption: Operating performance impacts and contextual drivers of success. J. Oper. Manag. 2012, 30, 437–453. [Google Scholar] [CrossRef]
- Shafer, S.M.; Moeller, S.B. The effects of six sigma on corporate performance: An empirical investigation. J. Oper. Manag. 2012, 30, 521–532. [Google Scholar] [CrossRef]
- Ertürk, M.; Tuerdi, M.; Wujiabudula, A. The effects of six sigma approach on business performance: A study of white goods (home appliances) sector in turkey. Procedia-Soc. Behav. Sci. 2016, 229, 444–452. [Google Scholar] [CrossRef]
- Moosa, K.; Sajid, A. Critical analysis of six sigma implementation. Total Qual. Manag. Bus. Excell. 2010, 21, 745–759. [Google Scholar] [CrossRef]
- Boon Sin, A.; Zailani, S.; Iranmanesh, M.; Ramayah, T. Structural equation modelling on knowledge creation in six sigma dmaic project and its impact on organizational performance. Int. J. Prod. Econ. 2015, 168, 105–117. [Google Scholar] [CrossRef]
- Louhaichi, M.; Yigezu, Y.A.; Werner, J.; Dashtseren, L.; El-Shater, T.; Ahmed, M. Financial incentives: Possible options for sustainable rangeland management? J. Environ. Manag. 2016, 180, 493–503. [Google Scholar] [CrossRef] [PubMed]
- Anand, G.; Ward, P.T.; Tatikonda, M.V. Role of explicit and tacit knowledge in six sigma projects: An empirical examination of differential project success. J. Oper. Manag. 2010, 28, 303–315. [Google Scholar] [CrossRef]
- McCarty, T.; Jordan, M.; Probst, D. Six Sigma for Sustainability: How Organizations Design and Deploy Winning Environmental Programs; McGraw-Hill: New York, NY, USA, 2011. [Google Scholar]
- Cherrafi, A.; Elfezazi, S.; Chiarini, A.; Mokhlis, A.; Benhida, K. The integration of lean manufacturing, six sigma and sustainability: A literature review and future research directions for developing a specific model. J. Clean. Prod. 2016, 139, 828–846. [Google Scholar] [CrossRef]
- Tan Owee, K.; Tan Su, Y.; Amran, R.; Choi Sang, L. Lean six sigma sustainability framework: A case study on an automotive company. Asian J. Sci. Res. 2016, 9, 279–283. [Google Scholar]
- Jami, A.A.N.; Searcy, C.; Jenab, K. Applying the principles of six sigma to environmental management systems. Int. J. Appl. Decis. Sci. 2012, 5, 215–232. [Google Scholar] [CrossRef]
- Habidin, N.F.; Yusof, S.M. Relationship between lean six sigma, environmental management systems, and organizational performance in the Malaysian automotive industry. Int. J. Automot. Technol. 2012, 13, 1119–1125. [Google Scholar] [CrossRef]
- Ehnert, I. Sustainability and human resource management. In The Future of Employment Relations; Palgrave Macmillan: Basingstoke, UK, 2011; pp. 215–237. [Google Scholar]
- Daily, B.F.; Huang, S.-C. Achieving sustainability through attention to human resource factors in environmental management. Int. J. Oper. Prod. Manag. 2001, 21, 1539–1552. [Google Scholar] [CrossRef]
- IBM Corp. IBM SPSS Statistics for Windows, version 24.0.; IBM Corp: Armonk, NY, USA, 2016. [Google Scholar]
- Yaşlıoğlu, M.M.; Şap, Ö.; Toplu, D. An investigation of the characteristics of learning organizations in turkish companies: Scale validation. Procedia-Soc. Behav. Sci. 2014, 150, 726–734. [Google Scholar] [CrossRef]
- Hair, J.F.; Ringle, C.M.; Sarstedt, M. Editorial-partial least squares structural equation modeling: Rigorous applications, better results and higher acceptance. Long Range Plan. 2013, 46, 1–12. [Google Scholar] [CrossRef]
- Kock, N. Warppls 5.0 User Manual; ScriptWarp Systems: Laredo, TX, USA, 2015. [Google Scholar]
- ScripWarp Systems. Warppls v.5. Software; ScripWarp Systems: Laredo, TX, USA, 2015. [Google Scholar]
- García-Alcaraz, J.L.; Maldonado-Macías, A.A.; Hernandez, G.A.; Jiménez-Macías, E.; Muro, J.C.S.D.; Blanco-Fernández, J. Impact of human factor on flexibility and supply chain agility of la rioja wineries. Eur. J. Ind. Eng. 2017, 11, 663–682. [Google Scholar] [CrossRef]
- Moqbel, M.; Kock, N. Unveiling the dark side of social networking sites: Personal and work-related consequences of social networking site addiction. Inf. Manag. 2018, 55, 109–119. [Google Scholar] [CrossRef]
- Coleman, S. Six sigma: An opportunity for statistics and for statisticians. Significance 2008, 5, 94–96. [Google Scholar] [CrossRef]
- Sabry, A. Factors critical to the success of six-sigma quality program and their influence on performance indicators in some of lebanese hospitals. Arab Econ. Bus. J. 2014, 9, 93–114. [Google Scholar] [CrossRef]


| Certification | Aeronautic | Electric | Automotive | Electronic | Medical | Other |
|---|---|---|---|---|---|---|
| Champion | 0 | 2 | 6 | 0 | 0 | 2 |
| Master Black Belt | 2 | 5 | 33 | 5 | 0 | 5 |
| Black Belt | 3 | 16 | 45 | 9 | 4 | 9 |
| Green Belt | 1 | 5 | 33 | 2 | 8 | 10 |
| Yellow Belt | 1 | 4 | 62 | 7 | 4 | 4 |
| Acronym | Item | Median | IR |
|---|---|---|---|
| MC3 | Management encourages interdepartmental cooperation in planning six sigma projects | 3.59 | 1.62 |
| MC5 | Management assigns the appropriate personnel for each project | 3.53 | 1.6 |
| MC4 | Management requests reports on the progress of projects in each department | 3.52 | 1.58 |
| MC2 | Management encourages knowledge transfer across different departments and the organisational structure | 3.44 | 1.41 |
| MC1 | Management regularly reviews the progress of six sigma projects | 3.24 | 1.14 |
| IS5 | Department heads review clients’ demands and complaints before creating an six sigma project | 3.99 | 2.18 |
| IS4 | Improvement teams are aware of clients’ requirements | 3.95 | 2.25 |
| IS1 | There is an organisational structure that supports six sigma including Black Belts (BBs), Green Belts (GBs) and Yellow Belts (YBs) | 3.79 | 2.01 |
| IS2 | Meetings are held between six sigma project leaders and project team members to enable monitoring | 3.73 | 1.94 |
| IS3 | Six Sigma projects are related to clients’ demands | 3.72 | 1.81 |
| ET4 | The workload is adjusted to allow time for education and training | 3.67 | 1.84 |
| ET3 | Black Belts (BBs) and Green Belts (GBs) are involved in the analysis of problems associated with the six sigma project | 3.66 | 1.81 |
| ET5 | Materials and software are provided for analysing the information | 3.62 | 1.67 |
| ET2 | Black belts (BBs) and Green Belts (GBs) are assigned to advise on six sigma projects | 3.42 | 1.5 |
| ER1 | There is a regular training schedule | 3.24 | 1.16 |
| IN3 | Project outcomes are considered in career performance and impact on the income of project members | 3.44 | 1.52 |
| IN2 | Regular awards are presented for the best six sigma projects | 3.26 | 1.14 |
| IN4 | The abandonment of an six sigma project affects promotion to higher positions | 3.14 | 1.05 |
| IN1 | Award ceremonies are held for certification as Black belts (BBs) and Green Belts (GBs), etc. | 3.12 | 0.95 |
| IN5 | The outcomes of a six sigma project affect annual bonuses or salary increases at year end | 3.06 | 0.78 |
| ECB1 | There are savings in production costs | 3.99 | 2.29 |
| ECB5 | There is reduced wastage | 3.99 | 2.34 |
| ECB2 | A competitive advantage is created for the company | 3.91 | 2.3 |
| ECB4 | There are increased sales | 3.87 | 2.12 |
| ECB3 | There are increased returns on investment | 3.81 | 2.08 |
| Index | Managerial commitment | Implementation strategy | Economical benefits | Investment in human resources |
|---|---|---|---|---|
| R2-Squared | 0.381 | 0.484 | 0.434 | |
| Adjusted R2-Squared | 0.379 | 0.481 | 0.430 | |
| Compose reliability | 0.919 | 0.919 | 0.923 | 0.920 |
| Cronbach’s alpha | 0.890 | 0.890 | 0.896 | 0.826 |
| Average variance extracted | 0.695 | 0.695 | 0.706 | 0.852 |
| Variance inflation index | 2.047 | 2.071 | 1.990 | 1.790 |
| Q2-Squared | 0.382 | 0.486 | 0.436 |
| To | From | |
|---|---|---|
| Managerial commitment | Implementation strategy | |
| Economical benefits | β = 0.486 (p < 0.001) ES = 0.282 | β = 0.069 (p < 0.001) ES = 0.046 |
| Investment in human resources | β = 0.157 (p < 0.001) ES = 0.098 | |
| To | From | ||
|---|---|---|---|
| Managerial commitment | Implementation strategy | Investment in human resources | |
| Economical benefits | β = 0.617 (p < 0.001) ES = 0.381 | ||
| Investment in human resources | β = 0.486 (p < 0.001) ES = 0.282 | β = 0.578 (p < 0.001) ES = 0.380 | β = 0.274 (p < 0.001) ES = 0.150 |
| Investment in human resources | β = 0.627 (p < 0.001) ES = 0.394 | β = 0.254 (p < 0.001) ES = 0.138 | |
© 2018 by the authors. Licensee MDPI, Basel, Switzerland. This article is an open access article distributed under the terms and conditions of the Creative Commons Attribution (CC BY) license (http://creativecommons.org/licenses/by/4.0/).
Share and Cite
García-Alcaraz, J.L.; Alor-Hernández, G.; Sánchez-Ramírez, C.; Jiménez-Macías, E.; Blanco-Fernández, J.; Latorre-Biel, J.I. Mediating Role of the Six Sigma Implementation Strategy and Investment in Human Resources in Economic Success and Sustainability. Sustainability 2018, 10, 1828. https://doi.org/10.3390/su10061828
García-Alcaraz JL, Alor-Hernández G, Sánchez-Ramírez C, Jiménez-Macías E, Blanco-Fernández J, Latorre-Biel JI. Mediating Role of the Six Sigma Implementation Strategy and Investment in Human Resources in Economic Success and Sustainability. Sustainability. 2018; 10(6):1828. https://doi.org/10.3390/su10061828
Chicago/Turabian StyleGarcía-Alcaraz, Jorge Luis, Giner Alor-Hernández, Cuauhtémoc Sánchez-Ramírez, Emilio Jiménez-Macías, Julio Blanco-Fernández, and Juan I. Latorre-Biel. 2018. "Mediating Role of the Six Sigma Implementation Strategy and Investment in Human Resources in Economic Success and Sustainability" Sustainability 10, no. 6: 1828. https://doi.org/10.3390/su10061828
APA StyleGarcía-Alcaraz, J. L., Alor-Hernández, G., Sánchez-Ramírez, C., Jiménez-Macías, E., Blanco-Fernández, J., & Latorre-Biel, J. I. (2018). Mediating Role of the Six Sigma Implementation Strategy and Investment in Human Resources in Economic Success and Sustainability. Sustainability, 10(6), 1828. https://doi.org/10.3390/su10061828