Article

Mediating Role of the Six Sigma Implementation Strategy and Investment in Human Resources in Economic Success and Sustainability

by
Jorge Luis García-Alcaraz
1,*,
Giner Alor-Hernández
2,
Cuauhtémoc Sánchez-Ramírez
2,
Emilio Jiménez-Macías
3,
Julio Blanco-Fernández
4 and
Juan I. Latorre-Biel
5
1
Department of Industrial Engineering and Manufacturing, Universidad Autónoma de, Ciudad Juárez, Chihuahua 32310, Mexico
2
Division of Graduate Studies and Research, Instituto Tecnológico de Orizaba, Orizaba 94320, Mexico
3
Department of Electric Engineering, Universidad de La Rioja, 26004 Logroño, La Rioja, Spain
4
Department of Mechanical Engineering, Universidad de La Rioja, 26004 Logroño, La Rioja, Spain
5
Department of Mechanical, Energy and Materials Engineering, Universidad de Navarra, 31006 Pamplona, Spain
*
Author to whom correspondence should be addressed.
Sustainability 2018, 10(6), 1828; https://doi.org/10.3390/su10061828
Submission received: 26 April 2018 / Revised: 20 May 2018 / Accepted: 29 May 2018 / Published: 1 June 2018
(This article belongs to the Special Issue Quality Management and Sustainable Development)

Abstract

:
Six Sigma is a methodology widely used in manufacturing production to guarantee quality and several factors facilitate its success. This paper presents a structural equations model to identify the relationships between managerial commitment, Six Sigma implementation strategy, investments in human resources and the economic benefits obtained; and five hypotheses are proposed. These variables are also related to sustainability, especially human resources, a paradigm very combinable with Six Sigma. The model is evaluated using partial least squares and information obtained from 301 Mexican manufacturing companies from different industrial sectors. The results indicate that managerial commitment is the basis for Six Sigma success, but requires an adequate implementation strategy focused on customers and their needs, which must integrate an investment plan in human resources that is focused on training and teamwork. In addition, managers must have a reward program that encourages motivation and recognizes the achievements of the human resources involved.

Graphical Abstract

1. Introduction

Six Sigma (SS) is a methodology focused on the improvement of manufacturing processes, where product quality is the response variable for all preceding activities. The aim of SS is to produce no more than 3.4 defects per million opportunities, making it an appealing proposition for production managers [1,2]. Although its 1980s origins might suggest that SS is an outdated methodology, quality has always been a requirement in companies’ products and services, and its usage can still offer effective quality assurance for clients and according to de-Felipe and Benedito [3], SS is still a methodology worldwide used for support quality and recent studies in industrial and services sector prove it; as for example, Inal Tamer et al. [4] report how SS improve clinical laboratory efficiency, Randell et al. [5] report how SS improve the autoverification process in clinical chemistry and immunoassay, Smętkowska and Mrugalska [6] report a case study for improving the quality in a production process.
Likewise, it is observed that SS is a production philosophy that has remained at the forefront because it can be linked to aspects of vital importance to the company, such as sustainability, currently there are reports that indicate it; for example, Cherrafi et al. [7] propose a framework for integrating green production processes with SS, Zhu et al. [8] in their research are linking SS to environmental sustainability in a hospital, Radziwill [9] proposed SS as a tool that supports sustainability and finally, Cherrafi et al. [10] conduct a literature review that links lean manufacturing, SS and sustainability, and argue the need to generate models that support those relationships.
There are now many companies established in Europe and America reporting Economical benefits following the implementation of SS. While benefits had already been seen by Japanese companies, the American companies were the first to disseminate their results, resulting in a rapid uptake of SS by other companies [10]. It is widely considered that Motorola was the first company to report the successful implementation of SS, and this was followed by other industries, such as IBM, AlliedSignal, General Electric, Ford, General Motors and Chrysler. A list of other companies reporting successful implementation of SS can be found in Kwak and Anbari [11].
Nevertheless, some companies have not experienced the same success when implementing SS, resulting in a wasted expense of both time and money [12]. Four causes of SS failure are reported, including lack of understanding of the concept and scope of the methodology, inadequate education and training, poor management and implementation strategies, and lack of supporting organisational structure [13,14].
Given the above, one question needs to be addressed: what are companies that have managed to adequately implement SS doing and what are companies who have failed not doing? Some responses are given by Montgomery Douglas [12]; however, he suggests that there is a set of key activities involved in the implementation of SS, known as critical success factors (CSFs), which have been widely reported in the literature. In 2002, Coronado and Antony [15] published research in which they carried out a literature review in relation to the critical success factors that have been identified since Motorola’s introduction of SS in 1986. Four years later, in 2006, Revere et al. [16] updated this list, based on an empirical analysis, and in 2009, Vest and Gamm [17] also carried out a literature review and a comparison of SS and the Lean Toyota Production System.
The studies referred to above, which were applied in different environments, suggest that SS as a philosophy greatly depends on the human resources and the environment in which it is implemented. Even Chow Ann and Moseley James [18] report in their study the relationship between human resources and the success of SS. Reported critical success factors that are local and applied in specific industrial sectors may not be applicable to all companies, and implementation without adjusting to the environment may be another factor involved in failure. Brun [19] conducted a study to determine whether Italian companies implement the concepts of SS in the same manner as Motorola or in their own way, while Desai et al. [20] carried out a similar study on Indian companies, where it was found that the SS application differed on the basis of the size of the company. Habidin and Yusof [21] created a structural equation model to identify the main CSFs for SS in the automotive industry in Malaysia, which was also the location for similar studies by Chakraborty and Chuan Tan [22], who identified 42. Ribeiro de Jesus et al. [23] investigated companies in Brazil, while Cano et al. [24] investigated CSFs using a literature review. More reports on critical success factors for SS can be found in other literature [1,23,25,26,27]. An analysis of the various CSFs for SS in different countries can be found in Lande et al. [28].
The number of CSFs identified for SS varies considerably between studies. Kumar et al. [29], for example, identify 14, where the predominant activities are associated with senior Managerial commitment, training and organisational structure, and suggest that the absence of these factors is the main cause of abandonment of SS projects. Marzagão and Carvalho [27] identify 12 CSFs, adding aspects associated with the use of statistical tools and information technology to the above list, as well as the need for projects to be small in scale to ensure completion in the correct timeframe and form, given that if the expected results are not rapidly achieved, there is a risk of loss of motivation among the improvement teams. Fairul-Anwar and Mohd Amran [30] published a study with five CSFs for SS, reduced from a list of 97, where SS Implementation strategy, training and education in SS, and Managerial commitment again predominate.
American companies that have implemented SS generally report Economical benefits resulting from the application and implementation of these CSFs. There are, however, many other benefits to be gained. Kwak and Anbari [11] carried out a literature review, identifying 14 companies that have benefitted from the implementation of SS. Although these benefits are mainly financial, operational aspects were observed, related to inspection time and quality maintenance, punctual deliveries to clients and reduced cycle time from product design to manufacture. Likewise, Antony et al. [31] report the benefits that SS can provide in the services sector (since this methodology is not exclusive to the manufacturing sector) and, more recently, Raman et al. [32] report eight cases of companies that have benefitted from the implementation of SS, among which Economical benefits predominate.
As can be seen from the above, there has been great interest in identifying the critical success factors for SS and its benefits, but few studies associate these CSFs with the benefits obtained. García-Alcaraz et al. [33], for example, performed an analysis to relate human factors with operational benefits, such as productivity, product rejection levels and client complaints. At the same time, Marzagão and Carvalho [27] propose a structural equation model in which SS is a variable affecting companies’ economic performance. Nevertheless, there has been no in-depth analysis of aspects associated with SS implementation, nor their relationship with Investment in human resources.
Based on the assumption that SS is a philosophy, that it is associated with human resources and that it depends on management decisions, the supporting organisational structure and the Implementation strategy followed in order to ensure the attainment of the Economical benefits reported in the literature [18,34], the aim of this article is to relate the critical success factors for SS to the Economical benefits obtained and that is its main contribution; and not only to the Economical benefits, but indirectly to sustainability, as this paradigm is strongly affected by Economical benefits, and especially by SS and human resources (HR). To this end, second-order structural equation modelling is used to relate Managerial commitment to SS, SS Implementation strategy and Investment in human resources, which in turn comprises two latent variables associated with education and training for SS and incentives awarded to improvement teams for achieving their goals. All these variables are related to the Economical benefits that can be obtained from SS.
Following this introduction, the second section of this article justifies the relationships between the latent variables in the model, which are hypotheses to be demonstrated statistically. The third section defines the methodology followed to validate the relationships between the variables in the model, while section four reports the findings, section five presents the discussion and industrial implications associated with these findings and finally, section six presents future research opportunities.

2. Literature Review and Hypotheses

The structural equation model presented here includes four latent variables: Managerial commitment, Implementation strategy, Investment in human resources (education/training and incentives) and Economical benefits. These variables are described below, with justification for the relationships between them.

2.1. Managerial Commitment (MC)

Given that SS is considered a production philosophy, the management and their activities are the main human resources factor that should be considered when analysing the SS Implementation strategy. There are many studies that associate Managerial commitment with successful SS implementation, including Vest and Gamm [17], who state that management is responsible for establishing a work plan for SS implementation and for directing the practices and techniques for improving processes, and Fairul-Anwar and Mohd Amran [30], who use affinity diagrams to integrate CSFs into just five groups, where Managerial commitment tops the list.
Recent studies by Alhuraish, Robledo and Kobi [25] propose a list of 13 critical success factors, where Managerial commitment is the first, but other important factors can be identified, including communication, training for everyone involved, abilities and skills acquired, as well as knowledge transfer at all administrative levels, all of which must be encouraged by senior management. Similarly, Mustafa and Jamaluddin [1] determine that Managerial commitment is the basis for successful SS, since managers are responsible for both steering the company through their actions and properly managing the knowledge that is generated during projects.
Laureani and Antony [35] indicate that the main role of managers is to lead and monitor SS projects, provide the resources for their implementation and establish work policies for the improvement teams. At the same time, management must also carry out a process for integrating the different departments of which the company is comprised, which enables everyone to have common objectives in their SS projects.
To determine Managerial commitment to the SS implementation process, for the purposes of this research, it is necessary to assess whether managers perform the following activities [36,37,38,39]:
  • Management regularly reviews the progress of six sigma projects (MC1);
  • Management encourages knowledge transfer across different departments and the organisational structure (MC2);
  • Management encourages interdepartmental cooperation in planning six sigma projects (MC3);
  • Management requests reports on the progress of projects in each department (MC4);
  • Management assigns the appropriate personnel for each project (MC5).

2.2. Six Sigma Implementation Strategy (IS)

As has been stated above, Implementation strategy is one of the main determinants in SS abandonment and failure, and is therefore considered a critical success factor. As far back as 1998, Harry [40] suggested that this strategy is vital for success and that it is the responsibility of senior management to establish guidelines, disseminate them throughout the company and ensure that everyone understands them. Drohomeretski et al. [41], meanwhile, state that SS is in itself both a methodology and a production strategy. Consequently, its establishment corresponds to senior management and it should be based on the experience of the organizational structure created for this purpose (Green Belts, Black Belts and Yellow Belts). Fatemi and Franchetti [42], however, state that the management leadership should be capable of combining it with other existing techniques and methodologies, such as lean production, and should focus many of these products on solving client problems.
Andersson et al. [43], in a study carried out on telecommunications companies, state that it is necessary for management to encourage frequent meetings between SS project leaders not only with the aim of promoting knowledge transfer between them and sharing experience, but also to analyse the problems encountered when implementing SS and identify ways to resolve them. Finally, Drohomeretski, Gouvea da Costa, Pinheiro de Lima and Garbuio [41] suggest that SS should not be conceived merely as a philosophy, but should be based on the outcomes of operations carried out from an operational and administrative standpoint.
Likewise, Kumar et al. [44] state that the best approach to implementing SS is client-oriented, since it is the client who demands product quality, and SS projects should therefore focus on addressing their complaints and suggestions in order to maintain client loyalty. Niemes [45] suggests that SS is a methodology that will bring a significant increase in sales and that SS projects should therefore focus on solving the technical and operational problems that will lead to better quality, because this will represent greater income, as suggested by Madhani [10].
To ensure that there is an adequate SS Implementation strategy in place, the following should be verified [10,41,43,45,46,47]:
  • There is an organisational structure that supports six sigma, including Black Belts, Green Belts and Yellow Belts (IS1);
  • Meetings are held between six sigma project leaders and project team members to enable monitoring (IS2);
  • Six Sigma projects are related to clients’ demands (IS3);
  • Improvement teams are aware of clients’ requirements (IS4);
  • Department heads review clients’ demands and complaints before creating a six sigma project (IS5).
Considering that SS strategy and its development depends on the actions taken by management, the following hypothesis is proposed.
Hypothesis 1 (H1).
Managerial commitment to SS projects has a direct and positive effect on the Implementation strategy for this philosophy.

2.3. Investment in Human Resources for SS (HRI)

Alongside SS Implementation strategy, lack of training and knowledge of SS are also reported as determinants in abandonment and failure. Considering that SS is a philosophy, it corresponds that investments should be made in the education of human resources, since it is they who are responsible for implementing the projects [48]. Two types of investment are associated with human resources: those involving educational processes, during which statistical techniques are taught, and systems for rewarding a job well done.

2.3.1. Education and Training (ET)

With regard to investment in education and training for SS, Coronado and Antony [15] state that specialised education is required for those implementing SS projects, since they need to learn aspects related to statistical techniques for analysing information. It is the management’s responsibility to establish training schedules, which should be agreed with Champions, Green Belts and other people involved who understand training requirements, and this will enable the determination of course content [1]. At this point it is important to point out that management must accept that it is the responsible body and leader for all SS projects and that productivity indices will be related to the educational and training level of the teams implementing SS projects [49].
To ascertain whether the company is implementing an adequate educational process as part of its Investment in human resources, the following should be verified:
  • There is a regular training schedule (ET1);
  • Blank belts (BBs) and Green belts (GBs) are assigned to advise on six sigma projects (ET2);
  • BBs and GBs are involved in the analysis of problems associated with the six sigma project (ET3);
  • The workload is adjusted to allow time for education and training (ET4);
  • Materials and software are provided for analysing the information (ET5).

2.3.2. Incentives (IN)

If an employee does good work on an SS project and the company gains economic profits as a result, they should be rewarded for their efforts in order to maintain their interest and their motivation to continue working on improving production processes. Arumugam et al. [50] suggest that it is necessary to analyse the impact of incentive and reward schemes on the success of SS, since it depends on workers remaining engaged and integrated in the projects. Likewise, Zu et al. [51] state that while incentives should be performance-based for those involved in projects, they should also be focused on achieving greater engagement with and involvement in the quality commitments in place. Finally, a review of CSFs for SS by Brun [19] concludes that senior management should find ways to involve employees, providing a clear view of the objectives and proposing a system of incentives.
To ascertain whether a company has an adequate SS incentive programme, the following should be verified:
  • Award ceremonies are held for certification as GBs, BBs, etc. (IN1);
  • Regular awards are presented for the best six sigma projects (IN2);
  • Project outcomes are considered in career performance and impact on the income of project members (IN3);
  • The abandonment of an six sigma project affects promotion to higher positions (IN4);
  • The outcomes of an six sigma project affect annual bonuses or salary increases at year end (IN5).
In accordance with the above, it can be seen that programmes for Investment in human resources depend on the support and level of Managerial commitment, and therefore the following hypothesis is proposed.
Hypothesis 2 (H2).
Managerial commitment to SS projects has a direct and positive effect on Investment in human resources, such as education and incentives.
Nevertheless, these levels of Investment in human resources should be part of an SS implementation plan, where education, training, incentives and rewards are essential components in ensuring its success and integrating the participants, i.e., part of the Implementation strategy. Mustafa and Jamaluddin [1], for example, state that SS implementation plans should include reward programmes for workers, since it is they who are the means of improving production processes and who truly apply the methodology, and they who best understand the production processes and have the clearest outlook on potential improvements, as suggested by Chen et al. [52] in a Single-Minute Exchange of Die (SMED) case study. According to de Freitas et al. [53], focusing solely on training in statistical techniques can drive many people to abandon SS projects, since this can be an obstacle to learning for many operators, while incentive programmes can provide motivation, preventing abandonment by project team members and encouraging their efforts. Given the above, it can be concluded that the SS Implementation strategy affects Investment in human resources, and the following hypothesis is proposed.
Hypothesis 3 (H3).
SS Implementation strategy has a direct and positive effect on Investment in human resources associated with education, incentives and rewards.

2.4. Six Sigma Economical Benefits

SS is a methodology that requires economic investments, which can be justified by the fact that its implementation results in a number of benefits. The literature includes many reported benefits associated with SS and much of its popularity can be traced to this reason, rather than its adoption as a problem-solving philosophy. According to de Freitas, Costa and Ferraz [53], implementing SS can lead to increased morale among employees, cost reductions, increased product reliability, efficient use of resources, reduced risks and enhanced reputation for the company, with clear and significant Economical benefits. In the same way, Parast [54] finds a relationship between SS implementation and performance in innovation projects, where companies achieve better market positioning and financial performance.
In addition, Swink and Jacobs [55] and Shafer and Moeller [56] show that there is a relationship between the investment made in SS projects and the Economical benefits obtained by companies, with high cost recovery rates. At the same time, Ertürk et al. [57] state that companies who have implemented SS are characterised by reduced costs, improved productivity, growth and market presence, client retention and loyalty, reduced cycle times and defects in processes, greater culture of change and better client service, where many of these characteristics reflect economic profits. Finally, include a list of 14 companies that have obtained benefits through SS implementation, where the financial aspects are again shown.
To evaluate the benefits to a company through SS implementation, the following should be verified:
  • there are savings in production costs (ECB1);
  • a competitive advantage is created for the company (ECB2);
  • there are increased returns on investment (ECB3);
  • there are increased sales (ECB4);
  • there is reduced wastage (ECB5).
However, the question that needs to be addressed at this point is: which CSFs help ensure that the company gains these economic profits? In this research, two sources are analysed: Implementation strategy and Investment in human resources. Fatemi and Franchetti [42] indicate that the integration of lean manufacturing programmes, sustainability and SS guarantees that companies will gain economic resources, but success is dependent on the strategy followed to integrate them as a whole. This has also been proposed by Drohomeretski, Gouvea da Costa, Pinheiro de Lima and Garbuio [41], who add that not all outcomes depend on the Implementation strategy, but rather on the level of adherence to it and the speed with which deviations are corrected. In other words, it is not enough to have plans and programmes as part of the Implementation strategy in order to obtain Economical benefits; rather, it is necessary to execute the plans and base decisions on the results of the productive system’s operations. Finally, Kumar, Antony, Antony and Madu [44] indicate that companies should take a client-focused approach to their strategic plans and programmes, since it is they who actually pay for the final product and focus on its characteristics. Considering that there is a relationship between SS Implementation strategy and the Economical benefits that are gained, the following hypothesis is proposed.
Hypothesis 4 (H4).
SS Implementation strategy has a direct and positive effect on the Economical benefits that are obtained from it.
Although there are many sources of success for SS, Investment in human resources is one of the most important. Revere, Kadipasaoglu and Zalila [16] point out that the selection of a team comprising people with training and skills in information management and understanding of production line problems is essential for success and cost reductions in SS projects. At the same time, Moosa and Sajid [58] state that the success of SS as a methodology is highly dependent on the skills and level of training of members of the improvement teams, since good training in statistical techniques and information analysis will result in easier definition of the problem, as well as monitoring of the results obtained, which translates into better performance indices for the company.
Ertürk, Tuerdi and Wujiabudula [57] indicate that lack of a training programme is directly associated with savings in projects, and therefore recommend that BBs and GBs serve as instructors and guides in their implementation. Likewise, Boon Sin et al. [59], using a structural equation model, show that SS projects should be focused on generating and transferring knowledge in relation to the different problems that are encountered by companies and that are associated with clients, since if problems rearise, their solutions are already known, thus saving money for companies.
At the same time, Louhaichi et al. [60] state that the economic incentives that companies offer their employees for their performance on SS projects help to better integrate them, achieving greater motivation and commitment. Anand et al. [61] even suggest that the level of incentives should be based on the level of involvement of team members in an SS project, since incentives often recognise the work of the team as a whole, without taking into account the contribution of informal leaders who often guide other team members. Based on the above, the following hypothesis is proposed:
Hypothesis 5 (H5).
Investment in human resources during SS implementation has a direct and positive effect on the Economical benefits gained by the company.
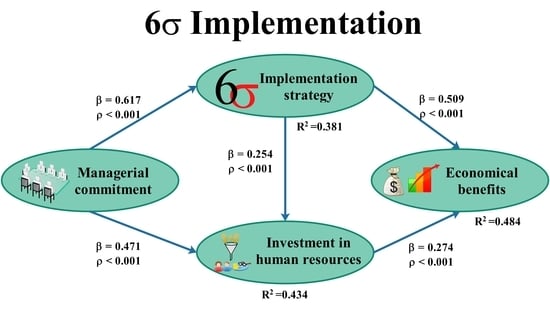
The proposed hypothesis is shown in graphic form in Figure 1.

2.5. Sustainability and Environmental Benefits

Although the model presented in this work apparently is focused only on economic success, the benefits derived from SS Implementation strategy and Investment in human resources are much more important on other issues related to Economical benefits and to SS and HR, especially on sustainability and environment.
Firstly, Economical benefits are clearly related to sustainability, since the more resources the company has, the more it is able to devote to sustainable production, and, on the contrary, a small economical capacity drives to the necessity of a production without possibility of environmental processes.
However, the main relationship of or model to sustainability lies in other variables, concretely Investment in human resources, as well as in the inherent mutual benefits of the paradigms of SS and sustainability.
Such relationship between both paradigms drives to SS sustainability. McCarty et al. [62] present a guide about SS sustainability devoted to analyze the power of SS to develop and implement enterprise-wide green initiatives, with structures such as program governance, project charters, transfer functions, measurement systems, risk assessment, and process design, based on real-world examples of specific environmental problems. A complete analysis of works integrating lean manufacturing, SS and sustainability can be seen in Cherrafi et al. [63] as, for instance, a particular case study of sustainability framework linked to SS, concretely an automotive company, that can be seen in Tan Owee et al. [64].
SS is also a source of benefits for environmental management systems, as can be seen in Jami et al. [65], with benefits including materials consumption, cost reductions, less waste to the landfill, decreased amount of waste water, reduction of emissions, reduction of energy consumption and safety improvements. Habidin and Yusof [66] present another case study based on an automotive industry.
Finally, the main relationship of sustainability with this model lies in Investment in human resources. Ehnert [67] presents a report on the role of HR for advancing sustainability, and Daily and Huang [68] analyses, based on a quantitative survey, sustainability and HR management, providing a comprehensive review of sustainable HR management combining different disciplines like sustainable work systems, ergonomics, HR management, linking sustainability, among others.

3. Materials and Methods

To quantify the dependency relationships between the four latent variables, the methodology shown below was followed.

3.1. Stage 1: Information Collection

The structural equation model integrates four latent variables associated with SS: Managerial commitment, Implementation strategy, Investment in human resources and Economical benefits. For the statistical validation of the model, information was needed from the industry, and therefore a literature review was carried out to identify the observed variables or items that would enable evaluation of these four variables, representing a rational validation. Once the items for the latent variables were identified, a questionnaire was created and submitted to five experts in the area, two academics and three industry managers, constituting expert validation.
The final questionnaire comprises three sections, the first relating to demographic aspects, the second listing all items for each of the latent variables and the third relating to the economic profits gained. The second and third sections of the questionnaire use a five-point Likert-type scale for responses, where a rating of one indicates that the activity is never performed or that the benefit is never obtained, while a rating of five indicates that this activity is always performed, or the benefit is always obtained.
The questionnaire was administered to the Mexican manufacturing industry, using a stratified sample, since it was targeted toward companies who had implemented SS and who had data on projects carried out over the last five years and who also had SS certification such as Green Belt (GB), Black Belt (BB), Yellow Belt (YB) or Champion, which were principles for inclusion. Following this, a snowball sampling method was used, since many respondents indicated other potential candidates to complete the questionnaire, which was the same as that used in the period from May to September 2017.

3.2. Stage 2: Analysis of Information

The information obtained from the questionnaires was captured in an SPSS 24® software [69] database, due to its ease of use [70], where the columns represent all the observed variables or items and the lines represent cases or completed questionnaires. The database was refined to remove extreme values and missing values, which were replaced by the median for each item, since the evaluation scale used was ordinal. A value was considered extreme if, on standardisation, it had an absolute value greater than four. In the same way, if a questionnaire contained more than 10% of items without a response, it was rejected [71].
Once the database was refined, the sample was analysed using the demographic information obtained, where cross tables were created to understand the distribution. In the same way, a descriptive analysis of the items included in the latent variables was carried out, with the aim of identifying univariate trends, where the median was used as a measure of the central trend and the interquartile range was used as a measure of dispersion.
It should be noted that the variable Investment in human resources integrated two latent variables at the same time, Education and training and Incentives, so that the model presented is a second-order model. To validate the items in each of the latent variables, several indices were used, as proposed by Kock [72]. These were as follows:
  • For parametric predictive validity, R-squared and adjusted R-squared were used, expecting values higher than 0.02, while for non-parametric predictive validity, Q-squared was used, with values expected to be similar to those of R-squared.
  • For internal validity, Cronbach’s alpha and the composite reliability index were used, accepting values higher than 0.7.
  • For convergent validity, average variance extracted (AVE) was used, accepting values higher than 0.5.
  • For measuring collinearity, variance inflation factors were used, accepting values lower than 3.3.
The model was evaluated using WarpPLS v.5® software [73] with a confidence level of 95%, based on partial least squares algorithms, which is widely recommended for small samples with normality problems in the data or when the evaluation scale is ordinal, as was the case here. This technique has been used previously in various research studies to relate latent variables; García-Alcaraz et al. [74], for example, use it to relate the impact of the flexibility of supply chains on wine producers’ operational performance, while Boon Sin, Zailani, Iranmanesh and Ramayah [59] use it to evaluate the effect of SS-related activities on companies’ performance.
Although the latent variables were properly validated, it was also necessary to validate the structural equation model as a whole and the following indexes built into the WarpPLS v.5 software [73] were therefore used, as proposed by Kock [72]:
  • For predictive validity, Average R-Squared (ARS) and Average Adjusted R-Squared (AARS) were used, associated with a p-value that must be less than 0.05.
  • For measuring the collinearity between the latent variables, the average variance inflation factor (AVIF) and the average full collinearity VIF (AFVIF) were used, which must have values less than 3.3.
  • For measuring the fitness of the data obtained for the model proposed, the Tenenhaus Goodness of Fit (GoF) index was used, which must have values greater than 0.36.
To validate the hypotheses set out in Figure 1, the direct effects of one latent variable on another were estimated, in order to obtain a β value as a measure of dependency between them, which is a standardised value. The null hypothesis that β = 0 versus the alternative hypothesis that β ≠ 0 was tested with a confidence level of 95%. In the same way, the indirect effects existing between the latent variables through mediating variables were obtained and, finally, the total effects were obtained, representing the sum of the direct effects and the indirect effects [75].
In the proposed model, there are three latent dependent variables with an associated value of R-squared as a measure of the variance explained by the independent latent variables. This value is therefore broken down in the size of the effects to measure the contribution of each of the dependent variables to the value of R-squared, which allows quantification of the variables which are most important or which have the greatest explanatory power.

4. Results

After three months of administering the questionnaire, 301 valid cases were obtained, after some were rejected for exceeding the maximum number of missing values. The results of the analysis of the information and the validation of the hypotheses in the model are described below.

4.1. The Sample

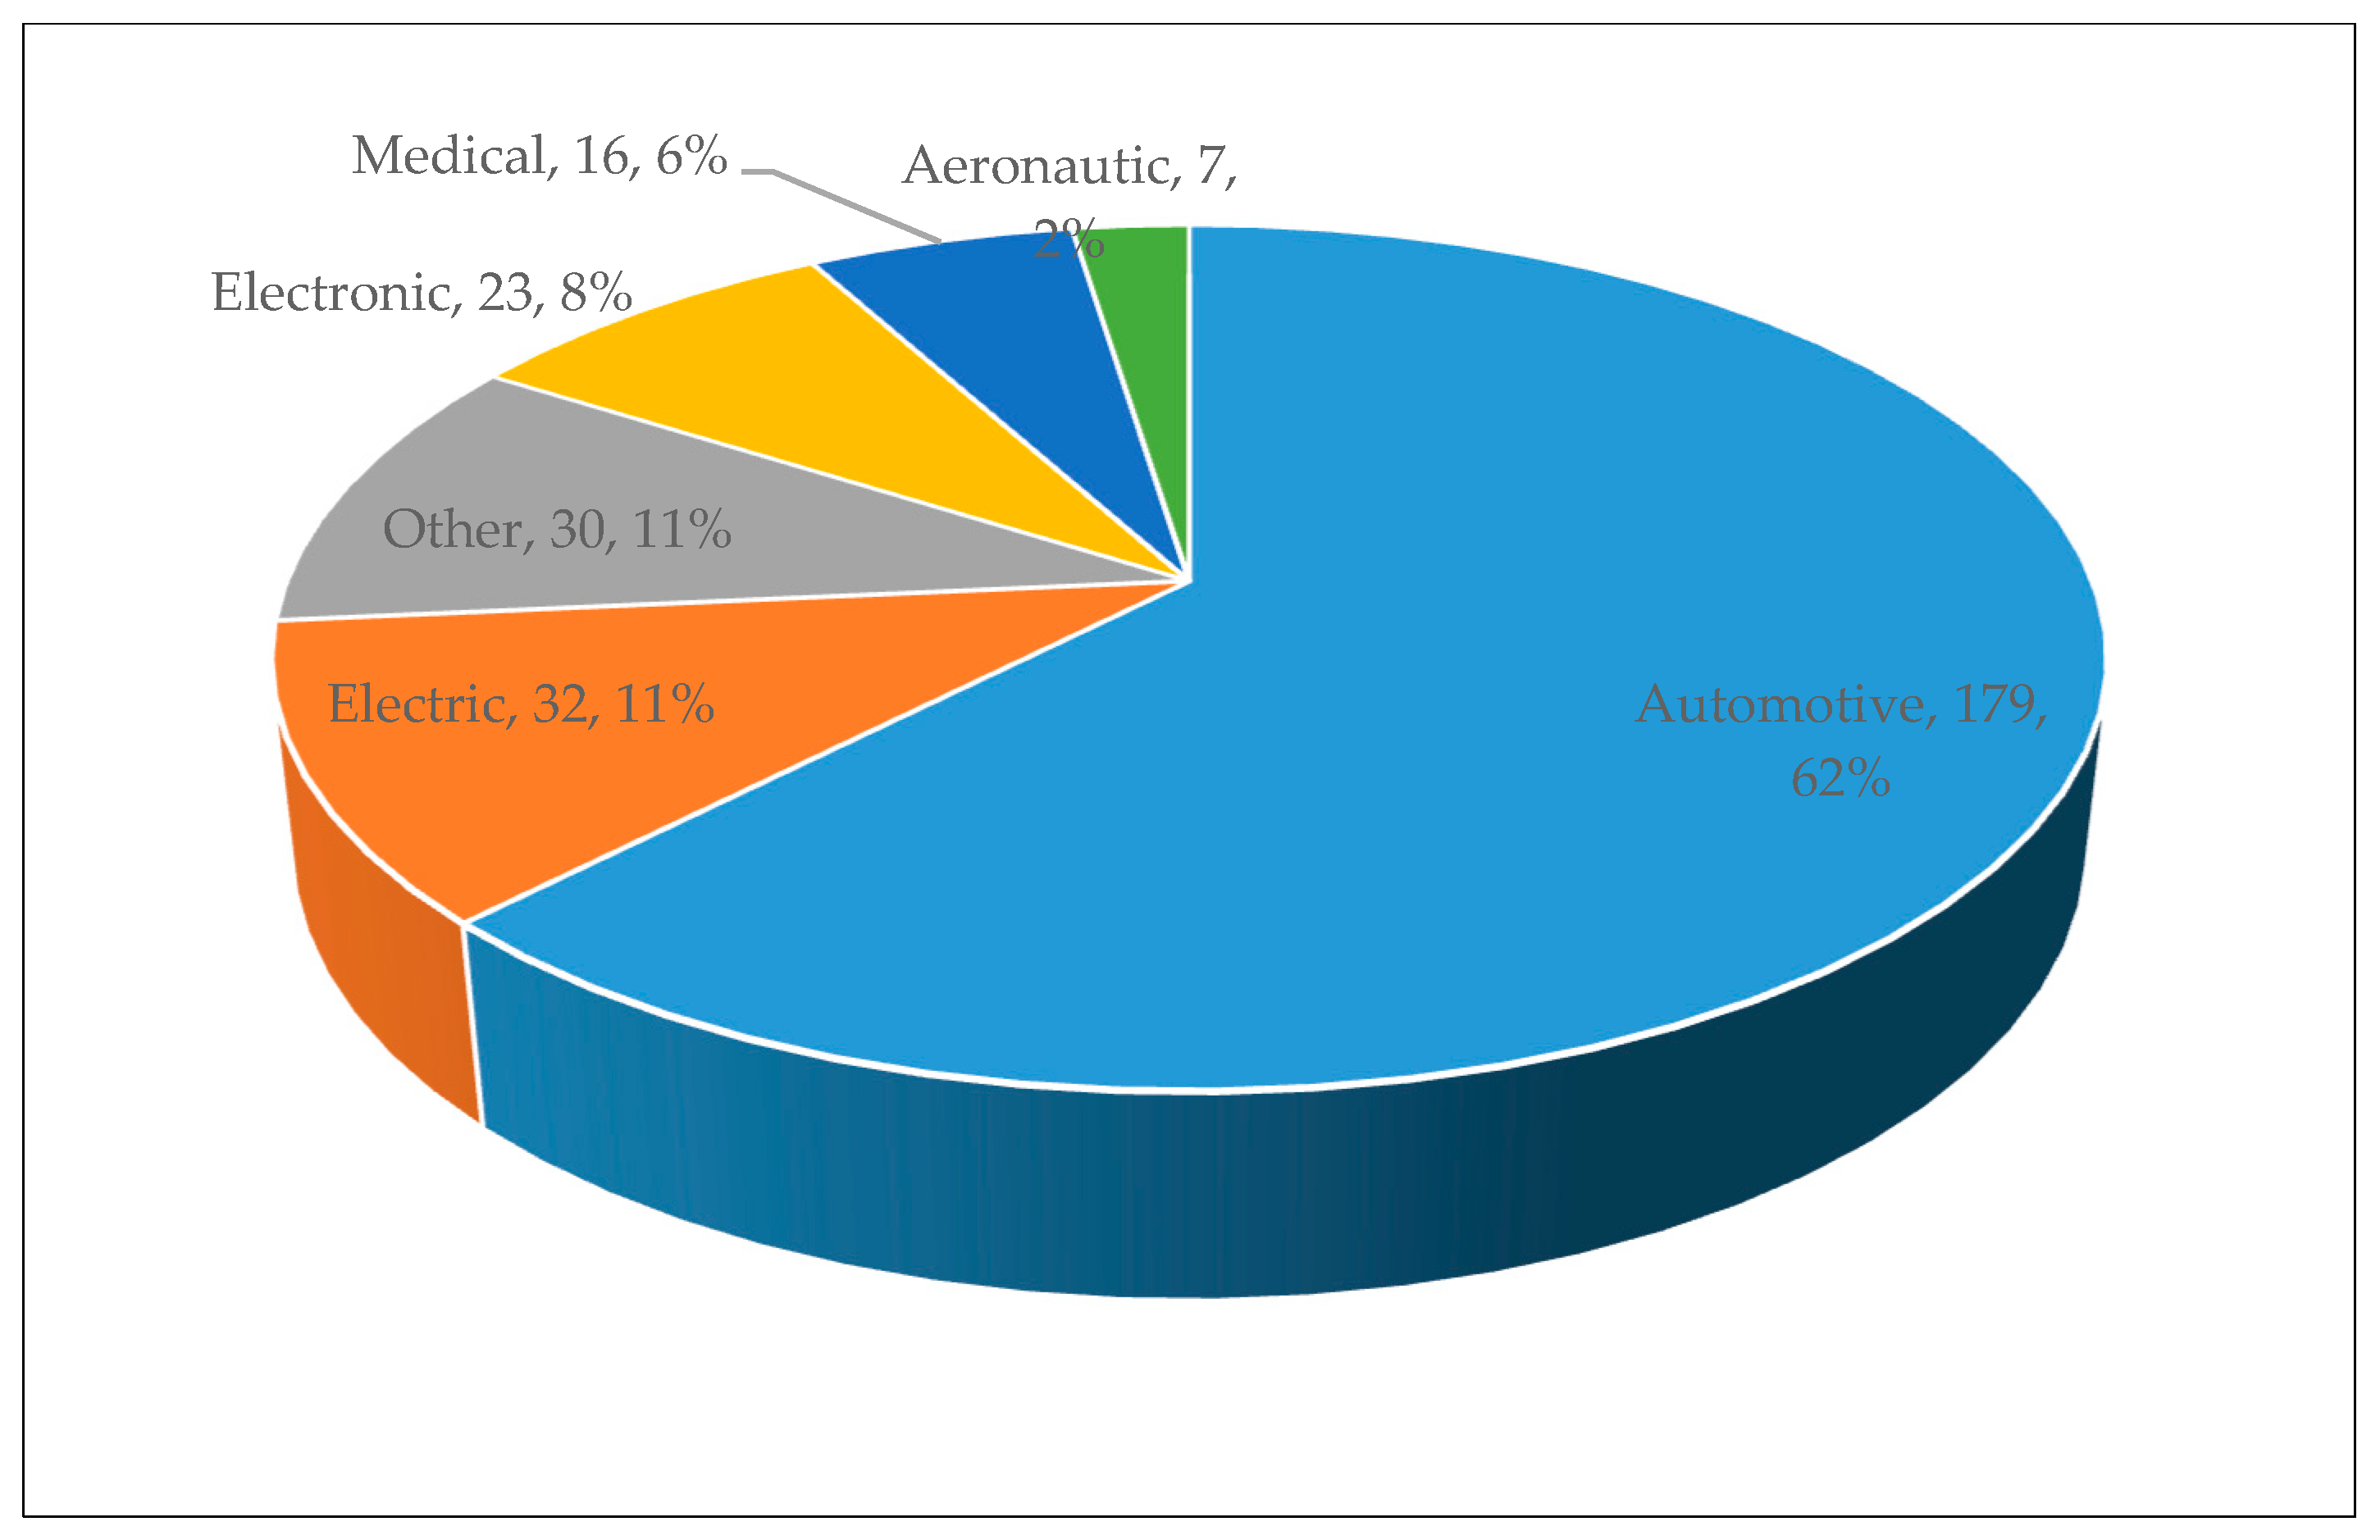
Table 1 shows information from the surveyed sample. Only 287 of the 301 responded to the question on their industrial sector and certification in SS. The most represented sectors were the automotive and electrical industries, with 179 in the first sector and 32 in the second, representing 73.5% of the total sample. It is worth mentioning briefly that 155 respondents had been certified for one to two years, 71 for two to five years, 40 for five to ten, and finally, 30 had been certified for more than 10 years, while five did not declare how long they had been certified.
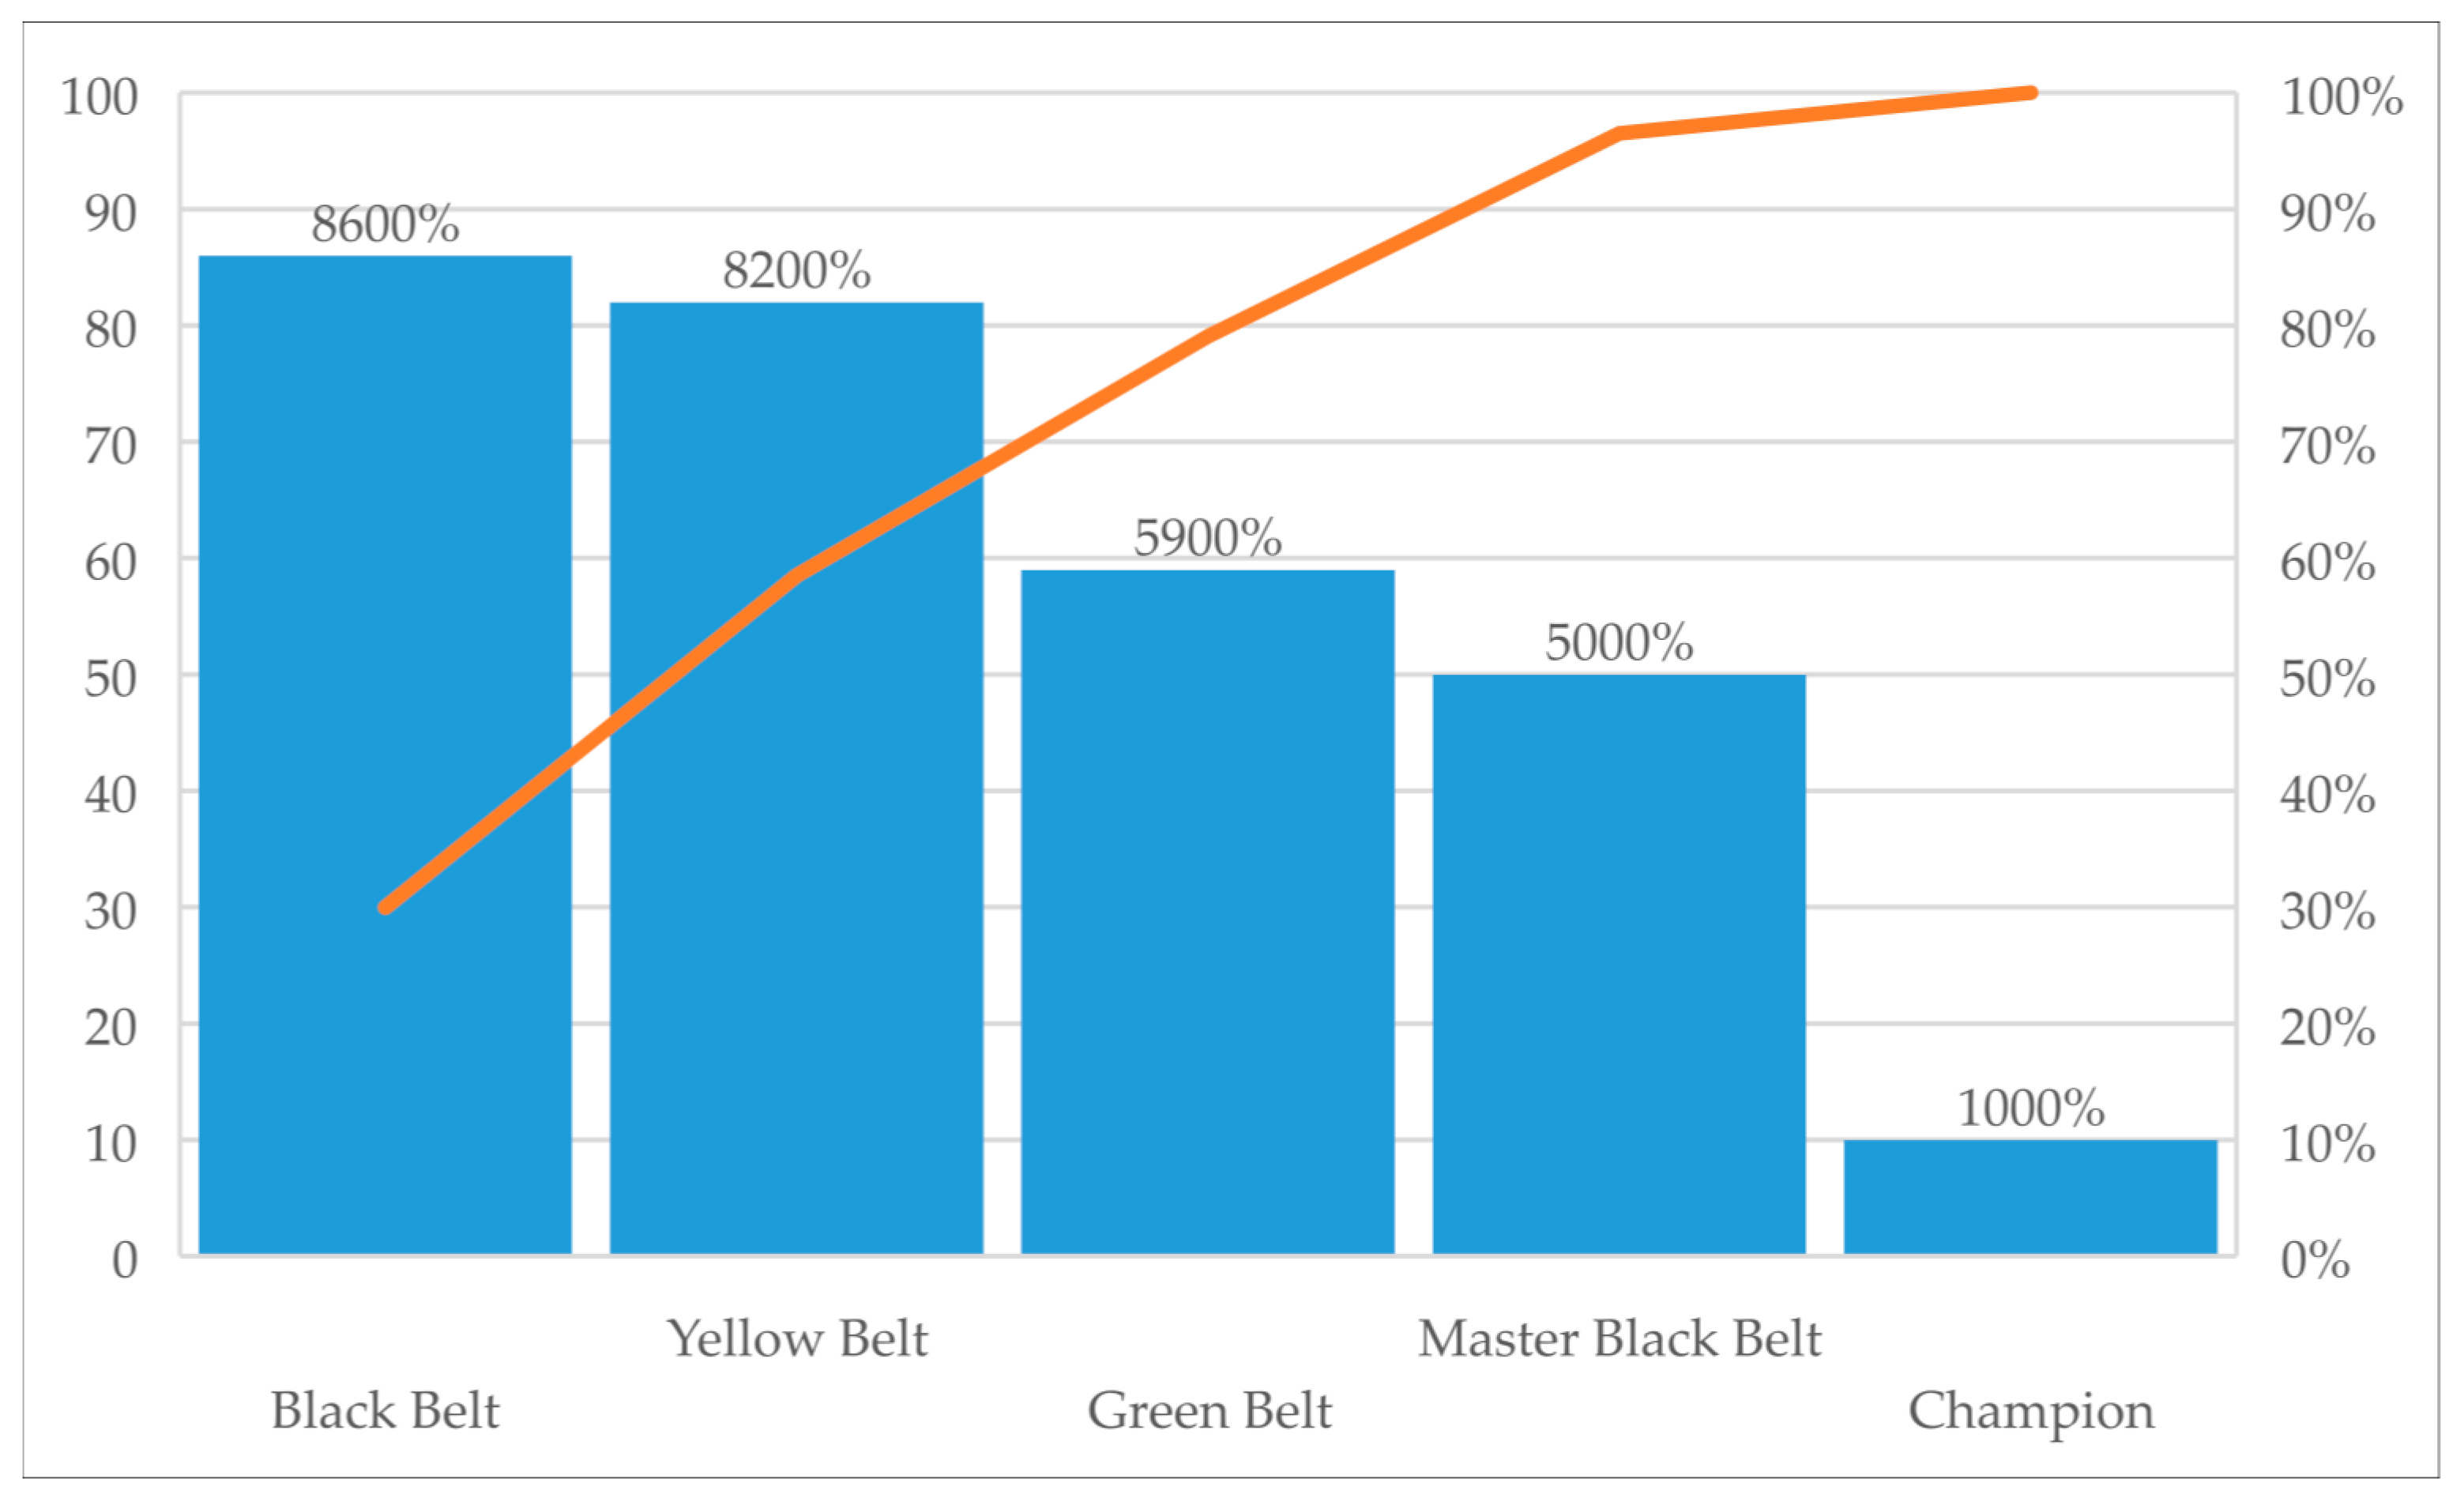
Figure 2 illustrates the certification in SS for responders. It is observed that eighty-six persons have the Black Belt certification, but only ten were Champions. In addition, Figure 3 illustrates the main industrial sectors.

4.2. Descriptive Analysis of the Sample

Table 2 shows the descriptive analysis of the items integrated into the latent variables. It should be remembered that the latent variable Investment in human resources comprises two others, education and training and incentives. The items in each of the latent variables are sorted from highest to lowest according to the value of the median.
Based on the results of univariate analysis, it can be seen that the activity most representative of management commitment is promoting interdepartmental cooperation in planning SS projects. Nevertheless, there is an area of opportunity in the monitoring of these projects, as this item is the lowest. Likewise, in the section corresponding to economic profits, it can be seen that all items have very similar values and are the highest, indicating that SS projects do enable savings in production costs and a reduction in wastage; however, these are the items with the highest values in the interquartile range, indicating that there is only a moderate consensus. The results from the other latent variables can be interpreted similarly.

4.3. Data Validation

Table 3 shows the validation indices for the latent variables. According to this information, it can be seen that there is sufficient parametric predictive validity, since the values of R-squared and adjusted R-squared are higher than 0.02, the minimum acceptable value; in addition, the values of Q-squared in all the variables are positive and similar to R-squared, indicating that there is also non-parametric predictive validity. In the same way, the internal validity is adequate because the composite reliability index and Cronbach’s alpha are greater than 0.7.
It can also be seen that the average variance extracted is greater than 0.5 for all variables, confirming that there is convergent validity and, finally, it can be concluded that there are no collinearity problems, since the variance inflation factors are less than 3.3, the maximum permitted value. On the basis of this information, it was concluded that the latent variables can be integrated into the model and the corresponding analysis could be performed.

4.4. Structural Equation Model

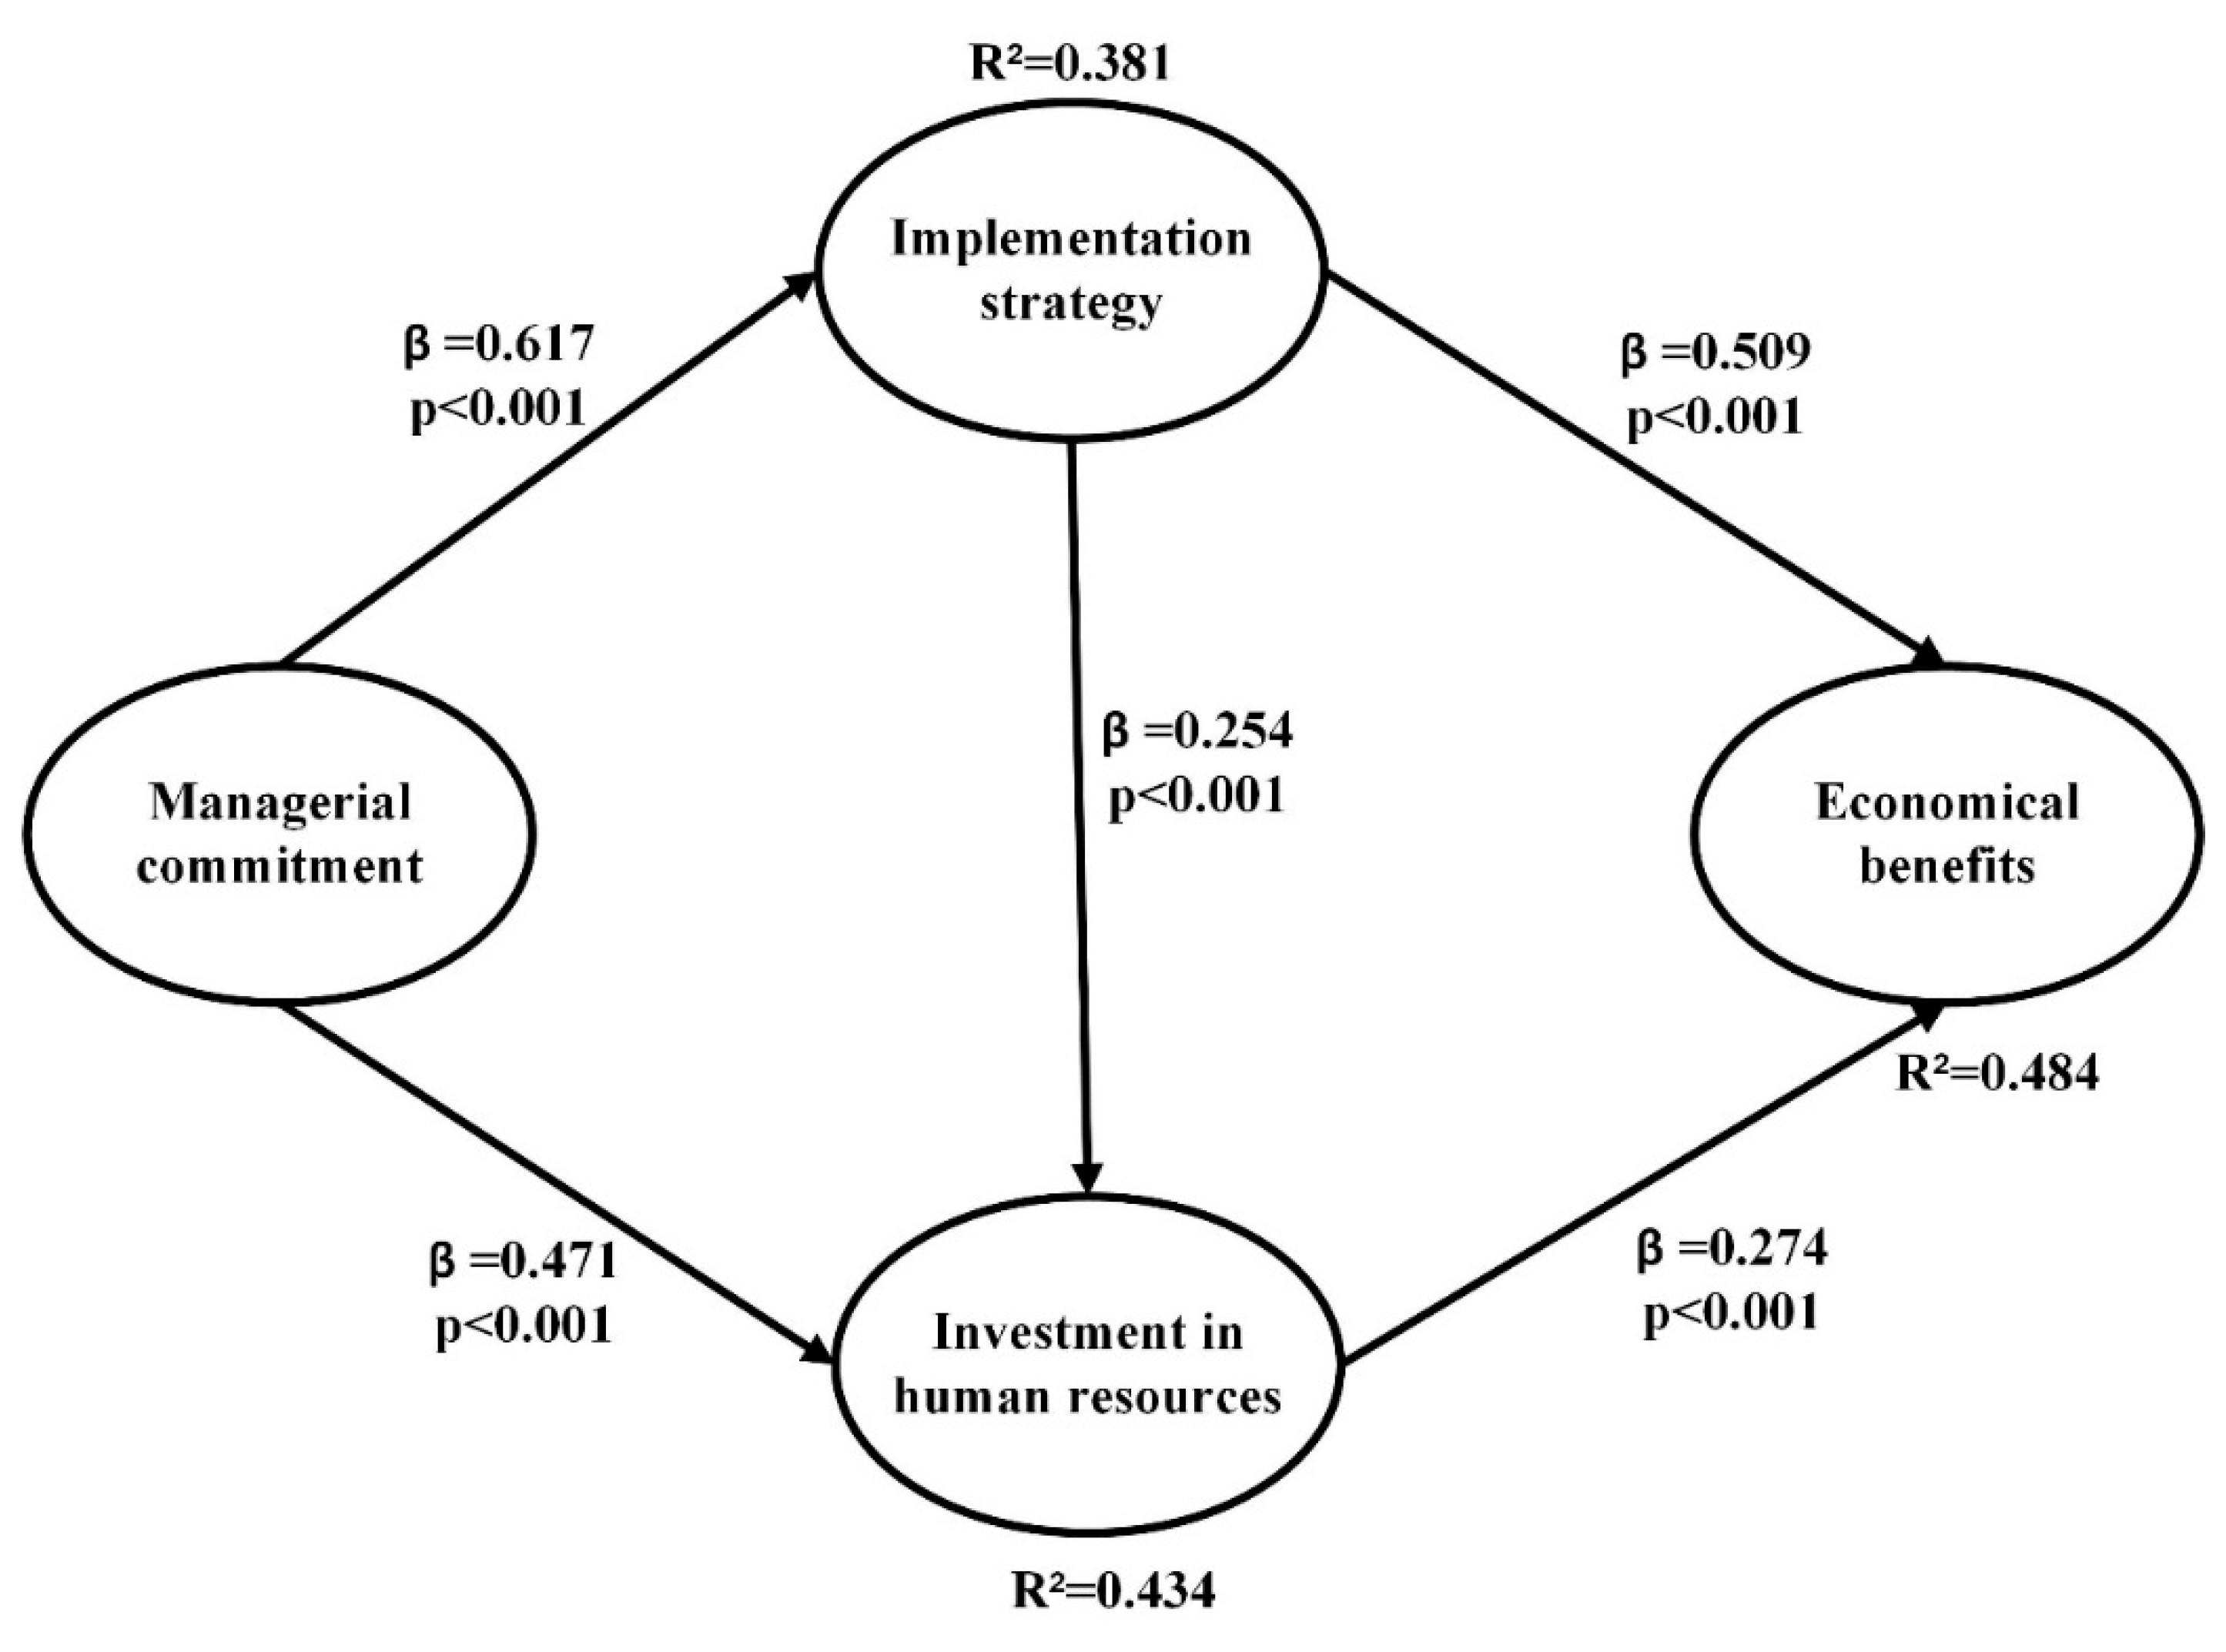
The variables were integrated into the model and run through WarpPLS software [73]. The validity indices for the model are shown below and the evaluated model appears in Figure 4:
  • Average path coefficient (APC) = 0.425, p < 0.001
  • Average R-squared (ARS) = 0.433, p < 0.001
  • Average adjusted R-squared (AARS) = 0.430, p < 0.001
  • Average block VIF (AVIF) = 1.514, acceptable if ≤5, ideally ≤3.3
  • Average full collinearity VIF (AFVIF) = 1.974, acceptable if ≤5, ideally ≤3.3
  • Tenenhaus GoF (GoF) = 0.565, small ≥ 0.1, medium ≥ 0.25, large ≥ 0.36
According to the information above, and considering the p-values and that these are lower than 0.05, it can be concluded that the relationships between the latent variables are statistically significant (see APC value) and that there is sufficient predictive validity in the latent dependent variables (see ARS and AARS). Similarly, there are no collinearity problems between the latent variables in the model, since the AFVIF and AVIF indices are lower than 3.3. It can also be seen that the data adequately fits the model (see GoF), since its value is greater than 0.36.

4.4.1. Direct Effects

The direct effects allow conclusions to be drawn in relation to the initial hypotheses and, given the values of the β coefficients and the associated p-values, the following can be concluded.
Hypothesis 1 (H1). There is sufficient statistical evidence to state that Managerial commitment to SS projects has a direct and positive effect on the Implementation strategy for this philosophy, since when the first latent variable increases its standard deviation by one unit, the second increases by 0.617 units.
Hypothesis 2 (H2). There is sufficient statistical evidence to state that Managerial commitment to SS projects has a direct and positive effect on Investment in human resources, such as education and incentives, since when the first latent variable increases its standard deviation by one unit, the second increases by 0.471 units.
Hypothesis 3 (H3). There is sufficient statistical evidence to state that the SS Implementation strategy has a direct and positive effect on Investment in human resources associated with education, incentives and rewards, since when the first latent variable increases its standard deviation by one unit, the second increases by 0.254 units.
Hypothesis 4 (H4). There is sufficient statistical evidence to state that the SS Implementation strategy has a direct and positive effect on the Economical benefits gained, since when the first latent variable increases its standard deviation by one unit, the second increases by 0.509 units.
Hypothesis 5 (H5). There is sufficient statistical evidence to state that Investment in human resources during the implementation of SS has a direct and positive effect on the Economical benefits gained by the company, since when the first latent variable increases its standard deviation by one unit, the second increases by 0.274 units.

4.4.2. Size of Effects

As can be seen in Figure 4, the variable Investment in human resources is 43.4% explained by two independent latent variables, since R2 = 0.434. However, by breaking down the explained variance in the variable, it can be seen that Managerial commitment explains 29.6% and Implementation strategy explains 13.8% of the variance, which leads to the conclusion that the first variable is more important, given that it has greater explanatory power; in other words, managers must be committed to SS philosophy and invest in employees’ education, training and performance-based rewards through incentives.
Likewise, the variable Economical benefits is 48.4% explained by two independent latent variables, since R2 = 0.484. From this total, the SS Implementation strategy explains 33.4% and Investment in human resources explains 15.0% of the variance, which leads to the conclusion that the first variable is more important in ensuring the company’s financial performance and the Economical benefits, since it has greater explanatory power, meaning that managers should focus on designing appropriate SS implementation plans as well as the needs of clients.

4.4.3. Sum of Indirect Effects

The direct effects allow validation of the hypotheses set out in Figure 1. Sometimes, however, the indirect effect is of greater importance due to its scale and the variables involved. In Figure 4, it can be seen that the variables Investment in human resources and Economical benefits have indirect effects through other mediating variables. These results are shown in Table 4, where it can be seen that they are all statistically significant.
As can be seen in Figure 1 and Figure 2, Managerial commitment is not directly related to Economical benefits, given that many other variables should be present in order to analyse their relationship; there is no point in there being a strong commitment from management if there are no plans or programmes aimed at improving quality and meeting clients’ needs by means of SS (Implementation strategy), or if existing personnel are not involved by means of education and incentives (Investment in human resources). It can be seen that the indirect effect between Managerial commitment and Economical benefits is 0.486, explaining up to 28.2% of its variability, which indicates that managers should focus on gaining increased financial revenue when implementing philosophies applied to production systems, since this is sought by investors; however, this should go hand-in-hand with an appropriate Implementation strategy that includes human resources and that values and rewards their efforts.

4.4.4. Total Effects

The total effects represent the sum of the direct and indirect effects, as shown in Table 5, with their respective p-values for testing statistical significance and the amount of variance that they explain. It can be seen that the most significant effects correspond to the relationship between Management commitment and Investment in human resources (which includes one direct and one indirect effect through Implementation strategy), as well as Implementation strategy (which has only one direct effect). It is also important to point out the direct effect of Implementation strategy on Economical benefits (which includes one direct and one indirect effect through Investment in human resources), since its value is also high.

5. Discussion and Industrial Implications

SS is a production philosophy which, despite having been introduced in American companies over thirty years ago, is still applicable today in industrial systems. It is a tool used for ensuring quality and, far from going out of fashion; its scope has increased due to aspects associated with market globalization and the customization of products and services required by clients.
Nevertheless, in order to obtain the benefits that it can offer, SS entails a number of factors as Managerial commitment, Implementation strategy and Investment in human resources. The relationship between these variables is widely described in other articles, but the contribution of this research is that it quantifies through a rigorous statistical analysis, the relationship and proposes measures of dependence among them. These measures of dependency and explanatory capacity among the variables allow decision-makers and responsible persons to focus the attention on those that are most important, ignoring trivial variables. SS is also very associated to sustainability and environmental management systems, both issues directly affected by Investment in human resources, as Daily and Huang [68] and Ehnert [67] indicate. Also, recent researches associate SS with sustainability, as for example, de Freitas et al. [7] that verify how Lean Six Sigma (LSS) could influence the organizational sustainability through their projects and Swain et al. [8] indicate that the growing importance of quality management and leadership and their impact to business sustainability is a current research area for both academicians and practitioners and findings in this report are contributing to that research gap.
Our findings indicate that Managerial commitment is required to design an Implementation strategy for SS, and only in this way is it possible to guarantee flexible, robust and efficient production processes, as suggested by Andersson, Hilletofth, Manfredsson and Hilmola [43]. While this Implementation strategy does not need to be permanent, senior management should ensure that it is dynamic and that it has the necessary adjustments to suit clients’ needs. According to Drohomeretski, Gouvea da Costa, Pinheiro de Lima and Garbuio [41], it should be based on daily operations and activities that are proven to be capable of solving problems, and there must, therefore, be a feedback process in place for sharing experiences gained when applying SS on production lines. The relationship between Managerial commitment and Implementation strategy is demonstrated statistically in this study through the hypothesis H1.
Nevertheless, while SS involves various concepts, assuming that it is a philosophy, it requires the integration of human resources to ensure success and not only management commitment. Consequently, the hypothesis H2 relates these two variables, where a significant direct relationship is demonstrated, as well as an indirect relationship through the Implementation strategy. In other words, senior management should integrate education and training programmes in order to ensure that members of improvement teams can analyse the information obtained and that they are able to make decisions based on a reliable statistical basis. In this vein, Coleman [76] suggests that the support of experts in statistics is necessary in the initial stages of implementation. The results of this research are consistent with those of Kavčič and Gošnik [48], who consider that education is the basis for SS and many other production philosophies.
Another investment that should be managed by senior management is the system of bonuses and incentives offered to participants in SS projects who obtain satisfactory results, and this is, therefore, another scheme to be incorporated into the Implementation strategy. In other words, to ensure that SS is successful, reward schemes should be designed to keep workers motivated to continue working on SS projects and to share the knowledge generated between colleagues across departments. Failure to integrate a reward scheme can be the cause of multiple withdrawals and dropouts in SS projects, and Arumugam, Antony and Linderman [50], therefore, recommend studying their effect and impact. While Sabry [77] indicates that incentives are a minor CSF, it is recommended that cultural factors be analysed in order to understand the type of rewards that human resources value within each specific environment.
It has been assumed in this research that Investment in human resources depends on Managerial commitment and an appropriate SS Implementation strategy; however, when considering the β values, it is clear that there is greater dependence on the first variable and not on the second, since the value for the first relationship is 0.471 (H2), while the value for the second is 0.254 (H3). In other words, investments related to education, training and incentives involve a strategic decision corresponding to senior management, although they should be part of the strategy and the approach to SS projects (client-focused).
This research was based on the assumption that the Economical benefits obtained from SS depend on the Implementation strategy (H4) and the Investment in human resources (H5); however, when analysing the β values in each of the relationships, it can be concluded that economic income depends more on the Implementation strategy and the approach to SS projects, which this research assumes to be client-focused. Finally, if it were necessary to create a critical path based on the β values obtained in the relationships between latent variables based on their size, it could be concluded that the relationship is the following: Managerial commitmentImplementation strategyEconomical benefits. In other words, Managerial commitment is required to ensure a satisfactory approach to the Implementation strategy for SS projects and to therefore ensure that the Economical benefits reported in the literature are gained.
It is important to point out that, while in this research Investment in human resources has played a secondary role in the impact on the Economical benefits obtained from SS, it is an essential part of the Implementation strategy, since these human resources are the people who actually implement the plans and programmes created by senior management. As suggested by Kavčič and Gošnik [48], education and knowledge transfer generated during the various SS projects is what makes companies grow, and companies should therefore endeavour to preserve and share it. Moreover, in specific terms, investments made in education and training have been identified as critical success factors in various contexts, including industry in Brazil by Ribeiro de Jesus, Antony, Lepikson and Peixoto [23], in Malaysia by Habidin and Yusof [21] and in Italy by Brun [19], as well as in literature review [58], and it should not, therefore, be a factor neglected by managers, but should be properly integrated into the SS Implementation strategy.

6. Limitations and Future Research

This structural equation model was validated using information from companies in the Mexican manufacturing industry, whose geographical context could be seen as a limiting factor due mainly to cultural aspects, since SS is a philosophy linked to human factors. Nevertheless, the results of this research may serve to give a general idea of the relationships between the latent variables analysed.
Future research will seek to integrate other variables that have been identified during the course of this study, such as the management of knowledge generated within SS improvement teams, the communication and cooperation that takes place within them and the investment made in materials for SS education and training. In addition, a future research will be aimed to link the human resources abilities required for support sustainability and SS projects.

Author Contributions

Conceptualization, J.L.G.-A.; Methodology, J.L.G.-A., G.A.-H. and C.S.-R.; Software, J.L.G.-A.; Validation, J.L.G.-A. and C.S.-R.; Formal Analysis, J.L.G.-A. and E.J.-M.; Investigation, J.L.G.-A. and C.S.-R.; Resources, J.L.G.-A. and C.S.-R.; Data Curation, J.L.G.-A.; Writing-Original Draft Preparation, J.L.G.-A. and J.I.L.-B.; Writing-Review & Editing, J.L.G.-A. and E.J.-M.; Visualization, E.J.-M. and J.B.-F.; Supervision, J.L.G.-A. and J.B.-F.; Project Administration, J.L.G.-A.; Funding Acquisition, J.L.G.-A.

Funding

This research was funded by the Autonomous University of Ciudad Juarez under grant number UACJ-PIVA 2017-1 JLGarcia and the Mexican National Council for Science and Technology (CONACYT).

Acknowledgments

We appreciate the collaboration from managers and staff in maquiladora industries located in Ciudad Juarez (Mexico) for responding to our survey. We hope that our findings help to improve their production systems.

Conflicts of Interest

The authors declare no conflict of interest.

References

  1. Mustafa, Z.; Jamaluddin, Z. Six sigma critical success factors in manufacturing industries. AIP Conf. Proc. 2017, 1830, 1–8. [Google Scholar]
  2. Rizzuti, S.; de Napoli, L. An interactive robust design approach in product development. Int. J. Interact. Des. Manuf. 2018, 12, 677–688. [Google Scholar] [CrossRef]
  3. De-Felipe, D.; Benedito, E. A review of univariate and multivariate process capability indices. Int. J. Adv. Manuf. Technol. 2017, 92, 1687–1705. [Google Scholar] [CrossRef]
  4. Inal Tamer, C.; Goruroglu Ozturk, O.; Kibar, F.; Cetiner, S.; Matyar, S.; Daglioglu, G.; Yaman, A. Lean six sigma methodologies improve clinical laboratory efficiency and reduce turnaround times. J. Clin. Lab. Anal. 2018, 32, e22180. [Google Scholar] [CrossRef] [PubMed]
  5. Randell, E.W.; Short, G.; Lee, N.; Beresford, A.; Spencer, M.; Kennell, M.; Moores, Z.; Parry, D. Autoverification process improvement by six sigma approach: Clinical chemistry & immunoassay. Clin. Biochem. 2018, 55, 42–48. [Google Scholar] [PubMed]
  6. Smętkowska, M.; Mrugalska, B. Using six sigma dmaic to improve the quality of the production process: A case study. Procedia-Soc. Behav. Sci. 2018, 238, 590–596. [Google Scholar] [CrossRef]
  7. Cherrafi, A.; Elfezazi, S.; Govindan, K.; Garza-Reyes, J.A.; Benhida, K.; Mokhlis, A. A framework for the integration of green and lean six sigma for superior sustainability performance. Int. J. Prod. Res. 2017, 55, 4481–4515. [Google Scholar] [CrossRef]
  8. Zhu, Q.; Johnson, S.; Sarkis, J. Lean six sigma and environmental sustainability: A hospital perspective. Supply Chain Forum 2018, 19, 25–41. [Google Scholar] [CrossRef]
  9. Radziwill, N.M. A Six Sigma Approach to Sustainability: Continual Improvement for Social Responsibility. Qual. Manag. J. 2016, 23, 56. [Google Scholar] [CrossRef]
  10. Madhani, P.M. Six Sigma Deployment in Sales and Marketing: Enhancing Competitive Advantages. IUP J. Bus. Strategy 2017, 14, 40–63. [Google Scholar]
  11. Kwak, Y.H.; Anbari, F.T. Benefits, obstacles, and future of six sigma approach. Technovation 2006, 26, 708–715. [Google Scholar] [CrossRef]
  12. Montgomery Douglas, C. Why do lean six sigma projects sometimes fail? Qual. Reliabil. Eng. Int. 2016, 32, 1279. [Google Scholar] [CrossRef]
  13. Nourelfath, M.; Aldowaisan, T.; Hassan, J. Evaluating six sigma failure rate for inverse gaussian cycle times. Int. J. Prod. Res. 2016, 54, 6092–6101. [Google Scholar] [CrossRef]
  14. Chakravorty, S.S. Six Sigma failures: An escalation model. Oper. Manag. Res. 2009, 2, 44. [Google Scholar] [CrossRef]
  15. Coronado, R.B.; Antony, J. Critical success factors for the successful implementation of six sigma projects in organisations. TQM Mag. 2002, 14, 92–99. [Google Scholar] [CrossRef]
  16. Revere, L.; Kadipasaoglu, S.N.; Zalila, F. An empirical investigation into six sigma critical success factors. Int. J. Product. Qual. Manag. 2006, 1, 224–252. [Google Scholar] [CrossRef]
  17. Vest, J.R.; Gamm, L.D. A critical review of the research literature on six sigma, lean and studergroup’s hardwiring excellence in the United States: The need to demonstrate and communicate the effectiveness of transformation strategies in healthcare. Implement. Sci. 2009, 4, Art.35. [Google Scholar] [CrossRef] [PubMed]
  18. Chow Ann, T.; Moseley James, L. Comparisons of six sigma, lean, and human performance technology/performance improvement. Perform. Improv. 2017, 56, 6–13. [Google Scholar] [CrossRef]
  19. Brun, A. Critical success factors of six sigma implementations in italian companies. Int. J. Prod. Econ. 2011, 131, 158–164. [Google Scholar] [CrossRef]
  20. Desai, D.A.; Antony, J.; Patel, M.B. An assessment of the critical success factors for six sigma implementation in indian industries. Int. J. Product. Perform. Manag. 2012, 61, 426–444. [Google Scholar] [CrossRef]
  21. Habidin, N.F.; Yusof, S.R.M. Critical success factors of lean six sigma for the Malaysian automotive industry. Int. J. Lean Six Sigma 2013, 4, 60–82. [Google Scholar] [CrossRef]
  22. Chakraborty, A.; Chuan Tan, K. Case study analysis of six sigma implementation in service organisations. Bus. Process Manag. J. 2012, 18, 992–1019. [Google Scholar] [CrossRef]
  23. Ribeiro de Jesus, A.; Antony, J.; Lepikson, H.A.; Peixoto, A.L.A. Six sigma critical success factors in Brazilian industry. Int. J. Qual. Reliabil. Manag. 2016, 33, 702–723. [Google Scholar] [CrossRef]
  24. Cano, M.; Viza, E.; Kourouklis, A. Critical success factors for implementing continuous improvement approaches within public sector organisations. In Proceedings of the 20th Excellence in Services International Conference, Verona, Italy, 7–8 September 2017; pp. 131–146. [Google Scholar]
  25. Alhuraish, I.; Robledo, C.; Kobi, A. A comparative exploration of lean manufacturing and six sigma in terms of their critical success factors. J. Clean. Prod. 2017, 164, 325–337. [Google Scholar] [CrossRef]
  26. Psomas, E. The underlying factorial structure and significance of the six sigma difficulties and critical success factors. TQM J. 2016, 28, 530–546. [Google Scholar] [CrossRef]
  27. Marzagão, D.S.L.; Carvalho, M.M. Critical success factors for six sigma projects. Int. J. Project Manag. 2016, 34, 1505–1518. [Google Scholar] [CrossRef]
  28. Lande, M.; Shrivastava, R.L.; Seth, D. Critical success factors for lean six sigma in smes (small and medium enterprises). TQM J. 2016, 28, 613–635. [Google Scholar] [CrossRef]
  29. Kumar, M.; Khurshid, K.K.; Waddell, D. Status of quality management practices in manufacturing smes: A comparative study between Australia and the UK. Int. J. Prod. Res. 2014, 52, 6482–6495. [Google Scholar] [CrossRef]
  30. Fairul-Anwar, A.; Mohd Amran, M. Critical success factors of lean six sigma deployment: A current review. Int. J. Lean Six Sigma 2015, 6, 339–348. [Google Scholar]
  31. Antony, J.; Jiju Antony, F.; Kumar, M.; Rae Cho, B. Six sigma in service organisations: Benefits, challenges and difficulties, common myths, empirical observations and success factors. Int. J. Qual. Reliabil. Manag. 2007, 24, 294–311. [Google Scholar] [CrossRef]
  32. Raman, R.S.; Basavaraj, Y.; Prakash, A.; Garg, A. Analysis of six sigma methodology in exporting manufacturing organizations and benefits derived: A review. In Proceedings of the 2017 3rd International Conference on Computational Intelligence & Communication Technology (CICT), Ghaziabad, India, 9–10 February 2017; pp. 1–5. [Google Scholar]
  33. García-Alcaraz, J.; Avelar-Sosa, L.; Latorre-Biel, J.; Jiménez-Macías, E.; Alor-Hernández, G. Role of human knowledge and communication on operational benefits gained from six sigma. Sustainability 2017, 9, 1721. [Google Scholar] [CrossRef]
  34. Prasad, V.M. Human resource factors for six sigma success. Rev. Manag. Econ. Eng. 2011, 10, 91–105. [Google Scholar]
  35. Laureani, A.; Antony, J. Leadership—A critical success factor for the effective implementation of lean six sigma. Total Qual. Manag. Bus. Excell. 2018, 29, 502–523. [Google Scholar] [CrossRef]
  36. Tata, R.M.; Jones, G.D. Six sigma culture as a management principle. Transfusion 2011, 51, 1604–1608. [Google Scholar] [CrossRef] [PubMed]
  37. Harold, K. Six sigma and the project management office. In Project Management Best Practices; John Wiley & Sons, Inc.: Hoboken, NJ, USA, 2014; pp. 565–580. [Google Scholar]
  38. Johannsen, F.; Leist, S.; Zellner, G. Six sigma as a business process management method in services: Analysis of the key application problems. Inf. Syst. e-Bus. Manag. 2011, 9, 307–332. [Google Scholar] [CrossRef]
  39. Sabet, E.; Adams, E.; Yazdani, B. Quality management in heavy duty manufacturing industry: Tqm vs. Six sigma. Total Qual. Manag. Bus. Excell. 2016, 27, 215–225. [Google Scholar] [CrossRef]
  40. Harry, M.J. Six sigma: A breakthrough strategy for profitability. Qual. Prog. 1998, 31, 60–64. [Google Scholar]
  41. Drohomeretski, E.; Gouvea da Costa, S.E.; Pinheiro de Lima, E.; Garbuio, P.A.D.R. Lean, six sigma and lean six sigma: An analysis based on operations strategy. Int. J. Prod. Res. 2014, 52, 804–824. [Google Scholar] [CrossRef]
  42. Fatemi, S.; Franchetti, M.J. An application of sustainable lean and green strategy with a six sigma approach on a manufacturing system. Int. J. Six Sigma Compet. Advant. 2016, 10, 62–75. [Google Scholar] [CrossRef]
  43. Andersson, R.; Hilletofth, P.; Manfredsson, P.; Hilmola, O.-P. Lean six sigma strategy in telecom manufacturing. Ind. Manag. Data Syst. 2014, 114, 904–921. [Google Scholar] [CrossRef]
  44. Kumar, M.; Antony, J.; Antony, F.J.; Madu, C.N. Winning customer loyalty in an automotive company through six sigma: A case study. Qual. Reliabil. Eng. Int. 2007, 23, 849–866. [Google Scholar] [CrossRef] [Green Version]
  45. Niemes, J. Taking sales success to new heights with six sigma. Natl. Product. Rev. 1999, 18, 37–41. [Google Scholar] [CrossRef]
  46. De Jesus, A.R.; Antony, J.; Lepikson, H.A.; Teixeira Cavalcante, C.A.M. Key observations from a survey about six sigma implementation in brazil. Int. J. Product. Perform. Manag. 2015, 64, 94–111. [Google Scholar] [CrossRef]
  47. Douglas, A.; Douglas, J.; Ochieng, J. Lean six sigma implementation in east Africa: Findings from a pilot study. TQM J. 2015, 27, 772–780. [Google Scholar] [CrossRef]
  48. Kavčič, K.; Gošnik, D. Lean six sigma education in manufacturing companies: The case of transitioning markets. Kybernetes 2016, 45, 1421–1436. [Google Scholar] [CrossRef]
  49. Laureani, A.; Antony, J. Leadership characteristics for lean six sigma. Total Qual. Manag. Bus. Excell. 2017, 28, 405–426. [Google Scholar] [CrossRef]
  50. Arumugam, V.; Antony, J.; Linderman, K. The influence of challenging goals and structured method on six sigma project performance: A mediated moderation analysis. Eur. J. Oper. Res. 2016, 254, 202–213. [Google Scholar] [CrossRef]
  51. Zu, X.; Robbins, T.L.; Fredendall, L.D. Mapping the critical links between organizational culture and tqm/six sigma practices. Int. J. Prod. Econ. 2010, 123, 86–106. [Google Scholar] [CrossRef]
  52. Chen, S.; Fan, S.; Xiong, J.; Zhang, W. The design of JMP/SAP based six sigma management system and its application in smed. Procedia Eng. 2017, 174, 416–424. [Google Scholar] [CrossRef]
  53. De Freitas, J.G.; Costa, H.G.; Ferraz, F.T. Impacts of lean six sigma over organizational sustainability: A survey study. J. Clean. Prod. 2017, 156, 262–275. [Google Scholar] [CrossRef]
  54. Parast, M.M. The effect of six sigma projects on innovation and firm performance. Int. J. Project Manag. 2011, 29, 45–55. [Google Scholar] [CrossRef]
  55. Swink, M.; Jacobs, B.W. Six sigma adoption: Operating performance impacts and contextual drivers of success. J. Oper. Manag. 2012, 30, 437–453. [Google Scholar] [CrossRef]
  56. Shafer, S.M.; Moeller, S.B. The effects of six sigma on corporate performance: An empirical investigation. J. Oper. Manag. 2012, 30, 521–532. [Google Scholar] [CrossRef]
  57. Ertürk, M.; Tuerdi, M.; Wujiabudula, A. The effects of six sigma approach on business performance: A study of white goods (home appliances) sector in turkey. Procedia-Soc. Behav. Sci. 2016, 229, 444–452. [Google Scholar] [CrossRef]
  58. Moosa, K.; Sajid, A. Critical analysis of six sigma implementation. Total Qual. Manag. Bus. Excell. 2010, 21, 745–759. [Google Scholar] [CrossRef]
  59. Boon Sin, A.; Zailani, S.; Iranmanesh, M.; Ramayah, T. Structural equation modelling on knowledge creation in six sigma dmaic project and its impact on organizational performance. Int. J. Prod. Econ. 2015, 168, 105–117. [Google Scholar] [CrossRef]
  60. Louhaichi, M.; Yigezu, Y.A.; Werner, J.; Dashtseren, L.; El-Shater, T.; Ahmed, M. Financial incentives: Possible options for sustainable rangeland management? J. Environ. Manag. 2016, 180, 493–503. [Google Scholar] [CrossRef] [PubMed]
  61. Anand, G.; Ward, P.T.; Tatikonda, M.V. Role of explicit and tacit knowledge in six sigma projects: An empirical examination of differential project success. J. Oper. Manag. 2010, 28, 303–315. [Google Scholar] [CrossRef]
  62. McCarty, T.; Jordan, M.; Probst, D. Six Sigma for Sustainability: How Organizations Design and Deploy Winning Environmental Programs; McGraw-Hill: New York, NY, USA, 2011. [Google Scholar]
  63. Cherrafi, A.; Elfezazi, S.; Chiarini, A.; Mokhlis, A.; Benhida, K. The integration of lean manufacturing, six sigma and sustainability: A literature review and future research directions for developing a specific model. J. Clean. Prod. 2016, 139, 828–846. [Google Scholar] [CrossRef]
  64. Tan Owee, K.; Tan Su, Y.; Amran, R.; Choi Sang, L. Lean six sigma sustainability framework: A case study on an automotive company. Asian J. Sci. Res. 2016, 9, 279–283. [Google Scholar]
  65. Jami, A.A.N.; Searcy, C.; Jenab, K. Applying the principles of six sigma to environmental management systems. Int. J. Appl. Decis. Sci. 2012, 5, 215–232. [Google Scholar] [CrossRef]
  66. Habidin, N.F.; Yusof, S.M. Relationship between lean six sigma, environmental management systems, and organizational performance in the Malaysian automotive industry. Int. J. Automot. Technol. 2012, 13, 1119–1125. [Google Scholar] [CrossRef]
  67. Ehnert, I. Sustainability and human resource management. In The Future of Employment Relations; Palgrave Macmillan: Basingstoke, UK, 2011; pp. 215–237. [Google Scholar]
  68. Daily, B.F.; Huang, S.-C. Achieving sustainability through attention to human resource factors in environmental management. Int. J. Oper. Prod. Manag. 2001, 21, 1539–1552. [Google Scholar] [CrossRef]
  69. IBM Corp. IBM SPSS Statistics for Windows, version 24.0.; IBM Corp: Armonk, NY, USA, 2016. [Google Scholar]
  70. Yaşlıoğlu, M.M.; Şap, Ö.; Toplu, D. An investigation of the characteristics of learning organizations in turkish companies: Scale validation. Procedia-Soc. Behav. Sci. 2014, 150, 726–734. [Google Scholar] [CrossRef]
  71. Hair, J.F.; Ringle, C.M.; Sarstedt, M. Editorial-partial least squares structural equation modeling: Rigorous applications, better results and higher acceptance. Long Range Plan. 2013, 46, 1–12. [Google Scholar] [CrossRef]
  72. Kock, N. Warppls 5.0 User Manual; ScriptWarp Systems: Laredo, TX, USA, 2015. [Google Scholar]
  73. ScripWarp Systems. Warppls v.5. Software; ScripWarp Systems: Laredo, TX, USA, 2015. [Google Scholar]
  74. García-Alcaraz, J.L.; Maldonado-Macías, A.A.; Hernandez, G.A.; Jiménez-Macías, E.; Muro, J.C.S.D.; Blanco-Fernández, J. Impact of human factor on flexibility and supply chain agility of la rioja wineries. Eur. J. Ind. Eng. 2017, 11, 663–682. [Google Scholar] [CrossRef]
  75. Moqbel, M.; Kock, N. Unveiling the dark side of social networking sites: Personal and work-related consequences of social networking site addiction. Inf. Manag. 2018, 55, 109–119. [Google Scholar] [CrossRef]
  76. Coleman, S. Six sigma: An opportunity for statistics and for statisticians. Significance 2008, 5, 94–96. [Google Scholar] [CrossRef]
  77. Sabry, A. Factors critical to the success of six-sigma quality program and their influence on performance indicators in some of lebanese hospitals. Arab Econ. Bus. J. 2014, 9, 93–114. [Google Scholar] [CrossRef]
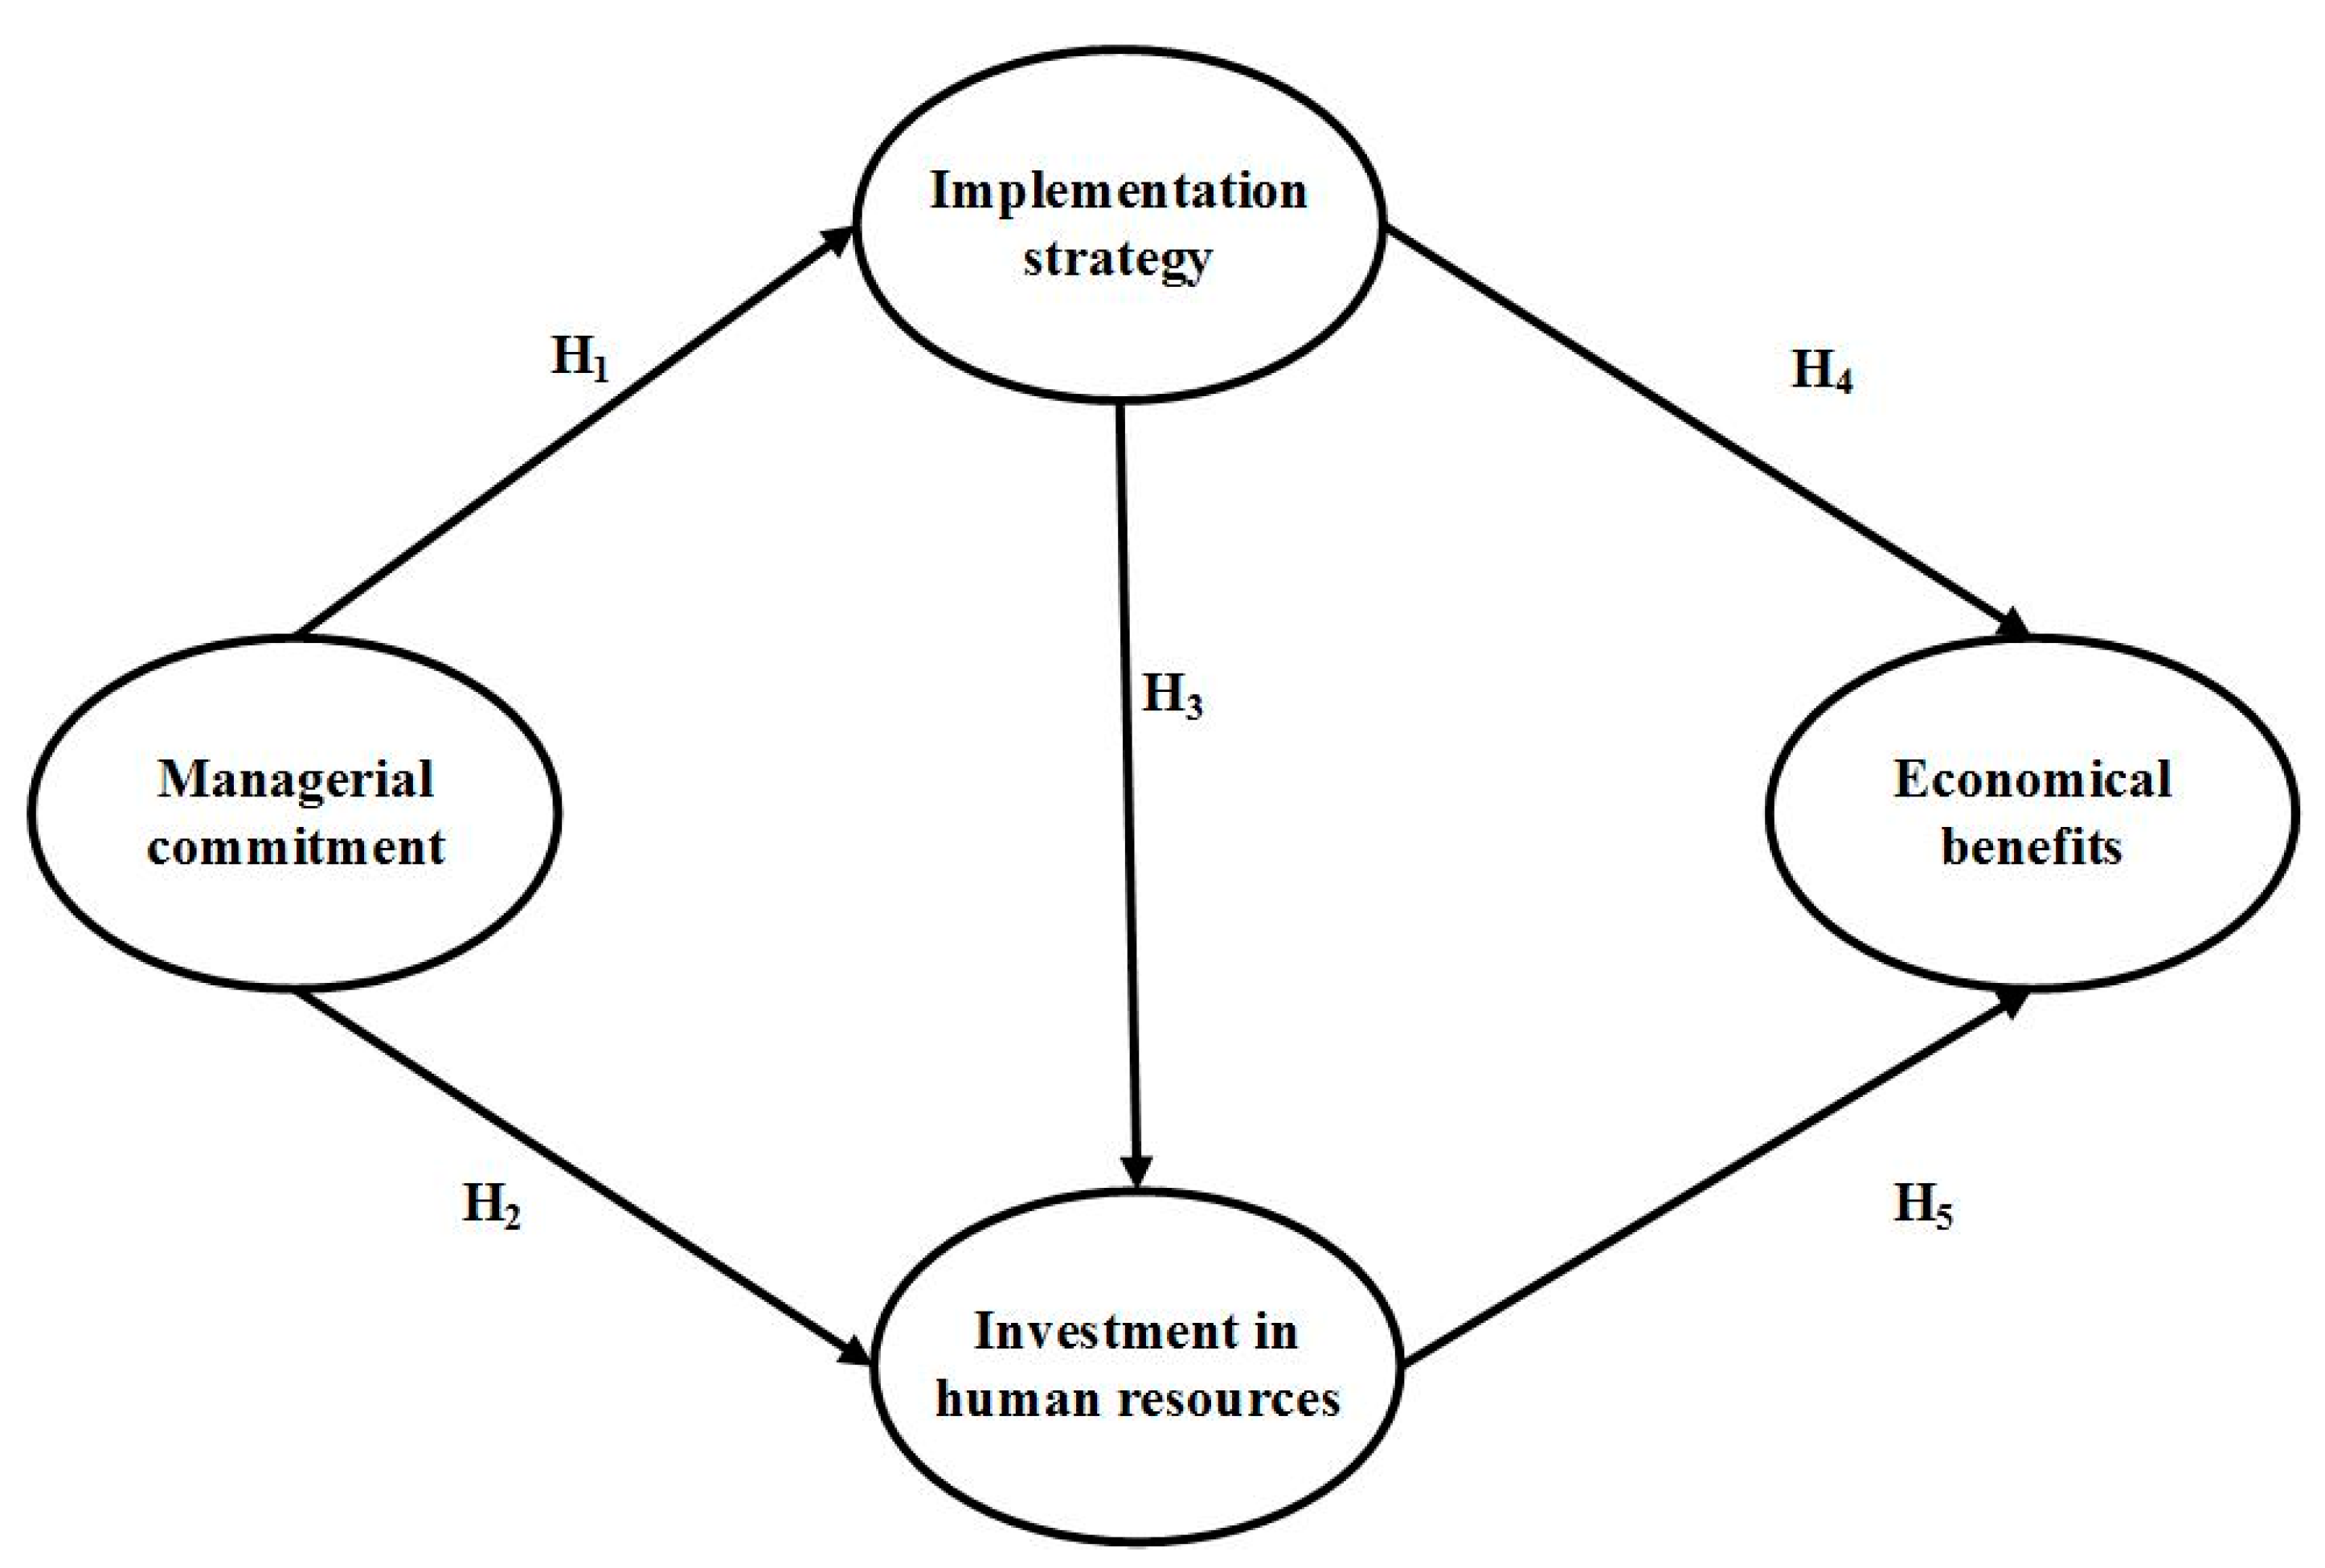
Figure 1. Proposed model.
Sustainability 10 01828 g001
Figure 2. Certification in SS in surveyed persons.
Sustainability 10 01828 g002
Figure 3. Industrial sector surveyed.
Sustainability 10 01828 g003
Figure 4. Evaluated model.
Sustainability 10 01828 g004
Table 1. Sample description.
CertificationAeronauticElectricAutomotiveElectronicMedicalOther
Champion 026002
Master Black Belt2533505
Black Belt 31645949
Green Belt15332810
Yellow Belt1462744
Table 2. Descriptive analysis of the sample.
Acronym ItemMedianIR
MC3Management encourages interdepartmental cooperation in planning six sigma projects3.591.62
MC5Management assigns the appropriate personnel for each project3.531.6
MC4Management requests reports on the progress of projects in each department3.521.58
MC2Management encourages knowledge transfer across different departments and the organisational structure3.441.41
MC1Management regularly reviews the progress of six sigma projects3.241.14
IS5Department heads review clients’ demands and complaints before creating an six sigma project3.992.18
IS4Improvement teams are aware of clients’ requirements 3.952.25
IS1There is an organisational structure that supports six sigma including Black Belts (BBs), Green Belts (GBs) and Yellow Belts (YBs)3.792.01
IS2Meetings are held between six sigma project leaders and project team members to enable monitoring 3.731.94
IS3Six Sigma projects are related to clients’ demands3.721.81
ET4The workload is adjusted to allow time for education and training 3.671.84
ET3Black Belts (BBs) and Green Belts (GBs) are involved in the analysis of problems associated with the six sigma project3.661.81
ET5Materials and software are provided for analysing the information3.621.67
ET2Black belts (BBs) and Green Belts (GBs) are assigned to advise on six sigma projects3.421.5
ER1There is a regular training schedule3.241.16
IN3Project outcomes are considered in career performance and impact on the income of project members3.441.52
IN2Regular awards are presented for the best six sigma projects3.261.14
IN4The abandonment of an six sigma project affects promotion to higher positions3.141.05
IN1Award ceremonies are held for certification as Black belts (BBs) and Green Belts (GBs), etc.3.120.95
IN5The outcomes of a six sigma project affect annual bonuses or salary increases at year end 3.060.78
ECB1There are savings in production costs3.992.29
ECB5There is reduced wastage3.992.34
ECB2A competitive advantage is created for the company3.912.3
ECB4There are increased sales3.872.12
ECB3There are increased returns on investment3.812.08
Table 3. Validation indexes.
IndexManagerial commitmentImplementation strategyEconomical benefitsInvestment in human resources
R2-Squared 0.3810.4840.434
Adjusted R2-Squared 0.3790.4810.430
Compose reliability0.9190.9190.9230.920
Cronbach’s alpha0.8900.8900.8960.826
Average variance extracted0.6950.6950.7060.852
Variance inflation index2.0472.0711.9901.790
Q2-Squared 0.3820.4860.436
Table 4. Sum of indirect effects.
ToFrom
Managerial commitmentImplementation strategy
Economical benefitsβ = 0.486 (p < 0.001)
ES = 0.282
β = 0.069 (p < 0.001)
ES = 0.046
Investment in human resourcesβ = 0.157 (p < 0.001)
ES = 0.098
Table 5. Total effects.
ToFrom
Managerial commitmentImplementation strategyInvestment in human resources
Economical benefitsβ = 0.617 (p < 0.001)
ES = 0.381
Investment in human resourcesβ = 0.486 (p < 0.001)
ES = 0.282
β = 0.578 (p < 0.001)
ES = 0.380
β = 0.274 (p < 0.001)
ES = 0.150
Investment in human resourcesβ = 0.627 (p < 0.001)
ES = 0.394
β = 0.254 (p < 0.001)
ES = 0.138