Resource Dynamism of the Rwandan Economy: An Emergy Approach

 , ,
, ,
Abstract
:1. Introduction
2. Materials and Methods
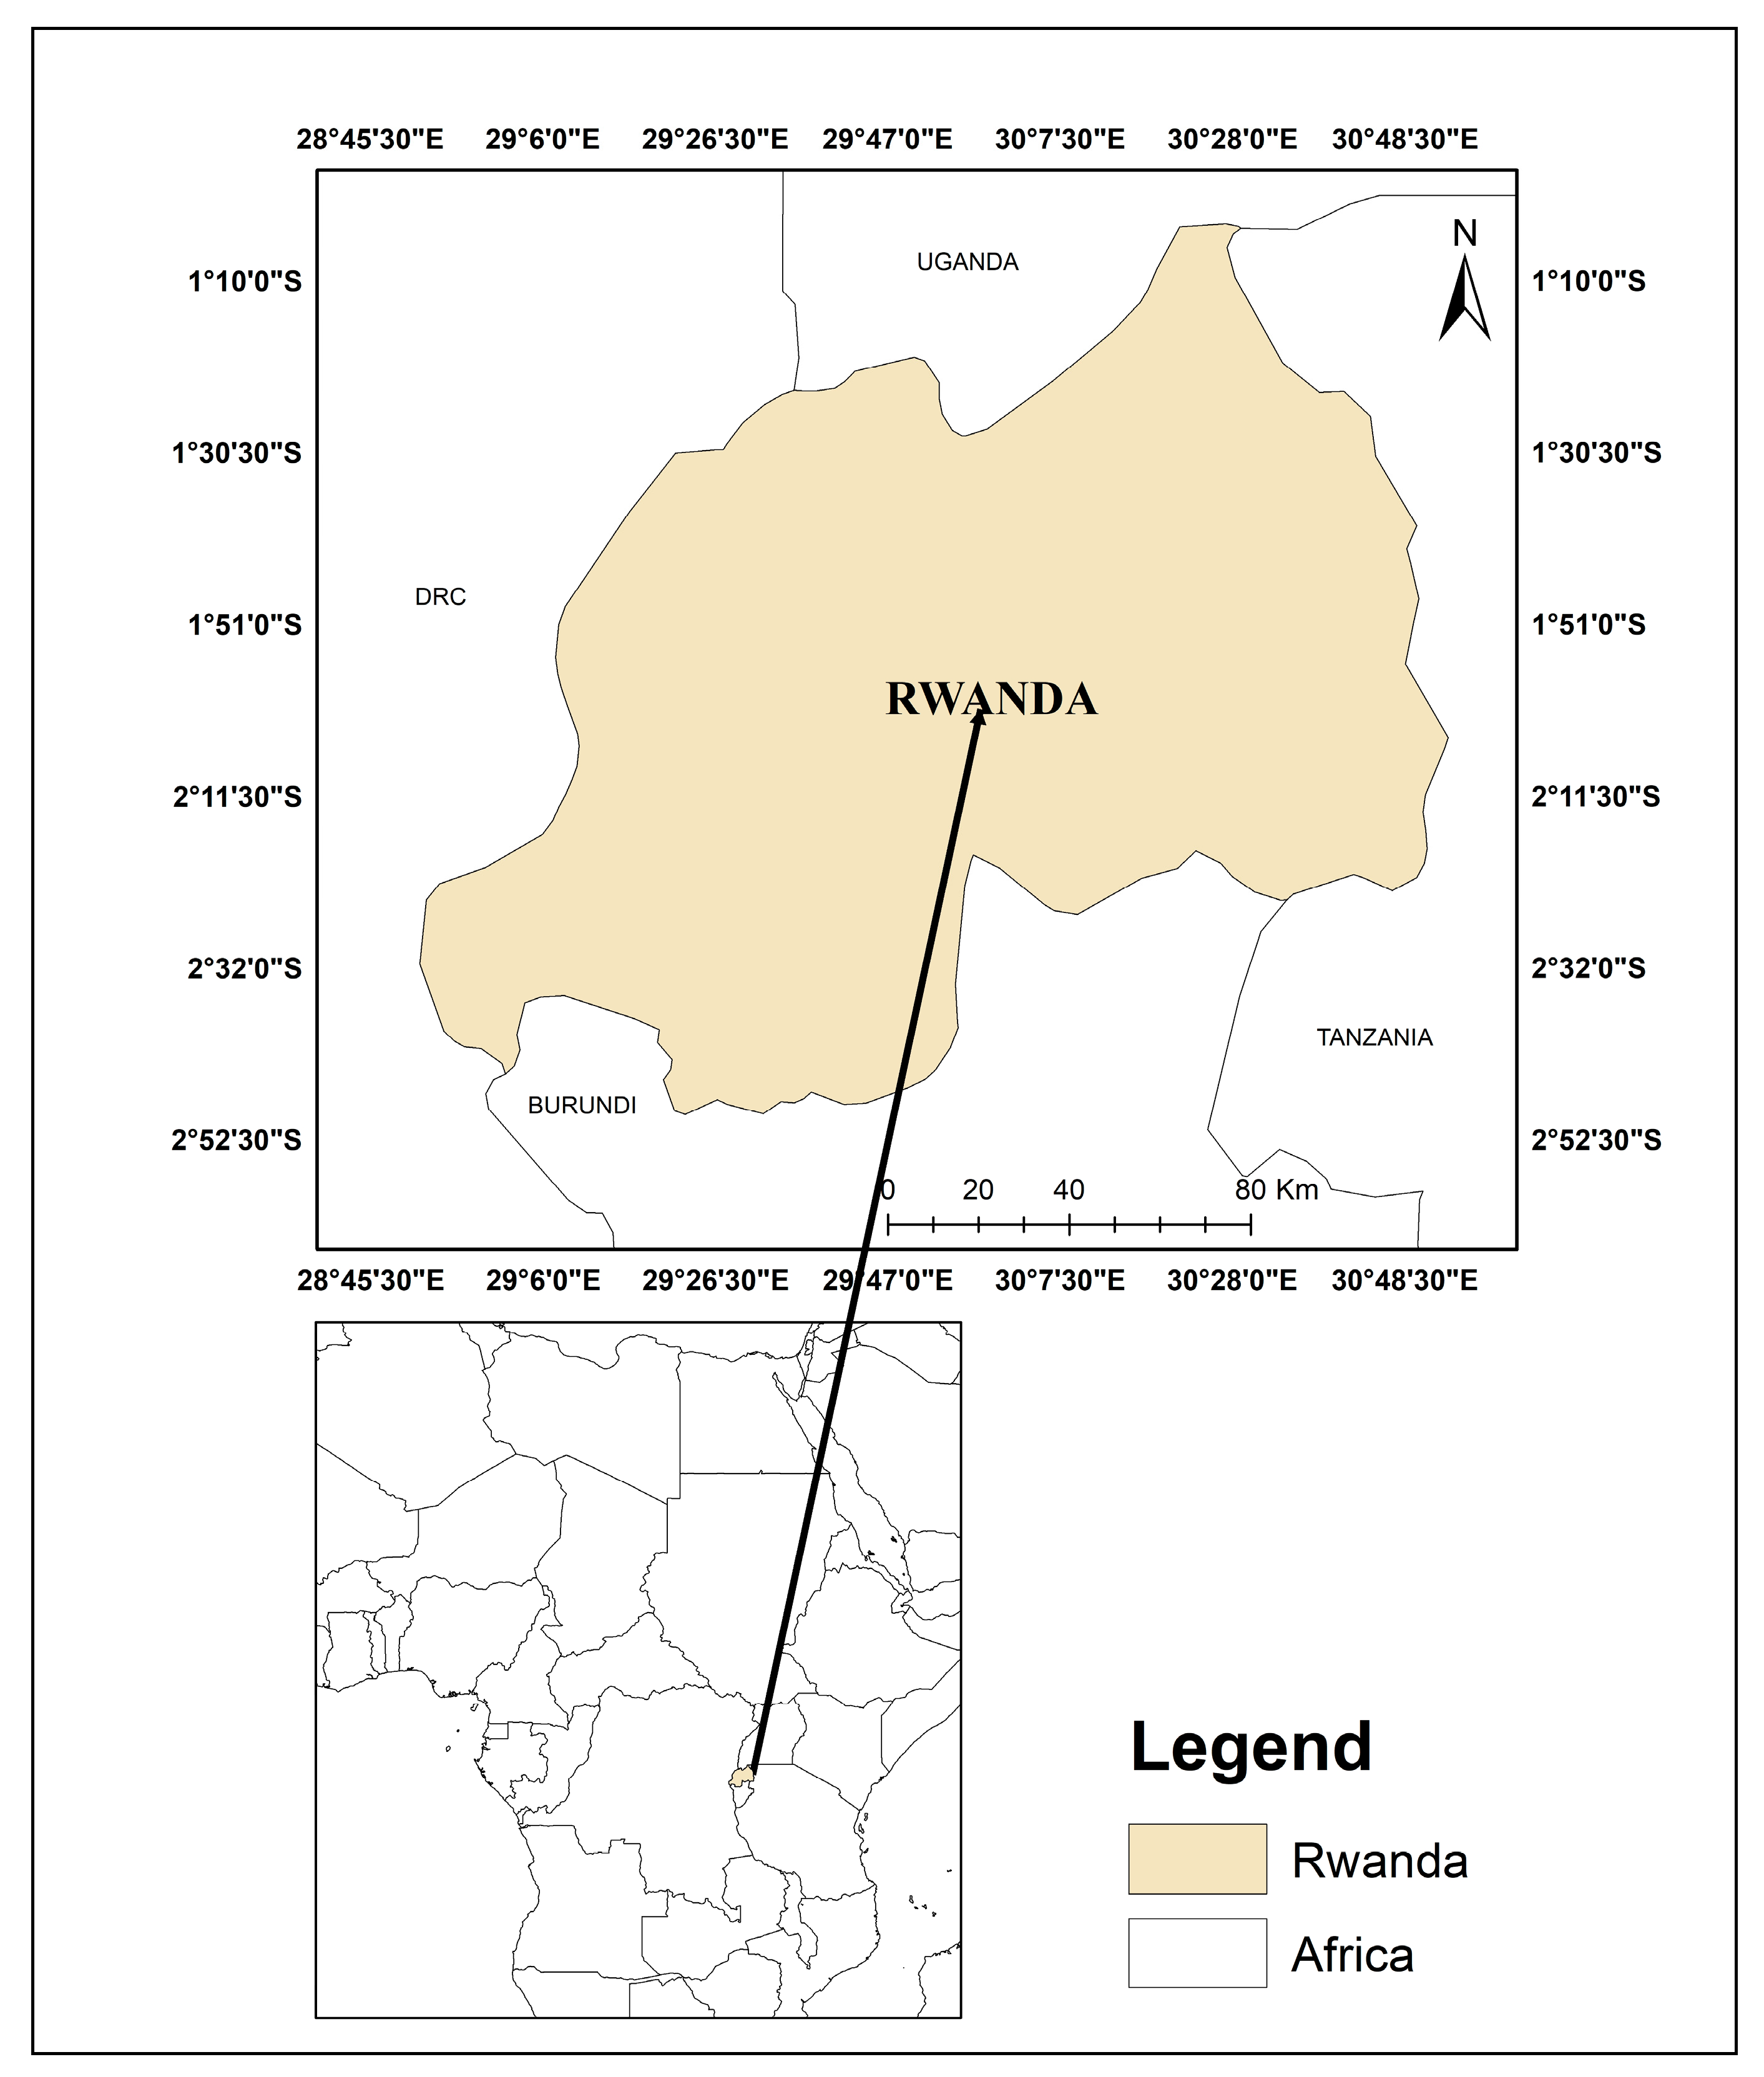
2.1. Study Area
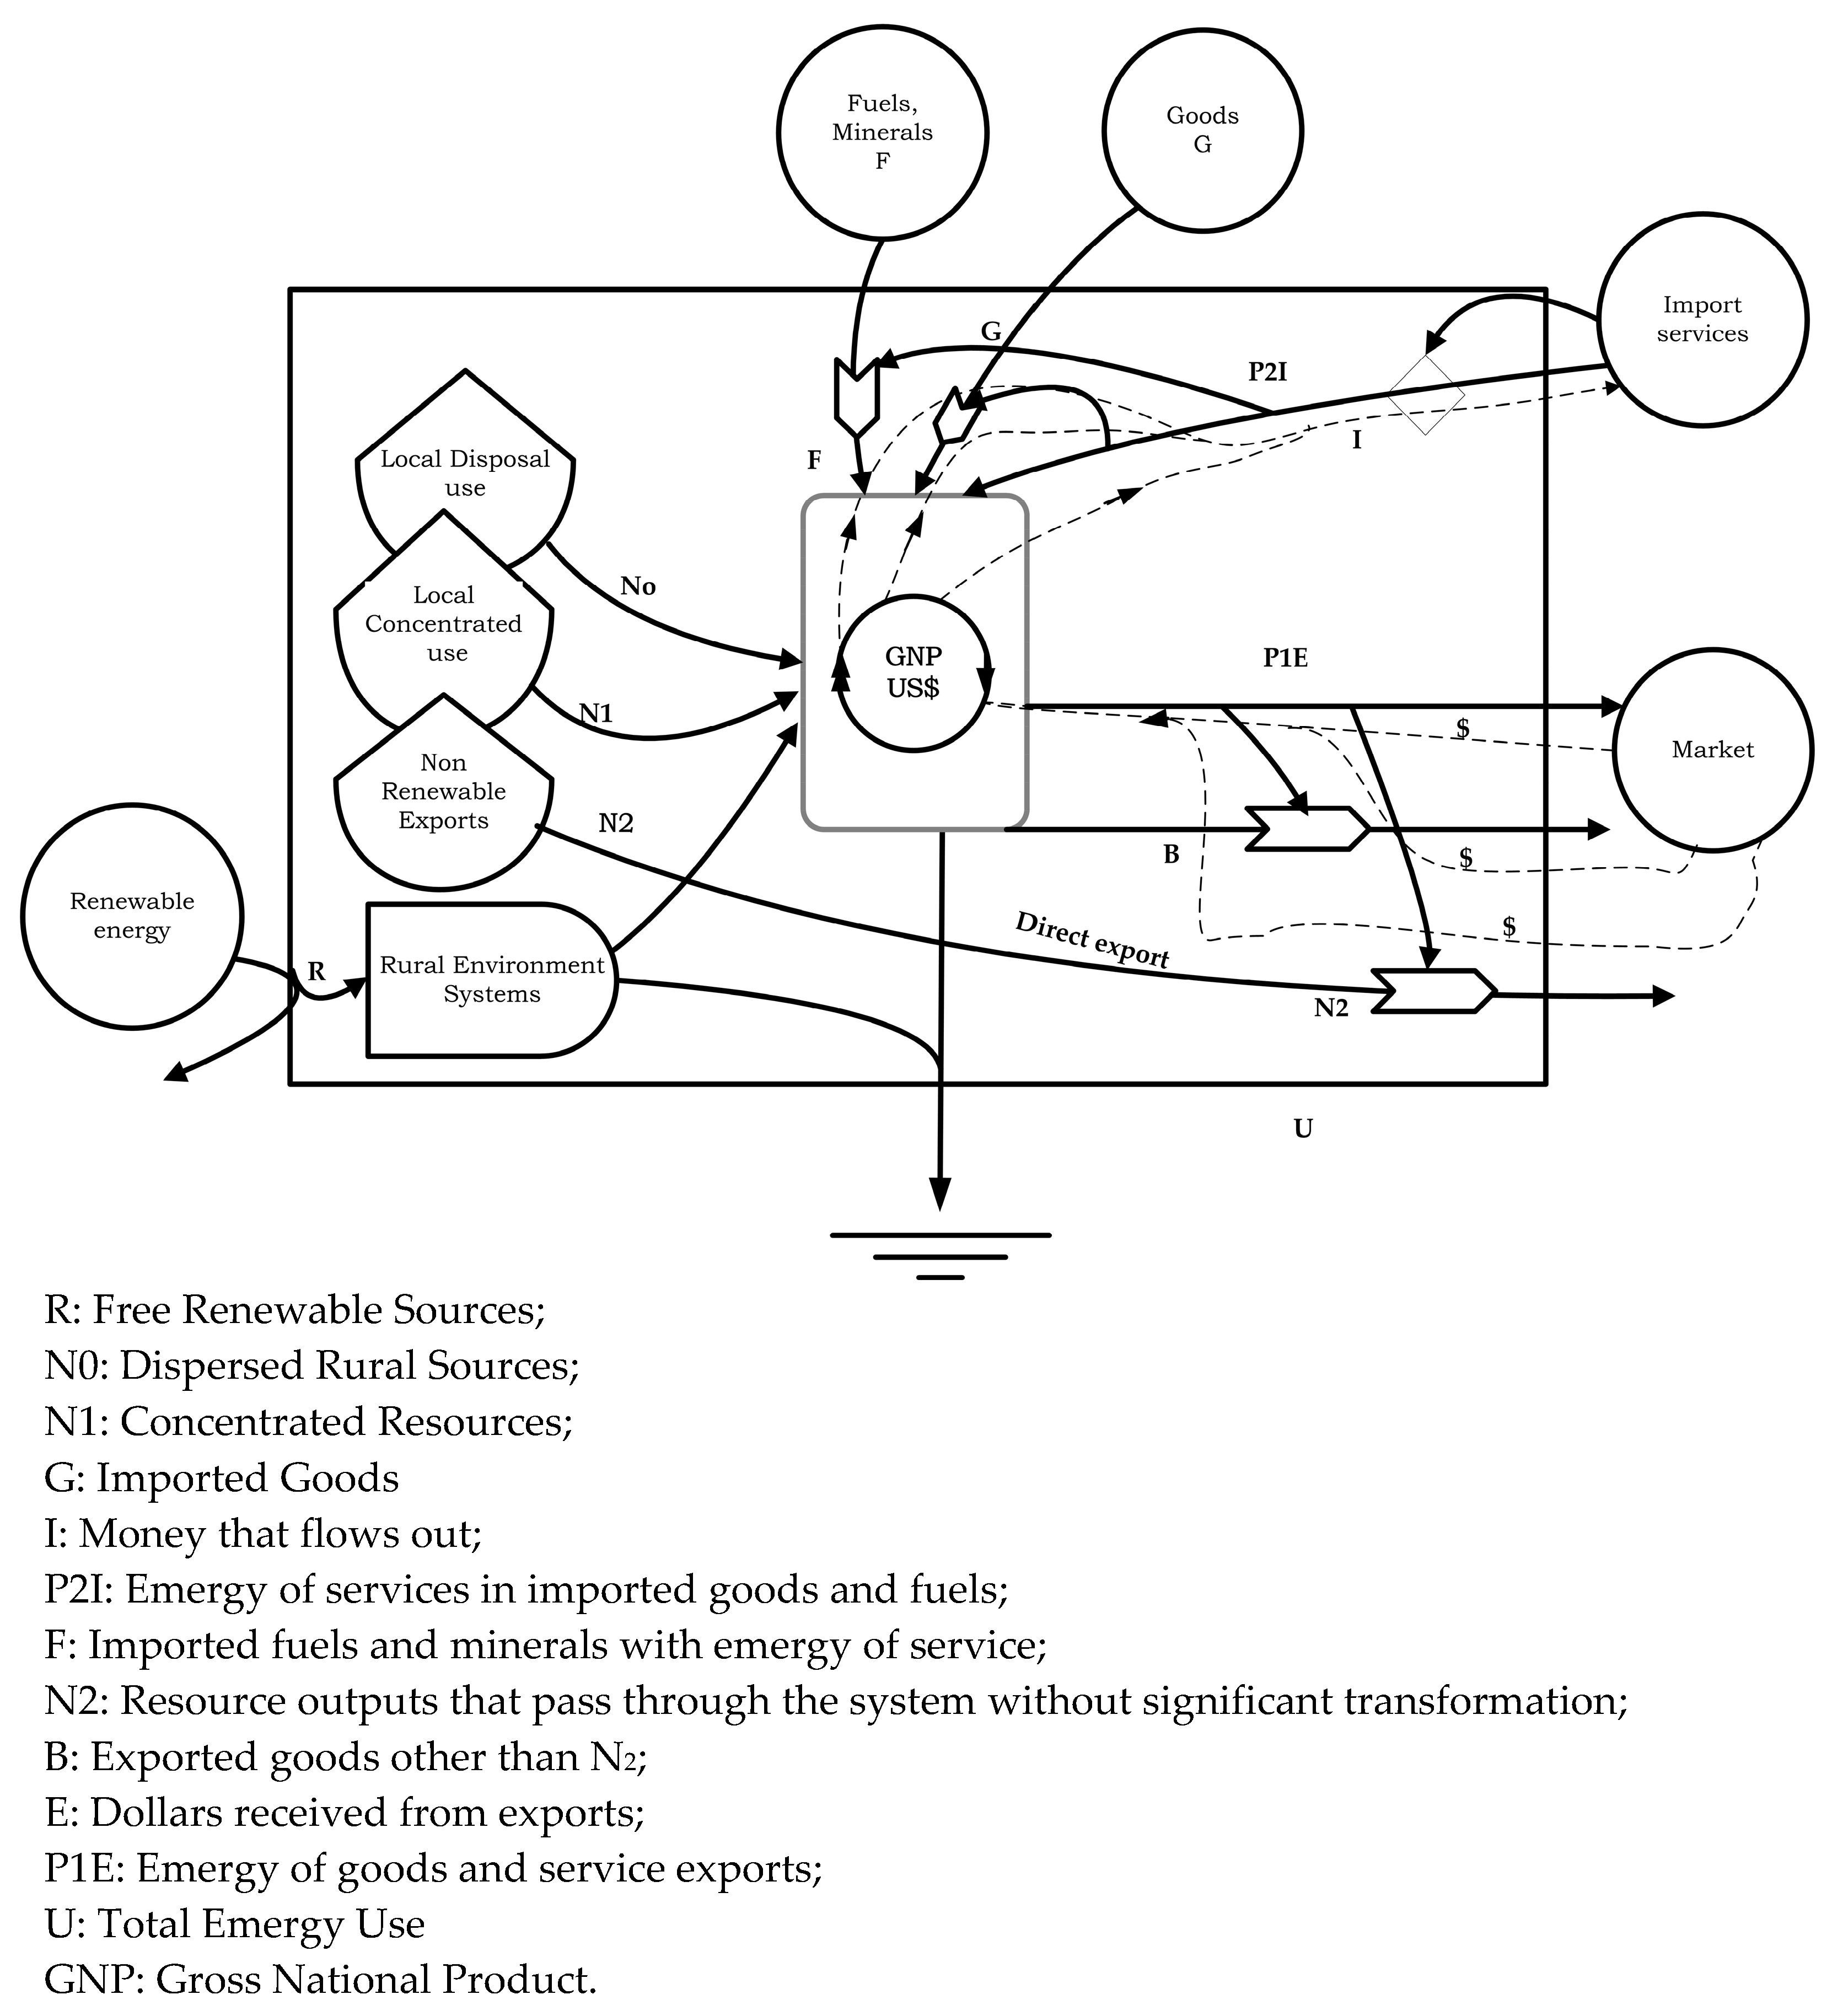
2.2. Emergy Analysis
3. Results and Discussions
3.1. Resource Accounting
3.2. Emergy-Based Indicators
3.3. Emergy Indicator Analysis by the Economic Level of a Country
4. Conclusions
Author Contributions
Acknowledgments
Conflicts of Interest
Appendix A

| No | Item | Pre-Genocide | Post-Genocide | |||||||
|---|---|---|---|---|---|---|---|---|---|---|
| 1975 | 1981 | 1985 | 1990 | 1995 | 2000 | 2005 | 2012 | 2016 | ||
| Renewable sources flow within Rwanda | ||||||||||
| 1 | Sunlight | 1.31 × 10²⁰ | 1.31 × 10²⁰ | 1.31 × 10²⁰ | 1.31 × 10²⁰ | 1.31 × 10²⁰ | 1.31 × 10²⁰ | 1.31 × 10²⁰ | 1.31 × 10²⁰ | 1.31 × 10²⁰ |
| 2 | Wind, kinetic | 6.92 × 10¹⁸ | 6.92 × 10¹⁸ | 6.92 × 10¹⁸ | 6.92 × 10¹⁸ | 6.92 × 10¹⁸ | 6.92 × 10¹⁸ | 6.92 × 10¹⁸ | 6.92 × 10¹⁸ | 6.92 × 10¹⁸ |
| 3 | Rain, geo potential | 2.92 × 10²² | 2.92 × 10²² | 2.92 × 10²² | 2.92 × 10²² | 2.92 × 10²² | 2.92 × 10²² | 2.92 × 10²² | 2.92 × 10²² | 2.92 × 10²² |
| 4 | Rain, chemical | 4.77 × 10²¹ | 4.77 × 10²¹ | 4.77 × 10²¹ | 4.77 × 10²¹ | 4.77 × 10²¹ | 4.77 × 10²¹ | 4.77 × 10²¹ | 4.77 × 10²¹ | 4.77 × 10²¹ |
| 5 | Earth cycle | 2.85 × 10²¹ | 2.85 × 10²¹ | 2.85 × 10²¹ | 2.85 × 10²¹ | 2.85 × 10²¹ | 2.85 × 10²¹ | 2.85 × 10²¹ | 2.85 × 10²¹ | 2.85 × 10²¹ |
| Indigenous renewable resources (sej/yr) | ||||||||||
| 6 | Forestry extraction | 1.71 × 10²¹ | 2.08 × 10²¹ | 2.39 × 10²¹ | 2.82 × 10²¹ | 2.22 × 10²¹ | 3.29 × 10²¹ | 3.69 × 10²¹ | 4.49 × 10²¹ | 4.67 × 10²¹ |
| 7 | Hydro-electricity | 5.65 × 10¹⁹ | 7.82 × 10¹⁹ | 9.13 × 10¹⁹ | 7.81 × 10¹⁹ | 7.45 × 10¹⁹ | 2.03 × 10²⁰ | 9.14 × 10¹⁹ | 3.83 × 10²⁰ | 6.88 × 10²⁰ |
| 8 | Crop production | 1.44 × 10²¹ | 1.89 × 10²¹ | 2.10 × 10²¹ | 1.96 × 10²¹ | 1.29 × 10²¹ | 1.95 × 10²¹ | 3.52 × 10²¹ | 5.52 × 10²¹ | 3.36 × 10²¹ |
| 9 | Livestock | 1.34 × 10²¹ | 1.82 × 10²¹ | 1.92 × 10²¹ | 2.04 × 10²¹ | 1.62 × 10²¹ | 2.46 × 10²¹ | 3.47 × 10²¹ | 4.65 × 10²¹ | 6.73 × 10²¹ |
| Non-renewable sources flow within Rwanda | ||||||||||
| 10 | Top soil loss | 3.21 × 10¹⁸ | 3.21 × 10¹⁸ | 3.21 × 10¹⁸ | 3.21 × 10¹⁸ | 3.21 × 10¹⁸ | 3.21 × 10¹⁸ | 3.21 × 10¹⁸ | 3.21 × 10¹⁸ | 3.21 × 10¹⁸ |
| 11 | Cassiterite | 1.88 × 10¹⁸ | 1.57 × 10¹⁸ | 5.99 × 10¹⁷ | 8.59 × 10¹⁷ | 2.10 × 10¹⁷ | 3.14 × 10¹⁷ | 3.30 × 10¹⁸ | 3.96 × 10¹⁸ | 3.04 × 10¹⁸ |
| 12 | Coltan | 6.52 × 10¹⁶ | 0.00E+00 | 0.00E+00 | 0.00E+00 | 1.12 × 10¹⁷ | 1.24 × 10¹⁸ | 1.58 × 10¹⁸ | 2.37 × 10¹⁸ | 2.63 × 10¹⁸ |
| 13 | Wolframite | 7.91 × 10¹⁸ | 5.20 × 10¹⁸ | 3.90 × 10¹⁸ | 1.96 × 10¹⁸ | 1.90 × 10¹⁷ | 1.44 × 10¹⁸ | 1.03 × 10¹⁸ | 1.75 × 10¹⁹ | 1.72 × 10¹⁸ |
| 14 | Other minerals | 4.20 × 10¹⁶ | 0.00 | 7.45 × 10¹⁶ | 1.68 × 10¹⁷ | 0.00 | 0.00 | 8.98 × 10¹⁸ | 1.17 × 10¹⁷ | 0.00E+00 |
| 15 | Methane gas | 0.00 | 0.00 | 1.53 × 10¹⁸ | 1.48 × 10¹⁸ | 1.43 × 10¹⁷ | 2.98 × 10¹⁷ | 1.17 × 10¹⁸ | 1.53 × 10¹⁸ | 4.33 × 10¹⁹ |
| Imported Fuel | ||||||||||
| 16 | Fuel: Petroleum Products (j) | 8.45 × 10¹⁹ | 1.66 × 10²⁰ | 2.19 × 10²⁰ | 2.25 × 10²⁰ | 1.47 × 10²⁰ | 2.30 × 10²⁰ | 3.08 × 10²⁰ | 6.60 × 10²⁰ | 8.11 × 10²⁰ |
| Import Goods and Services | ||||||||||
| 17 | Construction Material | 1.31 × 10²⁰ | 2.55 × 10²⁰ | 2.36 × 10²⁰ | 1.76 × 10²⁰ | 9.56 × 10¹⁹ | 1.50 × 10²⁰ | 9.23 × 10²⁰ | 1.70 × 10²¹ | 1.77 × 10²¹ |
| 18 | Food products | 6.46 × 10²⁰ | 3.83 × 10²¹ | 6.23 × 10²¹ | 1.58 × 10²¹ | 2.96 × 10²¹ | 1.79 × 10²¹ | 2.29 × 10²¹ | 4.42 × 10²¹ | 6.84 × 10²¹ |
| 19 | Transport, machines and tools | 5.21 × 10²⁰ | 1.11 × 10²¹ | 1.30 × 10²¹ | 1.02 × 10²¹ | 1.26 × 10²¹ | 1.53 × 10²¹ | 4.47 × 10²¹ | 1.30 × 10²² | 1.29 × 10²² |
| 20 | Fertilisers | 2.11 × 10¹⁸ | 3.21 × 10¹⁸ | 2.88 × 10¹⁹ | 6.35 × 10¹⁷ | 9.49 × 10¹⁸ | 4.58 × 10¹⁹ | 2.47 × 10²⁰ | 2.47 × 10²⁰ | 2.47 × 10²⁰ |
| 21 | Miscellaneous | 6.53 × 10²⁰ | 1.33 × 10²¹ | 1.10 × 10²¹ | 8.19 × 10²⁰ | 7.47 × 10²⁰ | 7.99 × 10²⁰ | 2.91 × 10²¹ | 5.31 × 10²¹ | 5.15 × 10²¹ |
| 22 | Import services | 3.25 × 10²⁰ | 2.28 × 10²¹ | 2.49 × 10²¹ | 2.09 × 10²¹ | 1.19 × 10²¹ | 1.21 × 10²¹ | 2.29 × 10¹⁹ | 7.69 × 10¹⁹ | 1.42 × 10²¹ |
| Export Goods and Services | ||||||||||
| 23 | Coffee | 7.59 × 10¹⁹ | 8.26 × 10¹⁹ | 9.19 × 10¹⁹ | 9.15 × 10¹⁹ | 4.28 × 10¹⁹ | 4.45 × 10¹⁹ | 5.27 × 10¹⁹ | 4.83 × 10¹⁹ | 5.30 × 10¹⁹ |
| 24 | Tea | 3.11 × 10¹⁸ | 5.09 × 10¹⁸ | 7.34 × 10¹⁸ | 9.40 × 10¹⁸ | 3.16 × 10¹⁸ | 1.08 × 10¹⁹ | 1.34 × 10¹⁹ | 1.80 × 10¹⁹ | 1.95 × 10¹⁹ |
| 25 | Minerals | 9.90 × 10¹⁸ | 6.77 × 10¹⁸ | 4.57 × 10¹⁸ | 2.99 × 10¹⁸ | 5.12 × 10¹⁷ | 3.00 × 10¹⁸ | 1.24 × 10¹⁹ | 2.40 × 10¹⁹ | 7.38 × 10¹⁸ |
| 26 | Miscellaneous | 4.17E+16 | 1.22 × 10²⁰ | 2.83 × 10²⁰ | 1.17 × 10²⁰ | 2.04 × 10²⁰ | 7.83 × 10¹⁹ | 4.22 × 10²¹ | 1.14 × 10²² | 1.02 × 10²¹ |
| 27 | Export services | 6.35 × 10²⁰ | 1.83 × 10²¹ | 1.15 × 10²¹ | 8.39 × 10²⁰ | 2.32 × 10²⁰ | 1.21 × 10²¹ | 6.05 × 10²⁰ | 3.73 × 10²¹ | 7.51 × 10²¹ |
| Additional information of the Rwandan economy | ||||||||||
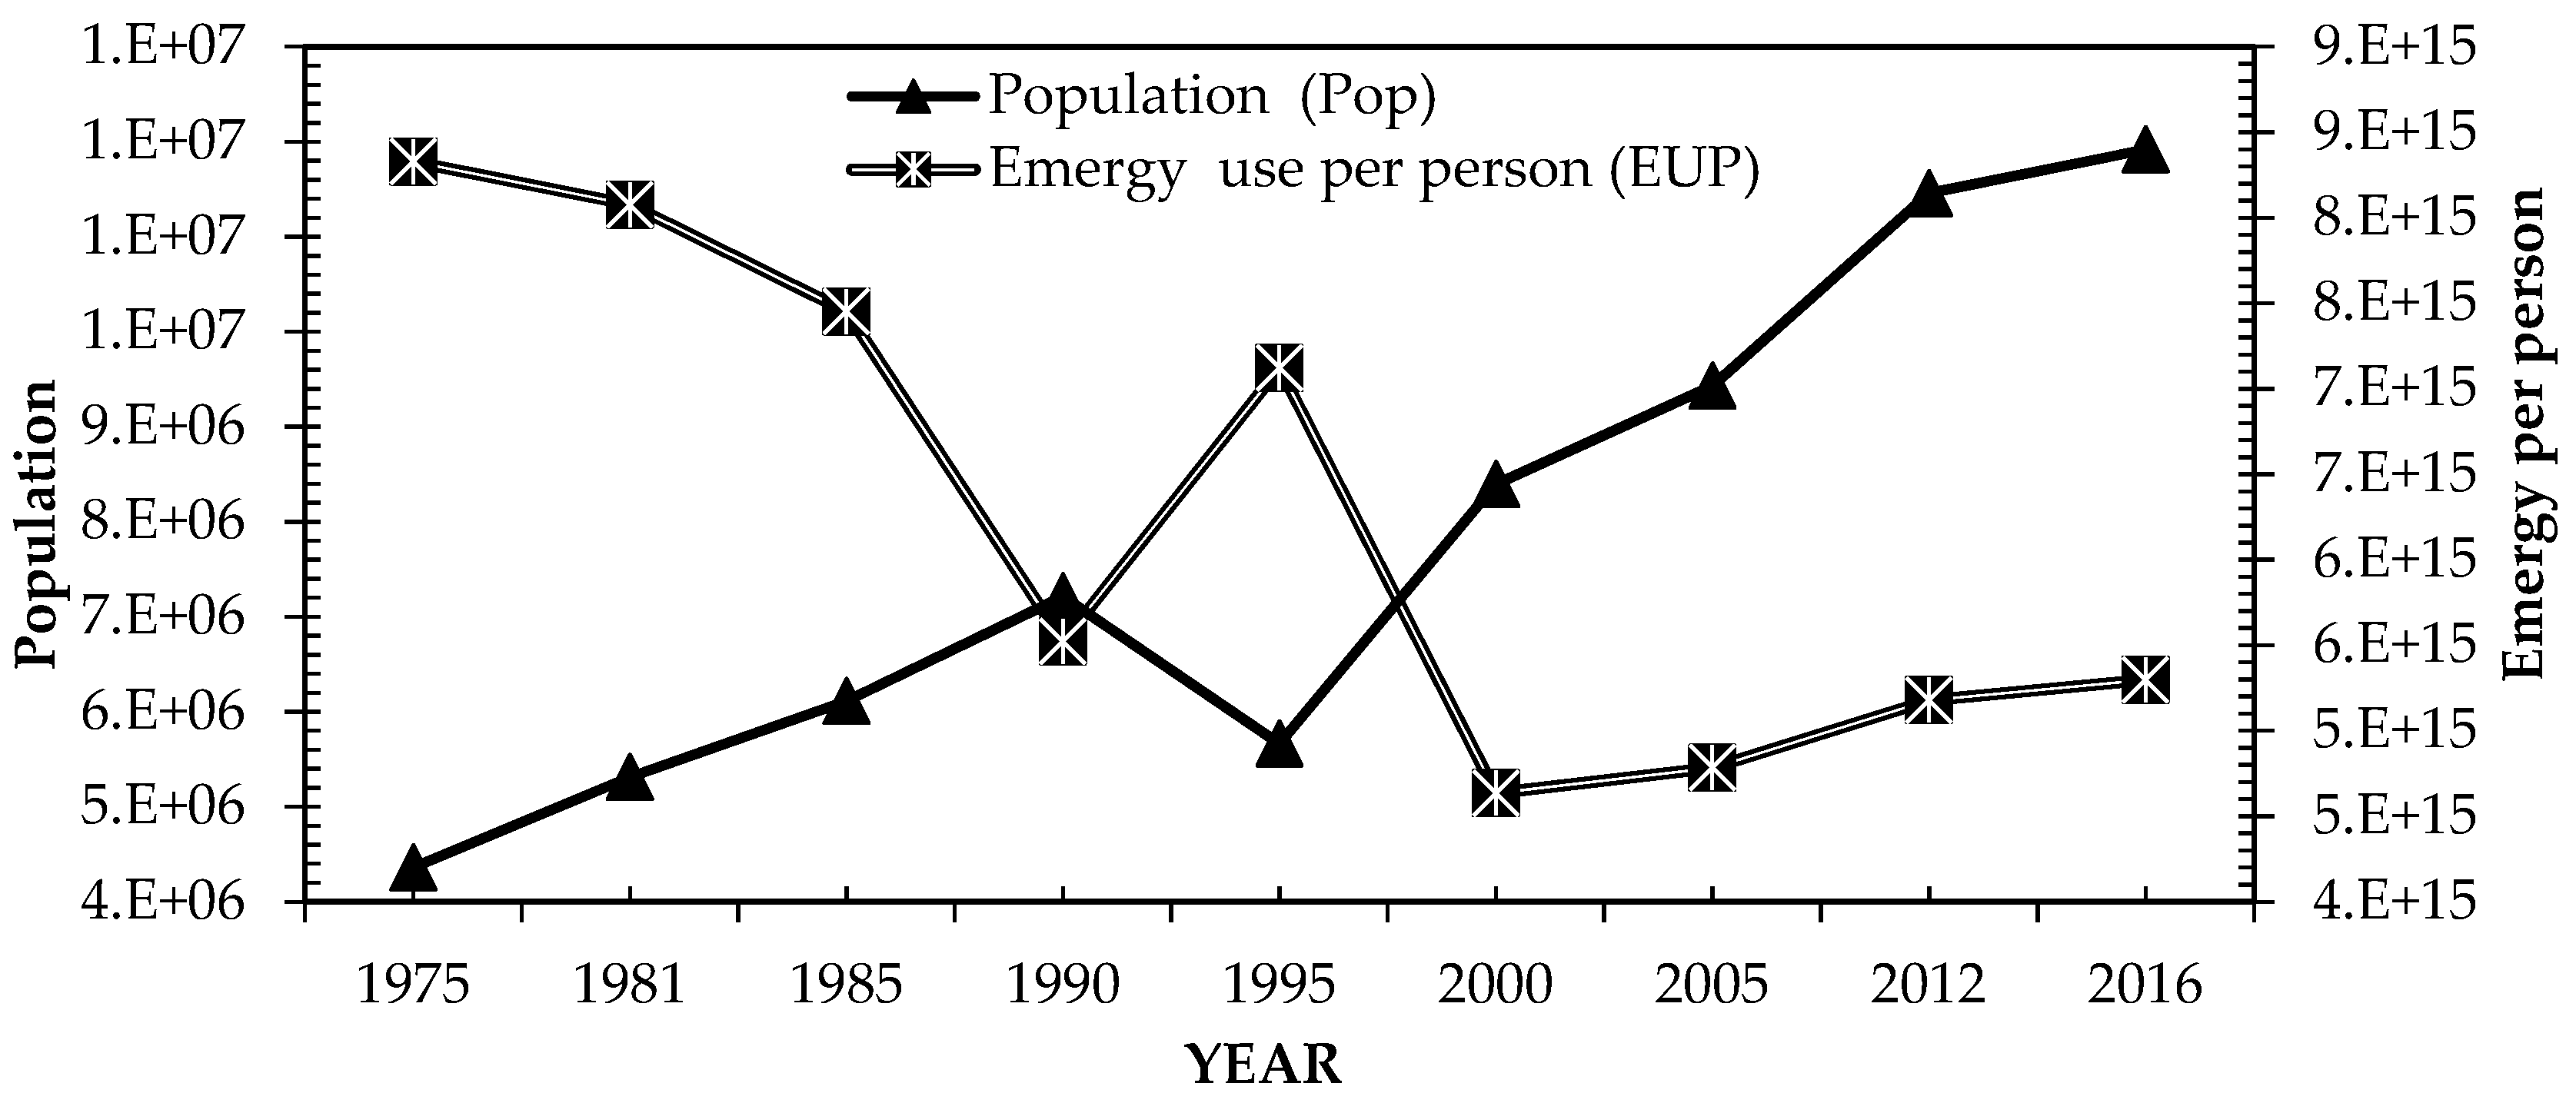
| 23 | Population | 4.36 × 10⁶ | 5.31 × 10⁶ | 6.11 × 10⁶ | 7.21 × 10⁶ | 5.66 × 10⁶ | 8.40 × 10⁶ | 9.43 × 10⁶ | 1.15 × 10⁷ | 1.19 × 10⁷ |
| 24 | Area (square meter) | 2.63 × 10¹⁰ | 2.63 × 10¹⁰ | 2.63 × 10¹⁰ | 2.63 × 10¹⁰ | 2.63 × 10¹⁰ | 2.63 × 10¹⁰ | 2.63 × 10¹⁰ | 2.63 × 10¹⁰ | 2.63 × 10¹⁰ |
| 25 | Exchange rate $ to Rwf | 92.28 | 102.73 | 94.67 | 78.83 | 246.68 | 458.55 | 546.66 | 607.55 | 780.48 |
| 26 | GNP ($) | 6.00 × 10⁸ | 1.50 × 10⁹ | 1.80 × 10⁹ | 1.80 × 10⁹ | 1.20 × 10⁹ | 1.70 × 10⁹ | 2.60 × 10⁹ | 7.10 × 10⁹ | 8.38 × 10⁹ |
| Pre-Genocide | Post Genocide | ||||||||||
|---|---|---|---|---|---|---|---|---|---|---|---|
| No | Name of Index | Expression | 1975 | 1981 | 1985 | 1990 | 1995 | 2000 | 2005 | 2012 | 2016 |
| 1 | Renewable emergy flow _R | R | 3.39 × 10²² | 3.39 × 10²² | 3.39 × 10²² | 3.39 × 10²² | 3.39 × 10²² | 3.39 × 10²² | 3.39 × 10²² | 3.39 × 10²² | 3.39 × 10²² |
| 2 | Indigenous Non-renewable Resources | N = N0 + N1 | 3.21 × 10¹⁸ | 3.21 × 10¹⁸ | 4.73 × 10¹⁸ | 4.69 × 10¹⁸ | 3.35 × 10¹⁸ | 3.50 × 10¹⁸ | 4.38 × 10¹⁸ | 4.73 × 10¹⁸ | 4.65 × 10¹⁹ |
| 3 | Import emergy | G + F + P2I | 2.36 × 10²¹ | 8.97 × 10²¹ | 1.16 × 10²² | 5.91 × 10²¹ | 6.40 × 10²¹ | 4.98 × 10²¹ | 1.12 × 10²² | 2.54 × 10²² | 2.91 × 10²² |
| 4 | Total emergy use _U | N0 + N1 + R + G + F + P2I | 3.63 × 10²² | 4.29 × 10²² | 4.55 × 10²² | 3.98 × 10²² | 4.03 × 10²² | 3.89 × 10²² | 4.51 × 10²² | 5.93 × 10²² | 6.31 × 10²² |
| 5 | Total export emergy | E = B + N2 + P1E | 7.23 × 10²⁰ | 2.05 × 10²¹ | 1.53 × 10²¹ | 1.06 × 10²¹ | 4.83 × 10²⁰ | 1.35 × 10²¹ | 4.90 × 10²¹ | 1.52 × 10²² | 8.61 × 10²¹ |
| 6 | Total emergy inflows (sej/yr) | R + N + F + G + P2I | 3.63 × 10²² | 4.29 × 10²² | 4.55 × 10²² | 3.98 × 10²² | 4.03 × 10²² | 3.89 × 10²² | 6.26 × 10²¹ | 5.93 × 10²² | 6.31 × 10²² |
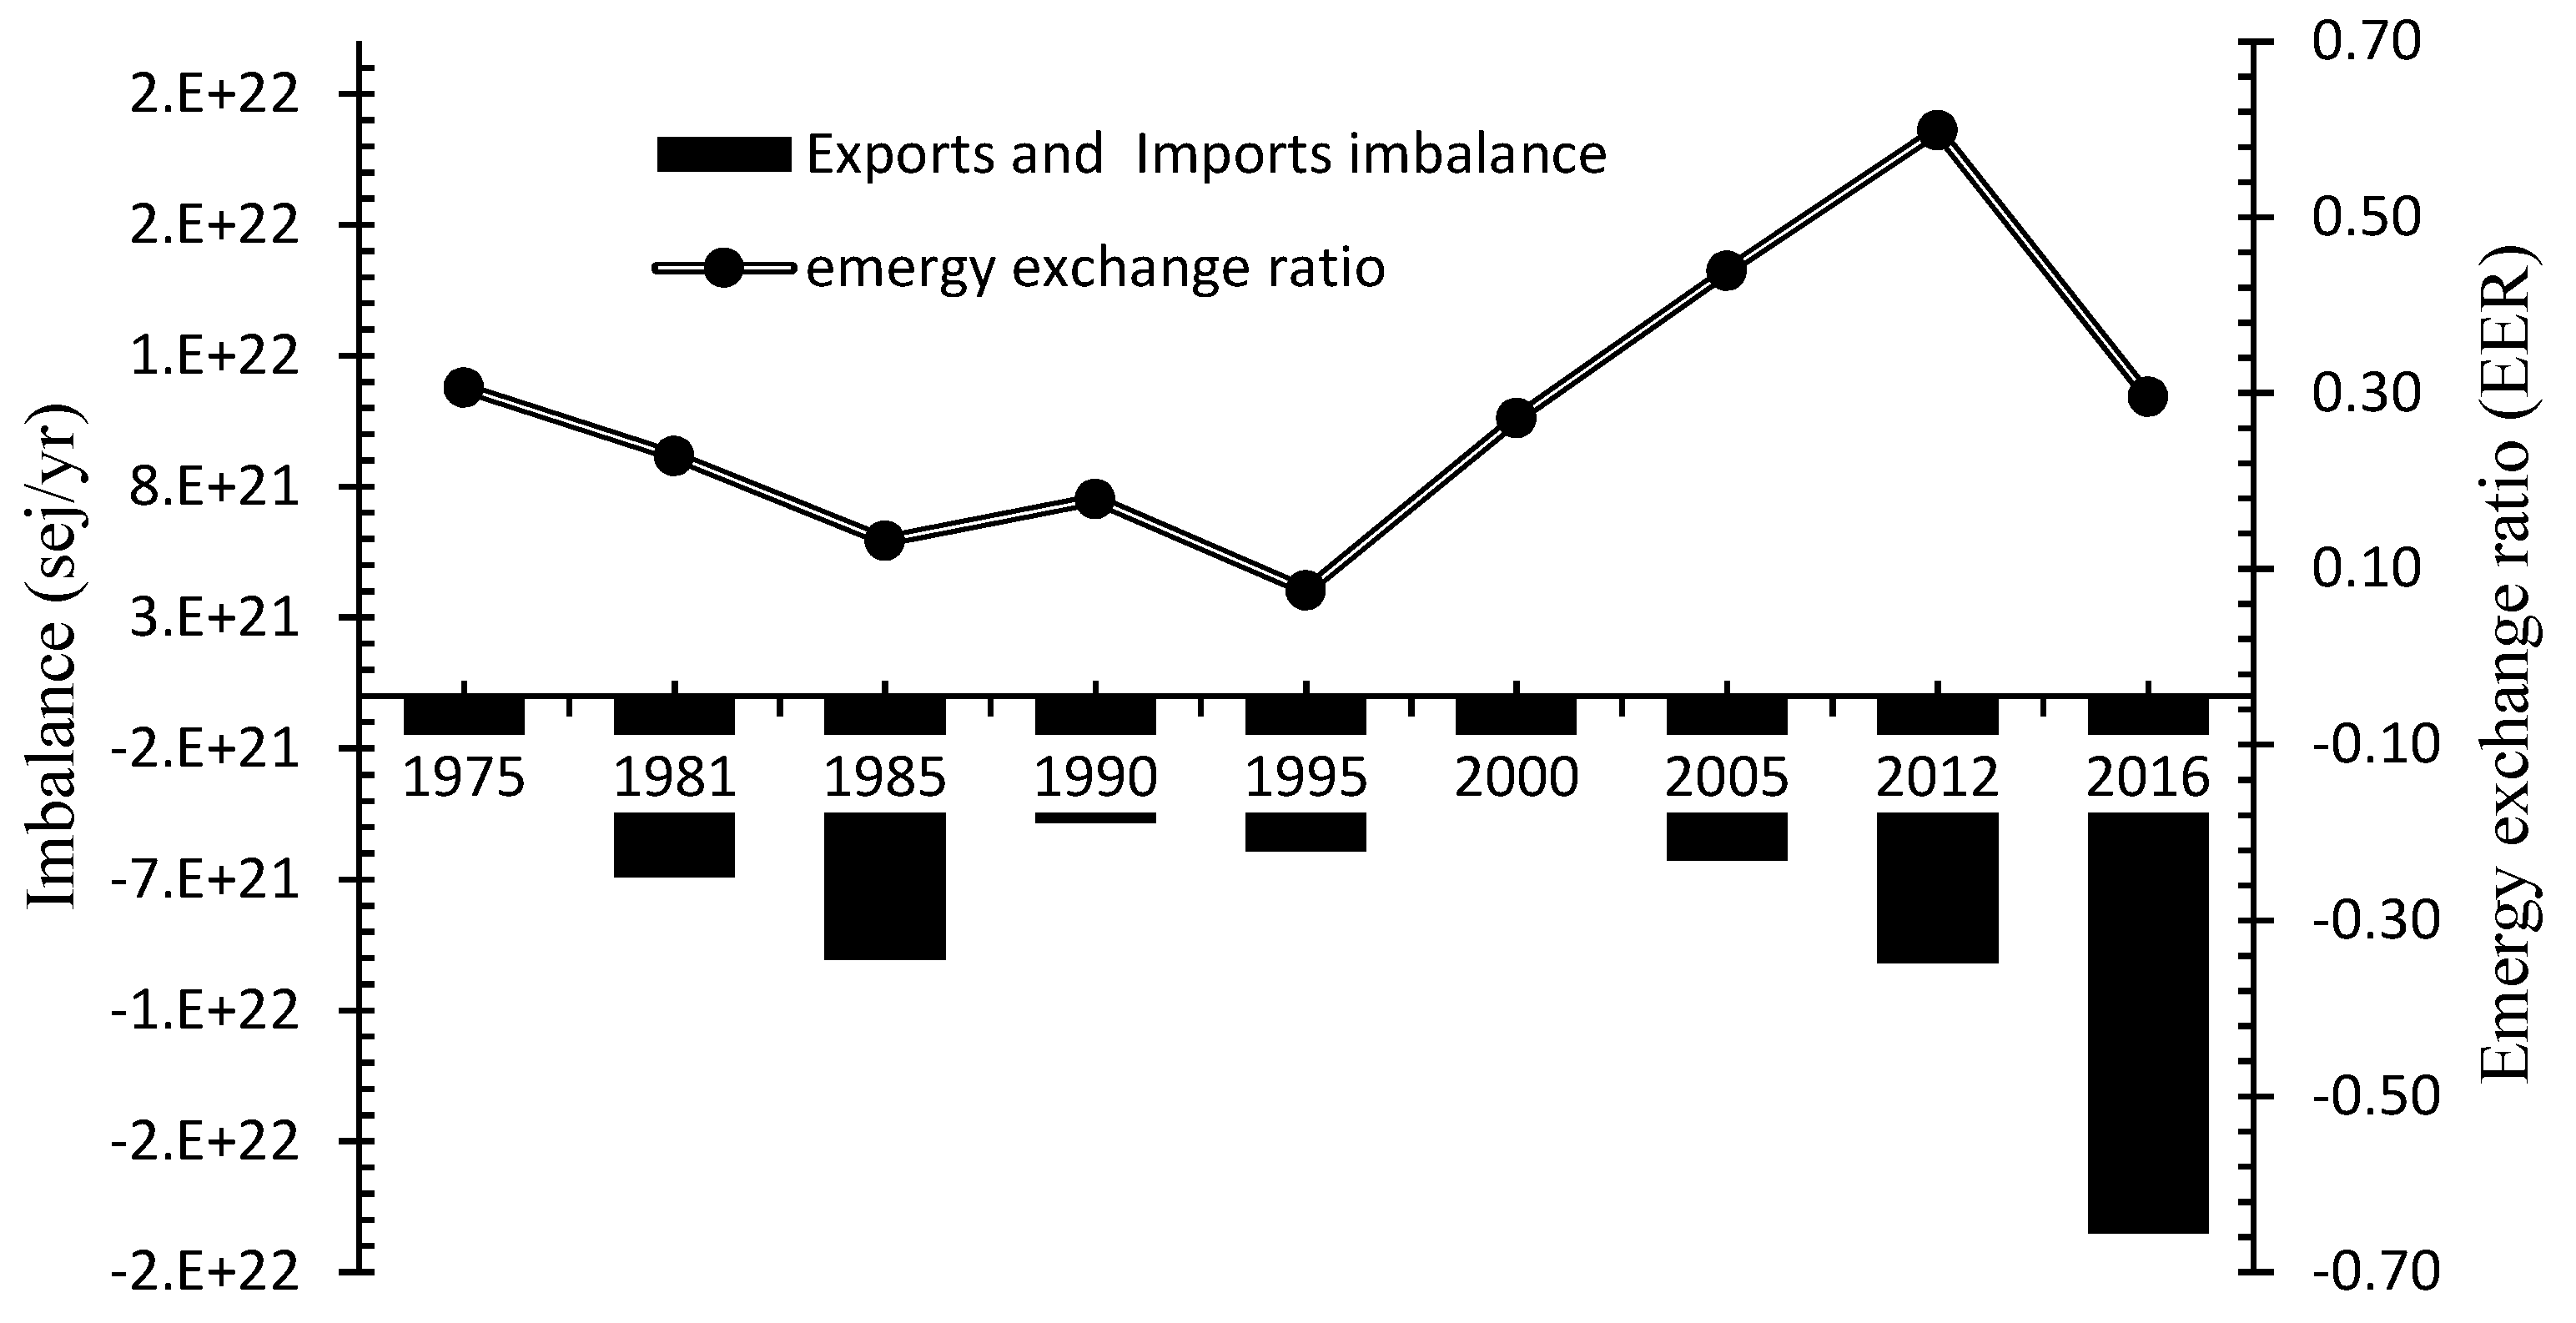
| 7 | Exports minus imports (sej/yr) | (B + N2 + P1E) − (F + G + P2I) | −1.64 × 10²¹ | −6.92 × 10²¹ | −1.01 × 10²² | −4.85 × 10²¹ | −5.92 × 10²¹ | −3.63 × 10²¹ | −6.26 × 10²¹ | −1.02 × 10²² | −2.05 × 10²² |
| 8 | Ratio of exports to imports | (B + N2 + P1E)/(F + G + P2I) | 0.31 | 0.23 | 0.13 | 0.18 | 0.08 | 0.27 | 0.44 | 0.60 | 0.30 |
| 9 | Indigenous sources | R + N | 3.39 × 10²² | 3.39 × 10²² | 3.39 × 10²² | 3.39 × 10²² | 3.39 × 10²² | 3.39 × 10²² | 3.39 × 10²² | 3.39 × 10²² | 3.40 × 10²² |
| 10 | Emergy to money ratio (sej/$) | U/GNP | 6.05 × 10¹³ | 2.86 × 10¹³ | 2.53 × 10¹³ | 2.21 × 10¹³ | 3.36 × 10¹³ | 2.29 × 10¹³ | 1.73 × 10¹³ | 8.36 × 10¹² | 7.54 × 10¹² |
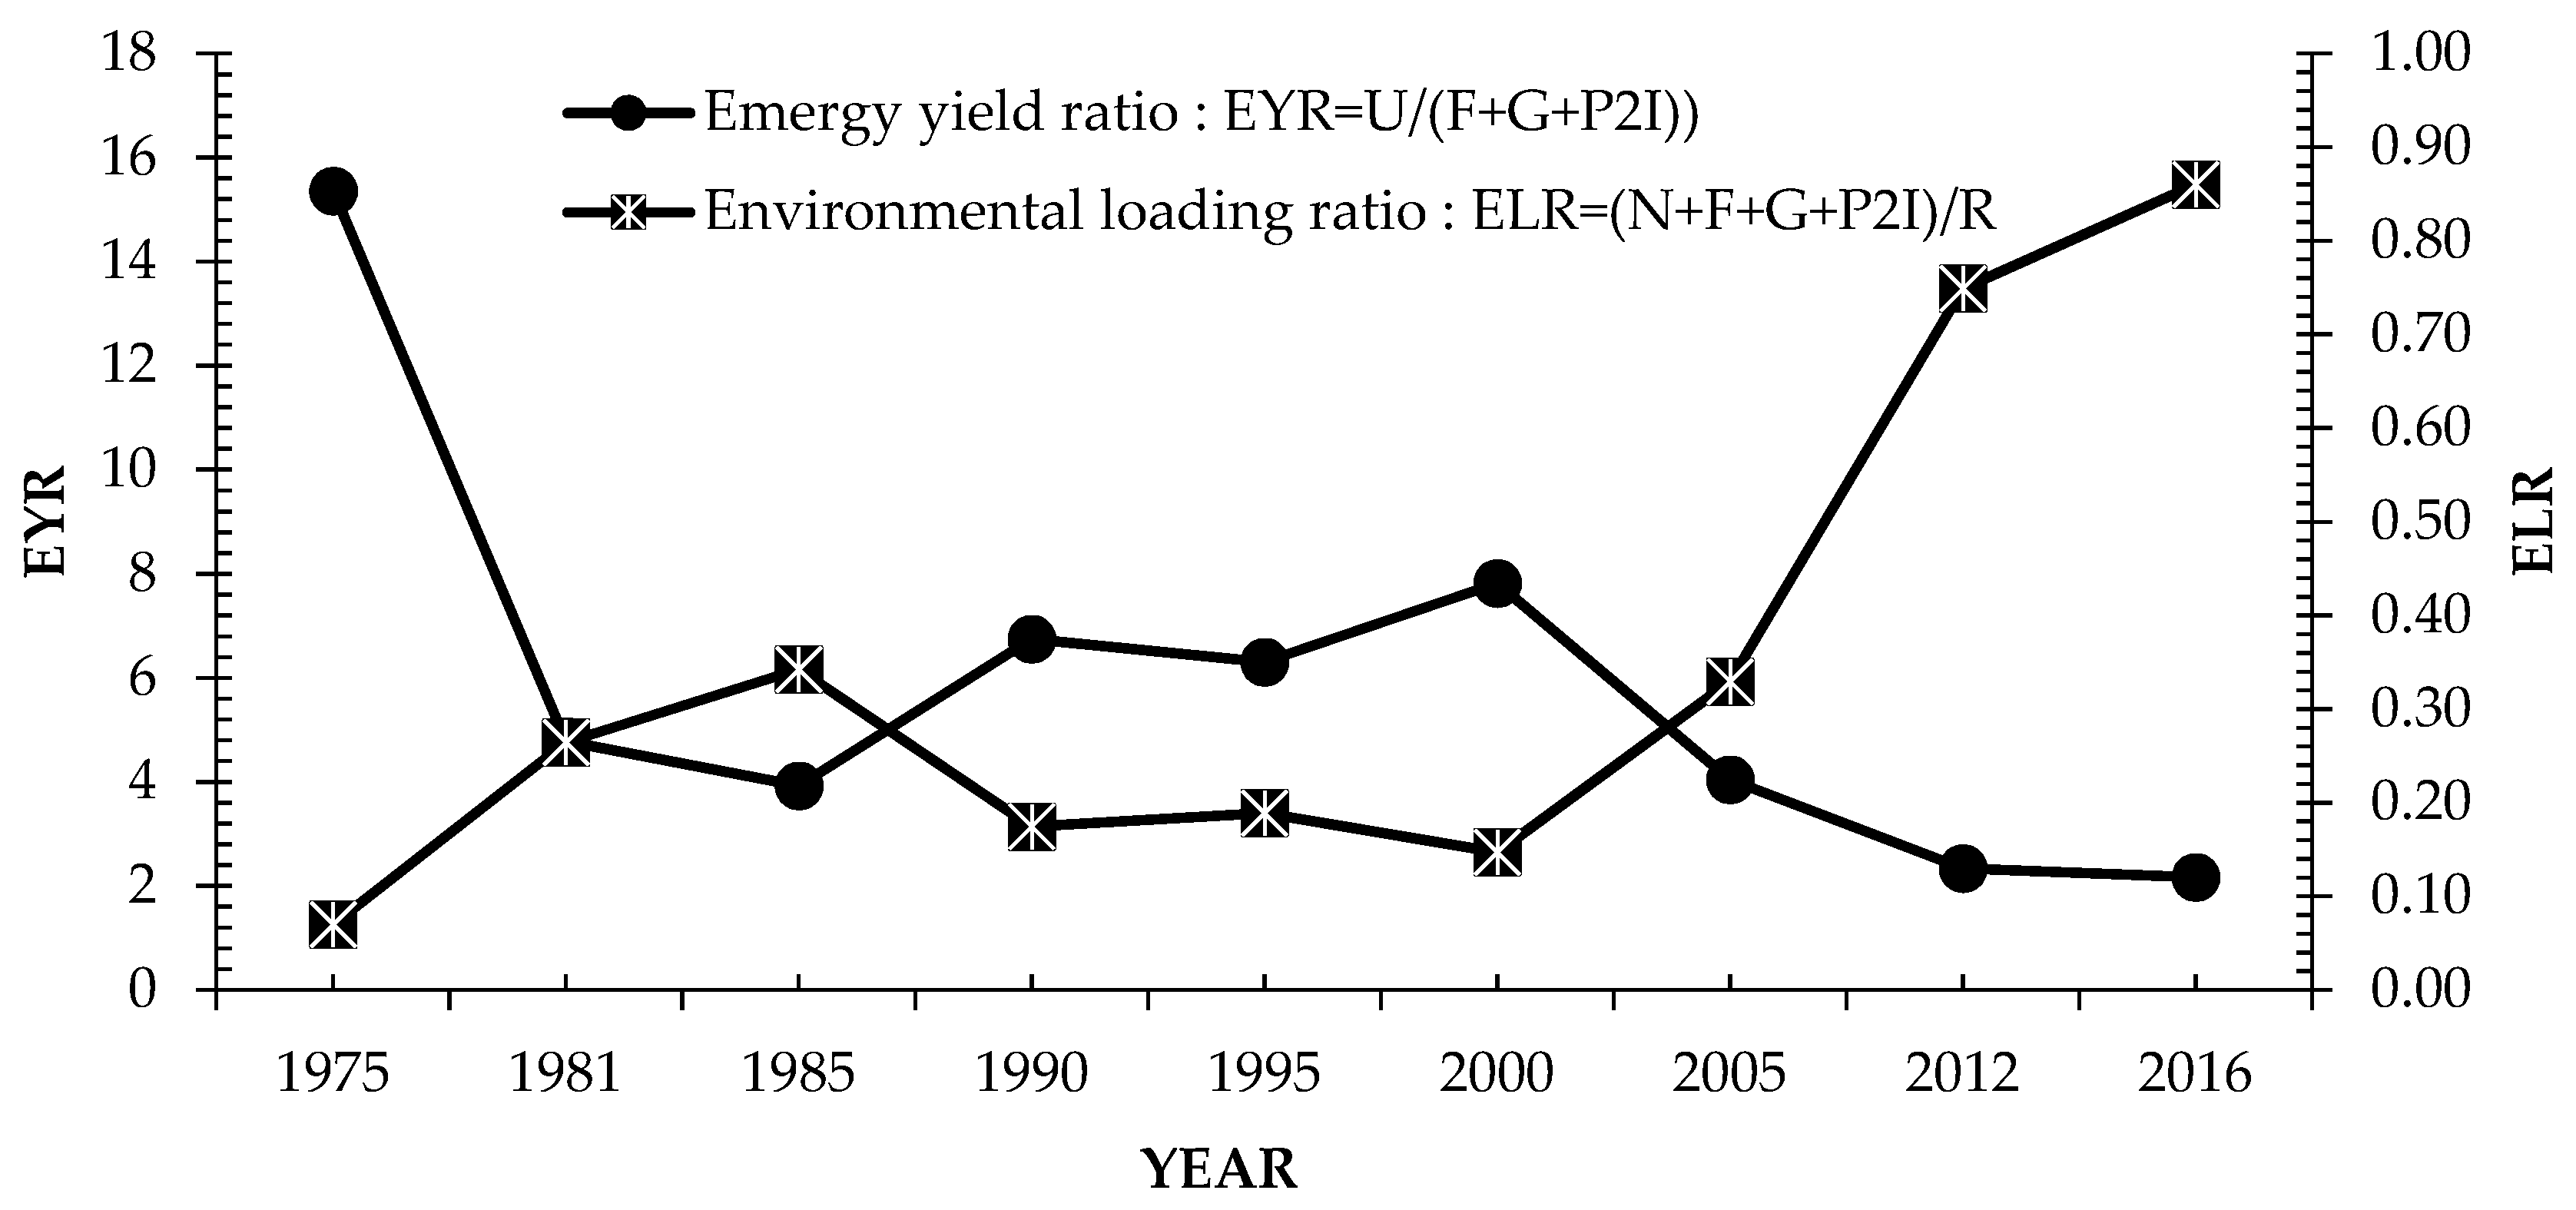
| 11 | Environmental loading ratio (ELR) | (N + F + G + P2I)/R | 0.07 | 0.26 | 0.34 | 0.17 | 0.19 | 0.15 | 0.33 | 0.75 | 0.86 |
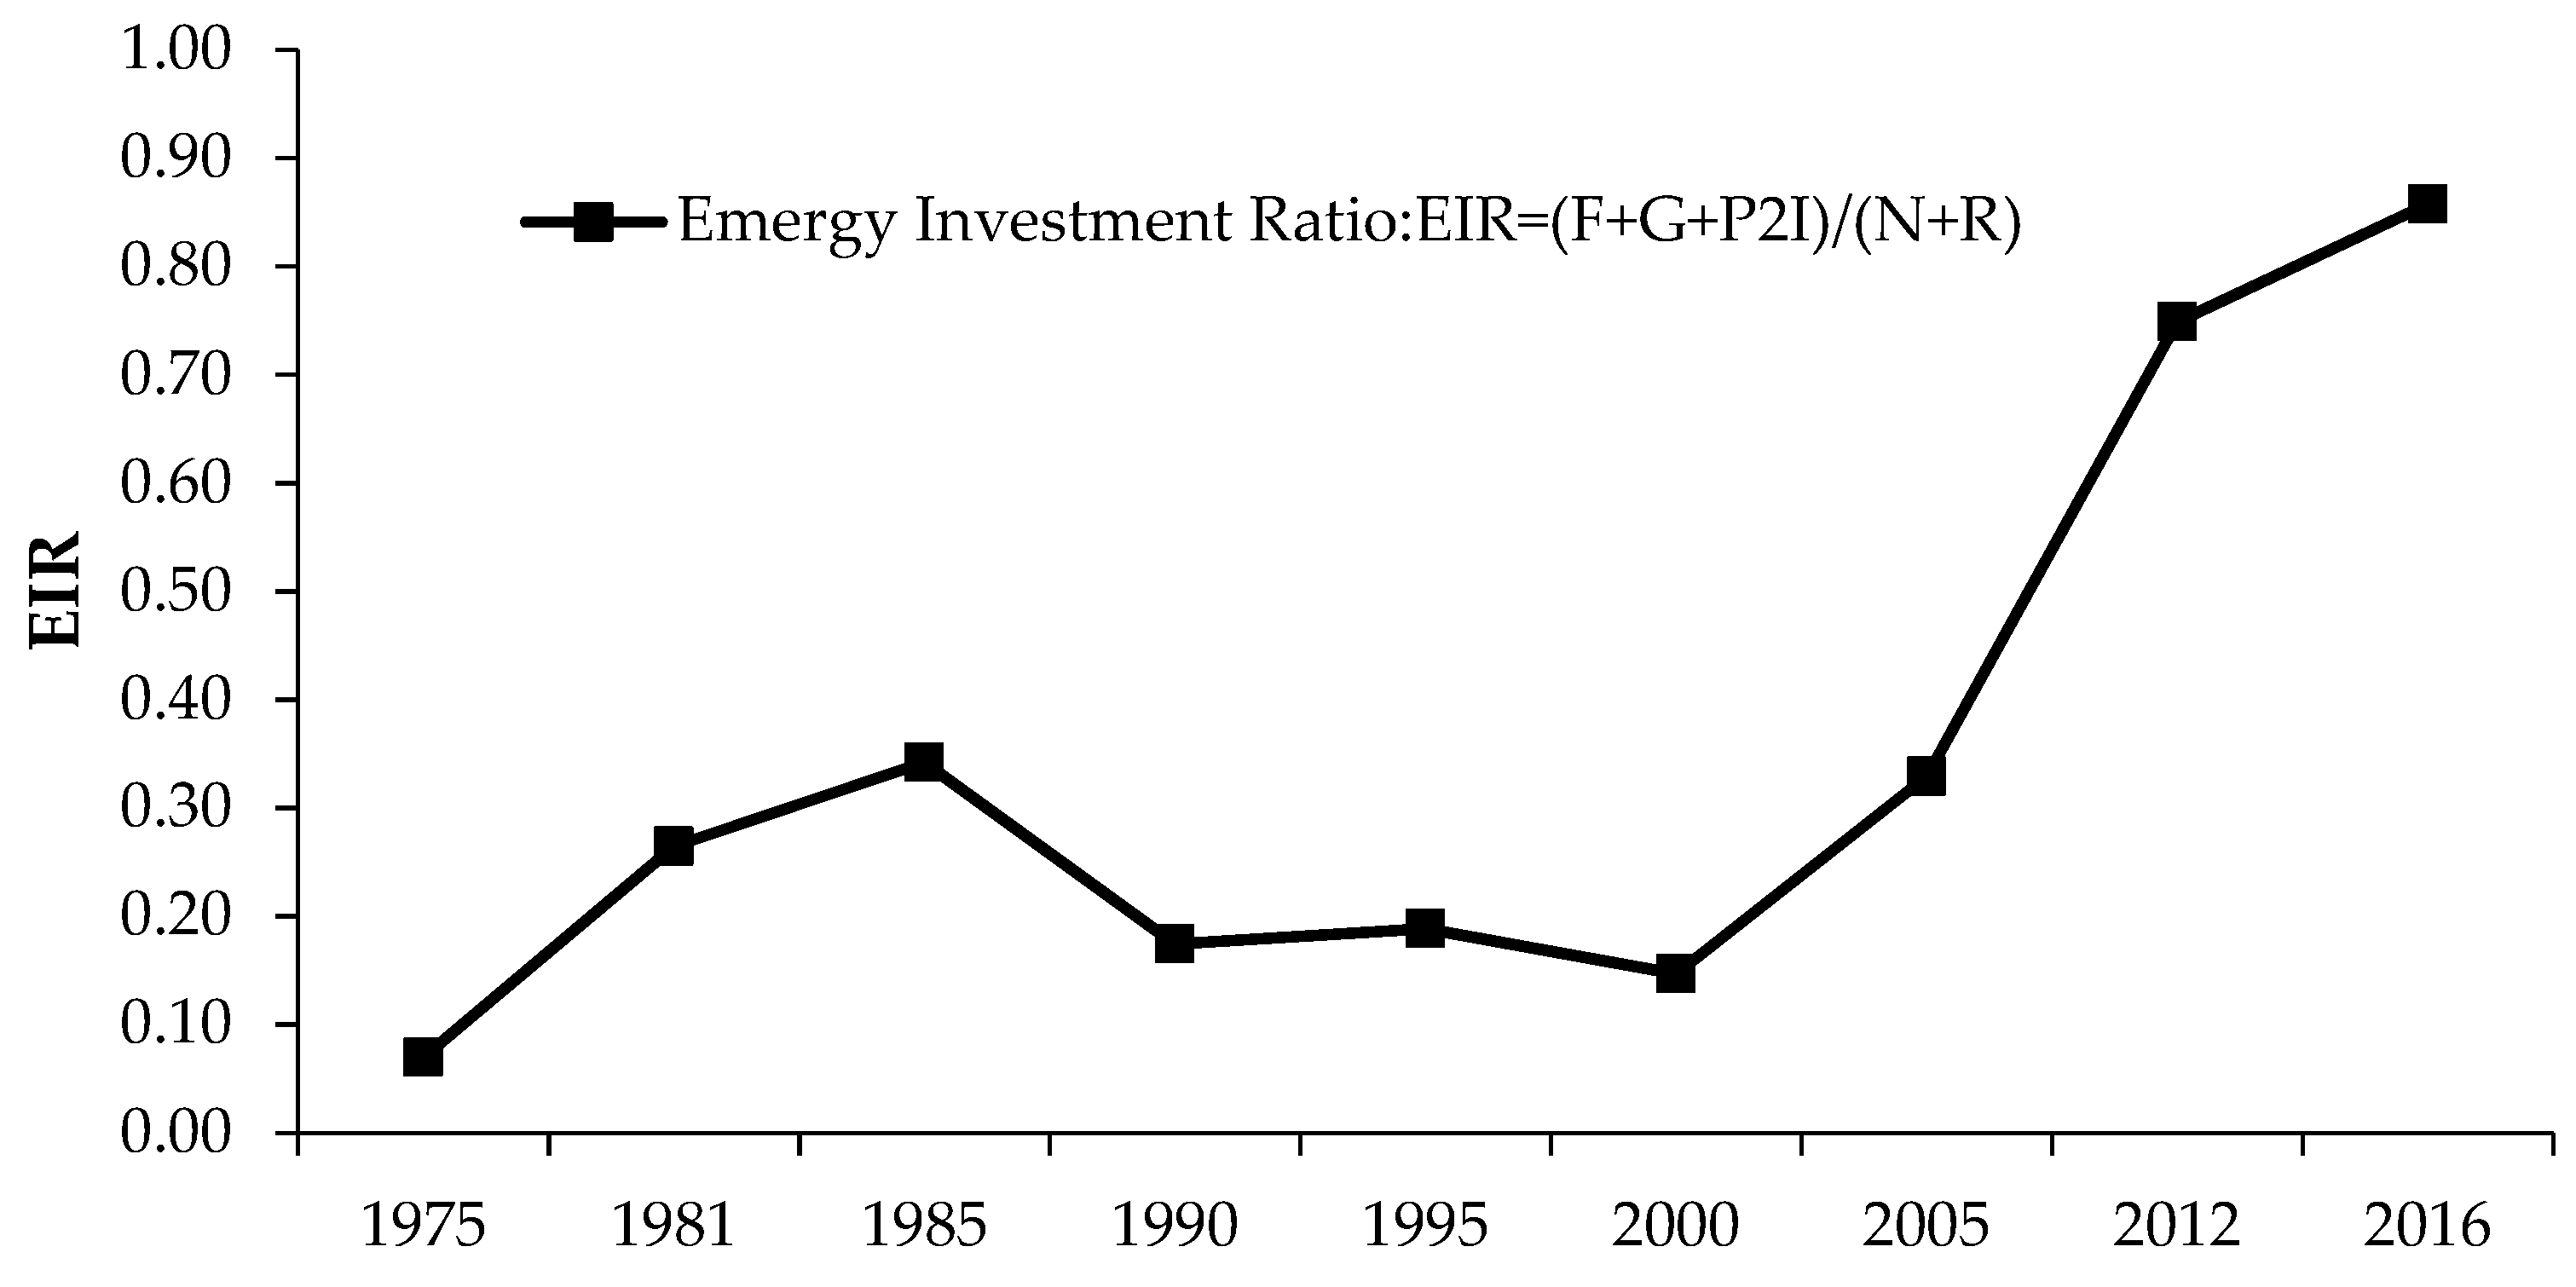
| 12 | Emergy investment ratio (EIR) | (F + G + P2I)/(N + R) | 0.07 | 0.26 | 0.34 | 0.17 | 0.19 | 0.15 | 0.33 | 0.75 | 8.58E−01 |
| 13 | Emergy yield ratio (EYR) | U/(F + G + P2I) | 15.36 | 4.78 | 3.92 | 6.74 | 6.30 | 7.82 | 4.04 | 2.34 | 2.17E+00 |
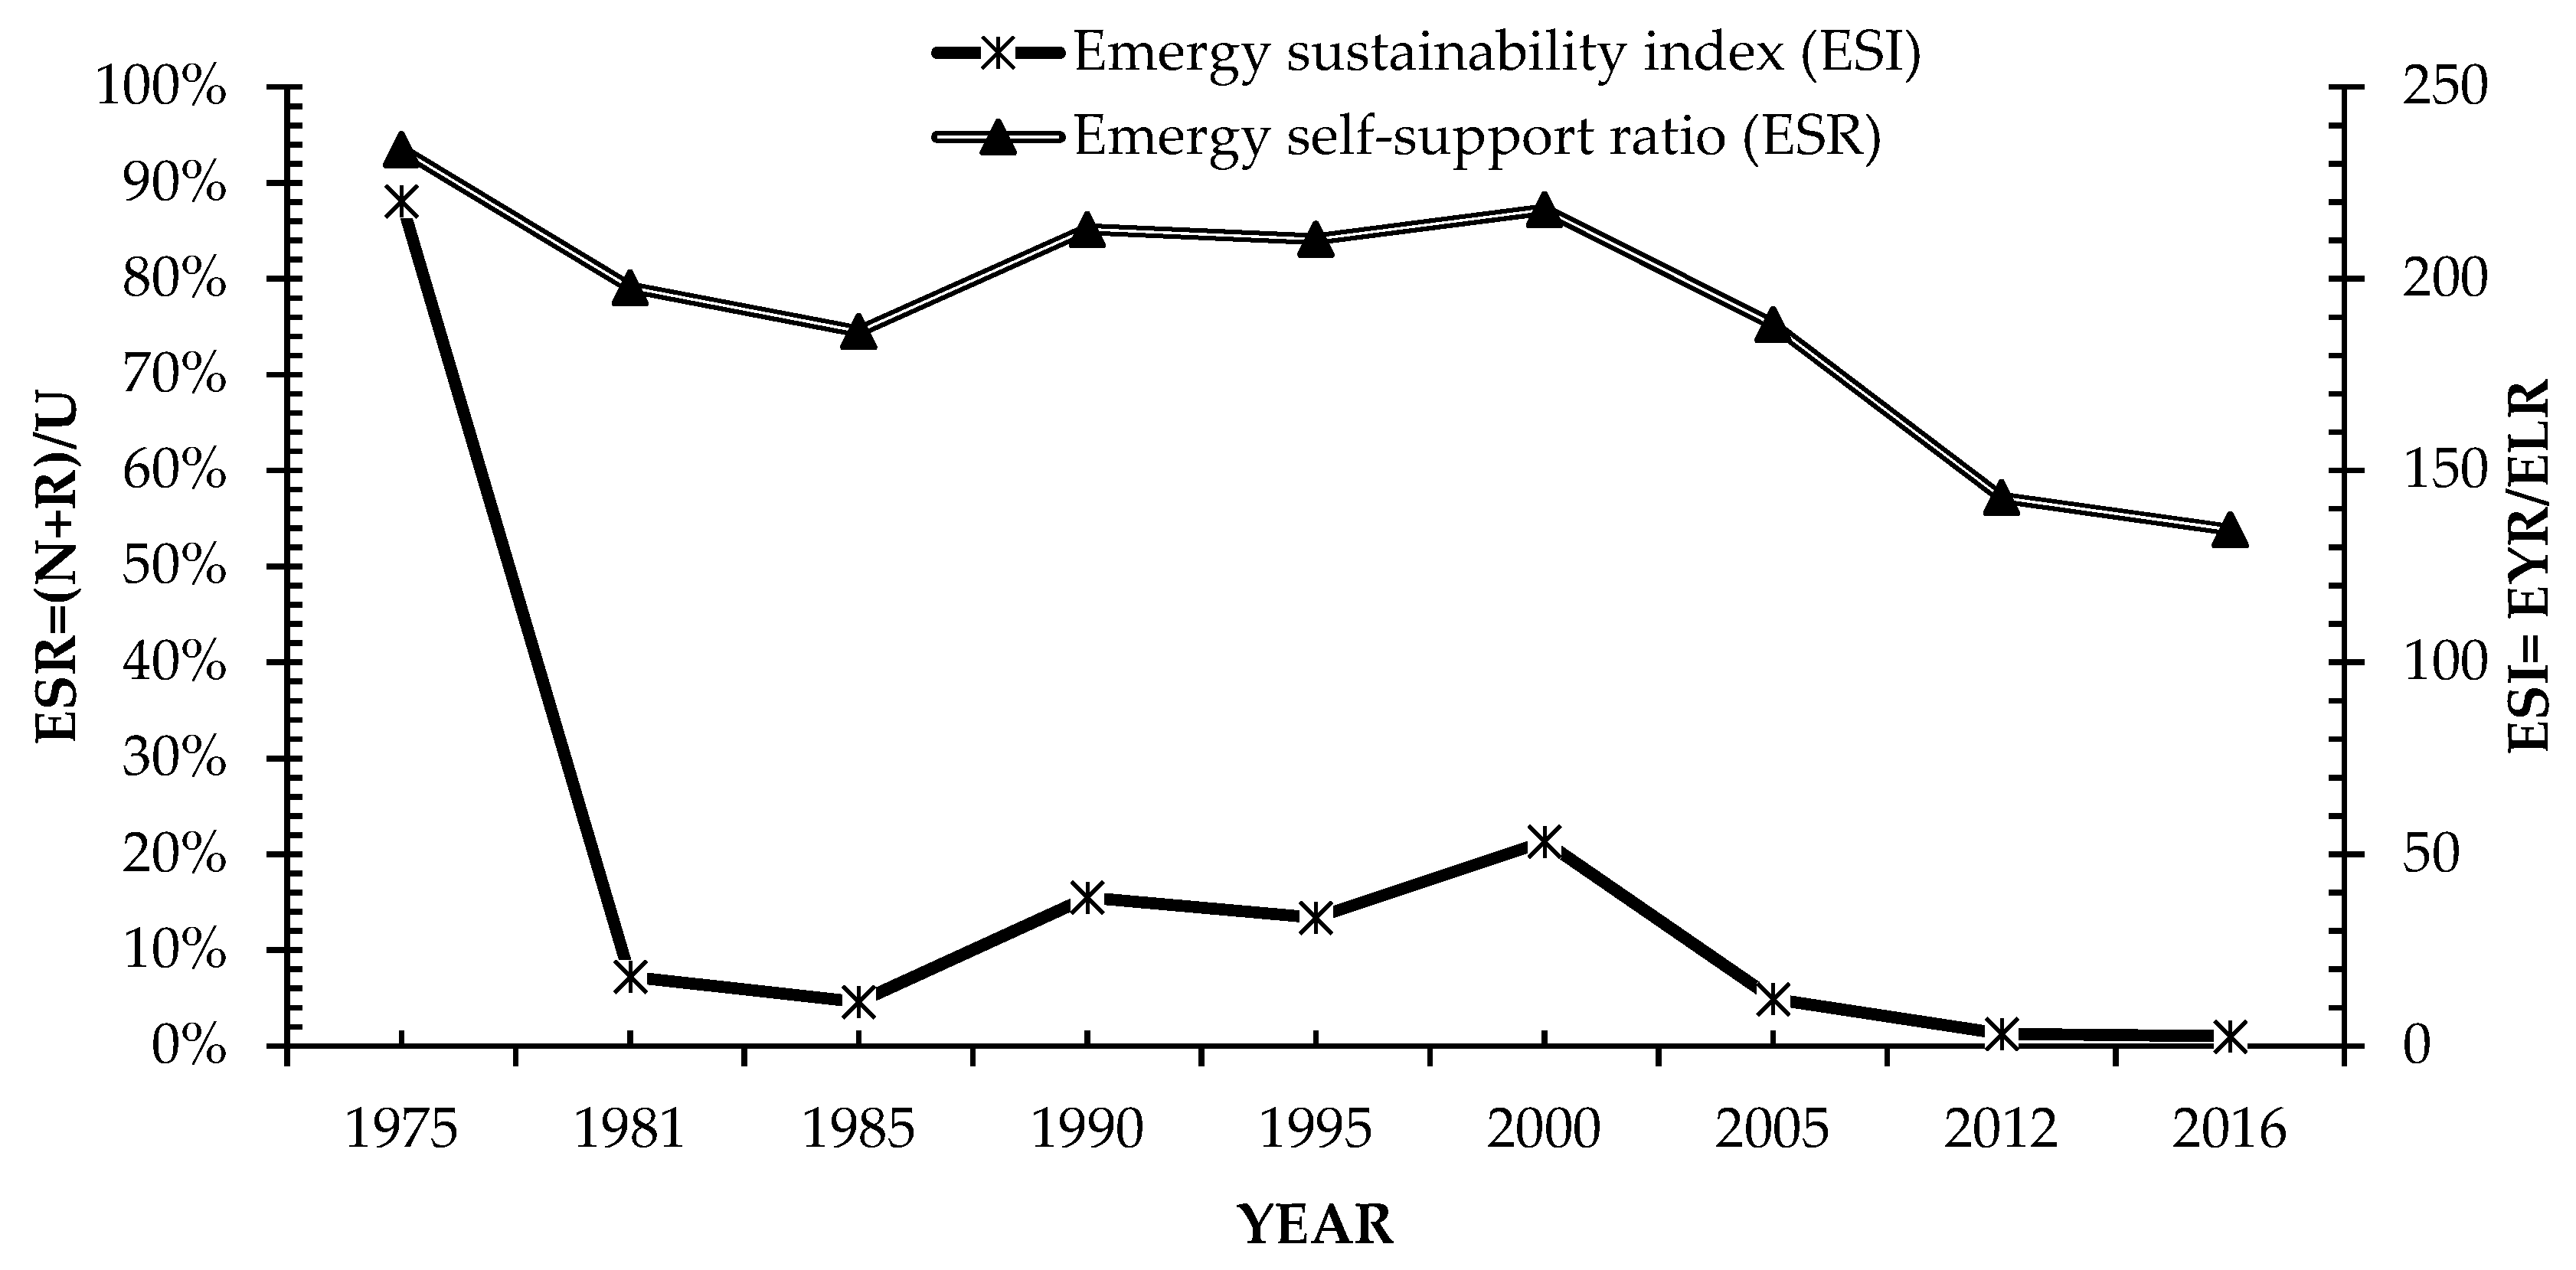
| 14 | Emergy sustainability index (ESI) | EYR/ELR | 220.26 | 18.08 | 11.46 | 38.70 | 33.42 | 53.26 | 12.27 | 3.12 | 2.52 |
| 15 | Emergy self-support ratio (ESR) | (N + R)/U | 93.49% | 79.09% | 74.51% | 85.17% | 84.14% | 87.21% | 75.24% | 57.19% | 53.83% |
| 16 | Fraction use, locally renewable | R/U | 93.48% | 79.08% | 74.50% | 85.16% | 84.13% | 87.20% | 75.23% | 57.18% | 53.76% |
| 17 | Fraction of emergy use purchased (imports) | (F + G + P2I)/U | 6.51% | 20.91% | 25.49% | 14.83% | 15.86% | 12.79% | 24.76% | 42.81% | 46.17% |
| 18 | Fraction import service | P2I/U | 0.90% | 5.32% | 5.47% | 5.24% | 2.94% | 1.11% | 0.05% | 0.13% | 2.26% |
| 19 | Fraction of use that is free | (R + No)/U | 93.49% | 79.09% | 74.51% | 85.17% | 84.14% | 87.21% | 75.24% | 57.18% | 5.38 × 10⁻¹ |
| 20 | Ratio of concentrated to rural | (F + G + P2I + N2)/(R + N0 + N1) | 0.07 | 0.26 | 0.34 | 0.17 | 0.19 | 0.15 | 0.33 | 0.75 | 0.86 |
| 21 | Use per unit area, empower density | U/(area-m2) | 1.38 × 10¹² | 1.63 × 10¹² | 1.73 × 10¹² | 1.51 × 10¹² | 1.53 × 10¹² | 1.48 × 10¹² | 1.71 × 10¹² | 2.25 × 10¹² | 2.40 × 10¹² |
| 22 | Emergy use per person (EUP) | U/population | 8.33 × 10¹⁵ | 8.08 × 10¹⁵ | 7.45 × 10¹⁵ | 5.52 × 10¹⁵ | 7.12 × 10¹⁵ | 4.64 × 10¹⁵ | 4.78 × 10¹⁵ | 5.18 × 10¹⁵ | 5.30 × 10¹⁵ |
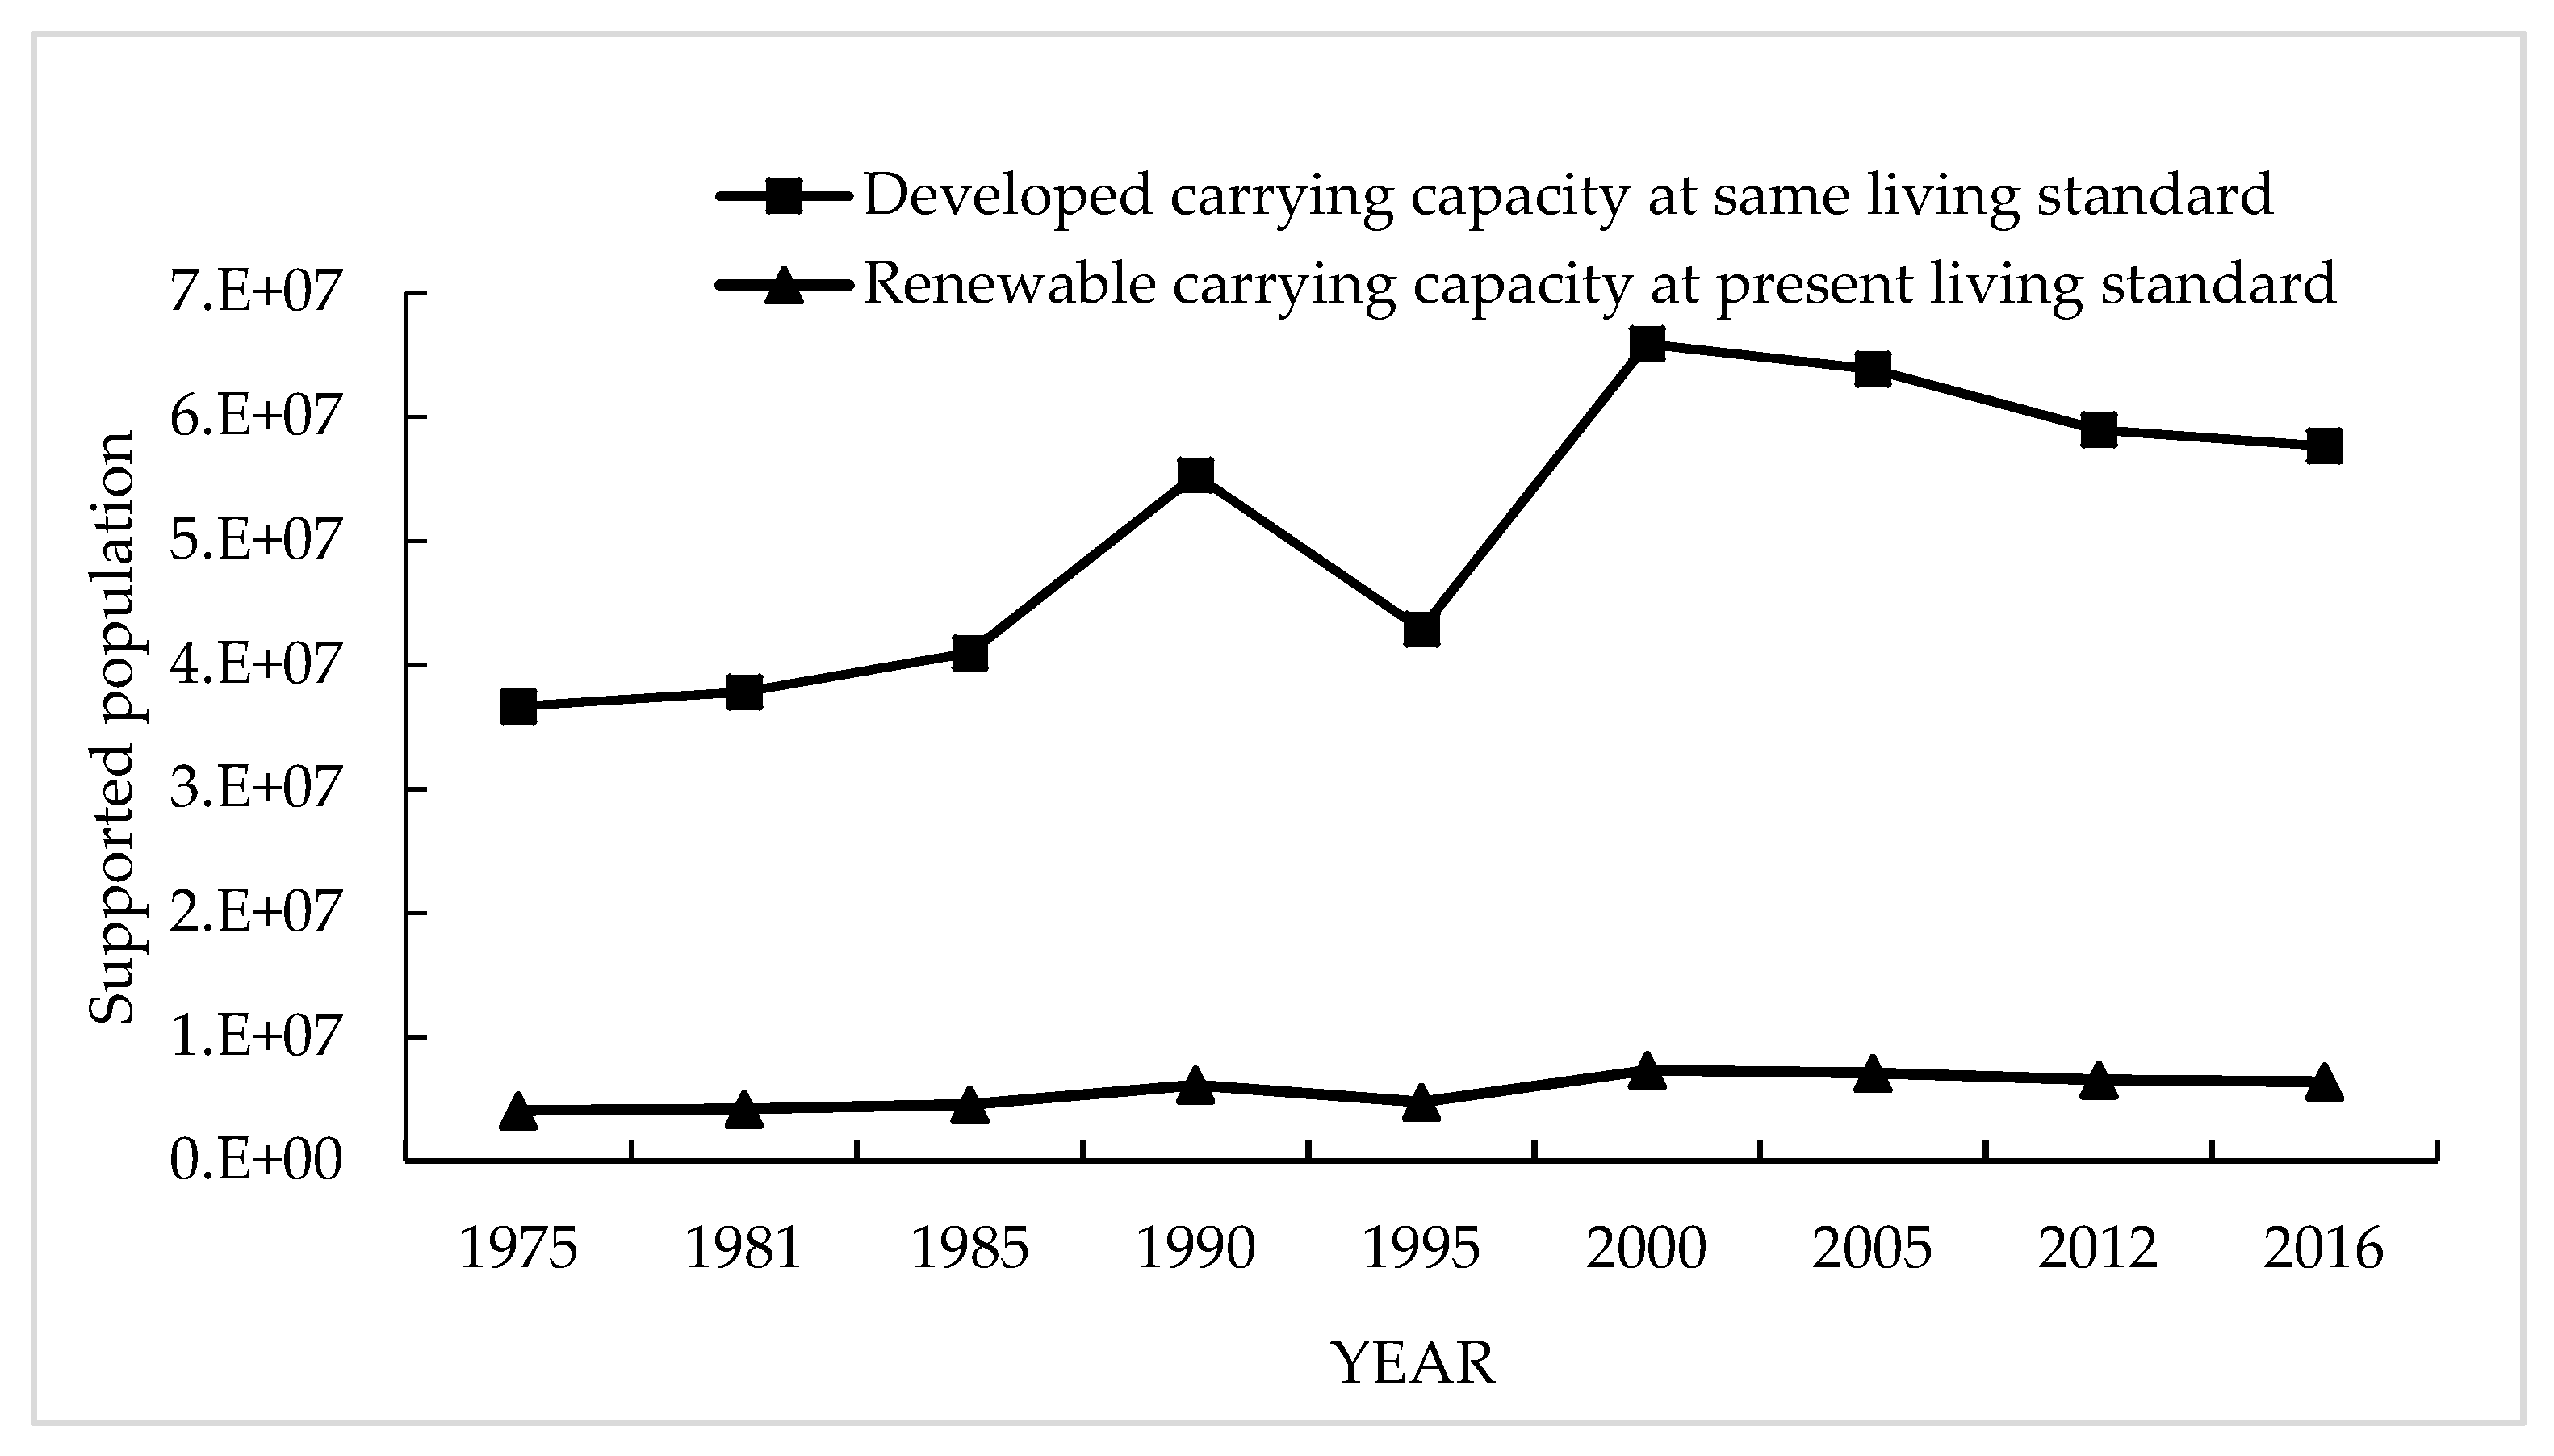
| 23 | Renewable carrying capacity at present living standard | (R/U) *(population) | 4.07 × 10⁶ | 4.20 × 10⁶ | 4.55 × 10⁶ | 6.14 × 10⁶ | 4.76 × 10⁶ | 7.32 × 10⁶ | 7.09 × 10⁶ | 6.55 × 10⁶ | 6.41 × 10⁶ |
| 24 | Developed carrying capacity at same living standard | 8(R/U) *(population) | 3.26 × 10⁷ | 3.36 × 10⁷ | 3.64 × 10⁷ | 4.92 × 10⁷ | 3.81 × 10⁷ | 5.86 × 10⁷ | 5.68 × 10⁷ | 5.24 × 10⁷ | 5.13 × 10⁷ |
| 25 | Ratio of electricity to use | (el)/U | 0.20% | 0.29% | 0.26% | 0.44% | 0.19% | 0.52% | 0.40% | 0.80% | 1.41% |
| 26 | Fuel use per person | fuel/Population | 1.94 × 10¹³ | 3.13 × 10¹³ | 3.58 × 10¹³ | 3.12 × 10¹³ | 2.60 × 10¹³ | 2.74 × 10¹³ | 3.04 × 10¹³ | 5.53 × 10¹³ | 6.80 × 10¹³ |
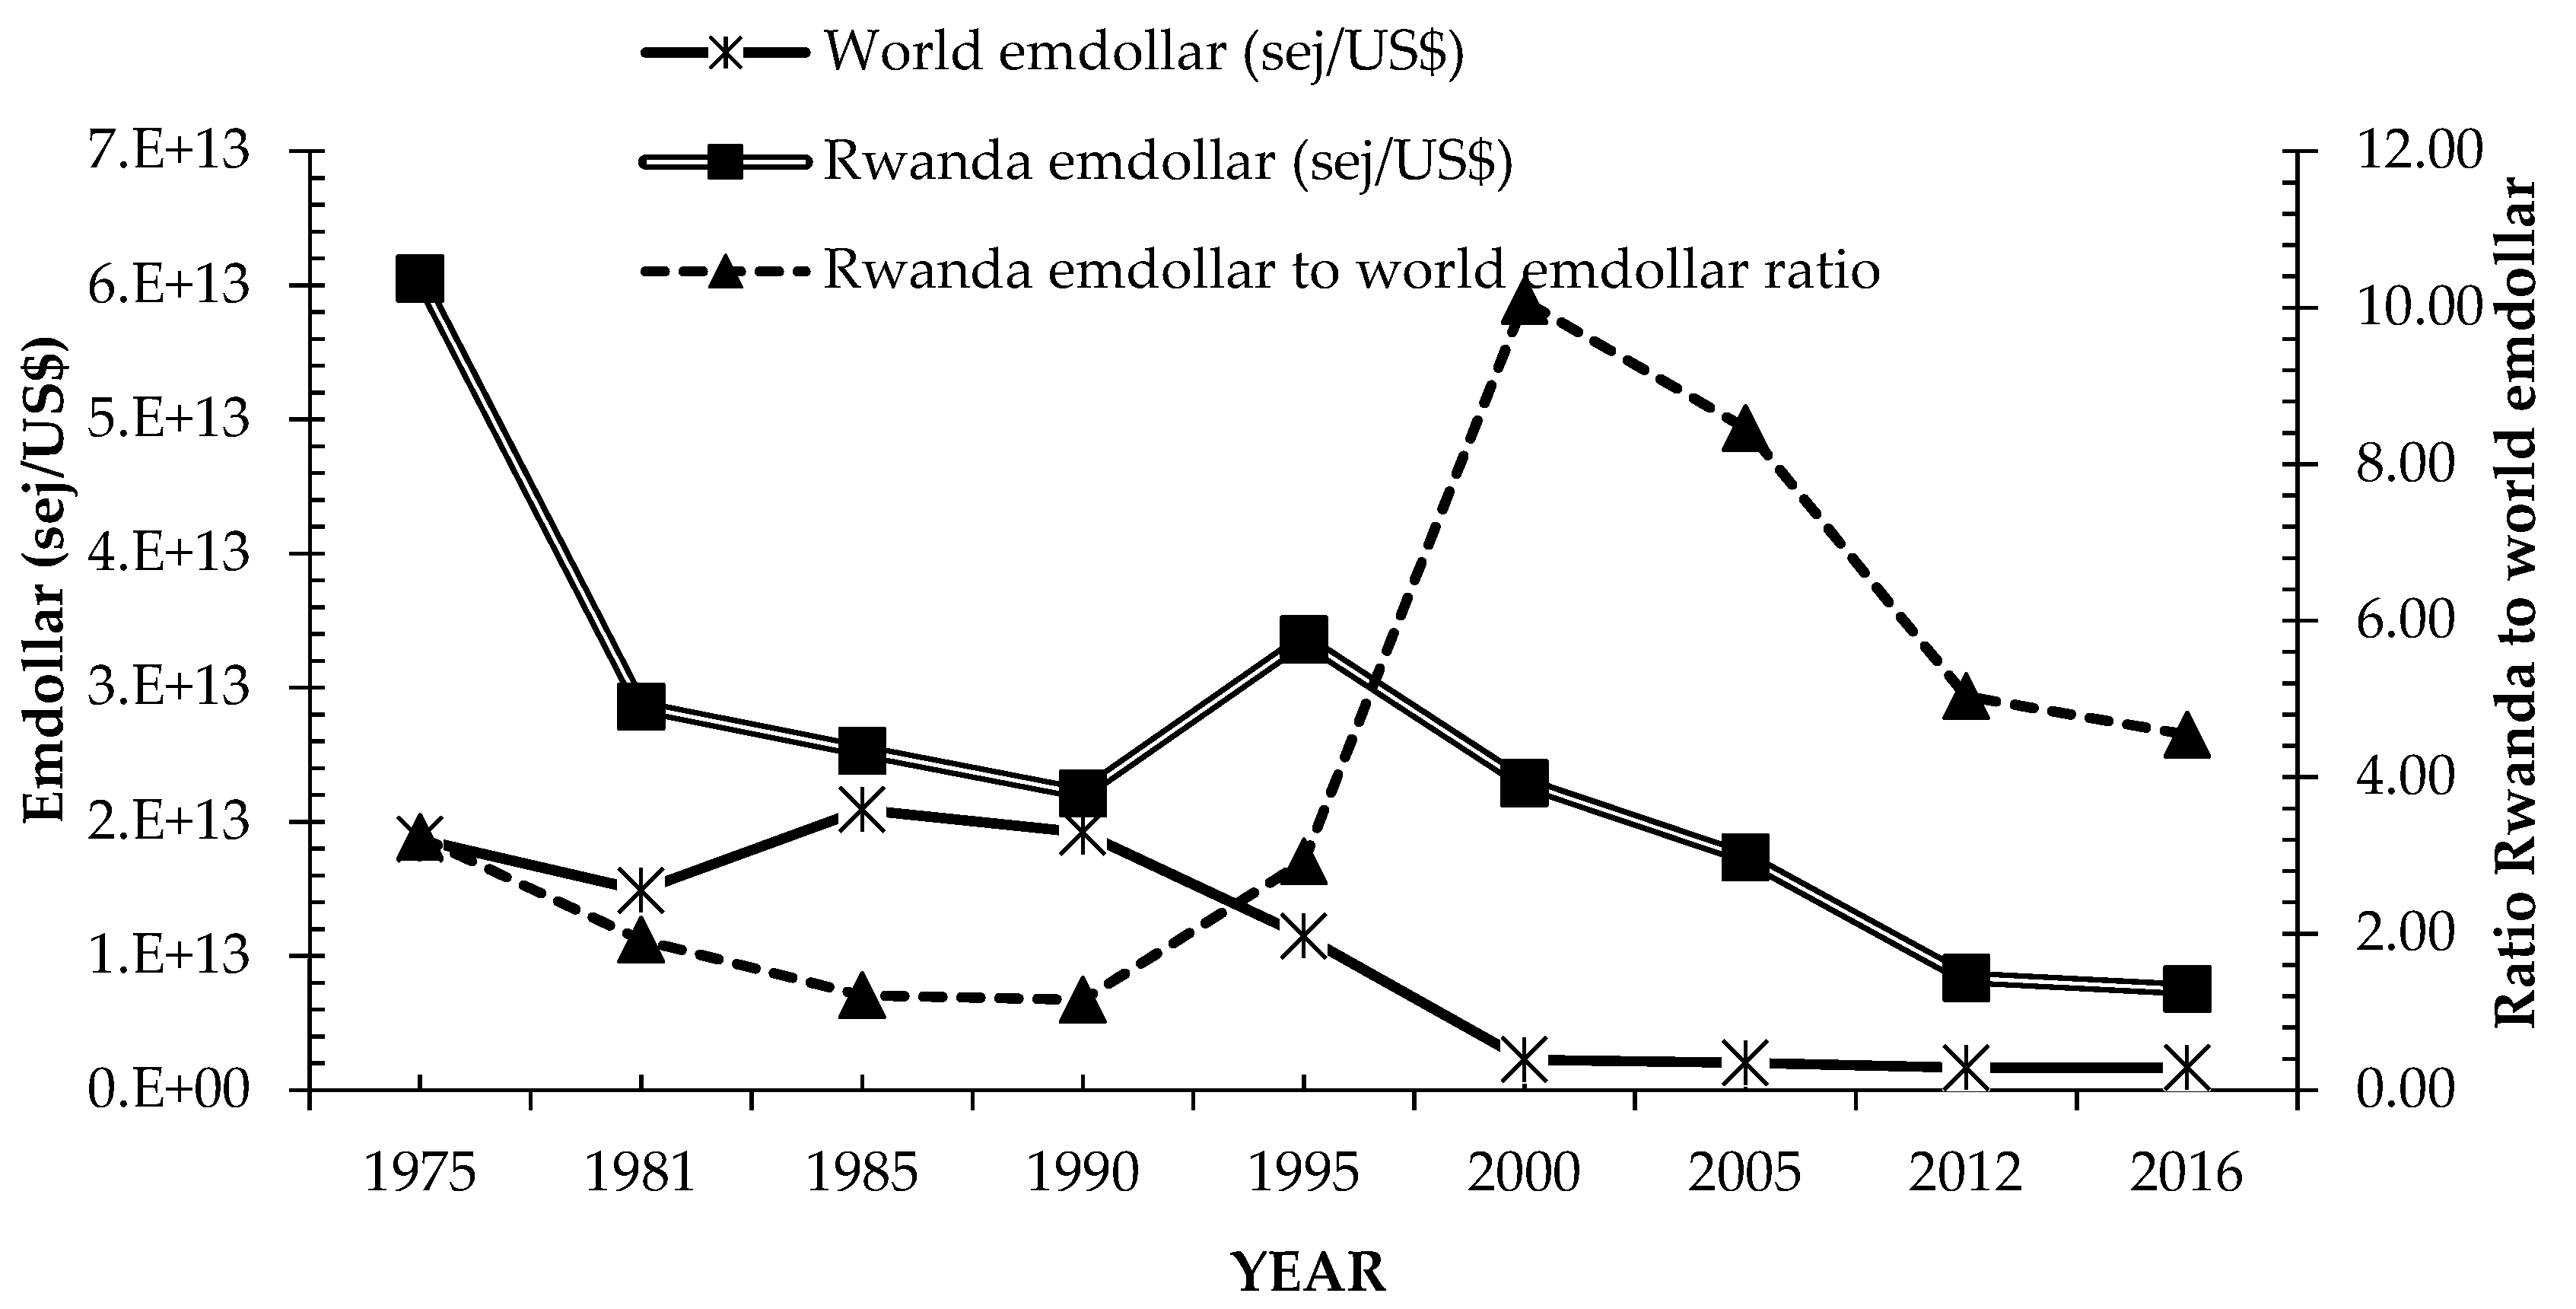
| 27 | Ratio Rwanda to world emdollar | P1/P2 | 3.24 | 1.92 | 1.21 | 1.15 | 2.92 | 10.08 | 8.46 | 5.04 | 4.54 |
| Item | Unit | Pre-Genocide | Post-Genocide | ||||||||
|---|---|---|---|---|---|---|---|---|---|---|---|
| 1975 | 1981 | 1985 | 1990 | 1995 | 2000 | 2005 | 2012 | 2016 | |||
| R | Renewable sources | sej/yr | 3.39 × 10²² | 3.39 × 10²² | 3.39 × 10²² | 3.39 × 10²² | 3.39 × 10²² | 3.39 × 10²² | 3.39 × 10²² | 3.39 × 10²² | 3.39 × 10²² |
| N | Non-renewable Resources | sej/yr | 3.21 × 10¹⁸ | 3.21 × 10¹⁸ | 4.73 × 10¹⁸ | 4.69 × 10¹⁸ | 3.35 × 10¹⁸ | 3.50 × 10¹⁸ | 4.38 × 10¹⁸ | 4.73 × 10¹⁸ | 4.65 × 10¹⁹ |
| NO | Local Disposal resources | sej/yr | 3.21 × 10¹⁸ | 3.21 × 10¹⁸ | 3.21 × 10¹⁸ | 3.21 × 10¹⁸ | 3.21 × 10¹⁸ | 3.21 × 10¹⁸ | 3.21 × 10¹⁸ | 3.21 × 10¹⁸ | 3.21 × 10¹⁸ |
| N1 | Local Concentrated use | sej/yr | 0.00 | 0.00 | 1.53 × 10¹⁸ | 1.48 × 10¹⁸ | 1.43 × 10¹⁷ | 2.98 × 10¹⁷ | 1.17 × 10¹⁸ | 1.53 × 10¹⁸ | 4.33 × 10¹⁹ |
| N2 | Export of unprocessed material | sej/yr | 9.90 × 10¹⁸ | 6.77 × 10¹⁸ | 4.57 × 10¹⁸ | 2.99 × 10¹⁸ | 5.12 × 10¹⁷ | 3.00 × 10¹⁸ | 1.53 × 10¹⁹ | 2.40 × 10¹⁹ | 7.38 × 10¹⁸ |
| F | Fuels (J) | sej/yr | 8.45 × 10¹⁹ | 1.66 × 10²⁰ | 2.19 × 10²⁰ | 2.25 × 10²⁰ | 1.47 × 10²⁰ | 2.30 × 10²⁰ | 3.08 × 10²⁰ | 6.60 × 10²⁰ | 8.11 × 10²⁰ |
| E | Dollars paid for imports | $ | 8.38 × 10⁷ | 1.92 × 10⁸ | 2.22 × 10⁸ | 2.92 × 10⁸ | 2.31 × 10⁸ | 2.41 × 10⁸ | 2.99 × 10⁸ | 1.85 × 10⁹ | 2.02 × 10⁹ |
| E3 | Dollars paid for import services | $ | 1.74 × 10⁷ | 1.53 × 10⁸ | 1.19 × 10⁸ | 1.09 × 10⁸ | 1.03 × 10⁸ | 2.98 × 10⁸ | 3.35 × 10⁸ | 4.63 × 10⁷ | 2.25 × 10⁹ |
| G | Import Goods | sej/yr | 1.95 × 10²¹ | 6.52 × 10²¹ | 8.90 × 10²¹ | 3.60 × 10²¹ | 5.07 × 10²¹ | 4.32 × 10²¹ | 1.08 × 10²² | 2.47 × 10²² | 2.69 × 10²² |
| P2E | Import Services | sej/yr | 3.25 × 10²⁰ | 2.28 × 10²¹ | 2.49 × 10²¹ | 2.09 × 10²¹ | 1.19 × 10²¹ | 4.43 × 10²⁰ | 2.29 × 10¹⁹ | 7.69 × 10¹⁹ | 1.42 × 10²¹ |
| I | Dollars received for exports | $ | 4.20 × 10⁷ | 7.42 × 10⁷ | 1.40 × 10⁸ | 1.05 × 10⁸ | 5.97 × 10⁷ | 5.66 × 10⁷ | 8.44 × 10⁷ | 4.83 × 10⁸ | 5.99 × 10⁸ |
| I3 | Dollars paid for export services | $ | 1.05 × 10⁷ | 6.41 × 10⁷ | 4.53 × 10⁷ | 3.79 × 10⁷ | 6.91 × 10⁶ | 5.30 × 10⁷ | 3.49 × 10⁷ | 4.47 × 10⁸ | 9.97 × 10⁸ |
| B+N2 | Export Goods | sej/yr | 8.89 × 10¹⁹ | 2.17 × 10²⁰ | 3.87 × 10²⁰ | 2.21 × 10²⁰ | 2.50 × 10²⁰ | 1.37 × 10²⁰ | 4.30 × 10²¹ | 1.15 × 10²² | 1.10 × 10²¹ |
| P1I | Export Services | sej/yr | 6.35 × 10²⁰ | 1.83 × 10²¹ | 1.15 × 10²¹ | 8.39 × 10²⁰ | 2.32 × 10²⁰ | 1.21 × 10²¹ | 6.05 × 10²⁰ | 3.73 × 10²¹ | 7.51 × 10²¹ |
| B | Export products transformed within | sej/yr | 7.90 × 10¹⁹ | 8.77 × 10¹⁹ | 9.92 × 10¹⁹ | 1.01 × 10²⁰ | 4.60 × 10¹⁹ | 5.52 × 10¹⁹ | 1.26 × 10²⁰ | 1.77 × 10²⁰ | 8.10 × 10¹⁹ |
| P2 | World emdollar | sej/$ | 1.87 × 10¹³ | 1.49 × 10¹³ | 2.09 × 10¹³ | 1.92 × 10¹³ | 1.15 × 10¹³ | 2.27 × 10¹² | 2.05 × 10¹² | 1.66 × 10¹² | 1.66 × 10¹² |
| P1 | Rwanda emdollar | sej/$ | 6.05 × 10¹³ | 2.86 × 10¹³ | 2.53 × 10¹³ | 2.21 × 10¹³ | 3.36 × 10¹³ | 2.29 × 10¹³ | 1.73 × 10¹³ | 8.24 × 10¹² | 7.54 × 10¹² |
| GNP ($) | $ | 6.00 × 10⁸ | 1.50 × 10⁹ | 1.80 × 10⁹ | 1.80 × 10⁹ | 1.20 × 10⁹ | 1.70 × 10⁹ | 2.60 × 10⁹ | 7.10 × 10⁹ | 8.38 × 10⁹ | |
References
- Wilson, M.A.; Howarth, R.B. Discourse-based valuation of ecosystem services: Establishing fair outcomes through group deliberation. Ecol. Econ. 2002, 41, 431–443. [Google Scholar] [CrossRef]
- Shaw, R.P. Rapid population growth and environmental degradation: Ultimate versus proximate factors. Environ. Conserv. 1989, 16, 199–208. [Google Scholar] [CrossRef] [PubMed]
- Alam, S. Globalization, Poverty and Environmental Degradation: Sustainable Development in Pakistan. Sustain. Dev. 2010, 3, 103–114. [Google Scholar] [CrossRef]
- Shafik, N. Economic Development and Environmental Quality: An Econometric Analysis. Oxf. Econ. Pap. 1994, 46, 757–773. [Google Scholar] [CrossRef]
- International Monetary Fund (IMF). Regional Economic Outlook: Sub-Saharan Africa Restarting the Growth Engine; International Monetary Fund (IMF): Washington, DC, USA, 2017. [Google Scholar]
- Kimball, S.; Lulow, M.; Sorenson, Q.; Balazs, K.; Fang, Yi.; Davis, S.J.; O’Connell, M.; Huxman, T.E. Cost-effective ecological restoration. Restor. Ecol. 2015, 23, 800–810. [Google Scholar] [CrossRef]
- Harte, J. Human population as a dynamic factor in environmental degradation. Popul. Environ. 2007, 28, 223–236. [Google Scholar] [CrossRef]
- Ray, S. Impact of Population Growth on Environmental Degradation: Case of India. J. Econ. Sustain. Dev. 2011, 2, 72–78. [Google Scholar]
- Atiqul, S.H.; Vanwing, T. Perception, Environmental Degradation and Family Size Preference: A Context of Developing Countries. J. Sustain. Dev. 2010, 3, 102–108. [Google Scholar] [CrossRef]
- Economic Commission for Africa (ECA). The Demography Profile of African Countries; Economic Commission for Africa (ECA): Addis Ababa, Ethiopia, 2016. [Google Scholar]
- Lei, K.; Hu, D.; Zhou, S.; Guo, Z. Monitoring the sustainability and equity of socioeconomic development: A comparison of emergy indices using Macao, Italy and Sweden as examples. Acta Ecol. Sin. 2012, 32, 165–173. [Google Scholar] [CrossRef]
- Giannetti, B.F.; Ogura, Y.; Bonilla, S.H.; Almeida, C.M.V.B. Emergy assessment of a coffee farm in Brazilian Cerrado considering in a broad form the environmental services, negative externalities and fair price. Agric. Syst. 2011, 104, 679–688. [Google Scholar] [CrossRef]
- Liu, G.; Yang, Z.; Chen, B.; Ulgiati, S. Emergy-based dynamic mechanisms of urban development, resource consumption and environmental impacts. Ecol. Model. 2014, 271, 90–102. [Google Scholar] [CrossRef]
- Tilley, D.R.; Swank, W.T. EMERGY-based environmental systems assessment of a multi-purpose temperate mixed-forest watershed of the southern Appalachian Mountains, USA. J. Environ. Manag. 2003, 69, 213–227. [Google Scholar] [CrossRef]
- Yang, Z.F.; Jiang, M.M.; Chen, B.; Zhou, J.B.; Chen, G.Q.; Li, S.C. Solar emergy evaluation for Chinese economy. Energy Policy 2010, 38, 875–886. [Google Scholar] [CrossRef]
- Sawyerr, A. African Universities and the Challenge of Research Capacity Development. J. High. Educ. Afr./Rev. l’enseignement supérieur en Afrique 2004, 2, 211–240. [Google Scholar]
- Kayizzi-Mugerwa, S. Reforming Africa’s Institutions Ownership, Incentives, and Capabilities; United Nations University: New York, NY, USA, 2003. [Google Scholar]
- Hossaini, N.; Hewage, K. Emergy accounting for regional studies: Case study of Canada and its provinces. J. Environ. Manag. 2013, 118, 177–185. [Google Scholar] [CrossRef] [PubMed]
- Oliveira, C.; Martins, C.; Gonçalves, J.; Veiga, F. Solar Emergy Evaluation of the Portuguese Economy. In Proceedings of the 7th Biennial Conference on Emergy and Environmental Accounting–Theories, Applications and Methodologies, Center for Environmental Policy-University of Florida, Gainesville, FL, USA, 12–14 January 2012; pp. 437–451. [Google Scholar]
- Zhang, L.X.; Ulgiati, S.; Yang, Z.F.; Chen, B. Emergy evaluation and economic analysis of three wetland fish farming systems in Nansi Lake area, China. J. Environ. Manag. 2011, 92, 683–694. [Google Scholar] [CrossRef] [PubMed]
- Lehmensiek, M. Evaluation of Tourism in the Okavango Delta in Botswana Using Environmental Accounting; University of Florida: Gainesville, FL, USA, 2004; p. 86. [Google Scholar]
- Sarkis, J.; Ulgiati, S. China-USA Trade: Indicators for Equitable and Environmentally Balanced Resource Exchange. Ecol. Econ. 2017, 132, 245–254. [Google Scholar]
- Ulgiati, S.; Odum, H.T.; Bastianoni, S. Emergy use, environmental loading and sustainability an emergy analysis of Italy. Ecol. Model. 1994, 73, 215–268. [Google Scholar] [CrossRef]
- Coscieme, L.; Pulselli, F.M.; Marchettini, N.; Sutton, P.C.; Anderson, S.; Sweeney, S. Emergy and ecosystem services: A national biogeographical assessment. Ecosyst. Serv. 2014, 7, 152–159. [Google Scholar] [CrossRef]
- Ulgiati, S. A Comprehensive Energy and Economic Assessment of Biofuels: When ‘Green’ Is Not Enough. CRC Crit. Rev. Plant Sci. 2001, 20, 71–106. [Google Scholar] [CrossRef]
- Rutebuka, E.; Zhang, L.; Pang, M. Simulating the Dynamics of E-waste Production from Mobile Phone: Model Development and Case Study of Rwanda. J. Environ. Account. Manag. 2015, 3, 309–322. [Google Scholar] [CrossRef]
- The World Bank. Rwanda Economic Update: Seeds for Higher Growth; The World Bank: Kigali, Rwanda; Washington, DC, USA, 2011. [Google Scholar]
- National Institute of Statistic of Rwanda (NISR). Statistical Yearbook 2014; National Institute of Statistic of Rwanda (NISR): Kigali, Rwanda, 2014. [Google Scholar]
- United Nations Development Programme (UNDP). Turning Vision 2020 into Reality from Recovery to Sustainable Human Development; UNDP: Kigali, Rwanda, 2007. [Google Scholar]
- Kaberuka, D. Rwanda Vision 2020; MINECOFIN: Kigali, Rwanda, 2000. [Google Scholar]
- Diao, X.; Bahiigwa, G.; Pradesha, A. The Role of Agriculture in the Fast-Growing Rwandan Economy: Assessing Growth Alternatives; The International Food Policy Reaserch Institute (IFPRS): Washington, DC, USA, 2014. [Google Scholar]
- Malunda, D. African Centre for Economic Transformation (ACET) Rwanda: Case Study on Economic Transformation; Institute of Policy Analysis and Research–Rwanda (IPAR): Kigali, Rwanda, 2012. [Google Scholar]
- Rutayisire, M.J. Economic Liberalization, Monetary Policy and Money Demand in Rwanda: 1980–2005; African Economic Research Consortium: Nairobi, Kenya, 2010; Volume 193. [Google Scholar]
- Ggombe, K.; Newfarmer, R. Rwanda: From Devastation to Services-First Transformation; No. 2017/84; United Nations University-World Institute for Development Economic Research (UNU-WIDER): Helsinki, Finland, 2017. [Google Scholar]
- Odum, H.T. Environmental Accounting. Emergy and Environmental Decision Making; John Wiley and Sons: New York, NY, USA, 1996. [Google Scholar]
- Brown, M.T.; Bardi, E.; Campbell, D.E.; Comar, V.; Haung, S.-L.; Tilley, D. Theory and Applications of the Emergy Methodology Emergy. Emergy Synth. 2005, 3, 362–371. [Google Scholar]
- Brown, M.; Herendeen, R. Embodied energy analysis and EMERGY analysis: A comparative view. Ecol. Econ. 1996, 19, 219–235. [Google Scholar] [CrossRef]
- Brown, M.T.; Ulgiati, S. Energy quality, emergy, and transformity: H.T. Odum’s contributions to quantifying and understanding systems. Ecol. Model. 2004, 178, 201–213. [Google Scholar] [CrossRef]
- Odum, H.T.; Brown, M.T.; Brandt-Williams, S. Handbook of Emergy Evaluation A: Introduction and Global Budget; University of Florida: Gainesville, FL, USA, 2000. [Google Scholar]
- Brown, M.T.; Ulgiati, S. Assessing the global environmental sources driving the geobiosphere: A revised emergy baseline. Ecol. Model. 2016, 339, 126–132. [Google Scholar] [CrossRef]
- Brown, M.T.; Ulgiati, S. Emergy assessment of global renewable sources. Ecol. Model. 2016, 339, 148–156. [Google Scholar] [CrossRef]
- Chen, G.Q.; Jiang, M.M.; Chen, B.; Yang, Z.F.; Lin, C. Emergy analysis of Chinese agriculture. Agric. Ecosyst. Environ. 2006, 115, 161–173. [Google Scholar] [CrossRef]
- Campbell, D.E.; Ohrt, A. Environmental Accounting Using Emergy: Evaluation of Minnesota; US Environmental Protection Agency (USEPA): Washington, DC, USA, 2009. [Google Scholar]
- Lefroy, E.; Rydberg, T. Emergy evaluation of three cropping systems in southwestern Australia. Ecol. Model. 2003, 161, 195–211. [Google Scholar] [CrossRef]
- Brown, M.T.; Bardi, E. A Compendium of Data for Emergy Computation: Handbook of Emergy Evaluation; University of Florida: Gainesville, FL, USA, 2001. [Google Scholar]
- Murdoch, A. 10 Facts about Hunger in Rwanda. World Food Programme (WFP), 2015. Available online: https://www.wfp.org/stories/10-facts-about-hunger-rwanda (accessed on 4 May 2018).
- Jiang, M.M.; Zhou, J.B.; Chen, B.; Chen, G.Q. Emergy-based ecological account for the Chinese economy in 2004. Commun. Nonlinear Sci. Numer. Simul. 2008, 13, 2337–2356. [Google Scholar] [CrossRef]
- Lei, K.; Wang, Z. Emergy synthesis of tourism-based urban ecosystem. J. Environ. Manag. 2008, 88, 831–844. [Google Scholar] [CrossRef] [PubMed]
- Agostinho, F.; Ortega, E. Integrated food, energy and environmental services production as an alternative for small rural properties in Brazil. Energy 2012, 37, 103–114. [Google Scholar] [CrossRef]
- National Bank of Rwanda (BNR). Foreign Private Investment in Rwanda 2015; National Bank of Rwanda (BNR): Kigali, Rwanda, 2015. [Google Scholar]
- Brown, M.T.; Ulgiati, S. Emergy-based indices and ratios to evaluate sustainability: Monitoring economies and technology toward environmentally sound innovation. Ecol. Eng. 1997, 9, 51–69. [Google Scholar] [CrossRef]
- Campbell, D.E.; Brandt-Williams, S.L.; Meisch, M.E.A. Environmental Accounting Using Emergy: Evaluation of the State of West Virginia; U.S. Environmental Protection Agency: Washington, DC, USA, 2009. [Google Scholar]
- United Nations (UN). Investment Policy Review Rwanda; United Nations (UN): New York, NY, USA, 2006. [Google Scholar]
- Pereira, L.; Zucaro, A.; Ortega, E.; Ulgiati, S. Wealth, trade and environment in brazil and Italy. An emergy-based comparison of carrying capacity, economic performance and wellbeing. In Proceedings of the 7th Biennial International Workshop Advances in Energy Studies, Barcelona, Spain, 19–21 October 2010. [Google Scholar]
- Kampeng, L.; Shaoqi, Z.; Wang, Z. Ecological Emergy Accounting for a Limited System: General Principles and a Case Study of Macao; Science Press: Beijing, China; Springer: Berlin/Heidelberg, Germany, 2014. [Google Scholar]
- Hagström, P.; Nilsson, P.O. Emergy Evaluation of the Swedish Economy since the 1950s. In Proceedings of the Third Biennial Emergy Conference, Gainesville, FL, USA, 29–31 January 2004; pp. 1–18. [Google Scholar]
- Brown, M.T.; Ulgiati, S. Emergy evaluations and environmental loading of electricity production systems. J. Clean. Prod. 2002, 10, 321–334. [Google Scholar] [CrossRef]
- Meng, W.; Hao, C.; Li, H.; Ju, M. Emergy analysis for sustainability evaluation of the Baiyangdian wetland ecosystem in China. Front. Environ. Sci. Eng. 2010, 4, 203–212. [Google Scholar] [CrossRef]
- Lou, B.; Ulgiati, S. Identifying the environmental support and constraints to the Chinese economic growth-An application of the Emergy Accounting method. Energy Policy 2013, 55, 217–233. [Google Scholar] [CrossRef]
- Campbell, D.E. Emergy analysis of human carrying capacity and regional sustainability: An example using the State of Maine. Environ. Monit. Assess. 1998, 51, 531–569. [Google Scholar] [CrossRef]
- Brown, M.T.; Ulgiati, S. Emergy measures of carrying capacity to evaluate economic investments. Popul. Environ. 2001, 22, 471–501. [Google Scholar] [CrossRef]
- Nakajima, E.S.; Ortega, E. Carrying Capacity Using Emergy Evaluation and Ecological Footprint. In Proceedings of the 8th Biennial Emergy, Gainesville, FL, USA, 15–18 January 2014; pp. 261–274. [Google Scholar]
- Cavalett, O.; Ortega, E. Creation of a Global Emergy Database for Standardized National Emergy Synthesis. Emergy Synth. 2007, 4, 483–497. [Google Scholar]
- Brown, M.T.; McClanahan, T.R. Emergy analysis perspectives of Thailand and Mekong River dam proposals. Ecol. Model. 1996, 91, 105–130. [Google Scholar] [CrossRef]


| Country | Total Emergy Use E20sej/Year | Emergy Use Per Person E15sej/Person | Emergy/Money Ratio E12sej/USD | Empower Density E11 sej/m2/Year | Emergy Import/Export | Emergy Self-Support Ratio (%) | Environmental Loading Ratio | The Ratio of Electricity to Use % | Emergy Sustainable Index (ESI) |
|---|---|---|---|---|---|---|---|---|---|
| Rwanda/2016 * | 631 | 5.3 | 7.54 | 23.97 | 3.38 | 54 | 0.86 | 1.4 | 2.52 |
| Canada/2011 a | 57,200 | 173 | 4.22 | 5.99 | 0.46 | 76 | 2.3 | - | 1.59 |
| Portugal/2009 b | 14,500 | 136 | 1.18 | 157.00 | 0.97 | 54 | 22.57 | - | 0.10 |
| Italy/2008 c | 33,700 | 55.2 | 2.15 | 110.00 | 1.60 | - | 15.80 | - | 0.09 |
| Brazil/2008 c | 40,000 | 21.0 | 2.75 | 4.69 | 0.75 | - | 0.25 | - | 23.82 |
| China/ 2004 ** | 192,400 | 15.3 | 12.0 | 20.76 | 0.64 | 81 | 9.29 | 8.84 | |
| Australia ** | 8850 | 59.0 | 6.4 | 1.42 | 0.39 | 92 | 0.86 | 6.8 | - |
| Dominica ** | 7 | 13.0 | 14.9 | 8.80 | 0.84 | 69 | 2.67 | <0.01 | - |
| Ecuador ** | 964 | 10.7 | 8.7 | 3.40 | 0.20 | 94 | 0.54 | 3.2 | - |
| India ** | 6750 | 1.0 | 6.4 | 2.05 | 1.45 | 88 | 1.02 | 10 | - |
| Japan ** | 15,300 | 12.6 | 2.1 | 41.09 | 4.2 | 31 | 8.34 | 26.1 | - |
| Liberia ** | 465 | 26.0 | 34.5 | 4.10 | 0.15 | 92 | 0.09 | 1.0 | - |
| Netherlands ** | 3702 | 26.0 | 2.2 | 100.00 | 4.30 | 23 | 15.9 | 10.0 | - |
| Papua N. Guinea ** | 1216 | 35.0 | 48 | 2.63 | 0.09 | 96 | 0.15 | 0.8 | - |
| Poland ** | 964 | 9.6 | 6 | 10.60 | 0.65 | 66 | 19.78 | 18.0 | - |
| Spain ** | 2090 | 6.0 | 1.6 | 3.12 | 2.30 | 24 | 7.20 | 22.0 | - |
| Sweden ** | 4110 | 48.0 | 2.6 | 10.00 | 1.30 | 46 | 7.04 | 23.5 | - |
| Switzerland ** | 733 | 12.0 | 0.7 | 17.70 | 3.20 | 19 | 7.44 | 32.0 | - |
| Thailand ** | 1509 | 3.2 | 3.7 | 2.15 | 0.54 | 70 | 1.04 | 10.8 | - |
| USA ** | 117,800 | 41.9 | 1.19 | 12.53 | 1.27 | 72 | 5.85 | 3.8 | - |
© 2018 by the authors. Licensee MDPI, Basel, Switzerland. This article is an open access article distributed under the terms and conditions of the Creative Commons Attribution (CC BY) license (http://creativecommons.org/licenses/by/4.0/).
Share and Cite
Rutebuka, E.; Zhang, L.; Asamoah, E.F.; Pang, M.; Rukundo, E. Resource Dynamism of the Rwandan Economy: An Emergy Approach. Sustainability 2018, 10, 1791. https://doi.org/10.3390/su10061791
Rutebuka E, Zhang L, Asamoah EF, Pang M, Rukundo E. Resource Dynamism of the Rwandan Economy: An Emergy Approach. Sustainability. 2018; 10(6):1791. https://doi.org/10.3390/su10061791
Chicago/Turabian StyleRutebuka, Evariste, Lixiao Zhang, Ernest Frimpong Asamoah, Mingyue Pang, and Emmanuel Rukundo. 2018. "Resource Dynamism of the Rwandan Economy: An Emergy Approach" Sustainability 10, no. 6: 1791. https://doi.org/10.3390/su10061791
APA StyleRutebuka, E., Zhang, L., Asamoah, E. F., Pang, M., & Rukundo, E. (2018). Resource Dynamism of the Rwandan Economy: An Emergy Approach. Sustainability, 10(6), 1791. https://doi.org/10.3390/su10061791