Article

Plant Communities Suitable for Green Roofs in Arid Regions

1
Department of Plant and Environmental Sciences, New Mexico State University, P.O. Box 30003, Las Cruces, NM 88003, USA
2
Department of Horticulture and Crop Science, The University of Jordan, 11942 Amman, Jordan
3
American Hydrotech, Inc., 303 E. Ohio, Suite 2700, Chicago, IL 60611, USA
4
Agricultural Biometric Service, New Mexico State University, Las Cruces, NM 88003, USA
*
Author to whom correspondence should be addressed.
Sustainability 2018, 10(6), 1755; https://doi.org/10.3390/su10061755
Submission received: 24 April 2018 / Revised: 22 May 2018 / Accepted: 23 May 2018 / Published: 27 May 2018

Abstract

:
In extensive green roof settings, plant communities can be more robust than monocultures. In addition, native plants might be hardier and more ecologically sound choices than non-native plants in green roof systems. The objectives of this research were to (1) compare the performance of plant communities with that of monocultures and (2) compare the growth of natives to non-natives in a simulated green roof setting. We conducted a two-year experiment at an outdoor site in a desert environment using four plant morphological types (groundcover, forb, succulent and grass). Native plants selected were Chrysactinia mexicana, Melampodium leucanthum, Euphorbia antisyphilitica, and Nassella tenuissima, and non-natives were Delosperma nubigenum, Stachys byzantina, Sedum kamtschiaticum and Festuca glauca. Plants were assigned randomly to either monoculture or community and grown in 1 m × 1 m custom-built trays filled with 15 cm of a proprietary blend of 50/20/30 lightweight aggregate/sand/compost (by volume). Native forb, Melampodium, in community had greater coverage for four of the five measurements in the first year over native forb in monoculture and non-native forb regardless of setting. Native forb coverage was also greater than non-native forb for three of the four measurements in year 2, regardless of setting. Coverage of native grass was significantly greater than non-native grasses throughout the experiment. Coverage was also greater for eight of nine measurements for native succulent over non-natives succulent. However, non-native groundcover coverage was significantly greater than native groundcover for seven of nine measurements. On 1 November 2016, relative water content (RWC) for succulents (p = 0.0424) was greatest for native Euphorbia in monoculture at 88%. Native Euphorbia also had greater RWC than non-native Sedum on 4 April 2017 (78%) and 4 July 2017 (80%). However, non-native Sedum had greater root length (6548 cm), root dry weight (12.1 g), and root-to-shoot dry weight ratio (0.45) than native Euphorbia. At the end of year 2, the relative growth rate (RGR) of native Euphorbia of 0.15 g·g−1·d−1 was greater than that of Sedum. While the native succulent had a smaller root biomass, its greater RWC and RGR would indicate it had better plant water status and grew faster than the non-native. The lack of differences in plant performance regardless of assignment to monoculture or community would imply that communities and monocultures are equally suitable for arid region green roofs.

1. Introduction

The green roof industry has experienced double digit growth for much of the past decade [1]. An industry survey of US and Canadian green roof projects indicated that more than 695,260 square meters of green roof were installed in 2015 and another 377,281 square meters installed in 2016 [1]. The top three cities for green roof installations in 2016 were Toronto, ON, CA, Chicago, IL, and Washington, DC. The increase is due to the many advantages that green roofs can provide [2], including increased urban habitat [3,4,5] and providing an aesthetically pleasing environment for humans [6,7]. The idea of green roofs as a place that is aesthetically soothing merges with the concept of biophilia [8,9], which proposes that humans have evolved to interact with the natural world because that interaction has provided emotional, physical, and intellectual fitness for humans over the course of our evolution [10,11]. Green roofs can play a part in satisfying biophilic needs of humans, helping to improve human well-being, health, and productivity [10]. Other benefits of green roofs include increased roof membrane longevity [12,13], improved stormwater management [14,15,16], and a reduction of noise and air pollution [17,18]. Additionally, green roofs can mitigate the urban heat island effect [19] and reduce energy costs [2,20], both of which are particularly important in a desert environment.
To date, few green roofs exist in the desert southwest region of the US, and few studies have explored the use of green roof plants for this zone. Green roof research often has focused on substrate depths [15,21,22,23,24,25,26,27], substrate components [24,26] and irrigation levels [21,24,28]. What research has been done for native plants or plant communities versus monocultures has been done in mesic environments such as Michigan, Canada, and the United Kingdom, where solar radiation is less, and precipitation is more plentiful. However, moist soils, as might be observed in mesic areas may impede the ability of the green roof to offer thermal insulation, and better thermal insulation is provided by a dryer soil [29]. Green roof installation in an arid region can provide greater energy savings and sustainability as it results in a better insulated building.
One of the most important aspects in a successful green roof is correct plant choice [30], but scant research is available on plants that are successful in arid region green roofs. Plant choices for green roofs should not be based solely on what can survive in shallow substrates [31] but should be chosen to help support the other benefits of green roofs, such as increasing urban biodiversity [3]. Choosing regional plants will support the specific biotope [26] and provide habitat for local bird and insect populations and contribute to a more sustainable landscape.
To achieve the full benefits of an aesthetically pleasing space and one that attracts urban fauna, it is equally important to choose plants with a range of growth and morphological characteristics. This is consistent with the Forschungsgesellschaft Landschaftsentwicklung Landschaftbau (FLL) guidelines, which recommend plants that cover the full range of both functional and aesthetic aspects [32]. For this research, four different plant morphological types were chosen—groundcovers, forbs, succulents, and grasses—which have varying benefits. Groundcovers grow horizontally, thus cooling more of the substrate surface, though some may die back in winter, leaving large areas of substrate exposed. Mature forbs can provide shade for nearby plants as well as providing flowers for pollinators. Succulents bring year-round color, texture, and visual interest, and grasses can be very hardy and can bring a kinetic aspect to the installation but may need more annual maintenance.
Monocultures of plants are common in green roof installations, but they are susceptible to increased pest incidence [33] and can be monotonous [28]. Unexpected environmental events, such as freeze or hail or pathogens, for example, can also unfavorably affect monocultures. If a monoculture is destroyed due to one of these events, the plants must be replaced entirely, and perhaps even the substrate if a soil-borne pathogen is present.
In contrast, plant communities are less susceptible to pests [28] and may provide visual interest year-round. Potential competition amongst species [34,35] and the possibility for increased seasonal maintenance are probable drawbacks. Bousselot [28] suggests that diverse plant selection may avoid problems inherent to monocultures.
Plants that evolved in extreme conditions, like alpine conditions or rock outcroppings [22], may be better choices for extensive green roof installations [36]. With the exception of the Hotovec [24] study, little research has been done on plants for green roof systems in the desert southwest. Native plants chosen for this current research originate in the desert southwest region of the United States, which has dry rocky soils and drought, circumstances that are similar to those found in a green roof setting. We speculate that these plants should be good candidates for an arid region green roof. For this study, we selected the native groundcover Chrysactinia mexicana A. Gray (Damianita), which is drought tolerant, especially after establishment, and can tolerate full and reflected sun [37,38]. The native forb choice was Melampodium leucanthum Torr. & A. Gray (Blackfoot daisy), which can be found on rocky slopes and mesas below 1500 m [39]. The native succulent, Euphorbia antisyphilitica Zucc. (Candelilla), has slender, upright, clustered, cylindrical stems that are essentially leafless except for tiny (0.5 cm) leaves on new growth [38] and does well in rapidly draining soil [40]. Nassella tenuissima (Trinius) Barkworth (Mexican feather grass), the native grass is finely textured and highly drought tolerant. Its dense gold cascade of leaves move freely in the wind [36], which adds a kinetic aspect to the rooftop installation.
Non-native species selected all had a history of excellent performance in green roofs and were also suitable for the arid climate. The native provenance of three of the four non-natives is classified as arid [41] and the fourth, Festuca glauca Vill. (Blue fescue), while native to Europe, was chosen for previous research because its typical habitat is arid [42]. The non-native perennial Delosperma nubigenum (Schltr.) L. Bolus (Hardy ice plant), is native to South and East Africa and is the hardiest of the ice plants, tolerating temperatures to −31 °C [43]. The non-native forb, Stachys byzantina K. Koch (Lambs ear), is native to Iran. Temperatures below the Stachys canopy have been shown to be lower than that of bare soil and had the lowest leaf surface temperature of species in that study [31]. Sedum kamtschiaticum (Fisch) ‘t Hart (Russian or orange stonecrop), the non-native succulent is native to Siberia and Central Asia [44], tolerates dry, well-drained soils and full sun. Sedum had a 100% survival rate in a 7.5 cm substrate depth for 482 days and 87% at a 5.0 cm substrate depth [25]. The non-native grass, Festuca, demonstrated vigorous root growth and a consistently high visual rating in a study by Nagase [42].
We hypothesized that communities of native plants are viable options for green roofs in arid regions. The objectives of this research were to (1) compare the performance of plant communities with that of monocultures and (2) compare growth of natives to non-natives in a simulated green roof setting.

2. Materials and Methods

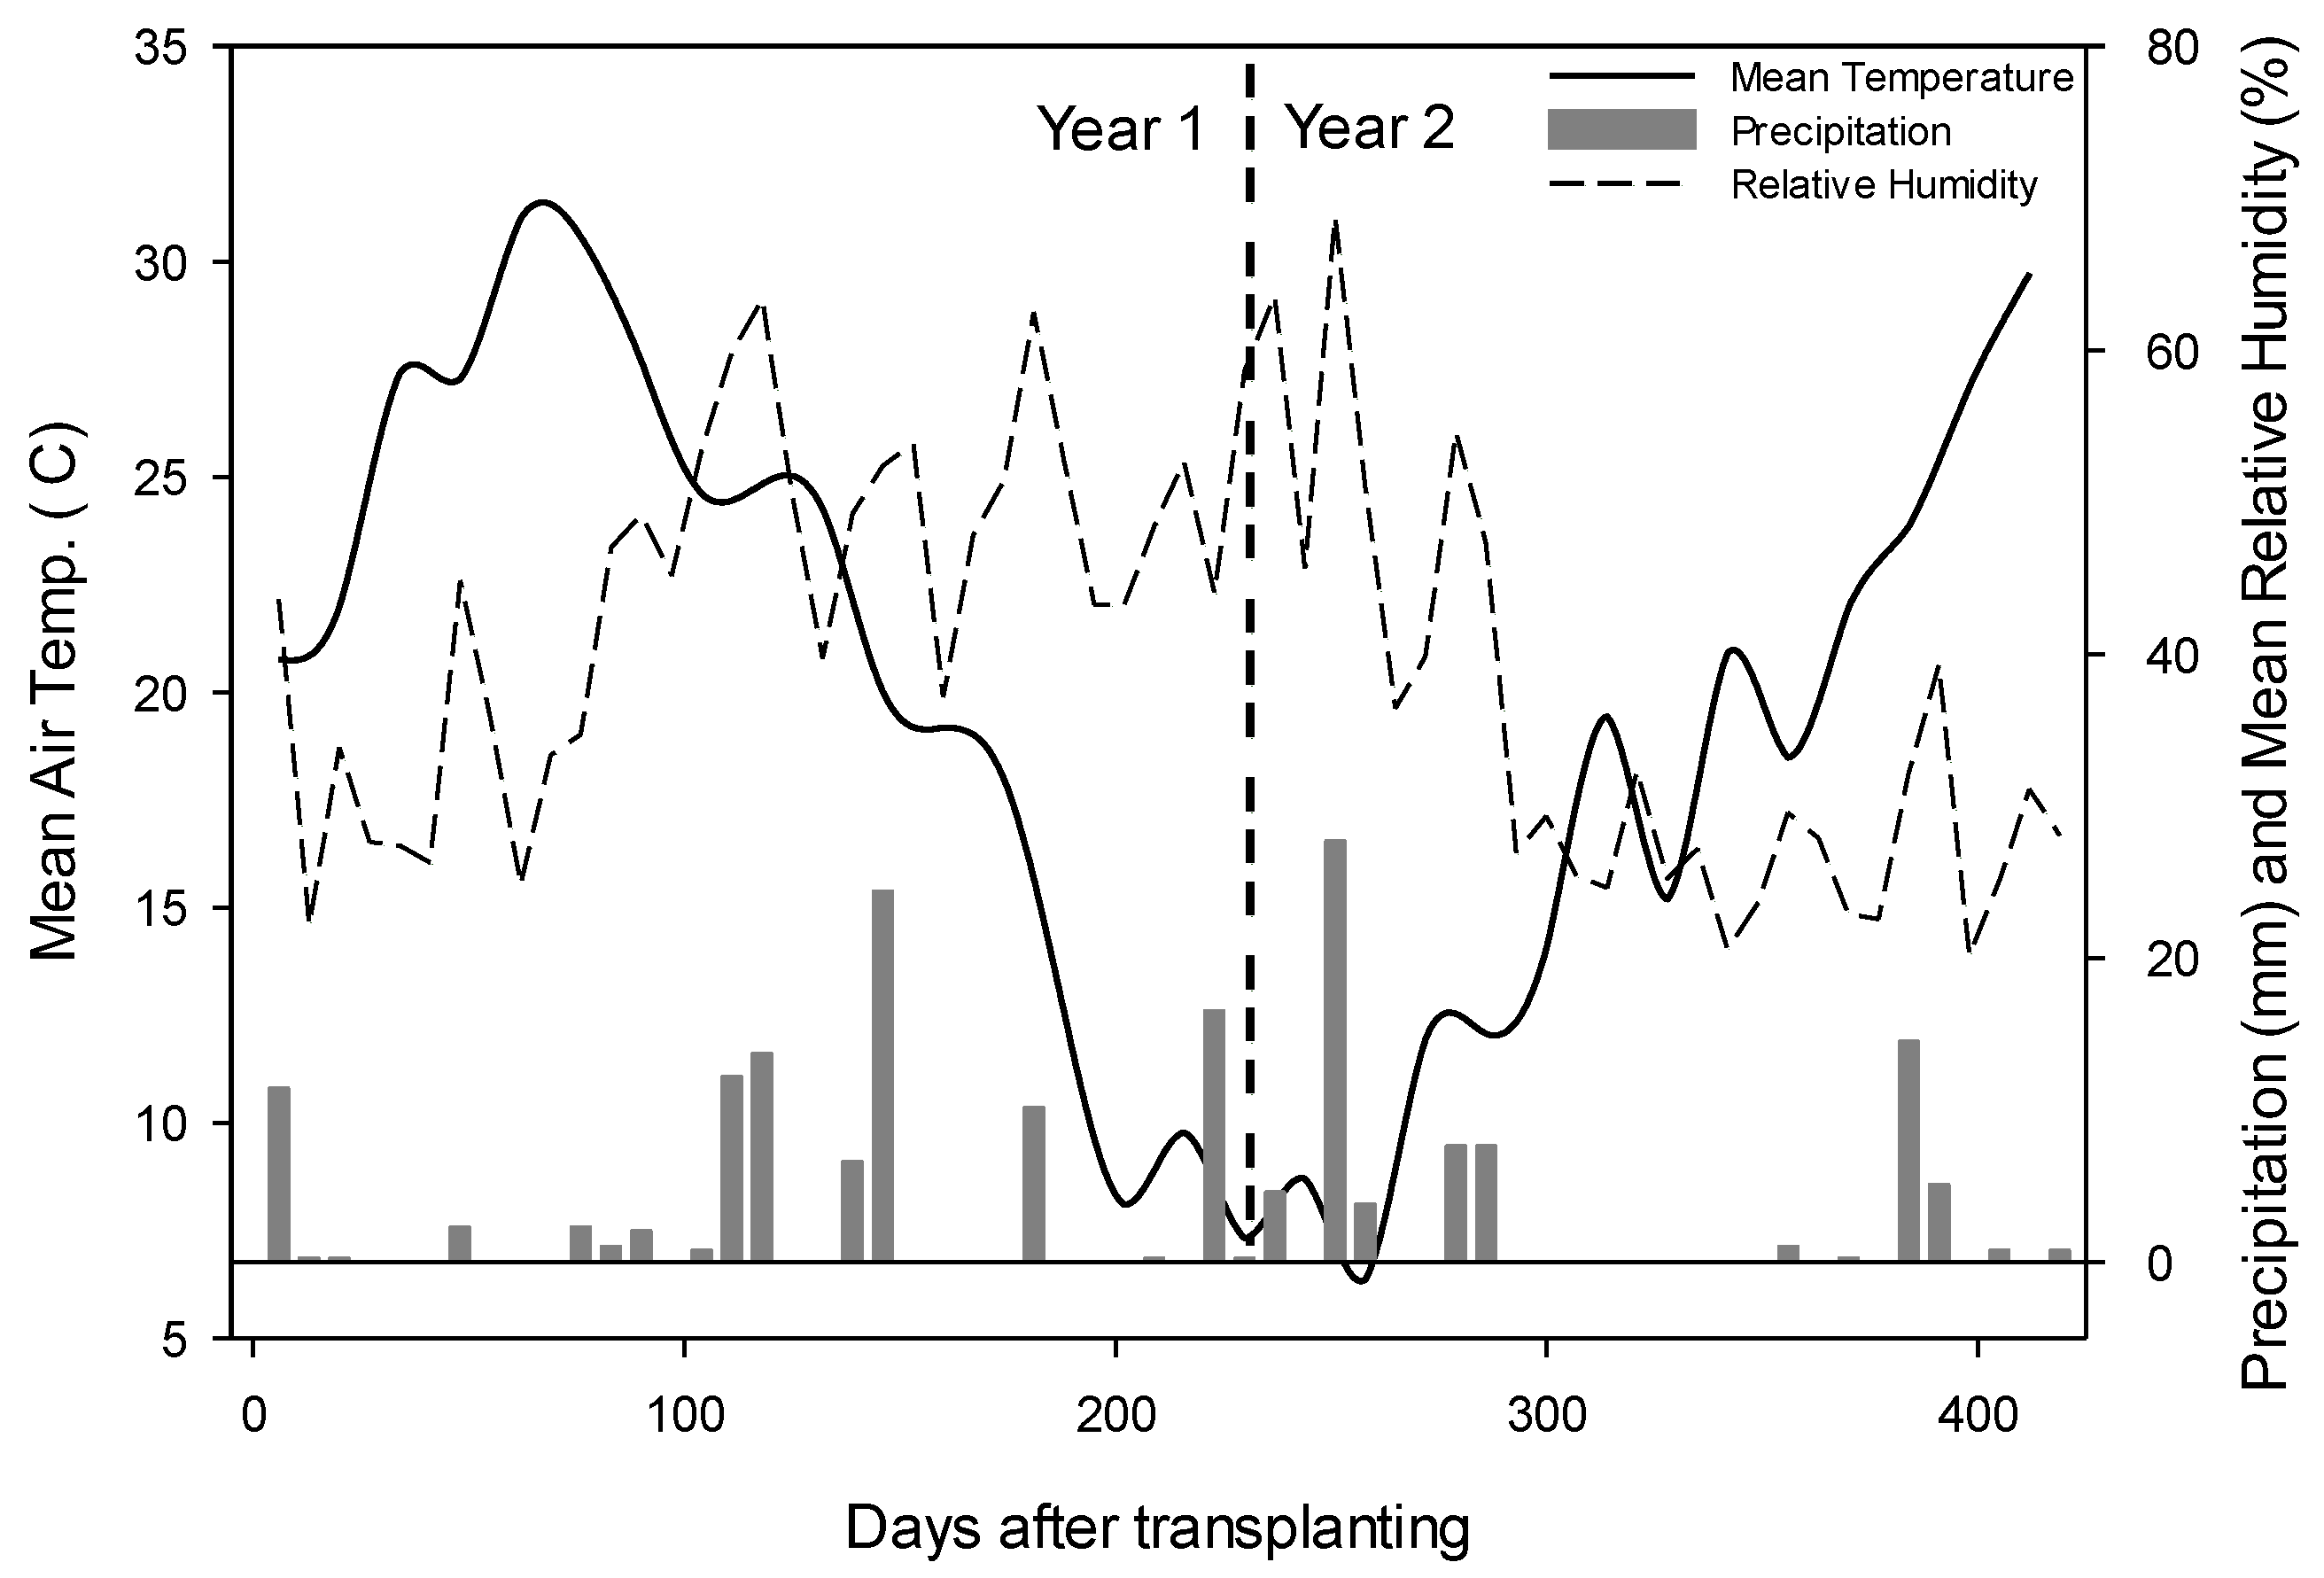
2.1. Site Location and Experiment Setup

This experiment was conducted at New Mexico State University’s Fabian Garcia Science Center (FGRC), Las Cruces, New Mexico (elev. 1191 m; lat. 32°16′45.8″ N and long. 106°46′24.7″ W). Las Cruces is in USDA Plant Hardiness Zone 8a [45]. Average high temperature is above 30 °C from May to September with average lows of −1.6 °C in December and January [46].
Fifty-eight plants each of Melampodium leucanthum, Nassella tenuissima, and Chrysactinia mexicana, all in #1 container pots (15.9 cm high by 16.5 cm diameter), and 20 #3 container (24 cm high by 27 cm diameter) Euphorbia antisyphilitica were received on 28 March 2016 from Mountain States Wholesale Nursery, Glendale, AZ. Upon arrival, the Euphorbias were divided into sixty #1 containers. Sixty Delosperma nubigenum and sixty Festuca glauca “Boulder Blue,” all in 10 cm2 containers were received on 31 March from Little Valley Wholesale Nursery, Brighton, CO. Fifty-eight #1 container Stachys byzantina were purchased on 29 March from Sierra Vista Wholesale Nursery, La Union, NM, and transported to the greenhouse. Despite all being in #1 container pots, plants varied considerably in size, so the larger ones were removed from the pots and divided to create uniformly sized specimens. Fifty-eight Sedum kamtschiaticum were received from Bluestone Perennials, Madison, OH, on 1 April. These arrived in 10 cm2 coir (coconut fiber) pots. The plant’s roots were already firmly attached into the coir pots, so the plants were not removed from the pots. Since the coir dried out faster than the growing substrate in the plastic pots, these plants were placed into large plastic bags with drainage holes to slow evaporation. Morphological characteristics of the chosen taxa are shown in Table 1.
All the plants were acclimatized in the greenhouse for approximately six weeks. During the acclimatization period, mean temperature was 23 °C, mean relative humidity was 37% and the mean minimum and maximum temperature was 19 °C and 30 °C, respectively.
Plants were hand-watered while in the greenhouse on 28 March, 31 March, and 3 April, and then every other day beginning 5 April until they were moved to the field location on 11 May.
Signs of drought stress were not observed during this irrigation regime. Average gravimetric moisture loss from pots between irrigations was 8%. Melampodium, Nassella, and Chrysactinia had hydrophobic growing medium. To allow for better water penetration and retention, the growing medium surface was physically disturbed.
Black aphids (Aphis fabae) and white flies (Trialeurodes vaporarium) were observed on plants on 7 April. Plants were treated on 11 and 20 April using M-Pede Insecticide (Gowan, Yuma, AZ, USA) at a rate of 37 mL/3.79 L.
To simulate an outdoor green roof setting, 24 1 m × 1 m wooden trays [24] were placed on tables topped with a 5 cm layer of poly sheathing foamboard (Johns Manville, Denver, CO, USA) on an open outdoor field site. The tables were equally spaced, with 160 cm between tables and a center aisle 165 cm wide and oriented east to west. The 2.5 cm white pine board trays, modified from the experiment of Hotovec [24], were disassembled, cut down to 18 cm and painted with Kilz Premium sealer (Masterchem Industries, Santa Ana, CA, USA). Boards were then reassembled, and a sheet of heavy duty plastic (Poly-American, Grand Prairie, TX, USA) was placed on the bottom of each tray and stapled to the bottom edges. The next layer was a plastic drainage and water retention material, American Hydrotech GardenDrain GR30™ (American Hydrotech, Chicago, IL, USA), cut to fit the interior dimensions of the trays. A layer of landscape fabric (DeWitt Co., Sikeston, MO, USA), was placed on top of the drainage material and cut to wrap up to the top of each tray to prevent growing substrate from clogging the cells of the GardenDrain™
Trays were then filled to a depth of 15 cm with a proprietary commercial substrate blend from American Hydrotech of five lightweight aggregate:2 sand:3 compost (v:v:v). Previous research demonstrated that an irrigated 15 cm deep substrate could sustain successful plant growth in arid region simulated green roofs [24]. The substrate was composed of 23% very coarse, 44% coarse, 29% medium, 3% fine, and 0.002% very fine particles. Bulk density of the growing substrate was 0.69 g/cm3, air-filled porosity was 66.1%, and water holding capacity was 7.6%. These tests were conducted to evaluate the substrate in relation to FLL guidelines [50].
Drip irrigation line (Netafim Techline CV6-1200, Netafim USA, Fresno, CA, USA) was installed 5 cm below the surface of the growing media. Each tray had a looped system of 0.6 gallon (2.3 L) per hour (GPH) emitters spaced 30.5 cm apart with three rows running north/south, spaced 32 cm apart and 64 cm sides, running east/west. Volumetric moisture content (VMC) was taken of the growing substrate near three random samples of each species on 13 and 14 June 2016 using a model ML2 Theta probe (Delta-T Devices, Cambridge, England) set on the mineral option. Mean post-watering VMC was taken on 13 June, two hours after irrigation application was completed (0900 HR), and was 0.24 ± 0.1 m3·m−3. On 14 June at 0630, HR and mean pre-watering VMC was 0.22 ± 0.1 m3·m−3. This VMC value is higher in those repotted than in previous green roof substrate experiments [28,51,52], thus implying greater water available for plant uptake. Irrigation frequency and duration (Table 2) were then adjusted seasonally, based on the VMC measurements, as well as visual assessment of plants and substrate. Irrigation water had a salinity of 300 ppm, EC of 716 µS/cm, pH of 6.75 and total dissolved solids of 349 mg/L. Climate data was recorded 28 m from the site via a weather station. Weather data collected included air temperature, relative humidity, and precipitation (Figure 1).
The tray layout on the tables and the taxa within the trays were arranged in a completely randomized design, and all trays had non-sampled, mirrored border rows to reduce edge effects. Trays were divided into monoculture (one taxon) and community, which for this experiment is defined simply as a mixture of four taxa in one tray. Monoculture trays had four subsamples each, and there were two replications of each monoculture. Community trays were divided into native and non-native taxa with four replications for each. Native communities had one Chrysactinia, Melampodium, Euphorbia, and Nassella, and non-native communities had one Delosperma, Stachys, Sedum, and Festuca. The experiment had 24 experimental units (trays) and 96 subsamples (plants).
On 10 May 2016, 15 uniform plants of each species were selected. Twelve plants in each species were randomly assigned as subsamples for each tray treatment and planted on 11 and 12 May 2016. All plants were spaced at 20 cm within and between rows within the trays. For plants (except Sedum), loose potting medium was removed before they were transplanted in the substrate filled trays. Sedum plants were retained in the original coir pots. The coir was cut at the corners and pulled back so that the growing substrate of the pot and the tray were level. The remaining three were destructively harvested on 13 and 14 May 2016.
For initial destructive harvest, plant shoots were cut level to the growing substrate. Leaves, inclusive of petioles, were separated from stems and scanned for total area using a Li-Cor leaf area meter (Model L1-3100, Li-Cor, Lincoln, NE, USA). Festuca and Nassella leaves and leaf sheaths were scanned together as were Euphorbia stems, as this species is generally leafless except on new growth [38]. The stems and leaves were then oven-dried at 60 °C for 5 days and then weighed to determine the shoot dry weight (SDW). Roots were washed clean of any media, oven-dried at 60 °C for 5 days and weighed to obtain root dry weight (RDW).
On 18 May 2016, a severe storm dropped 2 cm of rain and 0.6–2.3 cm sized hail in approximately half an hour on FGRC. Stachys, Delosperma, Sedum, Chrysactinia, and Melampodium sustained severe damage. Euphorbia had moderate external surface damage while the grasses (Nassella and Festuca) had little to no visible damage. On 23 May, two dead subsamples, one Melampodium in tray 13 and one Chrysactinia in tray 18, were replaced with extra samples from the greenhouse from the original plant shipments. Two more Chrysactinia and one Euphorbia were replaced on 30 June because they also had died. Initial data collection, originally planned for 7 June (day 25), was postponed, allowing the plants most severely impacted by the hail time to recover. On 30 June, a visual assessment and clean-up of hail damage was done, and based on observations at that time, the first data collection was scheduled for 5 July. Subsamples that died after the first collection were considered dead and not replaced.
Year 1 (2016) plant coverage and quality index assessed visually (QI) data were collected monthly on 53 days after transplanting (DAT) (5 July), 82 DAT (2 Aug), 116 DAT (6 September), 144 DAT (4 October) and 172 DAT (1 November). Year 2 (2017) coverage and QI data were collected on days 326 DAT (4 April), 354 DAT (2 May), 389 DAT (6 June) and 417 DAT (4 July). Plant coverage was determined by multiplying the east/west by north/south above ground vegetative spread.
For QI, a Likert scale was established where a 1 = excellent quality, with vigorous, healthy growth and new leaves produced and a uniform consistent color that was correct for each species; 2 = very good quality with some new growth and little leaf senescence; 3 = good quality, with some signs of senescence, variations in color and little if any new growth; 4 = substandard quality with evidence of drooping and/or wilting and more than 50% senescence; 5 = dead plant
Leaf relative water content (RWC) was measured in year 1 on 5 July and 1 November and in year 2 on 4 April and 4 July using leaves obtained between 0700 HR and 1000 HR. To obtain RWC, a third fully expanded leaf of each plant was removed and immediately put in a plastic bag and placed on ice. For Euphorbia, the tip of the stalk was cut off directly below the lower leaf of the third pair of leaves. All samples were then transported to the lab (~1.2 km) and immediately weighed to obtain fresh weight (FW). Samples were then placed in deionized water overnight. The next day, samples were blotted dry with clean, lintless paper and re-weighed to obtain turgid weights (TW). Samples were placed in paper envelopes and oven-dried at 80 °C for 24 h and weighed again to obtain the dry weight (DW). Relative water content was calculated using the formula [(FW − DW)/(TW − DW)] × 100, where FW = fresh weight, DW = dry weight, and TW = turgid weight.
On 12 September 2016, wilting and rust-colored leaves observed on the Stachys were confirmed to be symptoms of rhizoctonia. Daconil concentrated liquid fungicide (GardenTech, Palatine, IL, USA) was applied at a rate of 30 mL/3.79 L on all Stachys on 5 July and again on 19 July. Rhizoctonia also affected 25% of the Sedums and 33% of the Delosperma, and they, along with the Stachys, were again treated with Daconil on 24 August, 28 September, and 26 October 2016.
Chrysactinia were observed to be infested with black ants (Monomorium minimum) and woolly aphids (Eriosomatinae) on 2 August 2016. Insecticidal soap (MiracleGrow Nature’s Care Insecticidal Soap; Lawn Products, Marysville, OH, USA) was applied to all plants and both pests initially diminished. Ants reappeared, especially in the Chrysactinia, but also in neighboring trays shortly after the application of insecticidal soap. Sevin dust (GardenTech, Palatine, IL, USA) was applied on 19 August, 7 September, and 14 November 2016. Sevin dust showed more success in controlling in the infestation but needed to be reapplied after rains and high winds.
Despite intervention for pests and fungus, the mortality rate of Chrysactinia was 58% (Table 3). Dead plants of Chrysactinia and Melampodium, both subsamples and from the mirrored border rows, were removed on 17 August, and tap roots were discovered to be growing at 90°, 180°, and in two cases, 360° to normal downward growth. This problem was not discovered at the beginning of the experiment because roots were not washed before plant installation. This could be considered a confounding factor, and dead subsamples were accounted for in the statistical analysis.
The plants overwintered in the field. Final data for the first year was taken on 2 November 2016, and plants were considered to be going dormant as mean temperatures dipped below 15 °C (Figure 1). Irrigation duration and frequency were reduced at this time (Table 2). Routine annual maintenance was done on all taxa on 17–22 February 2017, which included removing dead biomass from Delosperma, Euphorbia, Festuca, and Stachys, shearing Chrysactinia and Melampodium to 15 cm and Nassella to 12.7 cm, and thinning excess growth from Sedum. Daconil was sprayed on all the plants at the rate of 44 mL/3.79 L on 29 February 2017, and irrigation was increased when the mean temperatures exceeded 10 °C (Figure 1). Year 2 data collection started 4 April 2017.
Signs of rhizoctonia reappeared in year 2, so a more aggressive approach was taken to control the fungus. All trays were treated with Heritage WDG and Medallion WDG (Syngenta AG, Basel, Switzerland) at a rate of 15 mL/379 L water. Heritage was applied on 22 March and 19 April 2017, and Medallion was applied on 5 April and 3 May 2017. Before fungicidal treatments, the trays were hand watered to aid in saturation of the fungicide into the substrate. All plants were sprayed with the fungicide and Stachys plants were drenched because this species had shown particular susceptibility to rhizoctonia.
On 4 July 2017, it was discovered that the irrigation line to three trays on the sixth table had been cut off due to a kink in the irrigation line. The experiment had been inspected previously on 6 June, and no problems were seen at that time. All subsamples in Tray 16, a Festuca monoculture, died between 6 June and 4 July. In Tray 17, a non-native community, the Sedum survived, though the other taxa died. Two subsamples in Tray 18, a Chrysactinia monoculture, had died earlier in the study, and a third in that tray died between 6 June and 4 July, leaving one live subsample in Tray 18. Of 12 subsamples in the three trays, eight died, apparently from the lack of irrigation.
Destructive harvest of the experiment took place 8 to 16 July 2017. Growing substrate core samples were taken from approximately 2.5 cm from the main stem of each subsample to use in determining root length density (RLD). Samples were taken using a 2.5 cm wide × 53 cm deep probe (AMS 401.04 Soil Probe, American Falls, ID, USA). Each sample was measured while in the probe tube and divided in half length-wise to separate deep and shallow roots, then placed in sealed plastic bags and stored in a cooler at 4 °C. Next, the south face of each tray was removed, and the surface of the substrate was scored evenly between the plants at 30 cm, 50 cm and 70 cm east/west and north/south, then the substrate was cut down to the landscape fabric. The south border row plants were cut out first and discarded. A 2400 g aluminum scoop (Win-Co, Boise, ID, USA) was used to lift the entire plant from the substrate and transfer it into ziplock plastic bags, which were stored in a walk-in cooler, set at 4 °C until destructive harvest could be completed. The plants were cut at the substrate surface, with the shoots cleaned and placed in brown paper bags and oven-dried at 80 °C for 5 days, then weighed to obtain SDW. Roots were washed clean of any media, then scanned using WinRHIZO root-scanning software (Regent Instruments, Ottawa, ON, Canada). Cleaned roots were placed in a 20 cm × 25 cm × 3 cm plexi-glass tray on a scanner bed then the tray was filled with water and scanned. After the roots were scanned, they were placed in brown paper bags, oven-dried at 80 °C for 3 d, and then weighed to obtain RDW.
Relative growth rate (RGR) was calculated using the equation RGR = (ln W2 − ln W1)/(T2 − T1), where W2 = final total dry weight, W1 = mean initial DW of three samples of each species, T2 = day of destructive harvest and T1 = first day of the experiment (day 0) [53,54].
To determine RLD, roots were removed with tweezers from the dry samples, placed in ionized water, and then analyzed using WinRHIZO to measure total root length of each sample. Root length density was calculated by dividing the total root length by the soil sample volume.

2.2. Statistical Analysis

Separate statistical analyses by type were obtained using SAS® software, version 9.4 (SAS Institute Software Co., Cary, NC, USA, 2012). A mixed model (Proc Mixed) was used that accounted for fixed effects of setting (monoculture vs. community) and origin (native vs. non-native) and recognized subsampling by including a random effect for tray within treatment combination. Three versions of the model were considered and compared using corrected Akaike’s information criterion (AIC), and the reported analysis was based on the model with lowest AICC. The first model simply accounted for subsampling as noted above, the second fit separate residual variances to native and non-native taxa, and the third fit both separate tray and residual variance components to the native and non-native plants. For coverage data, dead subjects were included as zeros, as they were not providing any coverage. However, dead subjects were not included for RWC, root-to-shoot dry weight ratio, or other comparisons. Values of ±3 in the studentized residuals were considered to be outliers and removed from a secondary analysis if they were seen to be impacting the fixed effects. Analyses using all data were reported; results from outliers removed were discussed only when findings were impacted [55]. Least square means for significant effects were compared using model-based estimates and standard errors. Significance was defined for p < 0.05. Letters assigned to non-significantly different treatments were generated using %PDMIX800 [56,57].

3. Results

3.1. Plant Coverage

Non-native groundcover Delosperma had a consistently greater coverage than native Chrysactinia for all sampling dates except for the last two dates of year 2 (Table 4).
In the first year, coverage of native forb, Melampodium, in community was greater than for all other treatments in four of five measurements (Table 5). For all but the last sample date of year 2, Melampodium had greater coverage than non-native Stachys (Table 5), regardless of setting.
Native succulent Euphorbia had greater coverage than non-native Sedum except for the final sampling date (Table 6) regardless of setting. Native grass Nassella in either setting had greater coverage than non-native Festuca for the entire experiment (Table 7).

3.2. Quality Index

Native Chrysactinia had a lower quality index (QI) in the first two sample dates of the year 1, regardless of setting (1.2 and 1.5). than non-native Delosperma (2.3 and 2.7) (a lower score (1) being more visually appealing than a higher (5) score). Native forb, Melampodium, in community had the lowest QI (1.0) at the second sample date of the first year over other treatments. Regardless of origin, succulents in community had lower QI in the third and fourth measurements of the first year (1.8 and 1.7) than succulents in monoculture (2.7 and 2.5). Non-native Sedum QI was lower (1.5) than native Euphorbia QI (2.7) in the fourth measurement of the first year. In three of the five first year measurements, non-native Festuca had a lower QI (1.8 in first, 2.1 in second, and 2.4 in fourth) than native Nassella (3.1 in first, 3.1 in second, and 3.2 in fourth), regardless of setting. At the third measurement of year 1, non-native Festuca in community (2.3) and monoculture (2.6) and native Nassella in monoculture (2.6) had statistically the same measurements, with native Nassella having the highest (3.3). Native Nassella had a lower QI (2.1) than non-native Festuca (2.9) at the first measurement of the second year.

3.3. Relative Water Content
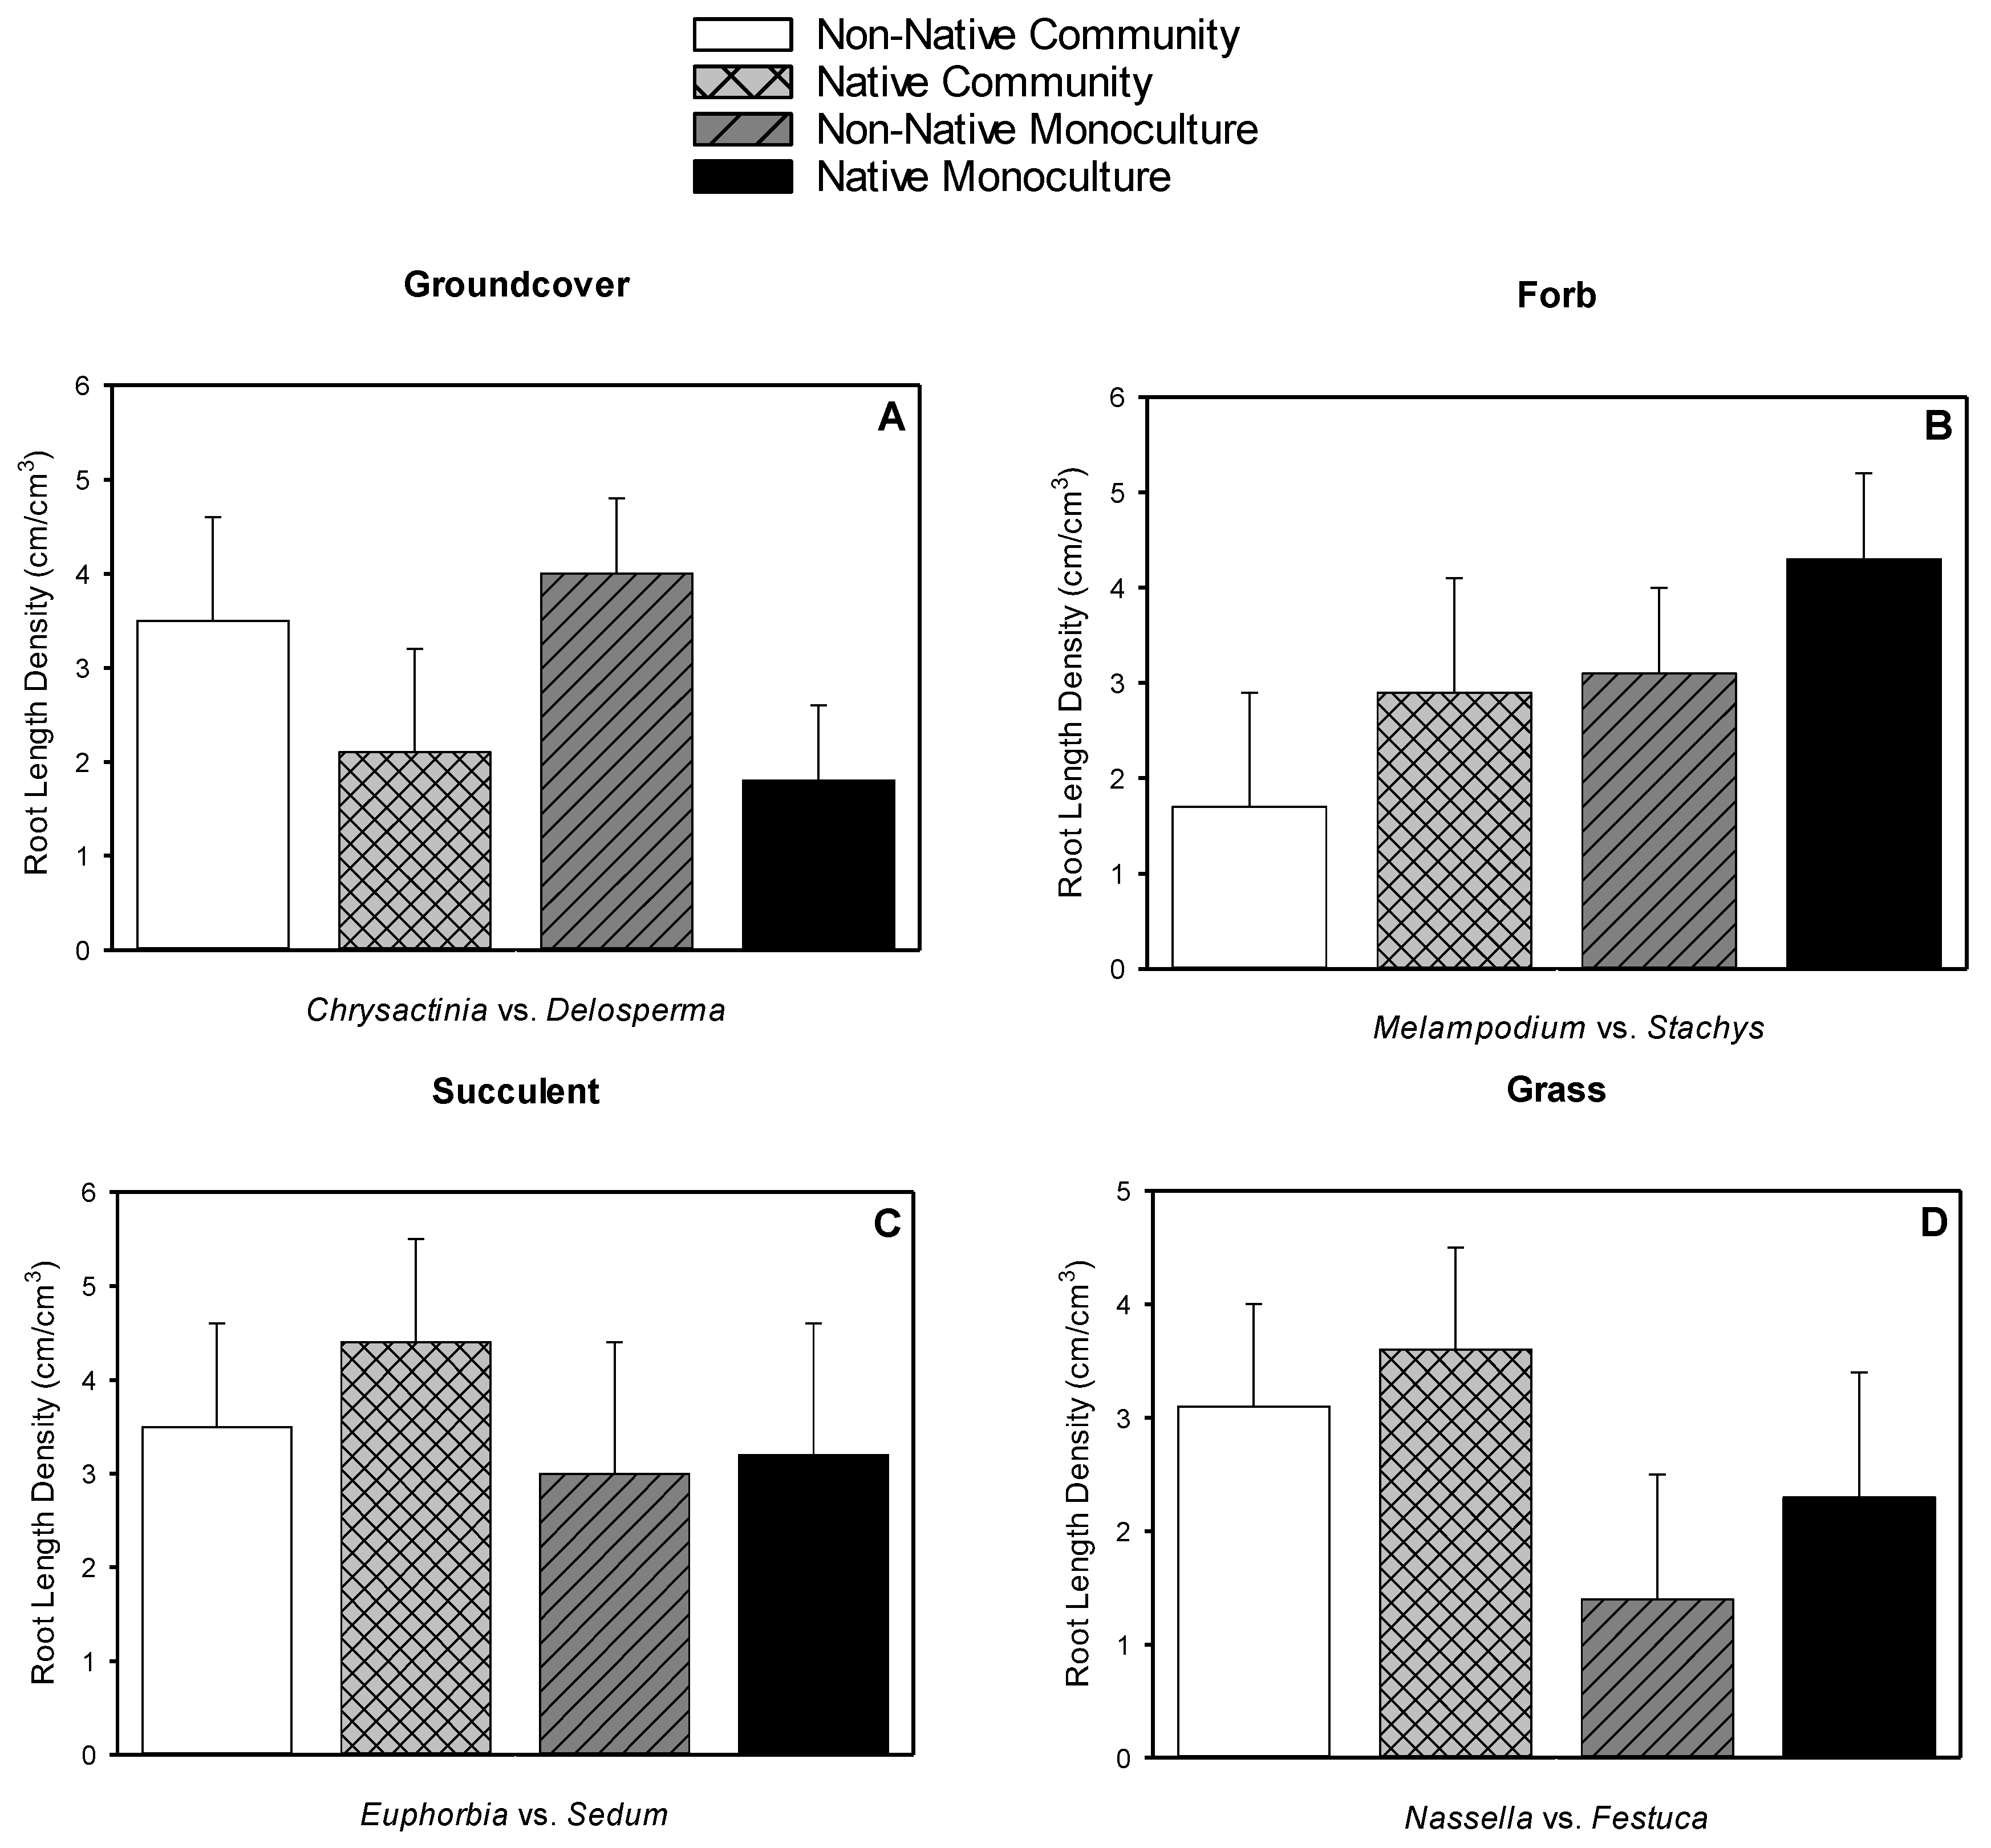
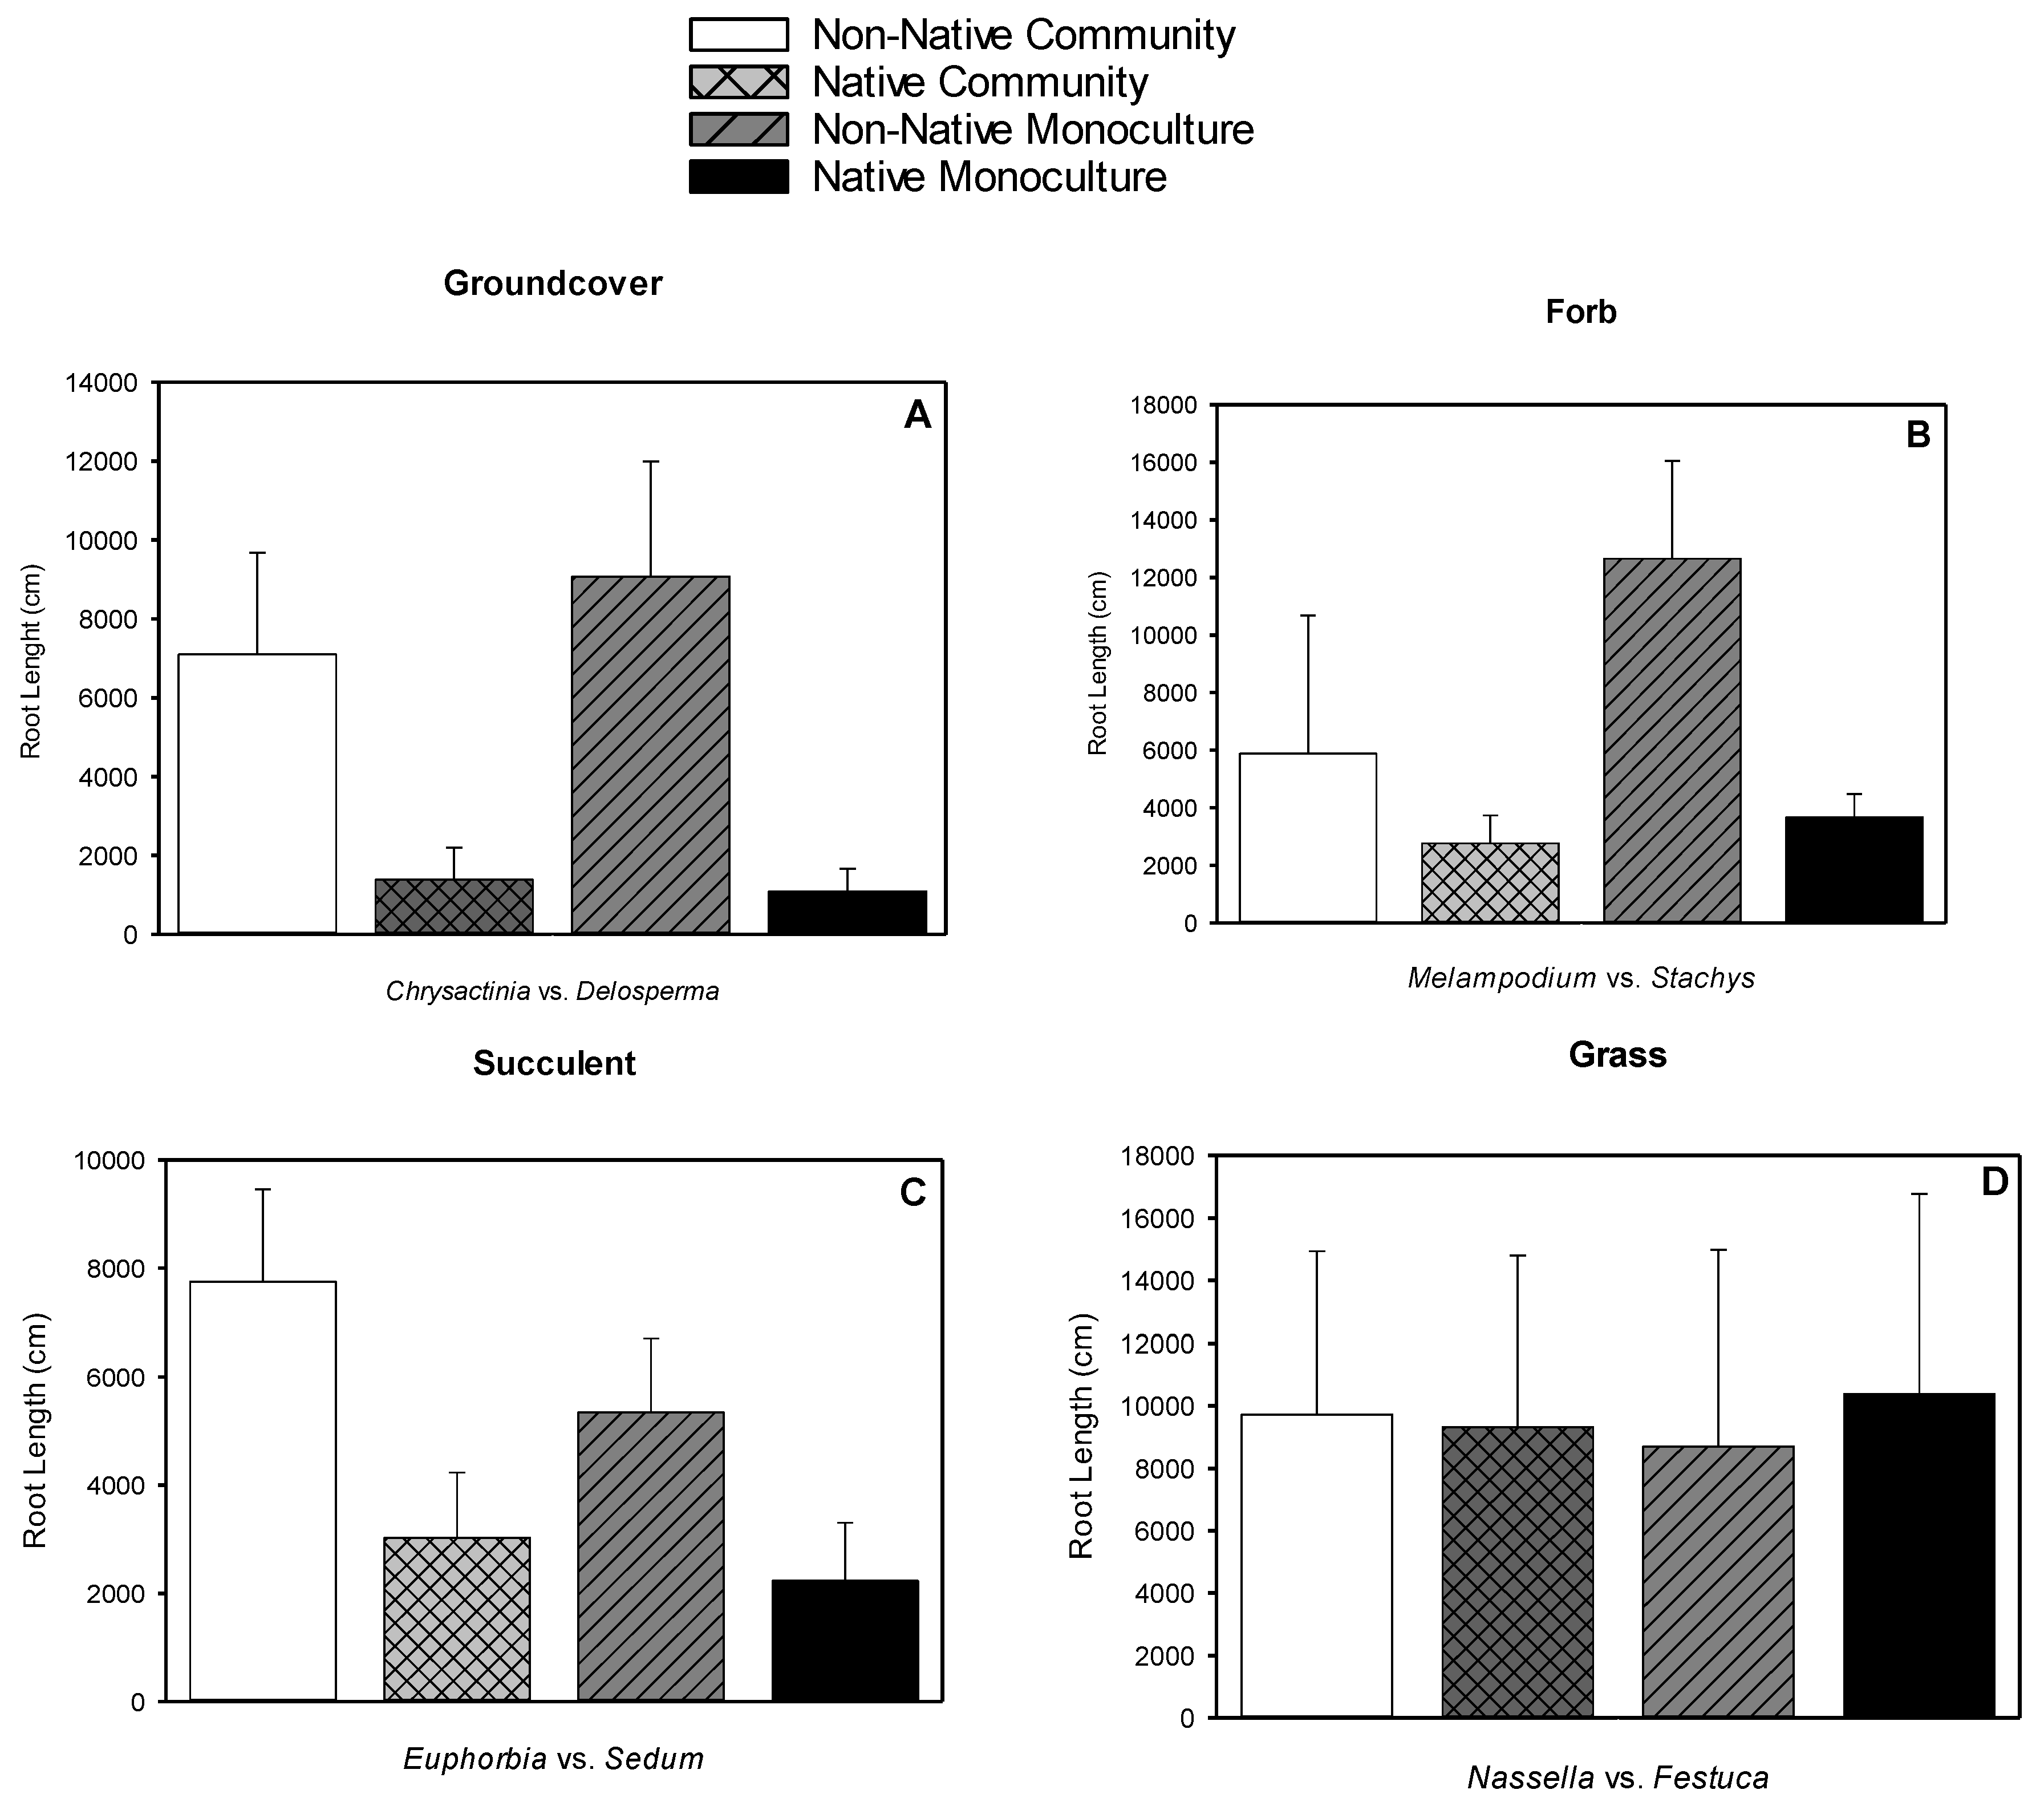
Relative water content was greater for native groundcover (76%) than non-native groundcover (57%) at the first measurement in the first year. Non-native forbs had greater RWC (72%) than native forbs (59%) at the last measurement of the second year. In the second measurement of year 1, native Euphorbia in monoculture had the highest RWC (88%) than other treatments. Native succulent RWCs were also greater in both measurements in year 2 (78% and 80%) than non-native succulents (62% and 69%). The RWC of grasses at the first measurement differed by both setting, with monocultures being greater (80%) than community (70%) and by origin, with non-native Festuca being greater (80%) than native Nassella (68%). Non-native Festuca had a greater RWC (86%) than native Nassella (75%) in the second sample of the first year.

3.4. Root Length

Root length was greater for non-native groundcover Delosperma (8085 cm) than native Chrysactinia (1232 cm) (Figure 2A) and for non-native succulent Sedum (6548 cm) than native Euphorbia (2627 cm) (Figure 2C). Root length did not differ for forbs nor grasses (Figure 2B,D).

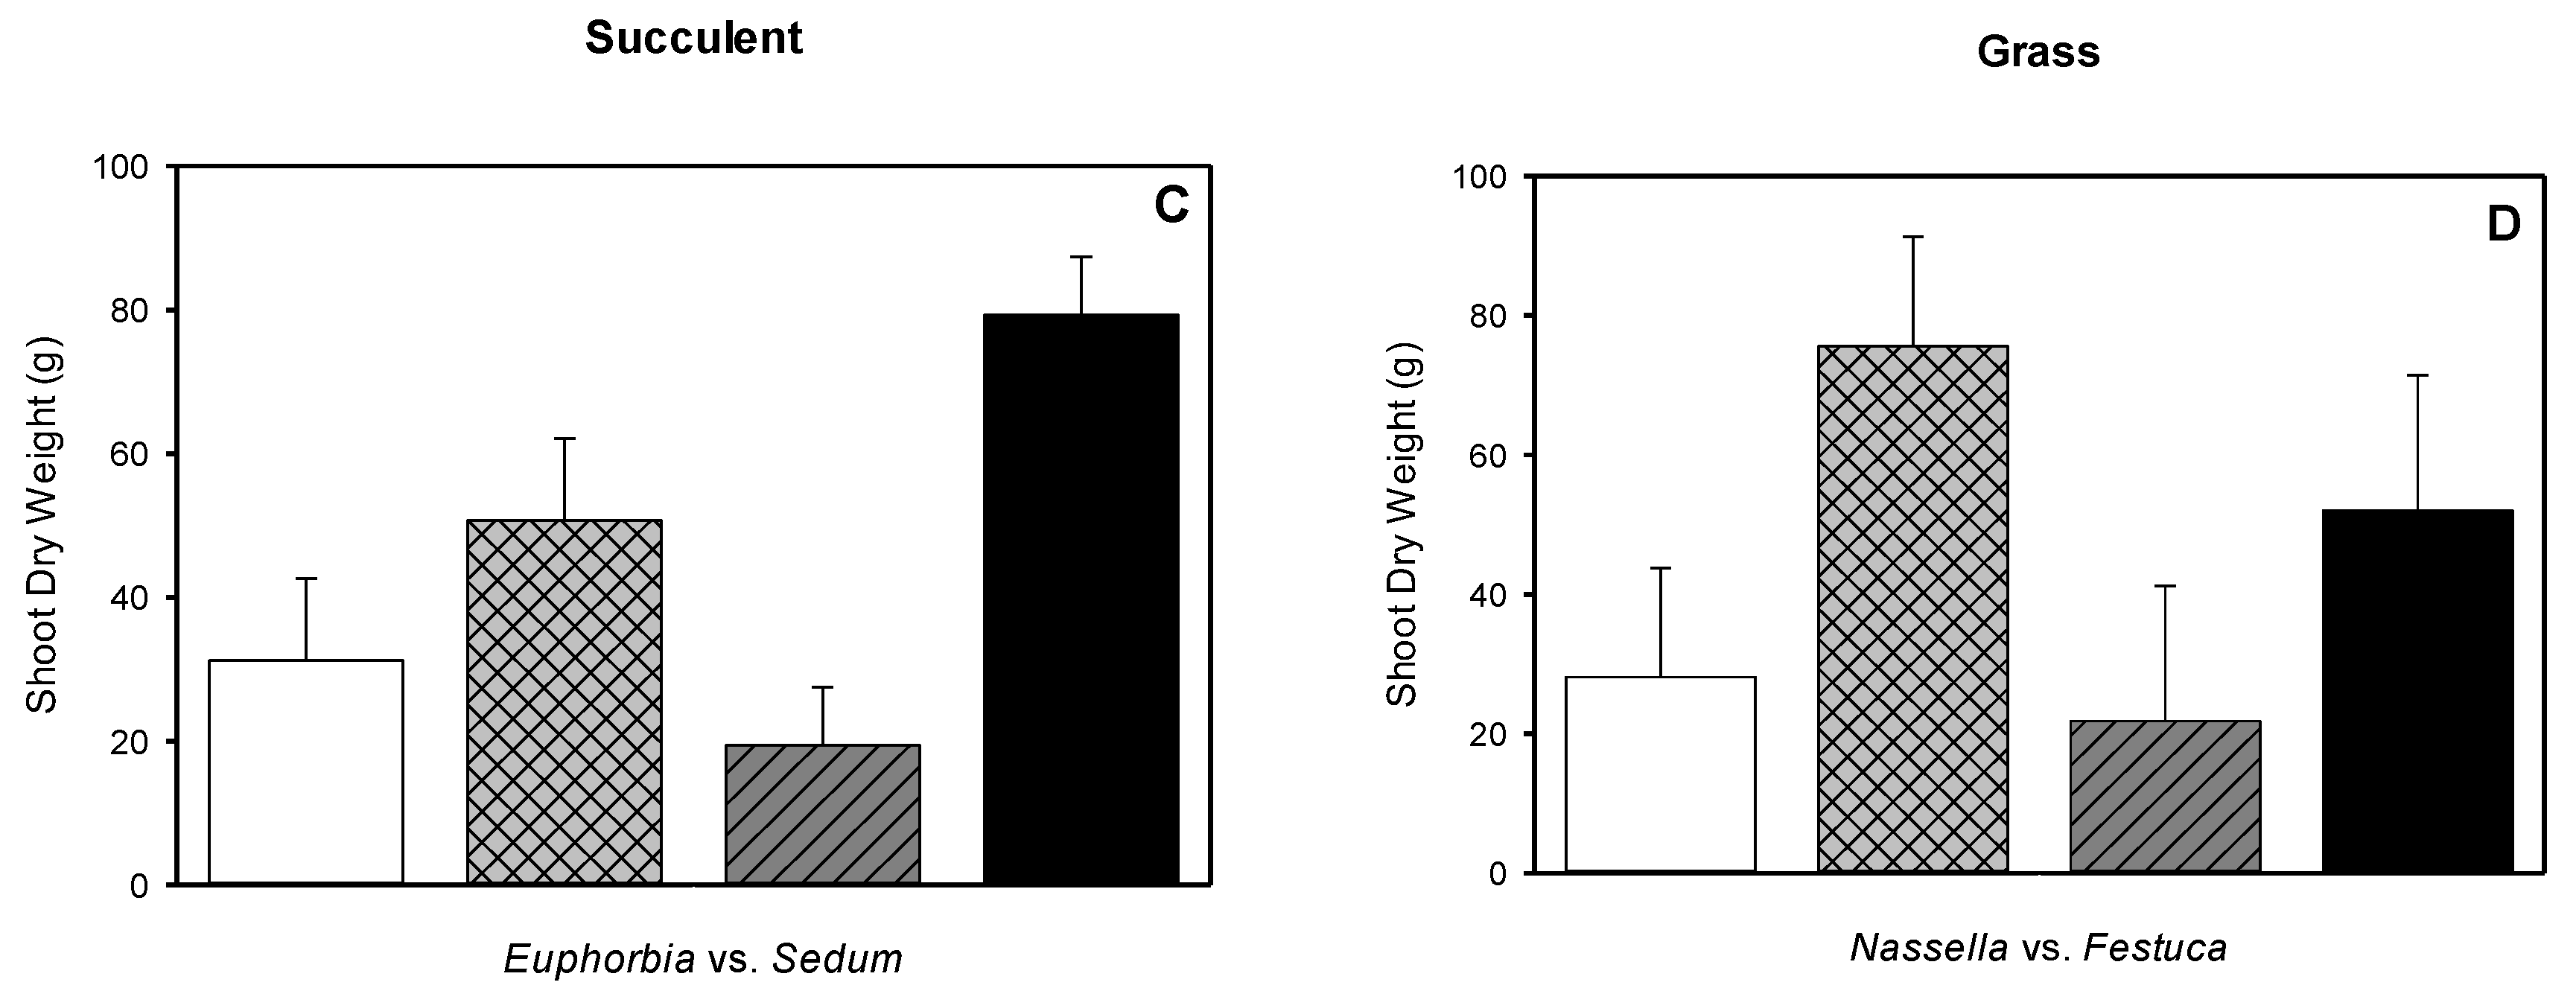
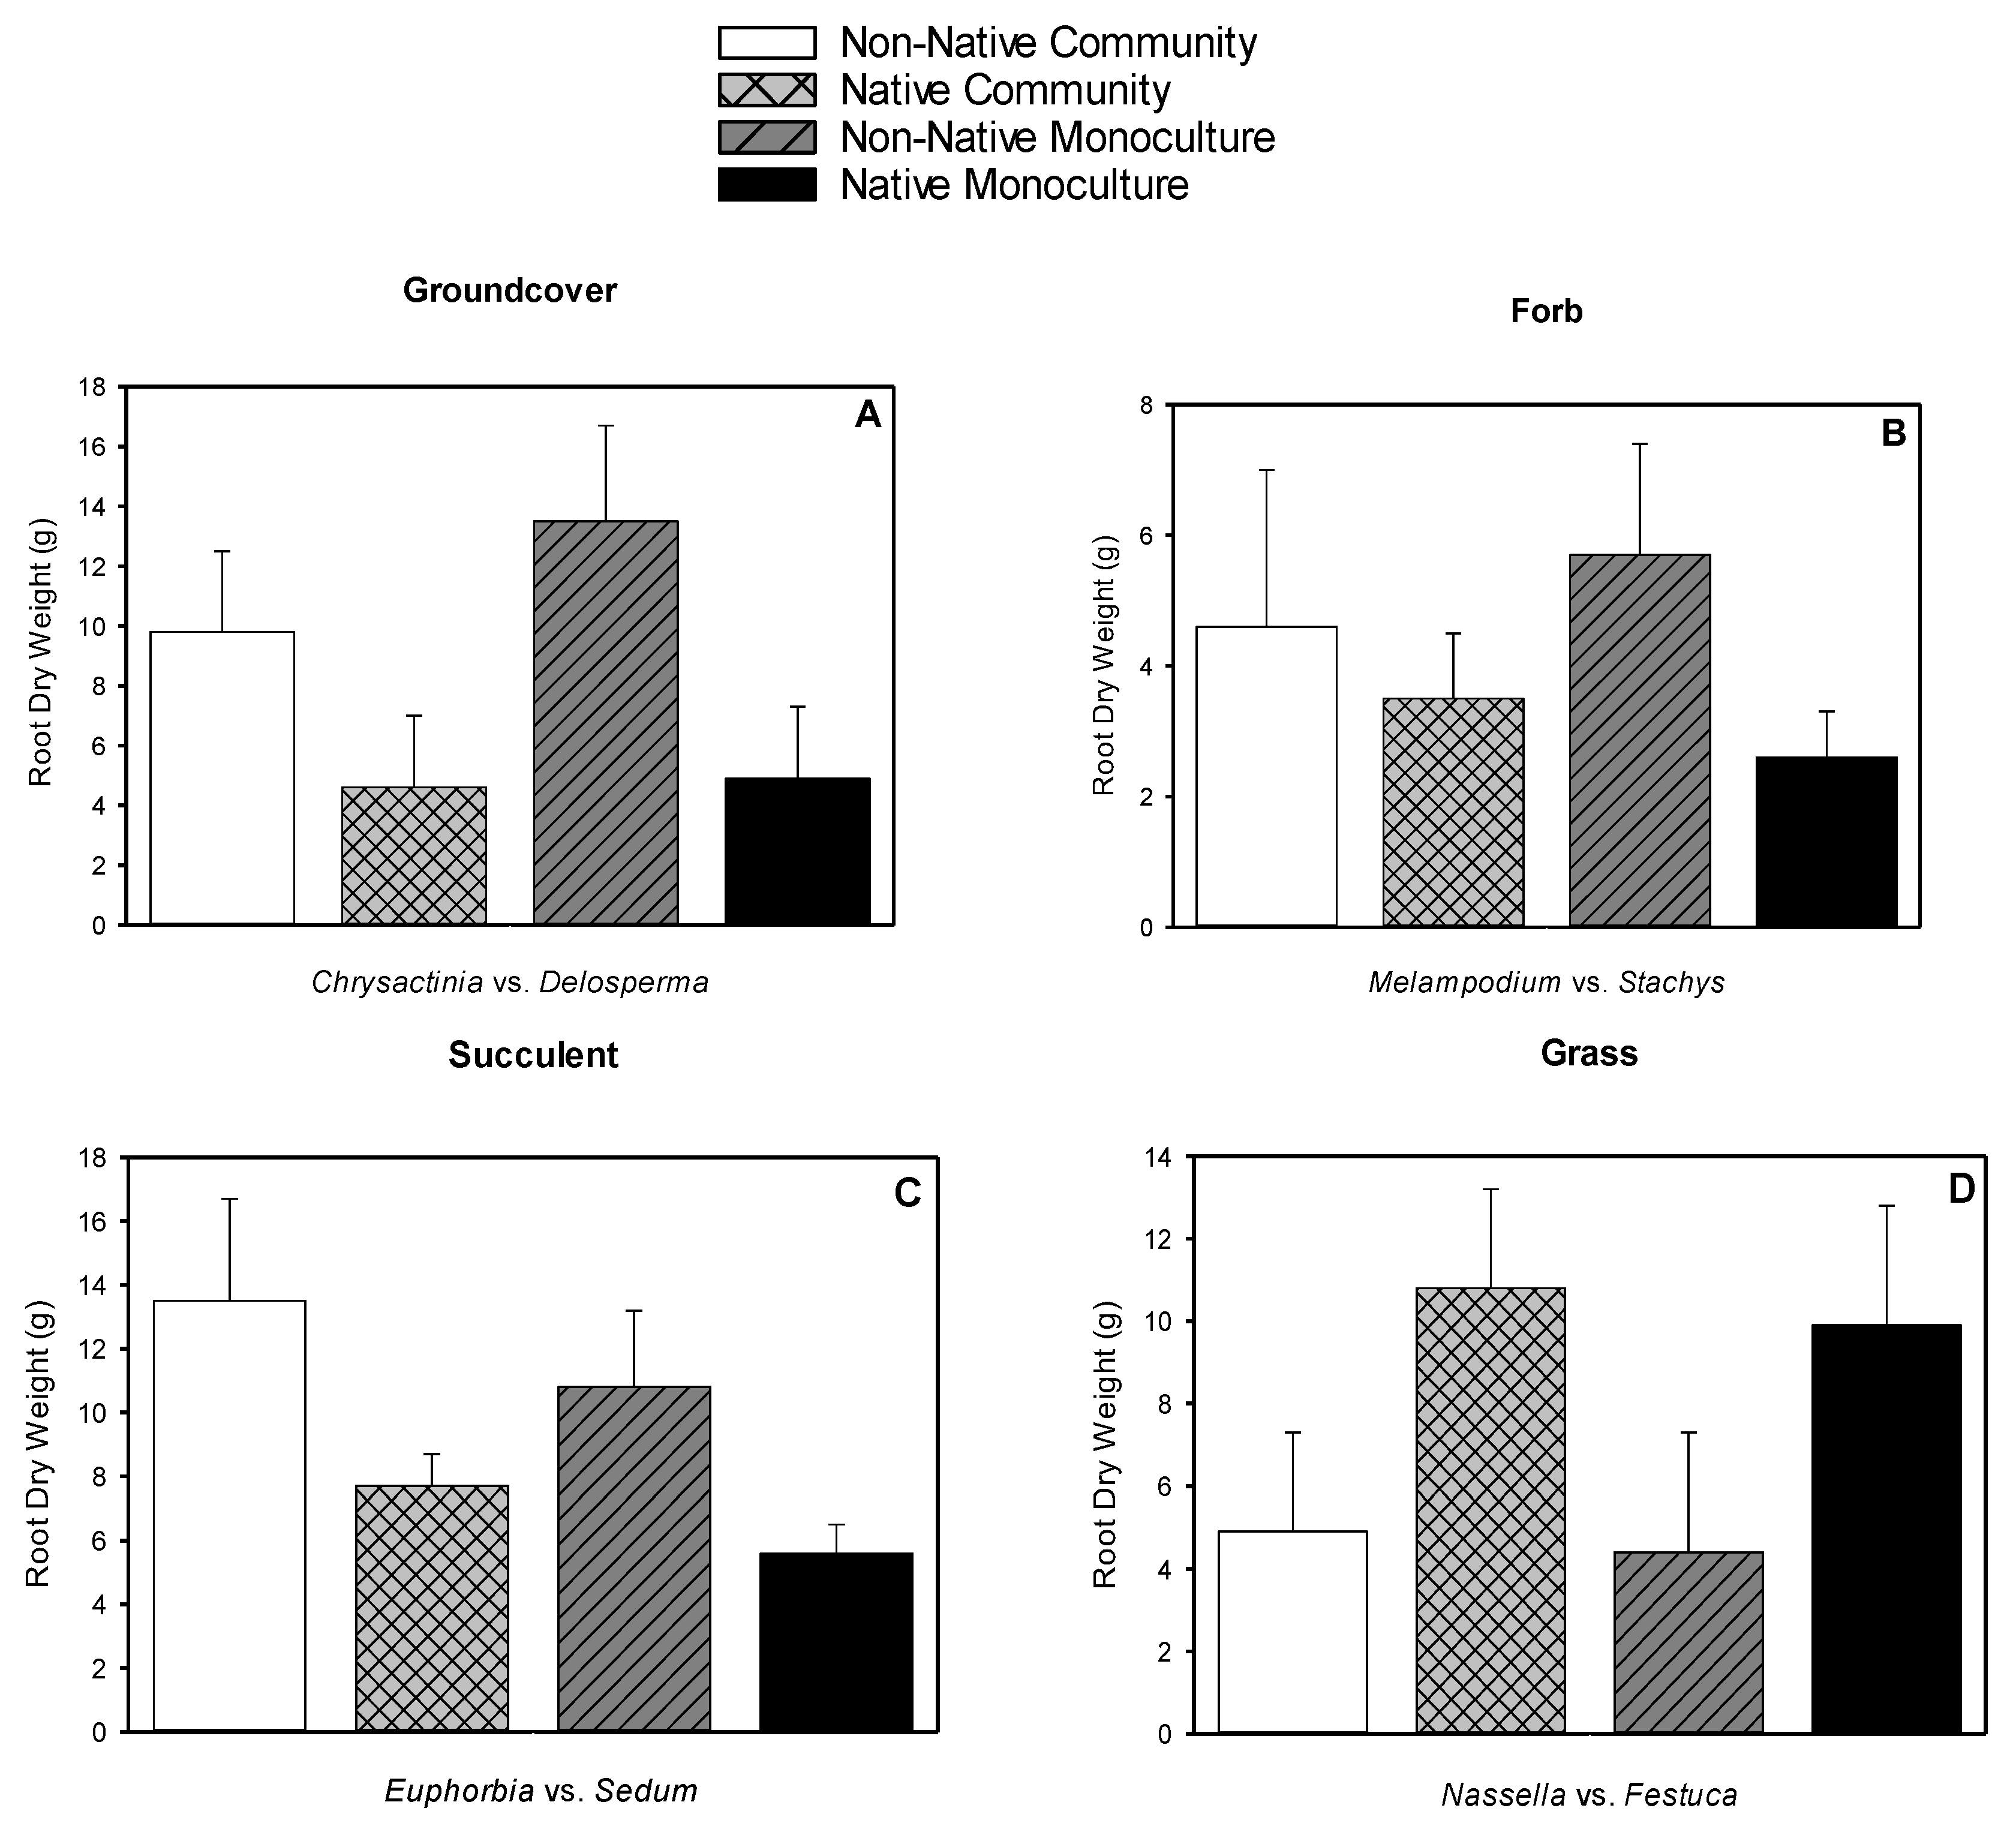
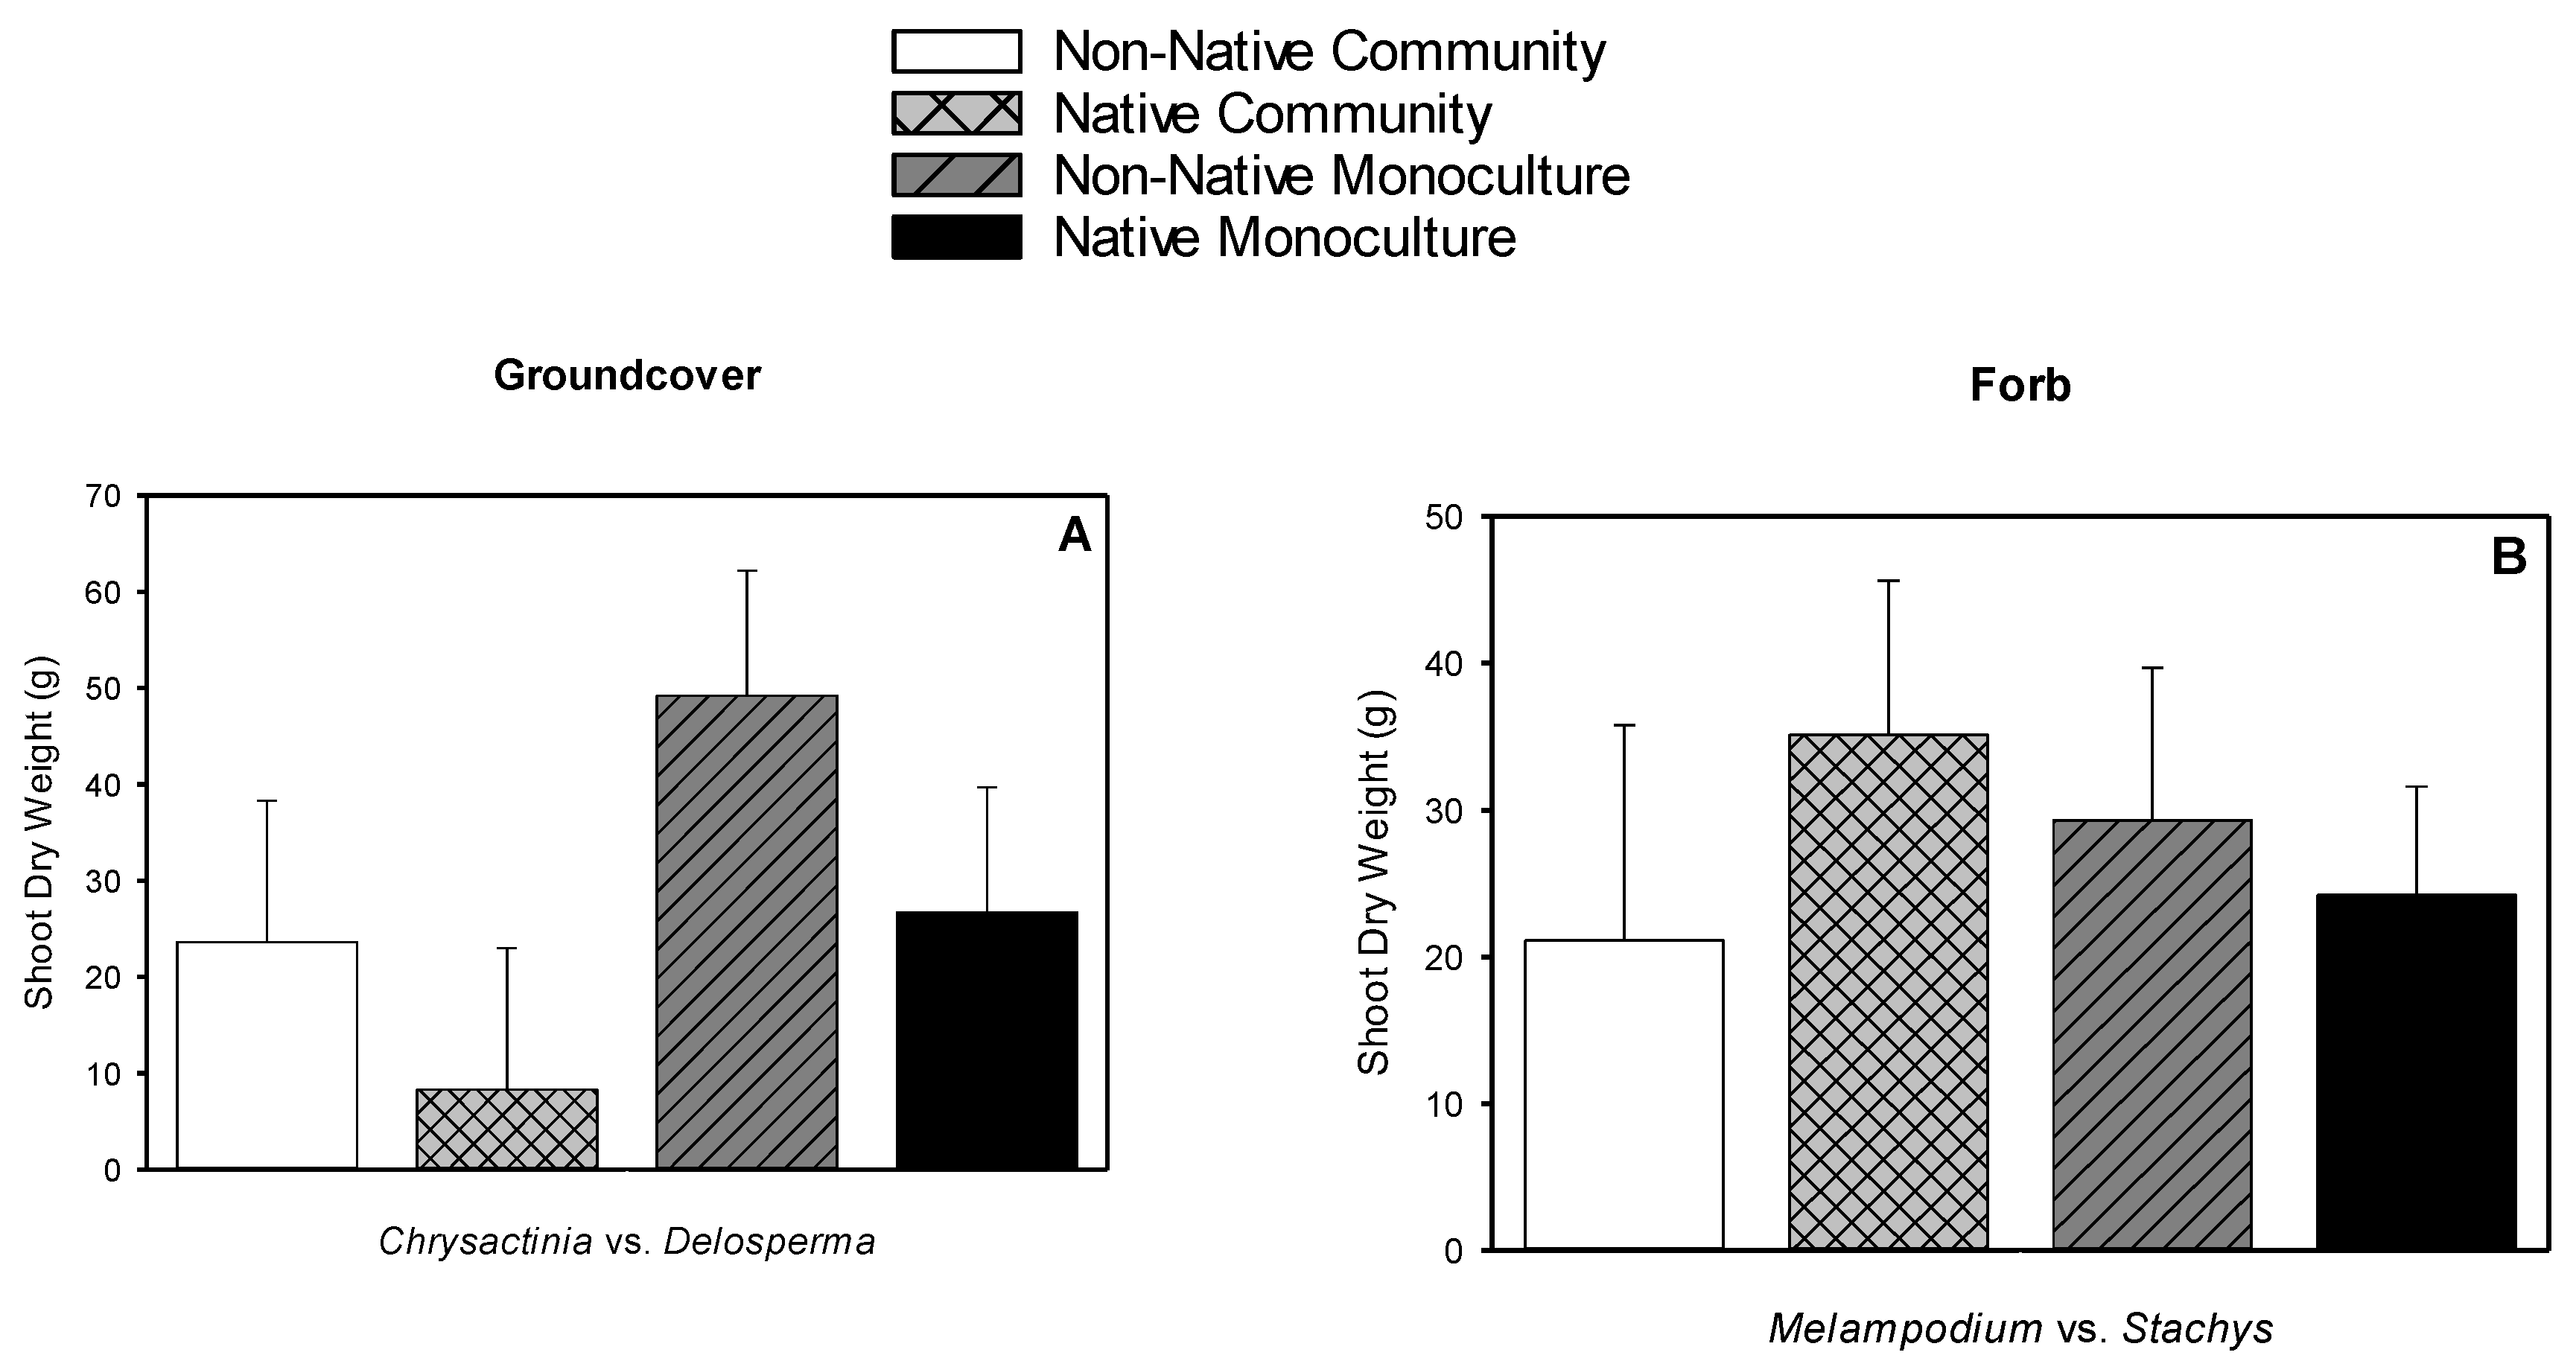
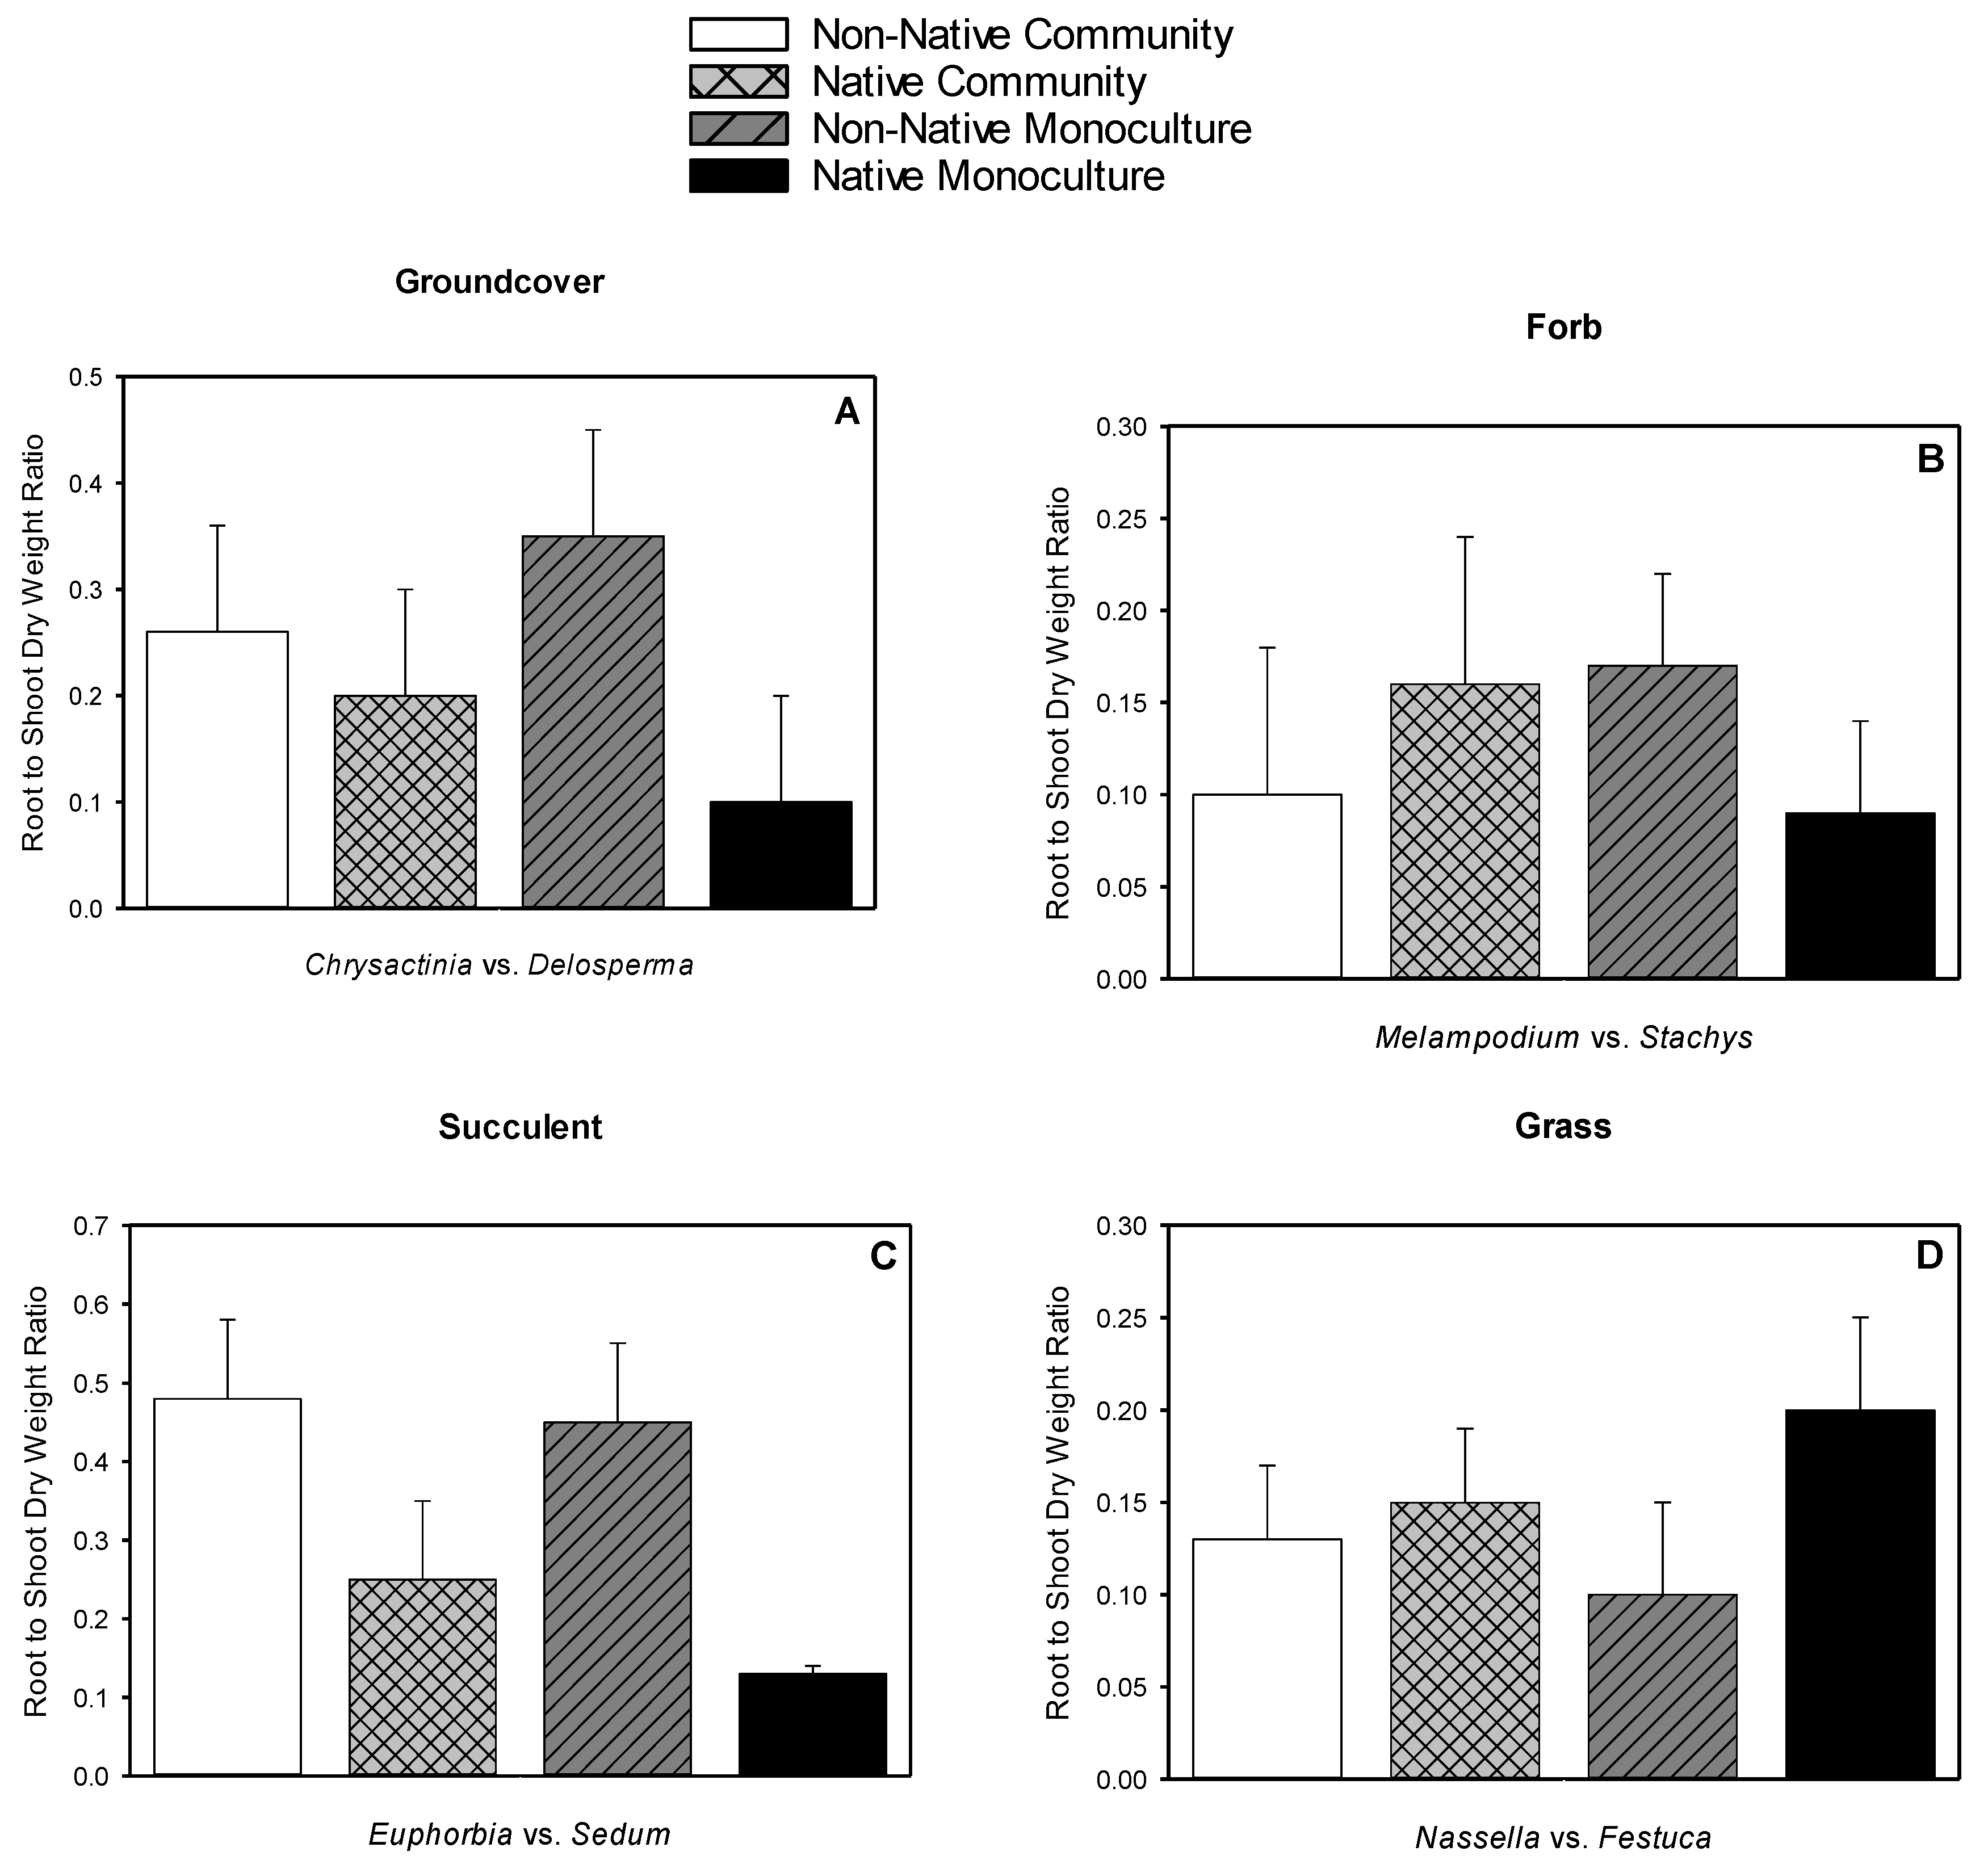
3.5. Root Dry Weight, Shoot Dry Weight, Root-to-shoot Dry Weight Ratio, Root Length Density

Non-native groundcover Delosperma had greater RDW (13 g) than the native groundcover Chrysactinia (2.6 g), as did non-native succulent Sedum (12.1 g) over native Euphorbia (6.7 g) (Figure 3A,C). No differences were seen in RDW of forb and grass (Figure 3B,D). Native Euphorbia had a greater SDW (65 g) than non-native Sedum (25.3 g) (Figure 4C), and native Nassella had a greater SDW (65 g) than non-native Festuca (25.3 g) (Figure 4D). No differences were seen in SDW of groundcover and forb (Figure 4A,B). Non-native Sedum had a greater root-to-shoot dry weight ratio (0.45) than native Euphorbia (0.13) (Figure 5C), with no other differences seen in root-to-shoot dry weight ratio (Figure 5A–D). No significant differences were observed in RLD for the four morphological types by origin or setting (Figure 6A–D).

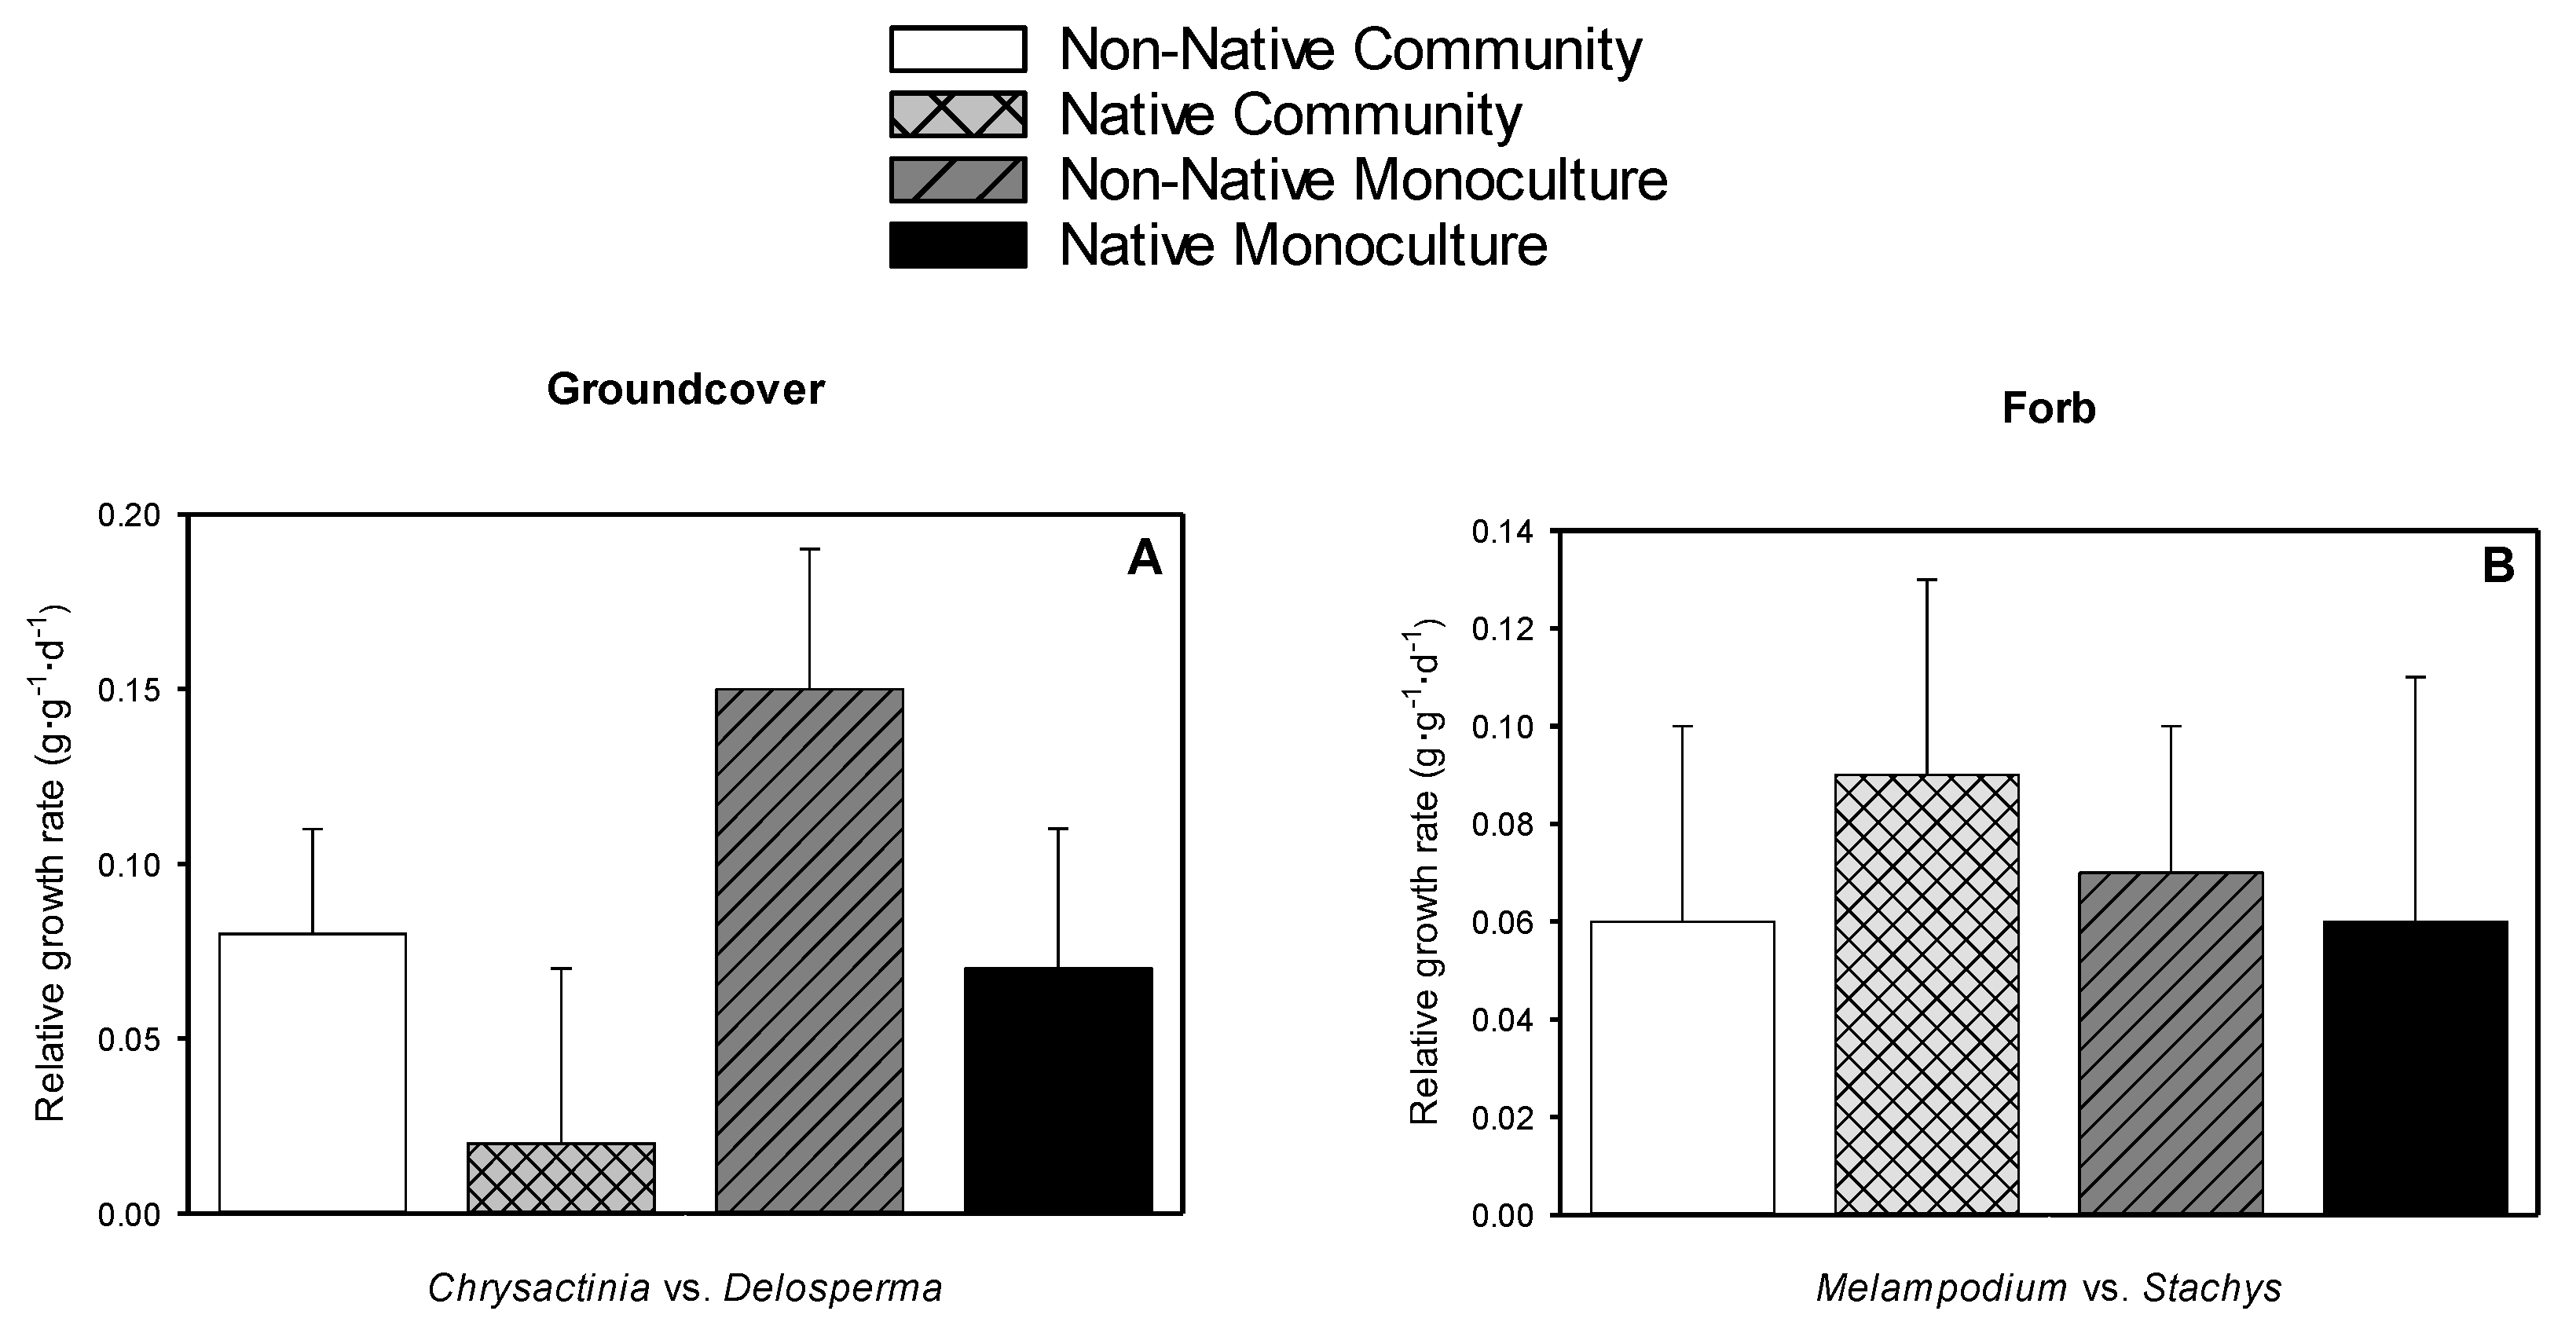
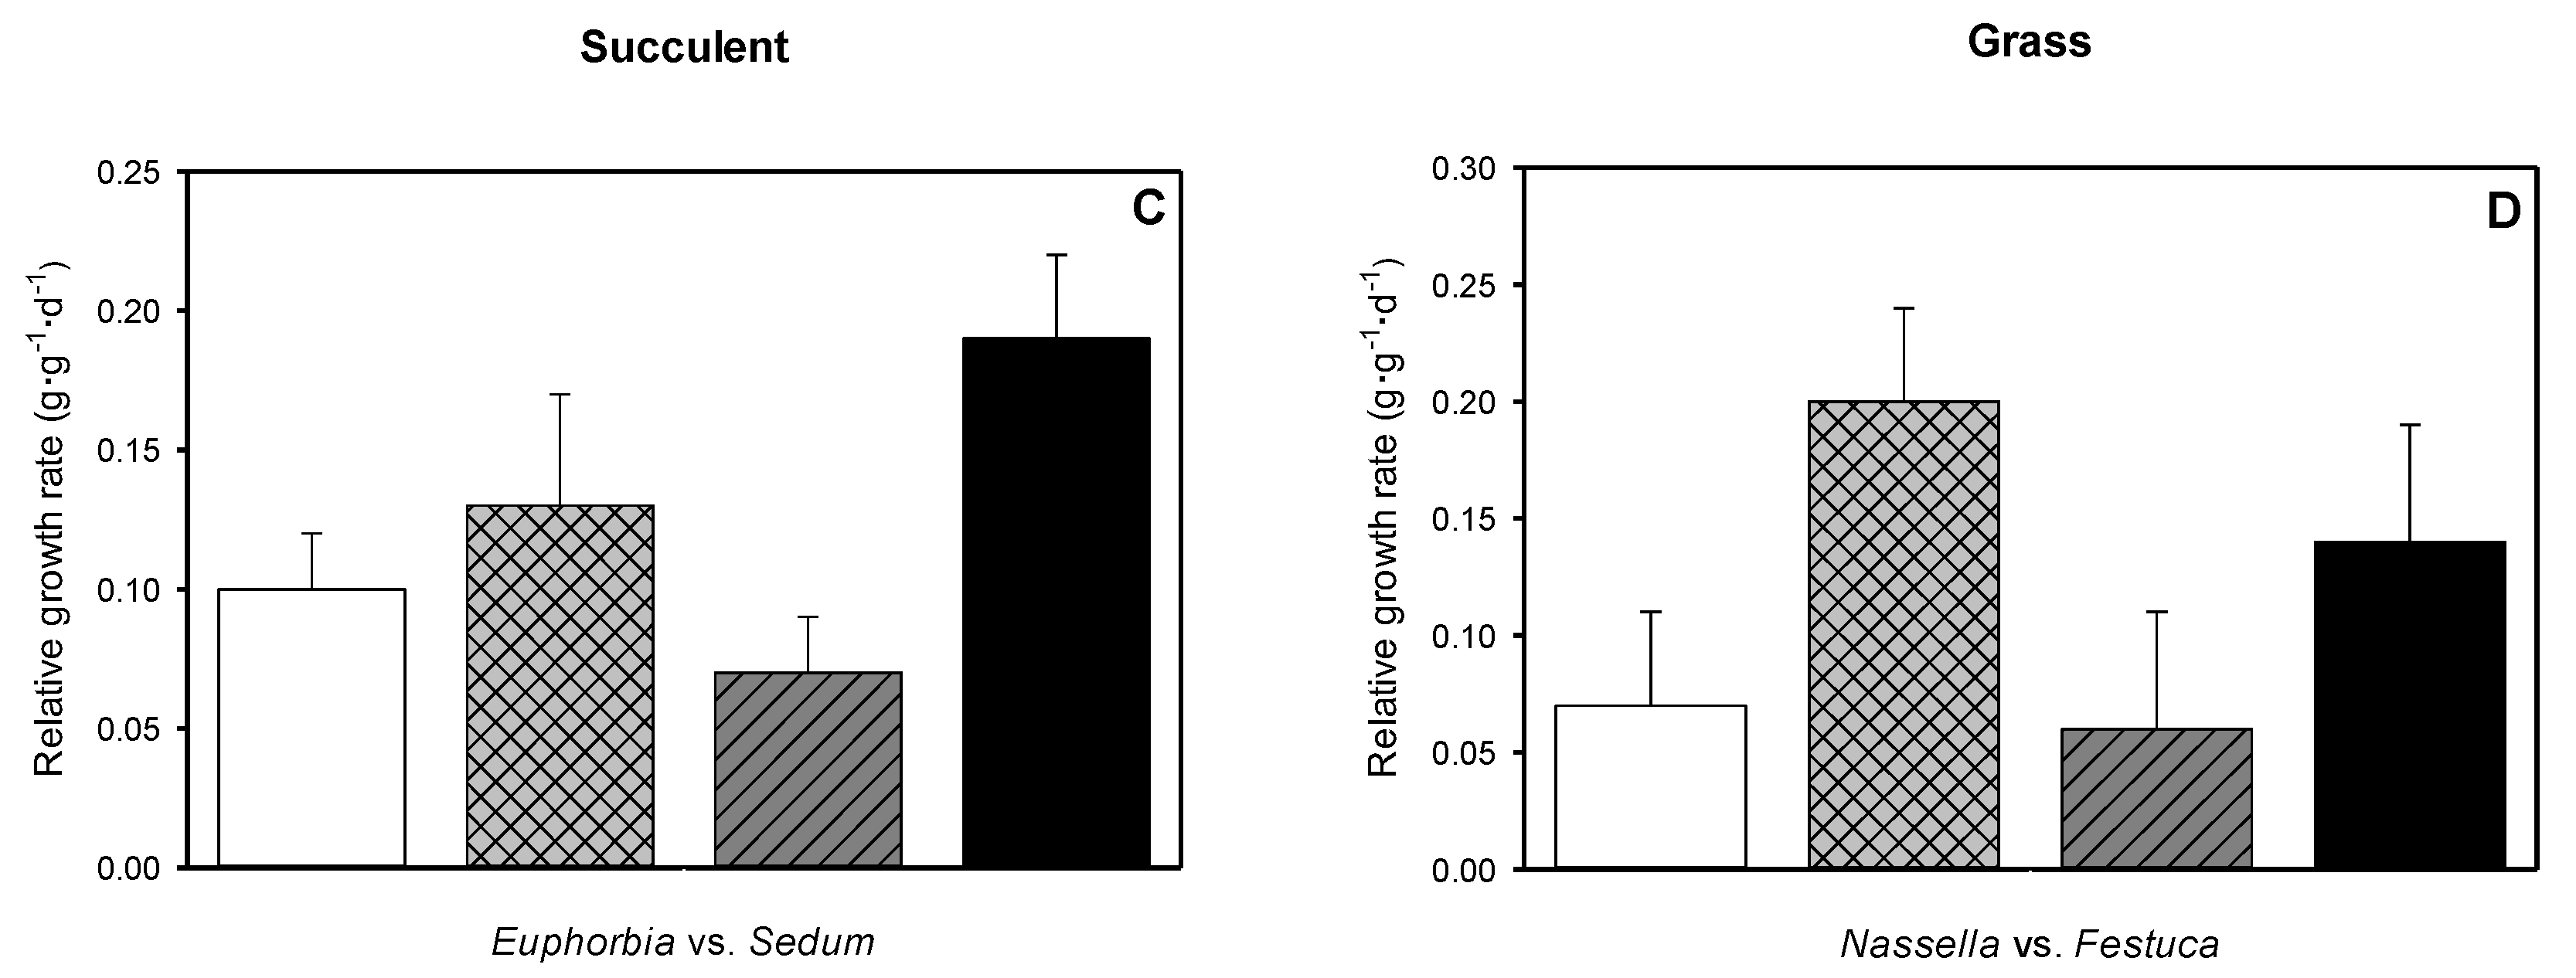
3.6. Relative Growth Rate

Native succulent Euphorbia had greater RGR (0.15 g·g−1·d−1) than non-native Sedum (0.09 g·g−1·d−1) (Figure 7C). No other significant differences were seen in RGR (Figure 7A–D).

3.7. Mortality Rate

At the end of the experiment, 20 of 96 total subsamples had died, a 21% mortality rate (Table 3). Of that, nine subsamples (45%) were natives and 11 (55%) were non-natives, 13 (65%) in monoculture and seven (35%) in community (Table 3). The mortality rate was highest in native groundcover Chrysactinia, of which 58% died and the next highest was non-native grass Festuca at 42% (Table 3).

4. Discussion

The greater coverage of non-native Delosperma may not be surprising given that the expected mature size of Delosperma is 45% greater than that of Chrysactinia (Table 1). Non-native groundcover Delosperma had also greater root length and RDW than native Chrysactinia, which was interesting given that at the conclusion of the experiment, the coverage between the two groundcover species was not significantly different. In terms of QI, RWC, SDW, root-to-shoot dry weight ratio, RLD, and RGR, these two species performed equally well for the preponderance of the two years. In terms of coverage, Delosperma might be a better choice than Chrysactinia because covered growing substrates are cooler and retain more moisture than uncovered growing substrates [31]. Also, the high mortality rate of Chrysactinia makes the Delosperma more appropriate choice of these two groundcovers.
For the native forbs, Melampodium had grown to 31% of expected mature size, and Stachys to 29% expected mature size at the end of the second year. Stachys had significantly greater RWC than native Melampodium, which indicates better physiological status, though no differences were detectable in root length, RDW, SDW, root-to-shoot dry weight ratio, RLD, and RGR. Though Stachys had statistically the same coverage at the end of the second year as the rhizoctonia-free Melampodium, it suffered 33% loss due to rhizoctonia. Rhizoctonia can cause damping-off of greenhouse-grown seedlings of Zinnia [58] and Catharanthus roseus [59], and while symptoms of rhizoctonia depend on the plant species, infected plants generally grow poorly and appear unthrifty [60]. Given the potential for damage from rhizoctonia, the performance of Stachys is remarkable when compared with the unaffected Melampodium. However, the increased maintenance and cost of the fungicidal application regime may mean that native Melampodium is the more sustainable choice of these two.
For most of the experiment, native succulent Euphorbia had significantly greater coverage than non-native Sedum. While non-native Sedum had greater root length, RDW and root-to-shoot dry weight ratio, Euphorbia had a significantly greater RWC for three of four measurements taken. Relative water content most accurately shows the physiological health of the plant and is the most meaningful measurement of the plant’s water status [61]. Euphorbia’s greater RWC indicates that overall, it had a better physiological status. Euphorbia also had greater RGR, which can be a sign of potential for future growth [54]. While Sedum has proven to be a consistent and vigorous plant in research done in cooler and wetter environments, such as western Canada [62] and Michigan [63], in an arid environment, the better water relations and faster RGR of Euphorbia suggest that it is worthy of consideration for green roofs in arid regions.
Nassella had reached 27% of expected mature size at the end of the second year, and Festuca reached 62%. Nassella had maintained a greater coverage throughout the study, and it was only in the last measurement that no difference in size was observed between the grasses. This might be caused by the Nassella going into summer dormancy [64] and ceasing shoot biomass accumulation. Non-native Festuca in monoculture has the highest RWC at the first measurement date, and was also greater in the second, regardless of setting. No differences in RWC were apparent in the grasses in the second year, which could be due to late emergence from dormancy in spring. Nassella had a greater SDW, which is unsurprising given its greater coverage. No difference in root length, RDW, nor root-to-shoot dry weight ratio was seen between the two grass species, which coupled with Nassella’s greater coverage and SDW suggests Nassella is the better selection for a green roof.
The industry standard for green roof vegetative cover is 60% [22,32]. In this study, only Sedum, at 63%, and Festuca, at 62%, meet this standard at the end of year 2. These two species have a much smaller mature size than their morphological partners used in this study, so even if they attained their mature size, it would still require more individual plants to achieve the same amount of substrate coverage. Plants with quicker and more complete coverage from fewer plants means less cost for purchase and installation of the green roof [63]. Thus, further studies will be needed to evaluate desert native and adapted plants that have these growth characteristics.
In extensive green roofs, plants need to be resilient and vigorous so that costs and maintenance of the roof are kept to a minimum. Consequently, plants with high mortality rates are not good choices for green roofs. Chrysactinia had the highest mortality rate in this study, which is surprising because the plant is tolerant of drought and high temperatures [38]. Since temperatures were within normal ranges (Figure 1), we speculate that the inferior performance of this plant might be partly due to the malformed roots observed on the dead subsamples.
Other research has demonstrated that plant communities thrive in green roof settings [21,27,34,35,42,65] and that vegetation diversity can affect SDW, but our research did not show that result. In our study, only one significant difference was seen exclusively in setting, the QI for succulents in the third measurement. Still, the robust nature of plant communities [28], as well as the potential increase in biodiversity [3,4,5], while not measured in this study, do provide compelling evidence that communities are worthy of further investigation. The lack of significant differences in settings in this study suggests that plant communities performed as well as, though not better than, monocultures.

5. Conclusions

While Chrysactinia and Delosperma had similar root length, RDW, and root-to-shoot dry weight ratio, when considered with the greater coverage for Delosperma and the high mortality rate for Chrysactinia, Delosperma appears to be the better choice for green roofs. The forbs had comparable results for most measurements, but Stachys was negatively affected by rhizoctonia, making Melampodium the better choice. While Sedum reached a greater percentage of cover, root length, RDW, and root-to-shoot dry weight ratio, Euphorbia had better RWC and RGR, demonstrating better physiological status. Nassella had greater coverage, and SDW than Festuca, so this species might be the better grass candidate for green roofs in arid regions. Communities performed statistically as well as monocultures. Native plant choices functioned better than non-natives in three of four morphological types, and this indicates that native plants can be considered better choices for arid region green roofs.
Future research in green roofs for arid regions should include limited water as a treatment level in a design similar to this research. In addition, identifying more native species that can obtain the 60% coverage standard and are tolerant of green roofs conditions could help make green roofs more practical in arid regions. This research suggests that plant communities can perform as well as monocultures, and continued research seems warranted to identify other robust native species that could broaden the palette for arid region green roof plant communities.

Author Contributions

R.G. and R.S.H. conceived and designed the experiments; R.G. performed the experiments; D.M.V. analyzed the data; M.G.A. and R.K. contributed revisions/materials/analysis tools; R.G. wrote the paper.

Acknowledgments

This project was provided with significant material support from American Hydrotech, Inc. This project was funded by the Department of Plant and Environmental Sciences and the NM Agriculture Experiment Station. Thank you to Matteo Serena.

Conflicts of Interest

The authors declare no conflict of interest.

References

  1. Green Roof Industry Survey 2016 Executive Summary. Available online: https://static1.squarespace.com/static/58e3eecf2994ca997dd56381/t/5967869229687ff1cfbb6ada/1499956889472/GreenRoofIndustrySurvey2016ExecutiveSummary.pdf (accessed on 10 May 2018).
  2. McIntyre, L.; Snodgrass, E.C. The Green Roof Manual: A Professional Guide to Design, Installation, and Maintenance; Timber Press: Portland, OR, USA, 2010; ISBN 1604690496. [Google Scholar]
  3. Baumann, N. Ground-nesting birds on green roofs in Switzerland: preliminary observations. Urban Habitats 2006, 4, 37–50. [Google Scholar]
  4. Brenneisen, S. Space for urban wildlife: Designing green roofs as habitats in Switzerland. Urban Habitats 2006, 4, 27–36. [Google Scholar]
  5. Brenneisen, S. The Benefits of Biodiversity from Green Roofs: Key Design Consequences. In Proceedings of the 1st North American Green Roof Conference: Greening Rooftops for Sustainable Communities, Chicago, IL, USA, 29–30 May 2003; The Cardinal Group: Toronto, ON, CA, USA; pp. 323–329. [Google Scholar]
  6. Getter, K.L.; Rowe, D.B. The role of extensive green roofs in sustainable development. HortScience 2006, 41, 1276–1285. [Google Scholar]
  7. Oberndorfer, E.; Lundholm, J.; Bass, B.; Coffman, R.R.; Doshi, H.; Dunnett, N.; Gaffin, S.; Köhler, M.; Liu, K.K.; Rowe, B. Green roofs as urban ecosystems: Ecological structures, functions, and services. BioScience 2007, 57, 823–833. [Google Scholar] [CrossRef]
  8. Nabhan, G.P.; St Antoine, S. The loss of floral and faunal story: The extinction of experience. In The Biophilia Hypothesis; Kellert, S.R., Wilson, E.O., Eds.; Island Press: Washington, DC, USA, 1993; pp. 229–250. ISBN 1559631473. [Google Scholar]
  9. Wilson, E.O. Biophilia; Harvard University Press: Cambridge, MA, USA, 1984; p. 157. ISBN 0674074424. [Google Scholar]
  10. Heerwagen, J.; Kellert, S.R.; Mador, M. Biophilic Design: The Theory, Science and Practice of Bringing Buildings to Life; John Wiley and Sons: Hoboken, NJ, USA, 2013; pp. 3–15. ISBN 1118174240. [Google Scholar]
  11. Kellert, S.R.; Wilson, E.O. The Biophilia Hypothesis; Island Press: Washington, DC, USA, 1995; pp. 31–41. ISBN 1559631473. [Google Scholar]
  12. Kosareo, L.; Ries, R. Comparative environmental life cycle assessment of green roofs. Build. Environ. 2007, 42, 2606–2613. [Google Scholar] [CrossRef]
  13. Pedersen, K.L. Green Roofs for Sustainable Urban Development: The Oslo Case Study. Master’s Thesis, Norwegian University of Life Sciences, Ås, Norway, 2014. [Google Scholar]
  14. Carter, T.; Jackson, C.R. Vegetated roofs for stormwater management at multiple spatial scales. Landsc. Urban Plan. 2007, 80, 84–94. [Google Scholar] [CrossRef]
  15. Getter, K.L.; Rowe, D.B. Effect of substrate depth and planting season on Sedum plug survival on green roofs. J. Environ. Hort. 2007, 25, 95–99. [Google Scholar]
  16. Hilten, R.N.; Lawrence, T.M.; Tollner, E.W. Modeling stormwater runoff from green roofs with HYDRUS-1D. J. Hydrol. 2008, 358, 288–293. [Google Scholar] [CrossRef]
  17. Van Renterghem, T.; Botteldooren, D. Numerical evaluation of sound propagating over green roofs. J. Sound Vib. 2008, 317, 781–799. [Google Scholar] [CrossRef]
  18. Yang, J.; Yu, Q.; Gong, P. Quantifying air pollution removal by green roofs in Chicago. Atmos. Environ. 2008, 42, 7266–7273. [Google Scholar] [CrossRef]
  19. Takebayashi, H.; Moriyama, M. Surface heat budget on green roof and high reflection roof for mitigation of urban heat island. Build. Environ. 2007, 42, 2971–2979. [Google Scholar] [CrossRef]
  20. Bass, B. Green Roofs and Green Walls: Potential Energy Savings in the Winter. In Proceedings of the Adaption and Impacts Research Division, Environment Canada, University of Toronto, Toronto, ON, CA, USA, 31 March 2007; Available online: https://www.researchgate.net/profile/Brad_Bass/publication/242663071_Green_Roofs_and_Green_Walls_Potential_Energy_Savings_in_the_Winter/links/0c96052b4deec56cc2000000.pdf (accessed on 3 March 2018).
  21. Dunnett, N.; Nolan, A. The Effect of Substrate Depth and Supplementary Watering on the Growth of Nine Herbaceous Perennials in a Semi-extensive Green Roof. Acta Hort. 2002, 643, 305–309. [Google Scholar] [CrossRef]
  22. Durhman, A.K.; Rowe, D.B.; Rugh, C.L. Effect of substrate depth on initial growth, coverage, and survival of 25 succulent green roof plant taxa. HortScience 2007, 42, 588–595. [Google Scholar]
  23. Durhman, A.K.; Rowe, D.B.; Rugh, C.L. Effect of watering regimen on chlorophyll fluorescence and growth of selected green roof plant taxa. HortScience 2006, 41, 1623–1628. [Google Scholar]
  24. Hotovec, L.; Gioannini, R.; VanLeeuwen, D.M.; Hilaire, R.S. Shallow substrates support the growth of contrasting plant types installed in irrigated, arid-climate green roofs. J. Environ. Hort. 2017, 35, 146–155. [Google Scholar]
  25. Ntoulas, N.; Nektarios, P.A.; Nydrioti, E. Performance of Zoysia matrella ‘Zeon’in shallow green roof substrates under moisture deficit conditions. HortScience 2013, 48, 929–937. [Google Scholar]
  26. Thuring, C.E.; Berghage, R.D.; Beattie, D.J. Green roof plant responses to different substrate types and depths under various drought conditions. HortTechnology 2010, 20, 395–401. [Google Scholar]
  27. Getter, K.L.; Rowe, D.B. Substrate depth influences Sedum plant community on a green roof. HortScience 2009, 44, 401–407. [Google Scholar]
  28. Bousselot, J.M.; Klett, J.E.; Koski, R.D. Moisture content of extensive green roof substrate and growth response of 15 temperate plant species during dry down. HortScience 2011, 46, 518–522. [Google Scholar]
  29. Castleton, H.; Stovin, V.; Beck, S.; Davison, J. Green roofs; building energy savings and the potential for retrofit. Energy Build. 2010, 42, 1582–1591. [Google Scholar] [CrossRef]
  30. Livingston, E.; Miller, C.; Lohr, M. Green Roof Design and Implementation in Florida. In Proceedings of the Second Annual Greening Rooftops for Sustainable Communities Conference, Awards and Trade Show, Portland, OR, USA, 2–4 June 2004; The Cardinal Group: Toronto, ON, CA, USA, 2004; pp. 353–364. [Google Scholar]
  31. Blanusa, T.; Monteiro, M.M.V.; Fantozzi, F.; Vysini, E.; Li, Y.; Cameron, R.W. Alternatives to Sedum on green roofs: can broad leaf perennial plants offer better ‘cooling service’? Build. Environ. 2013, 59, 99–106. [Google Scholar] [CrossRef]
  32. Forschungsgesellschaft Landschaftsentwicklung Landschaftsbau (FLL). Guidelines for the Planning, Execution and Upkeep of Green-Roof Sites; FLL: Bonn, Germany, 2002. [Google Scholar]
  33. Altieri, M.A.; Letourneau, D.K. Vegetation management and biological control in agroecosystems. Crop Prot. 1982, 1, 405–430. [Google Scholar] [CrossRef]
  34. Dewey, D.W.; Johnson, P.G.; Kjelgren, R.K. Species composition changes in a rooftop grass and wildflower meadow: implications for designing successful mixtures. Native Plants J. 2004, 5, 56–65. [Google Scholar] [CrossRef]
  35. Dunnett, N.; Nagase, A.; Hallam, A. The dynamics of planted and colonising species on a green roof over six growing seasons 2001–2006: Influence of substrate depth. Urban Ecosyst. 2008, 11, 373–384. [Google Scholar] [CrossRef]
  36. Dunnett, N.; Kingsbury, N. Planting Green Roofs and Living Walls; Timber Press: Portland, OR, USA, 2008; ISBN 9780881929119. [Google Scholar]
  37. Duffield, M.; Jones, W.D. Plants for Dry Climates: How to Select, Grow and Enjoy; De Capo Press: Boston, MA, USA, 1981; p. 172. ISBN 0895860422. [Google Scholar]
  38. Jones, W.D.; Sacamano, C.M. Landscape Plants for Dry Regions: More than 600 Species from Around the World; De Capo Press: Boston, MA, USA, 2000; pp. 107, 153, 215. ISBN 1555611907. [Google Scholar]
  39. Wasowski, S.; Wasowski, A. Native Texas Plants: Landscaping Region by Region; Taylor Trade Publishing: Boulder, CO, USA, 2003; p. 198. ISBN 1589796586. [Google Scholar]
  40. Mielke, J. Native Plants for Southwestern Landscapes; University of Austin Press: Austin, TX, USA, 1993; p. 144. ISBN 0292751478. [Google Scholar]
  41. Kottek, M.; Grieser, J.; Beck, C.; Rudolf, B.; Rubel, F. World map of the Köppen-Geiger climate classification updated. Meteorologische Zeitschrift 2006, 15, 259–263. [Google Scholar] [CrossRef]
  42. Nagase, A.; Dunnett, N. Drought tolerance in different vegetation types for extensive green roofs: Effects of watering and diversity. Landsc. Urban Plan. 2010, 97, 318–327. [Google Scholar] [CrossRef]
  43. Hilaire, R.S. Landscape Plants for the Lower Rio Grande Basin; Sentia Publishing: Austin, TX, USA, 2012; p. 18. ISBN 9781732060173. [Google Scholar]
  44. Horvath, B. The Plant Lover’s Guide to Sedums; Timber Press: Portland, OR, USA, 2014; p. 120. ISBN 1604693924. [Google Scholar]
  45. Plant Hardiness Zone Map for the United States. Available online: http://planthardiness.ars.usda.gov/PHZMWeb/ (accessed on 7 March 2015).
  46. U.S. Climate Data. Available online: http://www.usclimatedata.com/climate/las-cruces/new-mexico/united-states/usnm0492/2017/1 (accessed on 7 March 2015).
  47. Clouston, B. Landscape Design with Plants, 2nd ed.; CRC Press: Boca Raton, FL, USA, 1989; p. 416. ISBN 0434902349. [Google Scholar]
  48. Barnard, C.M.; Potter, L.D. New Mexico Grasses: A Vegetative Key; University of New Mexico Press: Albuquerque, NM, USA, 1984; p. 92. ISBN 0826307442. [Google Scholar]
  49. Bennett, J. Dryland Gardening; Plants that Survive and Thrive in Tough Conditions; Firefly Books: Richmond Hill, ON, USA, 2005; p. 76. ISBN 9781554070312. [Google Scholar]
  50. Handreck, K.A.; Black, N.D. Growing Media for Ornamental Plants and Turf; University of New South Wales Press: Kensington, UK, 2002; p. 14. ISBN 0868407968. [Google Scholar]
  51. Bousselot, J.M.; Klett, J.E.; Koski, R.D. Evaluating a natural zeolite as an amendment for extensive green roof substrate. J. Environ. Hort. 2012, 30, 201–206. [Google Scholar]
  52. Liu, R.; Coffman, R. Lightweight aggregate made from dredged material in green roof construction for stormwater management. Materials 2016, 9, 611. [Google Scholar] [CrossRef] [PubMed]
  53. Gutschick, V.; Kay, L. Nutrient-limited growth rates: quantitative benefits of stress responses and some aspects of regulation. J. Exp. Bot. 1995, 46, 995–1009. [Google Scholar] [CrossRef]
  54. Bsoul, E.; Hilaire, R.S.; VanLeeuwen, D.M. Bigtooth maples exposed to asynchronous cyclic irrigation show provenance differences in drought adaptation mechanisms. J. Am. Soc. Hort. Sci. 2006, 131, 459–468. [Google Scholar]
  55. Ramsey, F.L.; Schafer, D.W. The Statistical Sleuth: A Course in Methods of Data Analysis, 2nd ed.; Duxbury/Thomson Learning Inc.: Pacific Grove, CA, USA, 2002; ISBN 0534386709. [Google Scholar]
  56. Piepho, H.-P. A SAS macro for generating letter displays of pairwise mean comparisons. Commun. Biometry Crop Sci. 2012, 7, 4–13. [Google Scholar]
  57. Saxton, A.M. A Macro for Converting Mean Separation Output to Letter Groupings in Proc Mixed. In Proceedings of the 23rd SAS Users Group International, Nashville, TN, USA, 22–25 March 1998; pp. 1243–1246. [Google Scholar]
  58. Lumsden, R.D.; Walter, J.F. Development of Gliocladium virens for damping-off disease control. Can. J. Plant Path. 1996, 18, 463–468. [Google Scholar] [CrossRef]
  59. Burns, J.; Benson, D. Biocontrol of damping-off of Catharanthus roseus caused by Pythium ultimum with Trichoderma virens and binucleate Rhizoctonia fungi. Plant Dis. 2000, 84, 644–648. [Google Scholar] [CrossRef]
  60. French, J.; New Mexico State University, Las Cruces, NM, USA. Personal communication, 2016.
  61. Noggle, G.R.; Fritz, G.J. Introductory Plant Physiology; Prentice-Hall, Inc.: Englewood Cliffs, NJ, USA, 1976; p. 446. ISBN 0135020964. [Google Scholar]
  62. MacIvor, J.S.; Lundholm, J. Performance evaluation of native plants suited to extensive green roof conditions in a maritime climate. Ecol. Eng. 2011, 37, 407–417. [Google Scholar] [CrossRef]
  63. Monterusso, M.A.; Rowe, D.B.; Rugh, C.L. Establishment and persistence of Sedum spp. and native taxa for green roof applications. HortScience 2005, 40, 391–396. [Google Scholar]
  64. Ondra, N.J. Grasses: Versatile Partners for Uncommon Garden Design; Storey Publishing: North Adams, MA, USA, 2002; p. 112. ISBN 9781580174237. [Google Scholar]
  65. Getter, K.L.; Rowe, D.B.; Cregg, B.M. Solar radiation intensity influences extensive green roof plant communities. Urban For. Urban Green. 2009, 8, 269–281. [Google Scholar] [CrossRef]
Figure 1. Weekly mean temperature, mean relative humidity, and precipitation collected at Fabian Garcia Research Center, Las Cruces, NM from May 2016 to July 2017.
Sustainability 10 01755 g001
Figure 2. Root length (cm) for all taxa at the end of two growing seasons when grown in a simulated green roof setting from May 2016 to July 2017 at Fabian Garcia Research Center, Las Cruces, NM.
Sustainability 10 01755 g002
Figure 3. Root dry weight (g) for all taxa at the end of two growing seasons when grown in a simulated green roof setting from May 2016 to July 2017 at Fabian Garcia Research Center, Las Cruces, NM.
Sustainability 10 01755 g003
Figure 4. Shoot dry weight (g) for all taxa at the end of two growing seasons when grown in a simulated green roof setting from May 2016 to July 2017 at Fabian Garcia Research Center, Las Cruces, NM.
Sustainability 10 01755 g004aSustainability 10 01755 g004b
Figure 5. Root-to-shoot dry weight ratio for all taxa at the end of two growing seasons when grown in a simulated green roof setting from May 2016 to July 2017 at Fabian Garcia Research Center, Las Cruces, NM.
Sustainability 10 01755 g005
Figure 6. Root length density (cm/cm3) for all taxa at the end of two growing seasons when grown in a simulated green roof setting from May 2016 to July 2017 at Fabian Garcia Research Center, Las Cruces, NM.
Sustainability 10 01755 g006
Figure 7. Relative growth rate (g·g−1·d−1) for all taxa at the end of two growing seasons when grown in a simulated green roof setting from May 2016 to July 2017 at Fabian Garcia Research Center, Las Cruces, NM.
Sustainability 10 01755 g007aSustainability 10 01755 g007b
Table 1. Morphological characteristics of species and data from initial destructive harvest. Data with standard errors were averaged from three uniform plants of each species.
SpeciesTypeTypical Spread at Maturity (cm2)Leaf Area (cm2)Shoot Dry Weight (g)Root Dry Weight (g)Root-to-shoot Dry Weight Ratio
Chrysactinia mexicananative groundcover930–3721 1496.02.00.33
Delosperma nubigenumnon-native groundcover8281 23489.03.20.35
Melampodium leucanthumnative forb400–3721 1190 6.32.10.35
Stachys byzantinanon-native forb900–3600 32532.75.41.98
Euphorbia antisyphiliticanative succulent3721 124419.14.80.26
Sedum kamtschiaticumnon-native succulent900 46124.65.31.10
Nassella tenuissimanative grass1600–6400 528314.68.40.58
Festuca glaucanon-native grass225–625 6294.23.80.91
1 [38]; 2 [43]; 3 [47]; 4 [44]; 5 [48]; 6 [49].
Table 2. Irrigation application frequency and duration to green roof trays at Fabian Garcia Research Center, Las Cruces, NM. Irrigation applied via Netafim irrigation line with 0.6 GPH emitters placed 5 cm below substrate level. Irrigation rates were adjusted based on climate conditions, plant observations, and substrate observation.
Irrigation
DateDuration
(Minutes per Day)
Frequency
(Days per Week)
Weekly Amount
(Liters per Week)
2016
13 May13734.3
18 MayOff
3 June10726.6
17 August6716.1
28 September649.2
14 November535.7
2017
15 March649.2
17 April4710.5
3 May6716.1
Table 3. Mortality of plants in a green roof study conducted at Fabian Garcia Research Center, Las Cruces, NM. Percentages from number of plants in each species divided by number of plants in each group.
TaxaDead (no.)Overall Loss
(%)
Within Species (%)Setting
Monoculture (%)Community (%)
Chrysactinia735587129
Delosperma1580100
Euphorbia00000
Festuca525428020
Melampodium210175050
Nassella00000
Sedum1581000
Stachys420335050
Total Loss20
Table 4. Mean plant coverage (cm2) for native (N) Chrysactinia mexicana or non-native (NN) Delosperma nubigenum groundcover plants grown in either monoculture (Mono) or community (Comm). Plants were grown in a simulated green roof setting from May 2016 to July 2017 at Fabian Garcia Research Center, Las Cruces, NM. LS Means for significant effects were compared using model-based estimates and standard errors (n = 24).
Measurement Date
20162017
SettingOriginJuly
(53 days z)
Aug.
(81 days)
Sept.
(116 days)
Oct.
(144 days)
Nov.
(172 days)
Apr.
(326 days)
May
(354 days)
June
(389 days)
July
(417 days)
CommNN579 z676683693721691688684402
CommN250275454432424156181174191
MonoNN509586664655645553566566635
MonoN190210383398400359384482339
Origin Differences ± S.E.NN, N324 ± 48388 ± 58254 ± 81259 ± 95271 ± 105364 ± 124344 ± 133------
Significancep value
Setting 0.21360.21270.59840.71250.64760.80260.76810.55020.3361
Origin 0.00020.00010.01360.02640.03290.01900.03250.08620.2100
Setting × Origin 0.92130.83050.75500.97920.80640.20720.25770.19820.8243
z Numbers in parenthesis is the number of days after transplanting.
Table 5. Mean plant coverage (cm2) for native (N) Melampodium leucanthum or non-native (NN) Stachys byzantina forb plants grown in either monoculture (Mono) or community (Comm). Plants were grown in a simulated green roof setting from May 2016 to July 2017 at Fabian Garcia Research Center, Las Cruces, NM. LS Means for significant effects were compared using model-based estimates and standard errors (n = 24).
Measurement Date
20162017
SettingOriginJuly
(53 days y)
Aug.
(81 days)
Sept.
(116 days)
Oct.
(144 days)
Nov.
(172 days)
Apr.
(326 days)
May
(354 days)
June
(389 days)
July
(417 days)
CommNN254353 c z490 c723 c713 c317420593524
CommN10401929 a3754 a3986 a3541 a776102711681144
MonoNN337507 c620 c682 c708 c288384432649
MonoN8141243 b1797 b1946 b1566 b67494810151185
Setting Differences ± S.E.Mono, Comm------914 ± 2541041 ± 277990 ± 240------------
Origin Differences ± S.E.NN, N632 ± 116 1157 ± 1762220 ± 2542265 ± 2771843 ± 240422 ± 130586 ± 166579 ± 216---
Significancep value
Setting 0.55280.16790.00710.00560.00330.62580.73930.48730.7877
Origin 0.00060.0002<0.0001<0.0001<0.00010.01180.00780.02790.0873
Setting × Origin 0.21850.04360.00340.00700.00340.77830.89910.98390.8911
y Numbers in parenthesis is the number of days after transplanting; z Letters noted only when there is a significant interaction. Numbers that share same letters within the column are not significantly different based on Saxton’s pdmix 800.
Table 6. Mean plant coverage (cm2) for native (N) Euphorbia antisyphilitica or non-native (NN) Sedum kamtschiaticum succulent plants grown in either monoculture (Mono) or community (Comm). Plants were grown in a simulated green roof setting from May 2016 to July 2017 at Fabian Garcia Research Center, Las Cruces, NM. LS Means for significant effects were compared using model-based estimates and standard errors (n = 24).
Measurement Date
20162017
SettingOriginJuly
(53 days z)
Aug.
(81 days)
Sept.
(116 days)
Oct.
(144 days)
Nov.
(172 days)
Apr.
(326 das)
May
(354 days)
June
(389 days)
July
(417 days)
CommNN126177275276259239307477704
CommN471551732737778582642660574
MonoNN170191228215211271275422431
MonoN350408658715752657653792753
Origin Differences ± S.E.NN, N262 ± 53295 ± 64443 ± 79480 ± 89531 ± 97365 ± 83356 ± 81303 ± 121---
Significancep value
Setting 0.49010.34210.46800.65210.71290.53620.90400.91990.6613
Origin 0.00120.00170.00050.00060.00060.00230.00230.03660.3815
Settingx Origin 0.16200.25130.86480.83680.90970.80190.79910.35220.0596
z Numbers in parenthesis is the number of days after transplanting.
Table 7. Mean plant coverage (cm2) for native (N) Nassella tenuissima or non-native (NN) Festuca glauca grass plants grown in either monoculture (Mono) or community (Comm). Plants were grown in a simulated green roof setting from May 2016 to July 2017 at Fabian Garcia Research Center, Las Cruces, NM. LS Means for significant effects were compared using model-based estimates and standard errors (n = 24)
Measurement Date
20162017
SettingOriginJuly
(53 days z)
Aug.
(81 days)
Sept.
(116 days)
Oct.
(144 days)
Nov.
(172 days)
Apr.
(326 days)
May
(354 days)
June
(389 days)
July
(417 days)
CommNN541457403374345422583598466
CommN161620142317252125281412188819692993
MonoNN452335335369395472532612304
MonoN13281873304734532724137512069631111
Origin Differences ± S.E.NN, N975 ± 132 z1547 ± 2512313 ± 3022615 ± 3882256 ± 259947 ± 186989 ± 207861 ± 2461348 ± 353
Significancep value
Setting 0.19040.61660.30420.26600.64720.97270.11390.07850.0820
Origin <0.00010.0003<0.00010.0001<0.00010.00090.00140.00810.0051
Settingx Origin 0.47160.96980.22240.26130.78560.81890.16560.07180.1645
z Numbers in parenthesis is the number of days after transplanting.

