Quantifying the Decision-Making of PPPs in China by the Entropy-Weighted Pareto Front: A URT Case from Guizhou


Abstract
:1. Introduction
2. Materials and Methods
2.1. The Modeling Process
2.1.1. Phase 1—Implement Factor Analysis
- Step 1.
- Identify whether a certain linear relationship exists between the qualitative evaluation indicators. If yes, it will be suitable to extract factors by factor analysis. The common test methods include correlation coefficient matrix, the Bartlett Sphericity (BS) test, and the Kaiser–Meyer–Olkin (KMO) test. The correlation coefficient matrix will be generated at this step.
- Step 2.
- Make a tentative extraction by principal component analysis (PCA) method. According to the correlation coefficient matrix of the original indicators, the initial component analysis will be applied to extract the factors with eigenvalues greater than 1. The initial solution of the factor analysis (the factor-loading matrix) will be obtained at this step.
- Step 3.
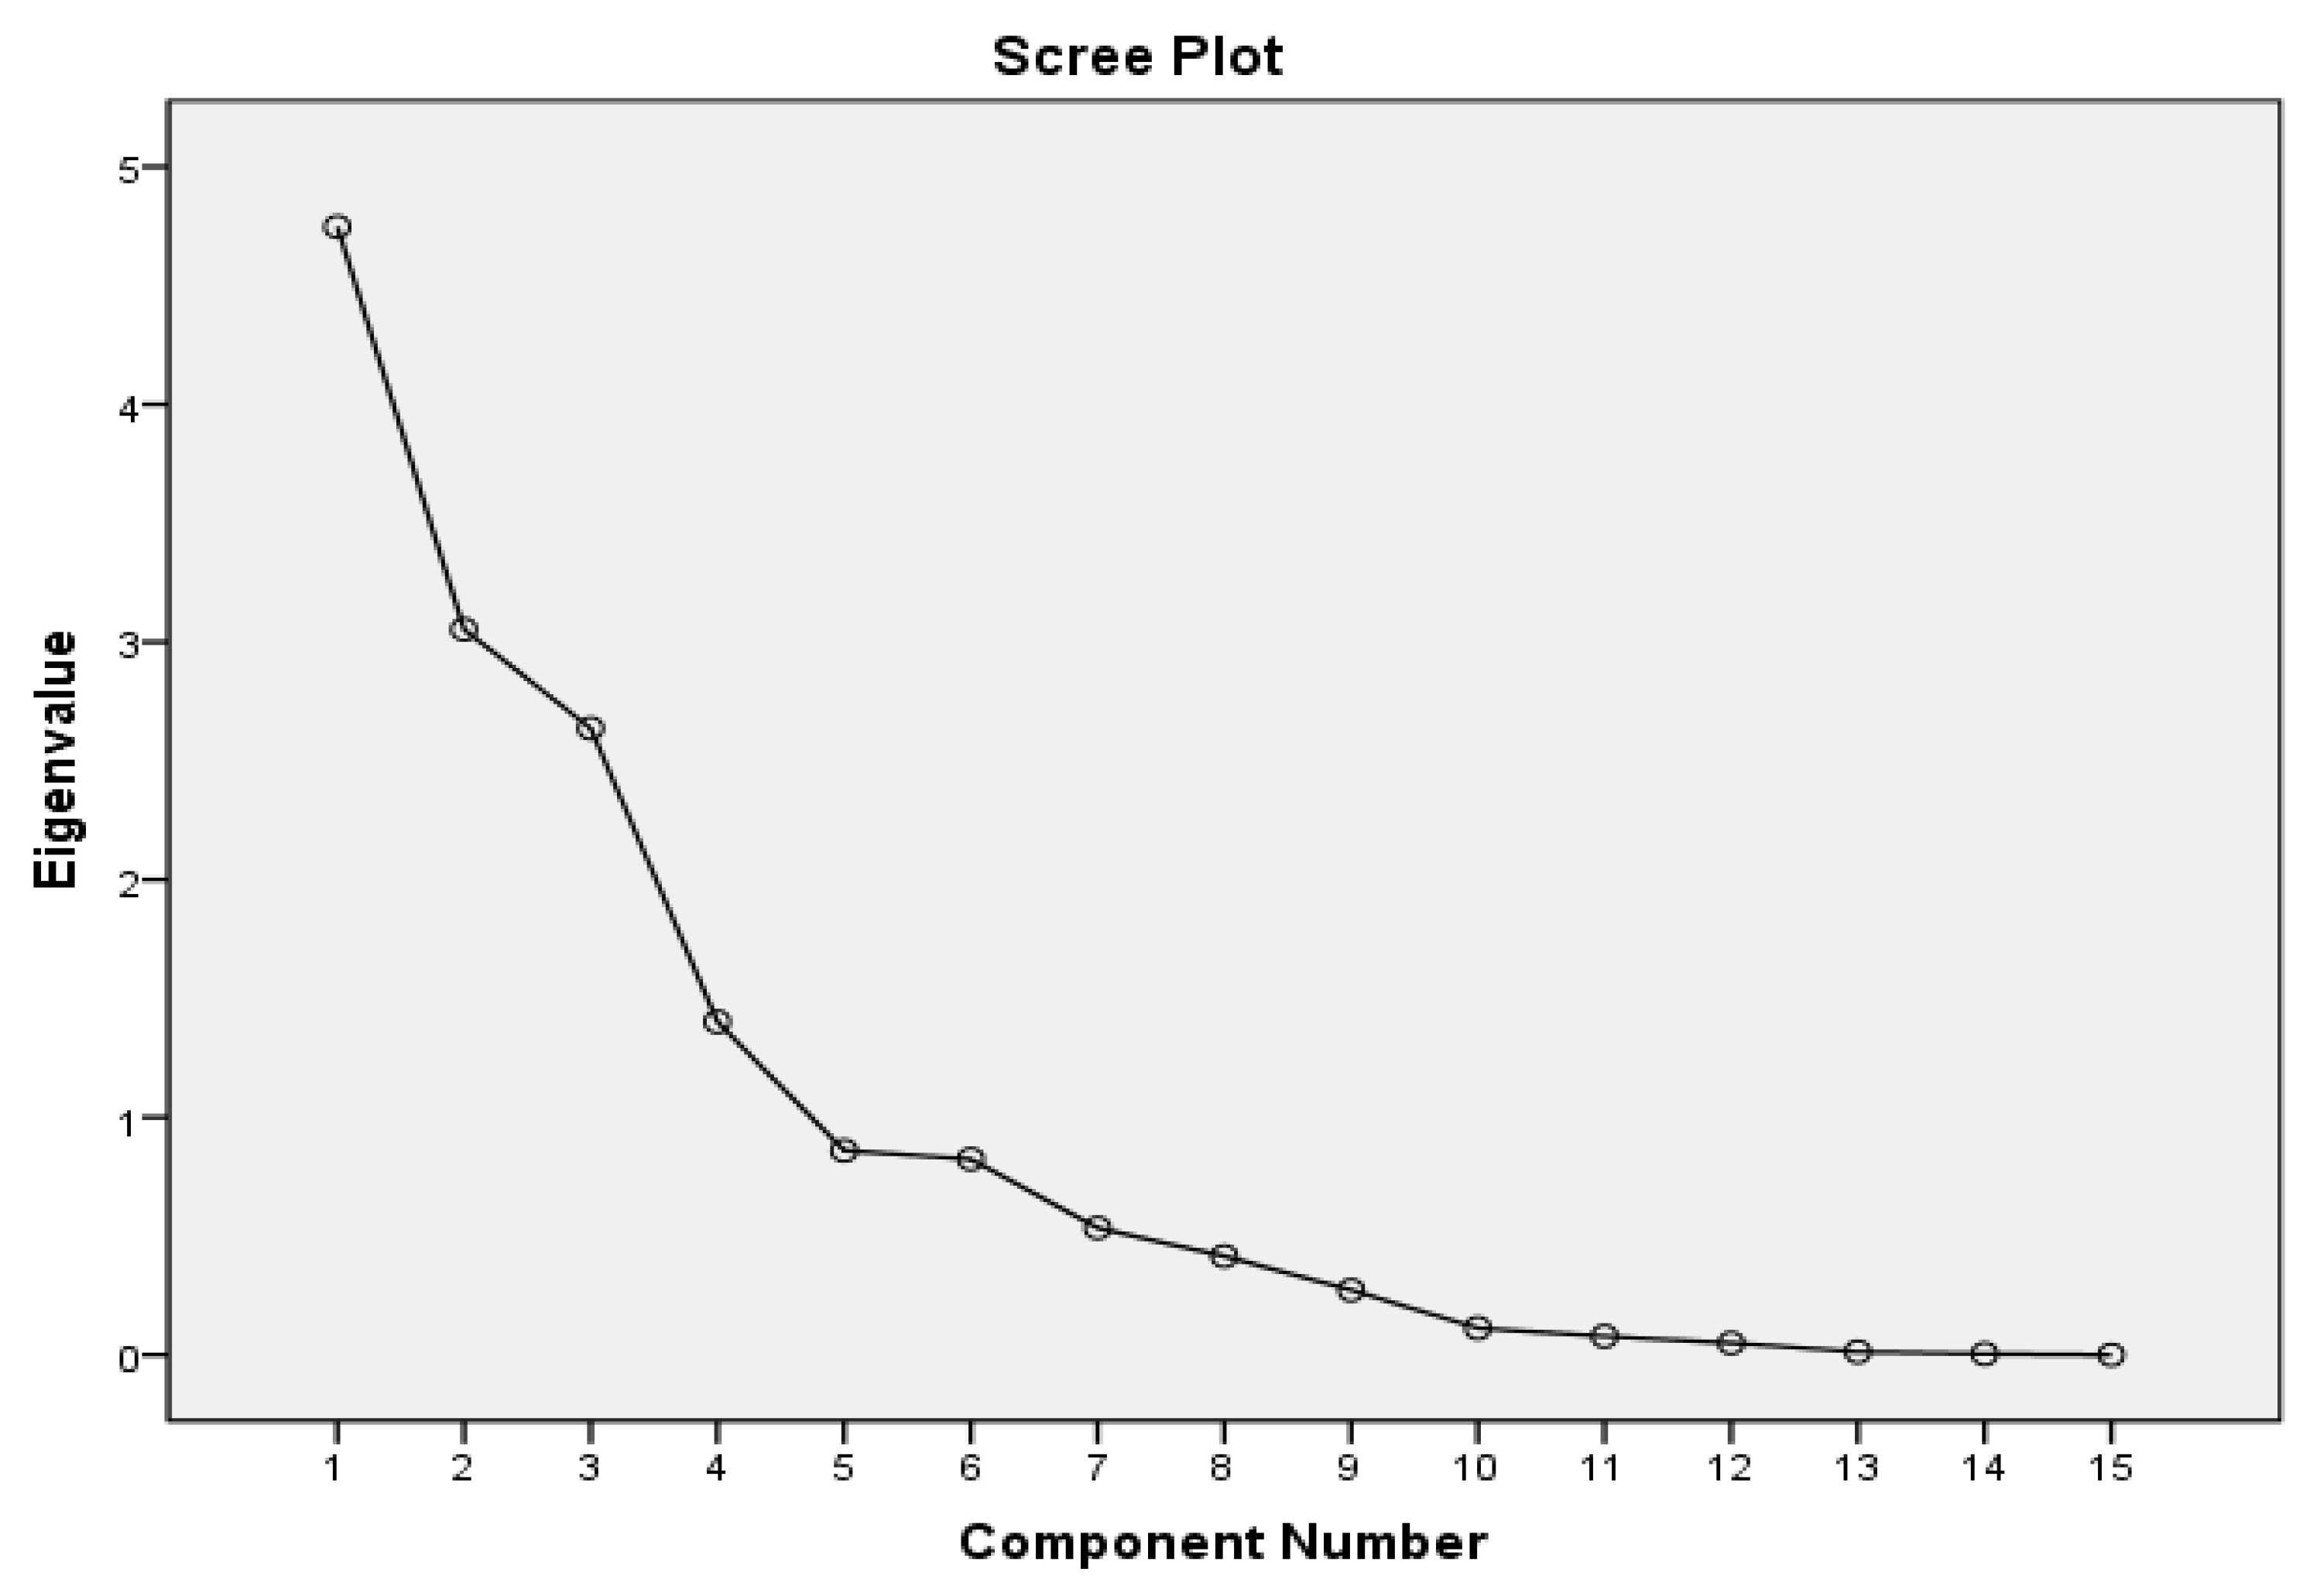
- Determine the number of factors to be extracted by observing the scree plot and the result of the total variance interpreted.
- Step 4.
- Implement the orthogonal rotation to the factor-loading matrix by the varimax method, and then output the result by the descending order of first factor loading. The rotated factor-loading matrix will be obtained at this step.
2.1.2. Phase 2—Calculate Entropy Weights
- Step 1.
- Determine the indicators that will be used to calculate the entropy weights of the net cost of the private sector, the public sector, or the users. Suppose that there are n indicators, and that each has m evaluation objects. A m × n matrix will be obtained at this step. aij (i = 1,2, …, m; j = 1,2, …n) is supposed to be an element of the matrix as the value of the i-th item in the j-th indicator.
- Step 2.
- Standardize the values of all of the items. a’ij is supposed to be the standardized value of an item. Use:for the indicator on which project has better performance when the value of aij is larger; or use:for the indicator on which project has the better performance when the value of aij is smaller.
- Step 3.
- Calculate the proportion yij of a’ij in the matrix.
- Step 4.
- Calculate the entropy value ej of every indicator.when , .
- Step 5.
- Calculate the difference coefficient dj of every indicator.
- Step 6.
- Calculate the entropy weight of every indicator.
2.1.3. Phase 3—Build the Optimization Model
- Step 1.
- Determine the decision variables of the optimization model based on the factor analysis results in Phase 1.
- Step 2.
- Determine the functions of the optimization model objectives and constraints by the PSC method.
- Step 3.
- Identify whether the optimization model has available solutions when it is required to satisfy the constraints that both the VFM and returns of the private sector are positive.
2.1.4. Phase 4—Get the Entropy-Weighted Results
- Step 1.
- Solve the optimization model by ‘gamultiobj’ solver on MATLAB 9.1.0.441655 (R2016b), and then get the Pareto solutions sets.
- Step 2.
- Calculate the entropy-weighted sum of each set in the Pareto front solution sets.
- Step 3.
- Find the minimum weighted sum, and the value set of its corresponding decision variables will be determined as the best quantitative decision of the project.
2.2. The Two Types of Optimization Models
2.3. A URT PPP Project Case
3. Results
3.1. The Factor Analysis
3.2. Two Nonlinear Multi-Objective Models
3.2.1. Model 1
3.2.2. Model 2
3.3. The Entropy Weights
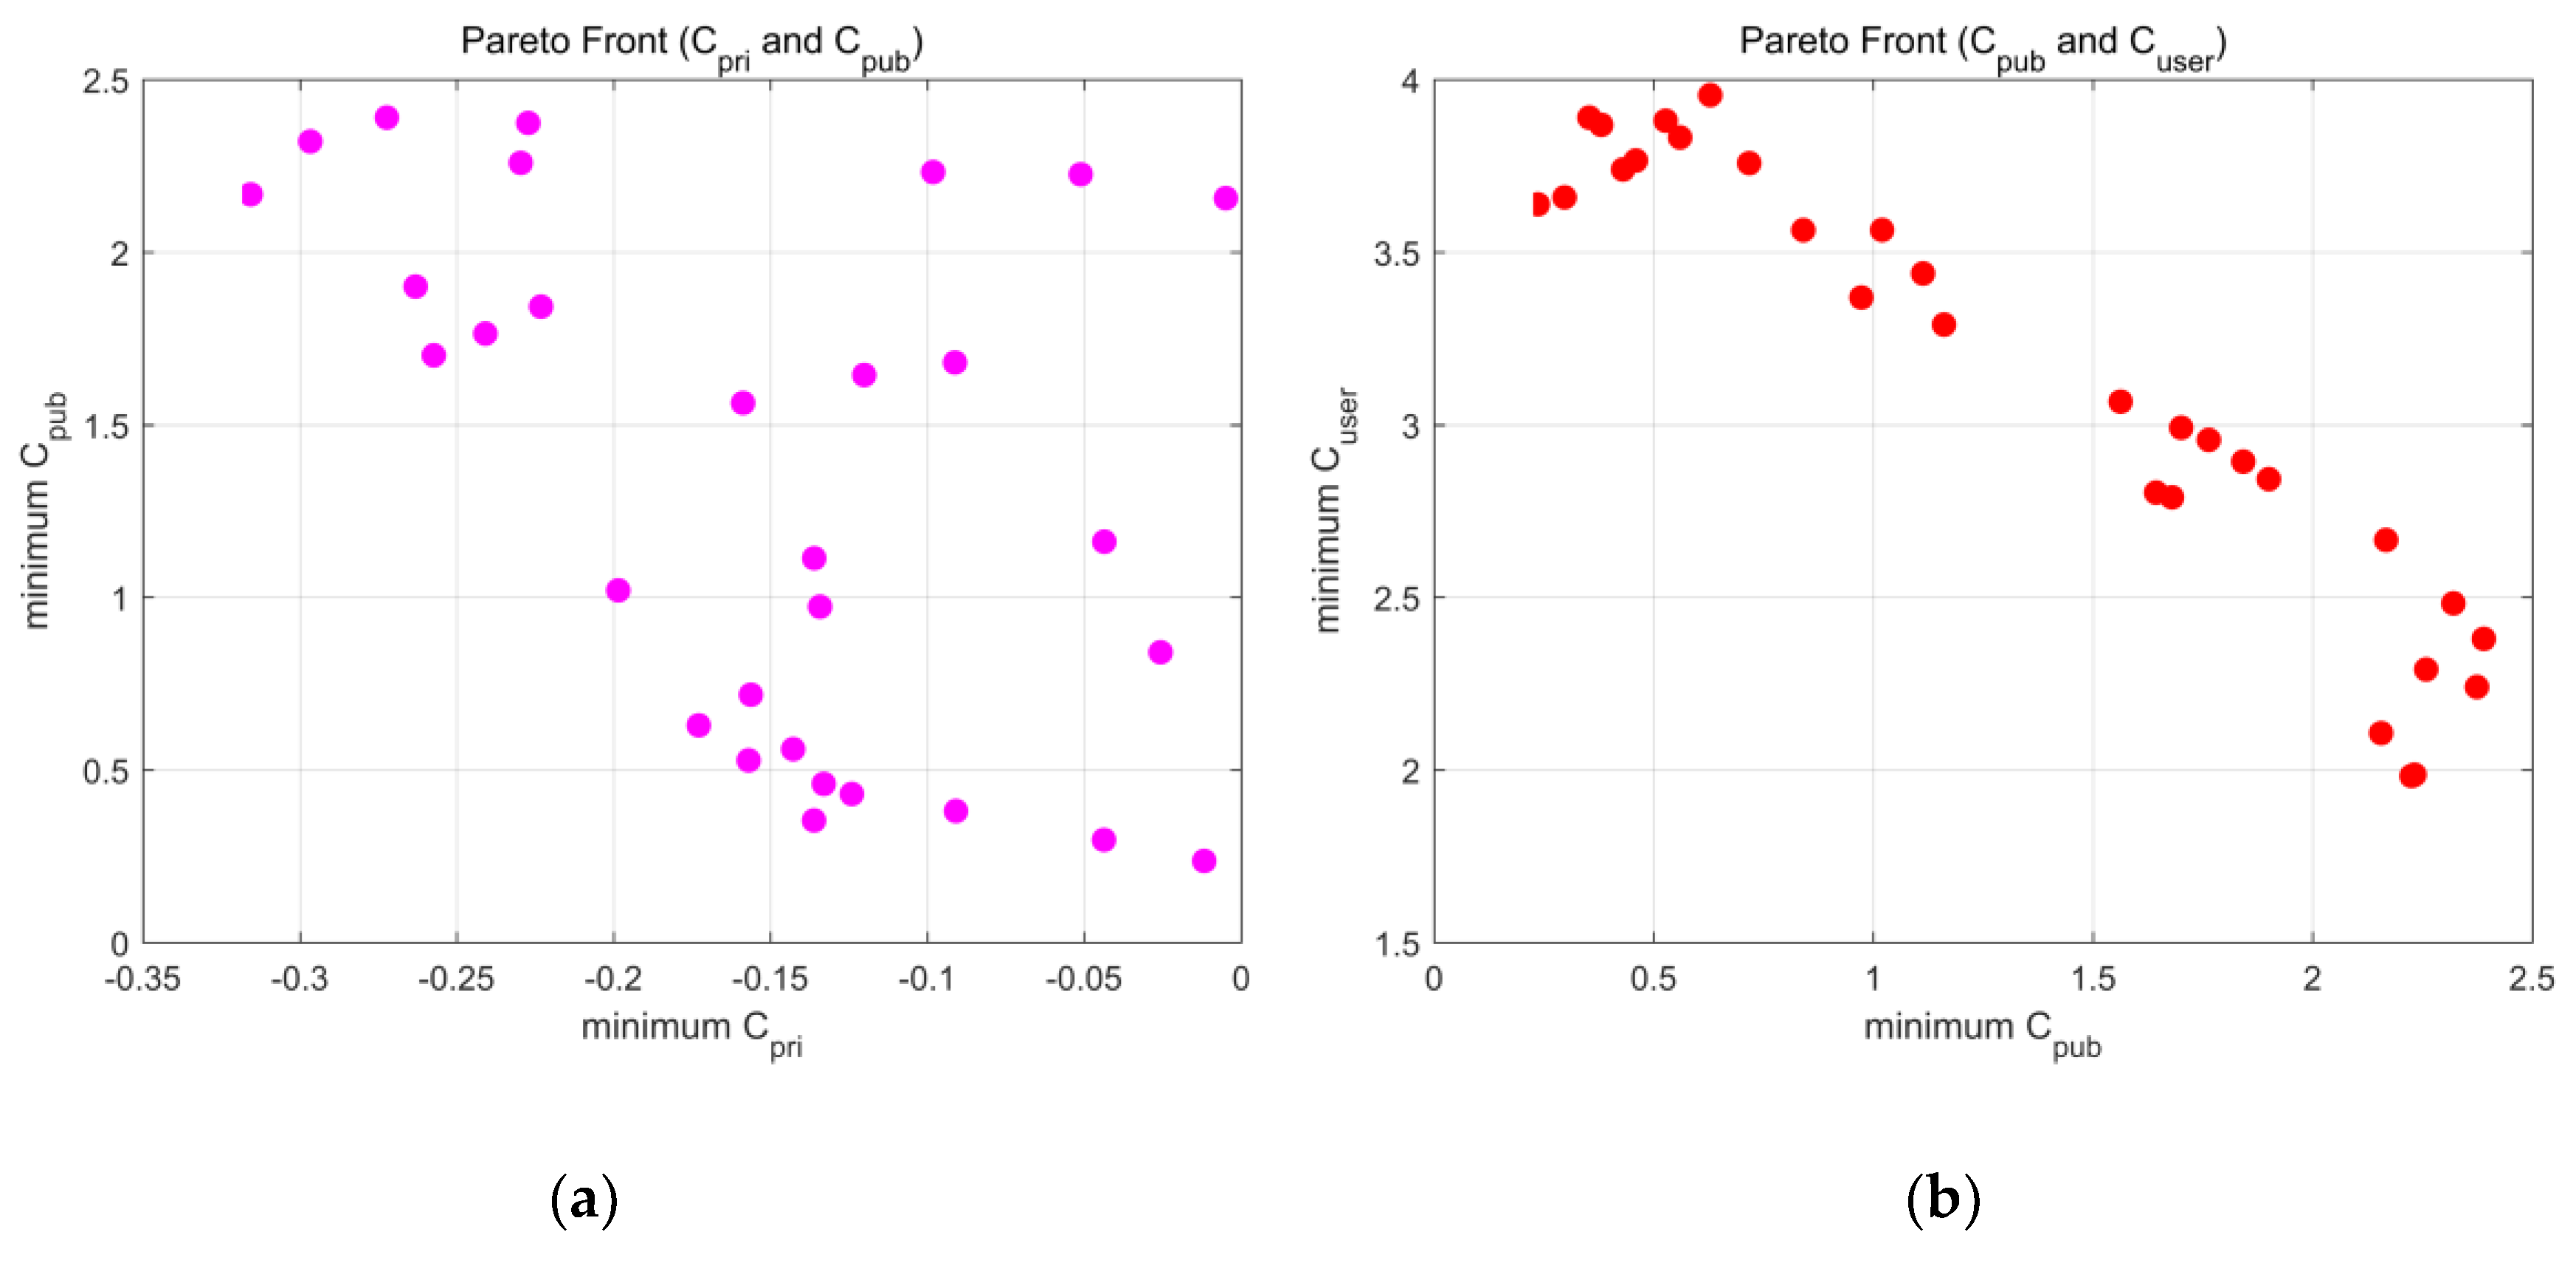
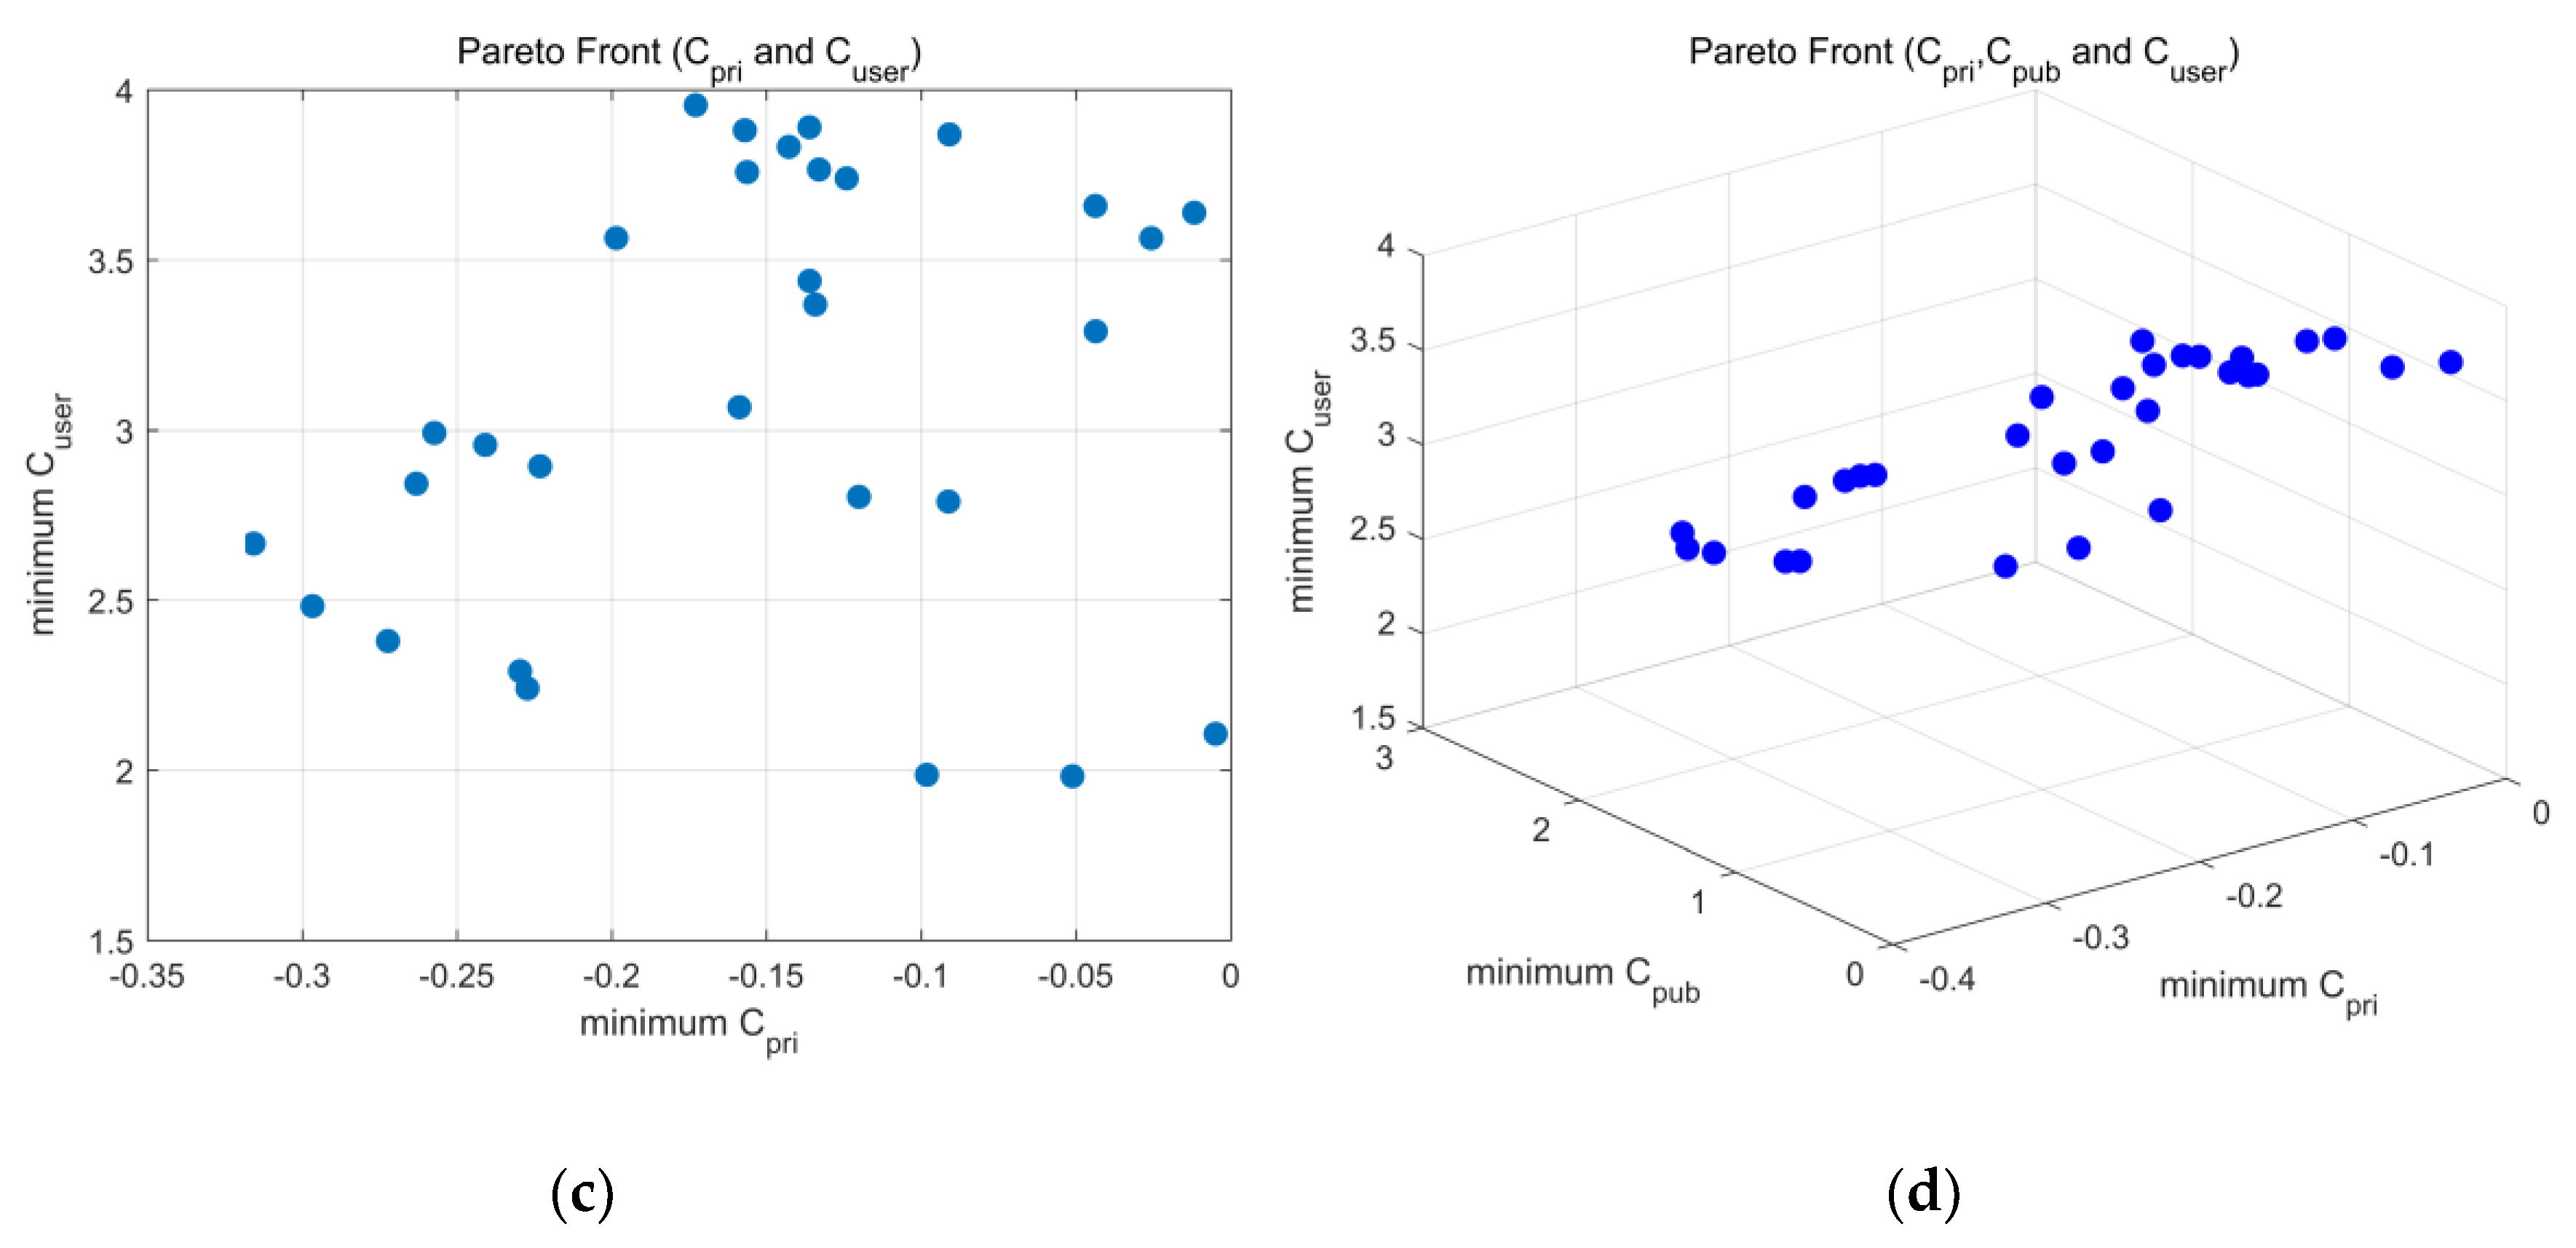
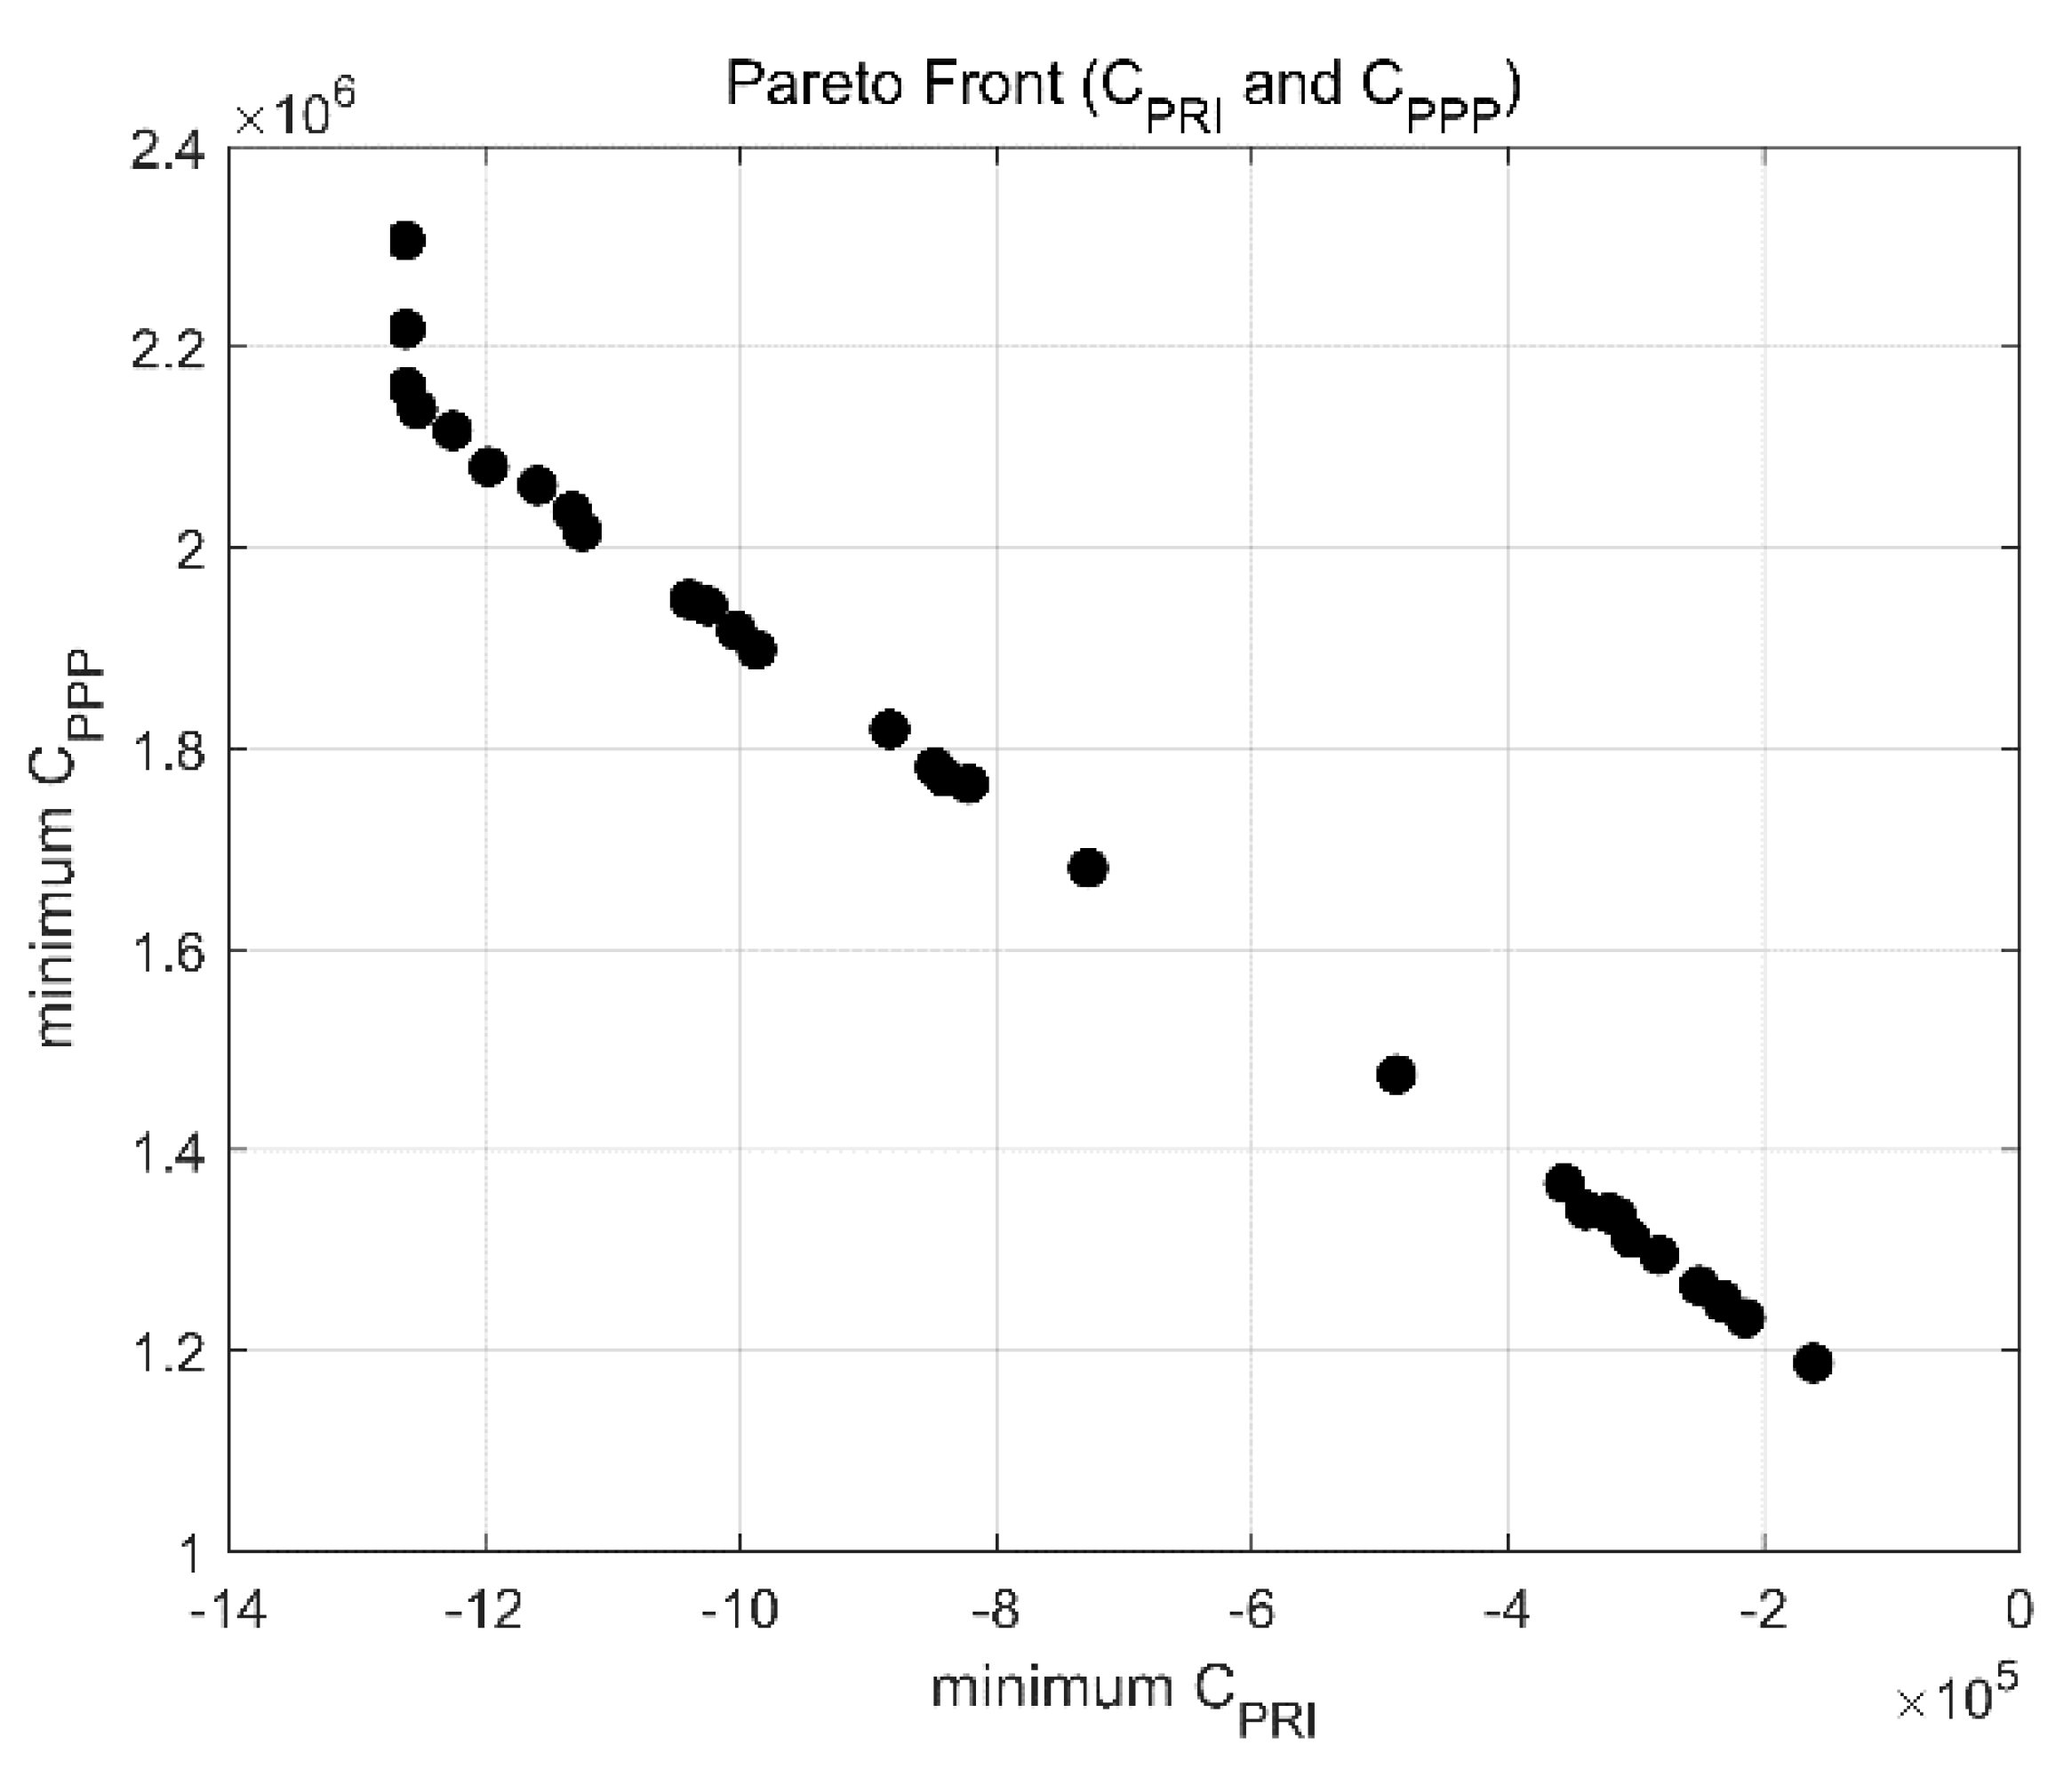
3.4. Pareto Front
3.5. The Minimum Weighted Result
4. Discussion
5. Conclusions
Author Contributions
Funding
Acknowledgments
Conflicts of Interest
Appendix A

| Case 1 | Case 2 | Case 3 | Case 4 | Case 5 | Case 6 | Case 7 | Case 8 | Case 9 | Case 10 | |
|---|---|---|---|---|---|---|---|---|---|---|
| Integration | 0.1 | 0.15 | 0.15 | 0.15 | 0.17 | 0.17 | 0.15 | 0.15 | 0.15 | 0.15 |
| Risk Allocation | 0.2 | 0.15 | 0.17 | 0.15 | 0.18 | 0.18 | 0.15 | 0.15 | 0.15 | 0.1 |
| Performance | 0.1 | 0.15 | 0.12 | 0.15 | 0.12 | 0.12 | 0.15 | 0.15 | 0.15 | 0.15 |
| Competitiveness | 0.2 | 0.1 | 0.13 | 0.15 | 0.08 | 0.08 | 0.15 | 0.15 | 0.15 | 0.15 |
| Government Competency | 0.1 | 0.1 | 0.13 | 0.05 | 0.13 | 0.13 | 0.05 | 0.05 | 0.1 | 0.1 |
| Bankability | 0.1 | 0.15 | 0.1 | 0.08 | 0.12 | 0.12 | 0 | 0.03 | 0.1 | 0.15 |
| Procurement Potential | 0 | 0 | 0 | 0.1 | 0 | 0 | 0.1 | 0.05 | 0 | 0 |
| Scale | 0 | 0 | 0.04 | 0 | 0.04 | 0.04 | 0.06 | 0.05 | 0.05 | 0.07 |
| Life span | 0 | 0 | 0 | 0 | 0.04 | 0.04 | 0 | 0.05 | 0 | 0 |
| Capital Diversity | 0 | 0 | 0 | 0.07 | 0.04 | 0.04 | 0.07 | 0.03 | 0 | 0 |
| Cost Accuracy | 0.1 | 0 | 0.05 | 0.05 | 0.08 | 0.08 | 0 | 0.03 | 0 | 0 |
| Legal Support | 0 | 0 | 0 | 0 | 0 | 0 | 0.07 | 0.03 | 0 | 0 |
| Income Potential | 0.1 | 0.08 | 0.04 | 0.05 | 0 | 0 | 0.05 | 0.05 | 0.05 | 0.07 |
| Exemplary | 0 | 0.06 | 0.07 | 0 | 0 | 0 | 0 | 0.03 | 0.1 | 0.06 |
| Acceptance | 0 | 0.06 | 0 | 0 | 0 | 0 | 0 | 0 | 0 | 0 |
| Case 11 | Case 12 | Case 13 | Case 14 | Case 15 | Case 16 | Case 17 | Case 18 | Case 19 | |
|---|---|---|---|---|---|---|---|---|---|
| Integration | 0.15 | 0.13 | 0.15 | 0.15 | 0.15 | 0.15 | 0.15 | 0.15 | 0.15 |
| Risk Allocation | 0.15 | 0.15 | 0.2 | 0.2 | 0.15 | 0.15 | 0.15 | 0.15 | 0.15 |
| Performance | 0.15 | 0.12 | 0.1 | 0.1 | 0.15 | 0.15 | 0.15 | 0.15 | 0.15 |
| Competitiveness | 0.1 | 0.13 | 0.1 | 0.1 | 0.1 | 0.15 | 0.15 | 0.15 | 0.15 |
| Government Competency | 0.1 | 0.15 | 0.1 | 0.1 | 0.1 | 0.05 | 0.05 | 0.05 | 0.05 |
| Bankability | 0.15 | 0.12 | 0.15 | 0.15 | 0.15 | 0.15 | 0.1 | 0.04 | 0.1 |
| Procurement Potential | 0 | 0 | 0 | 0 | 0 | 0 | 0.03 | 0.1 | 0.03 |
| Scale | 0.06 | 0.06 | 0 | 0 | 0.04 | 0.05 | 0.03 | 0.06 | 0.03 |
| Life span | 0 | 0 | 0.05 | 0.05 | 0.03 | 0.05 | 0 | 0.04 | 0 |
| Capital Diversity | 0 | 0 | 0 | 0 | 0.04 | 0 | 0.04 | 0.06 | 0.04 |
| Cost Accuracy | 0 | 0.07 | 0.05 | 0.05 | 0.03 | 0.05 | 0.03 | 0 | 0.03 |
| Legal Support | 0 | 0 | 0 | 0 | 0 | 0 | 0.03 | 0 | 0.03 |
| Income Potential | 0.08 | 0.07 | 0.05 | 0.05 | 0.03 | 0.05 | 0.05 | 0.05 | 0.05 |
| Exemplary | 0.06 | 0 | 0.05 | 0.05 | 0.03 | 0 | 0.04 | 0 | 0.04 |
| Acceptance | 0 | 0 | 0 | 0 | 0 | 0 | 0 | 0 | 0 |
| Model 1 | Model 2 | ||||
|---|---|---|---|---|---|
| No. | Cpri | Cpub | Cuser | CPRI | CPUB |
| 1 | −0.01182 | 0.236268 | 3.638375 | −161,293 | 1,187,172 |
| 2 | −0.13615 | 0.353558 | 3.889556 | −1,261,708 | 2,305,979 |
| 3 | −0.05116 | 2.225221 | 1.982355 | −1,196,545 | 2,080,527 |
| 4 | −0.31566 | 2.167159 | 2.665843 | −987,204 | 1,898,145 |
| 5 | −0.04375 | 0.297243 | 3.658421 | −304,068 | 1,311,654 |
| 6 | −0.13424 | 0.972897 | 3.368459 | −1,260,641 | 2,159,870 |
| 7 | −0.0982 | 2.231788 | 1.98632 | −847,846 | 1,781,122 |
| 8 | −0.14278 | 0.560115 | 3.831897 | −821,201 | 1,764,332 |
| 9 | −0.13303 | 0.45965 | 3.765208 | −1,261,407 | 2,217,593 |
| 10 | −0.15699 | 0.527611 | 3.880541 | −1,224,720 | 2,116,505 |
| 11 | −0.12411 | 0.4304 | 3.73927 | −339,572 | 1,339,597 |
| 12 | −0.00492 | 2.1559 | 2.106714 | −281,836 | 1,294,707 |
| 13 | −0.29665 | 2.320473 | 2.482393 | −1,002,835 | 1,917,117 |
| 14 | −0.02571 | 0.840748 | 3.563561 | −321,014 | 1,336,837 |
| 15 | −0.09123 | 1.67997 | 2.789534 | −232,086 | 1,247,415 |
| 16 | −0.2296 | 2.258401 | 2.291057 | −728,035 | 1,680,591 |
| 17 | −0.13609 | 1.113198 | 3.438026 | −314,521 | 1,332,921 |
| 18 | −0.24086 | 1.763577 | 2.955981 | −356,058 | 1,366,419 |
| 19 | −0.19851 | 1.020047 | 3.563972 | −1,025,183 | 1,941,797 |
| 20 | −0.12015 | 1.643778 | 2.803375 | −486,996 | 1,474,725 |
| 21 | −0.26312 | 1.9003 | 2.842046 | −883,049 | 1,818,761 |
| 22 | −0.22314 | 1.842073 | 2.893234 | −1,131,454 | 2,036,124 |
| 23 | −0.22722 | 2.373951 | 2.240217 | −214,515 | 1,231,844 |
| 24 | −0.15876 | 1.562877 | 3.066917 | −1,039,812 | 1,948,281 |
| 25 | −0.15625 | 0.717709 | 3.757613 | −1,158,419 | 2,061,794 |
| 26 | −0.09092 | 0.380833 | 3.868423 | −1,123,306 | 2,016,009 |
| 27 | −0.27229 | 2.38963 | 2.379703 | −232,574 | 1,250,608 |
| 28 | −0.17288 | 0.628949 | 3.954517 | −840,417 | 1,771,252 |
| 29 | −0.2573 | 1.700806 | 2.991098 | −1,252,278 | 2,137,844 |
| 30 | −0.04364 | 1.161033 | 3.289835 | −250,612 | 1,264,479 |
References
- Cruz, C.O.; Marques, R.C. Theoretical considerations on quantitative PPP viability analysis. J. Manag. Eng. 2013, 30, 122–126. [Google Scholar] [CrossRef]
- Asian Development Bank (ADB); Inter-American Development Bank (IDB); World Bank Group; Public-Private Infrastructure Advisory Facility (PPIAF). Public-Private Partnerships: Reference Guide, Version 2.0; World Bank Group: Washington, DC, USA, 2014. [Google Scholar]
- Jiang, D.M.; Zhao, Z.; Management, S.O.; University, Q.T. Research on Investment Risk Management of Expressway PPP Project. Value Eng. 2017, 11, 35–38. [Google Scholar] [CrossRef]
- Jin, X.H. Neurofuzzy Decision Support System for Efficient Risk Allocation in Public-Private Partnership Infrastructure Projects. J. Comput. Civ. Eng. 2010, 24, 525–538. [Google Scholar] [CrossRef]
- Tang, Q. Research on the Risk of the PPP Project Based on the Cumulative Prospect Theory. Value Eng. 2017, 12, 69–71. [Google Scholar] [CrossRef]
- Yin, H.; Li, Y.; Zhao, D. Method of Decision Making of PPP Project Risk Allocation Scheme Based on Cloud Model. Scie. Technol. Manag. Res. 2016, 36, 201–206. [Google Scholar] [CrossRef]
- Song, B.; Fei, X.U. Partner-Selection in Public-Private Partnership Project Based on an Iterative Algorithm for the Multi-Objective Group Decision Problem. J. Syst. Manag. 2011, 20, 690–695. [Google Scholar]
- Xie, J.; Ng, S.T. Multiobjective Bayesian Network Model for Public-Private Partnership Decision Support. J. Constr. Eng. Manag. 2013, 139, 1069–1081. [Google Scholar] [CrossRef]
- Sharafi, A.; Iranmanesh, H.; Amalnick, M.S.; Abdollahzade, M. Financial management of Public Private Partnership projects using artificial intelligence and fuzzy model. Int. J. Energy Stat. 2016, 4, 1650007. [Google Scholar] [CrossRef]
- Xu, Y.; Sun, C.; Skibniewski, M.J.; Chan, A.P.C.; Yeung, J.F.Y.; Cheng, H. System Dynamics (SD)-based concession pricing model for PPP highway projects. Int. J. Proj. Manag. 2012, 30, 240–251. [Google Scholar] [CrossRef]
- Xue, Y.; Guan, H.; Corey, J.; Qin, H.; Han, Y.; Ma, J. Bilevel Programming Model of Private Capital Investment in Urban Public Transportation: Case Study of Jinan City. Math. Probl. Eng. 2015, 2015, 1–12. [Google Scholar] [CrossRef]
- Xue, Y.; Guan, H.; Corey, J.; Wei, H.; Yan, H. Quantifying a financially sustainable strategy of public transport: Private capital investment considering passenger value. Sustainability 2017, 9, 269. [Google Scholar] [CrossRef]
- Liu, J.; Yu, X.; Cheah, C.Y.J. Evaluation of restrictive competition in PPP projects using real option approach. Int. J. Proj. Manag. 2014, 32, 473–481. [Google Scholar] [CrossRef]
- Hu, Z.; Fan, X.F.; Dong, Q. Decision-making model of public-private partnerships projects’ paradigm choice—Based upon the SVM classified theory. J. Xi’an Univ. Archit. Technol. 2012, 4, 568–571. [Google Scholar] [CrossRef]
- Wang, Z.; Rangaiah, G.P. Application and Analysis of Methods for Selecting an Optimal Solution from the Pareto-Optimal Front obtained by Multi-Objective Optimization. Ind. Eng. Chem. Res. 2016, 56. [Google Scholar] [CrossRef]
- CPPPC China Public Private Partnerships Center—Project Database. Available online: http://www.cpppc.org:8086/pppcentral/map/toPPPList.do (accessed on 10 May 2018).
- Committee, G.M.T. Guiyang Rail Transit Line 2 Public Financing Feasiblity Report. Available online: http://www.cpppc.org:8083/efmisweb/ppp/projectLibrary/getProjInfoNational.do?projId=d4f66527c80b408f8a7729af7590fe1f (accessed on 10 May 2018).


| Year | i | Cci | Coi | Criski | Qi | Di | Ei | Bi |
|---|---|---|---|---|---|---|---|---|
| 2017 | 1 | 158,658.8 | 0 | 10,744.6 | 0 | 0 | 0 | 518.7 |
| 2018 | 2 | 237,988.2 | 0 | 16,116.89 | 0 | 0 | 0 | 534.26 |
| 2019 | 3 | 237,988.2 | 0 | 16,116.89 | 0 | 0 | 0 | 550.29 |
| 2020 | 4 | 158,658.8 | 0 | 10,744.6 | 0 | 0 | 0 | 566.79 |
| 2021 | 5 | 0 | 20,946.09 | 8629.92 | 9256.4 | 1933.07 | 3725.7 | 612.14 |
| 2022 | 6 | 0 | 20,946.09 | 8592.37 | 10,285.71 | 1933.07 | 4139.99 | 661.11 |
| 2023 | 7 | 0 | 20,946.09 | 8550.68 | 11,428.14 | 1933.07 | 4599.83 | 714 |
| 2024 | 8 | 0 | 20,624.54 | 8455.49 | 13,099.86 | 1933.07 | 5272.69 | 771.12 |
| 2025 | 9 | 0 | 20,624.54 | 8385.71 | 15,012.46 | 1933.07 | 6042.51 | 832.81 |
| 2026 | 10 | 0 | 20,624.54 | 8305.68 | 17,206.11 | 1933.07 | 6925.46 | 899.43 |
| 2027 | 11 | 0 | 20,624.54 | 8213.92 | 19,720.94 | 1933.07 | 7937.68 | 971.39 |
| 2028 | 12 | 0 | 20,624.54 | 8108.85 | 22,600.8 | 1933.07 | 9096.82 | 1049.1 |
| 2029 | 13 | 0 | 20,624.54 | 7988.34 | 25,904.06 | 1933.07 | 10,426.38 | 1133.03 |
| 2030 | 14 | 0 | 20,624.54 | 8224.58 | 19,428.94 | 1933.07 | 7820.15 | 1223.67 |
| 2031 | 15 | 0 | 22,433.06 | 8375.35 | 20,491.11 | 2188.19 | 8247.67 | 1260.38 |
| 2032 | 16 | 0 | 22,433.06 | 8334.6 | 21,608 | 2188.19 | 8697.22 | 1298.19 |
| 2033 | 17 | 0 | 22,433.06 | 8291.59 | 22,786.94 | 2188.19 | 9171.75 | 1337.13 |
| 2034 | 18 | 0 | 22,701.02 | 8277.53 | 24,031.6 | 2188.19 | 9672.72 | 1377.25 |
| 2035 | 19 | 0 | 22,701.02 | 8229.59 | 25,345.6 | 2188.19 | 10,201.6 | 1418.57 |
| 2036 | 20 | 0 | 22,701.02 | 8179.12 | 26,728.94 | 2188.19 | 10,758.4 | 1461.12 |
| 2037 | 21 | 0 | 22,701.02 | 8125.85 | 28,188.94 | 2188.19 | 11,346.05 | 1504.96 |
| 2038 | 22 | 0 | 22,701.02 | 8069.79 | 29,725.6 | 2188.19 | 11,964.55 | 1550.11 |
| 2039 | 23 | 0 | 22,701.02 | 8010.53 | 31,349.86 | 2188.19 | 12,618.31 | 1596.61 |
| 2040 | 24 | 0 | 22,701.02 | 8044.35 | 30,422.74 | 2188.19 | 12,245.16 | 1644.51 |
| 2041 | 25 | 0 | 22,701.02 | 8017.05 | 31,171 | 2188.19 | 12,546.33 | 1693.84 |
| 2042 | 26 | 0 | 22,701.02 | 7989.09 | 31,937.51 | 2188.19 | 12,854.84 | 1744.66 |
| 2043 | 27 | 0 | 22,701.02 | 7960.46 | 32,722.26 | 2188.19 | 13,170.71 | 1797 |
| 2044 | 28 | 0 | 22,701.02 | 7931.16 | 33,525.26 | 2188.19 | 13,493.91 | 1850.91 |
| 2045 | 29 | 0 | 22,701.02 | 7901.06 | 34,350.14 | 2188.19 | 13,825.94 | 1906.43 |
| I1 | I2 | I3 | I4 | I5 | I6 | I7 | I8 | I9 | I10 | I11 | I12 | I13 | I14 | I15 | |
|---|---|---|---|---|---|---|---|---|---|---|---|---|---|---|---|
| I1 | 1.000 | −0.164 | 0.286 | −0.678 | −0.015 | 0.057 | 0.067 | 0.236 | 0.370 | 0.336 | −0.258 | 0.053 | −0.783 | 0.117 | 0.027 |
| I2 | −0.164 | 1.000 | −0.841 | −0.255 | 0.300 | 0.112 | −0.238 | −0.637 | 0.414 | −0.146 | 0.667 | −0.187 | −0.179 | −0.162 | −0.095 |
| I3 | 0.286 | −0.841 | 1.000 | 0.219 | −0.591 | −0.279 | 0.429 | 0.484 | −0.296 | 0.388 | −0.739 | 0.337 | 0.055 | 0.114 | 0.171 |
| I4 | −0.678 | −0.255 | 0.219 | 1.000 | −0.522 | −0.489 | 0.383 | 0.072 | −0.395 | 0.066 | −0.061 | 0.302 | 0.558 | −0.119 | −0.230 |
| I5 | −0.015 | 0.300 | −0.591 | −0.522 | 1.000 | 0.514 | −0.701 | 0.008 | −0.053 | −0.522 | 0.419 | −0.552 | −0.142 | 0.166 | 0.080 |
| I6 | 0.057 | 0.112 | −0.279 | −0.489 | 0.514 | 1.000 | −0.821 | −0.256 | 0.096 | −0.662 | 0.180 | −0.694 | 0.063 | 0.336 | 0.224 |
| I7 | 0.067 | −0.238 | 0.429 | 0.383 | −0.701 | −0.821 | 1.000 | 0.099 | −0.069 | 0.817 | −0.318 | 0.543 | −0.026 | −0.420 | −0.139 |
| I8 | 0.236 | −0.637 | 0.484 | 0.072 | 0.008 | −0.256 | 0.099 | 1.000 | −0.073 | 0.096 | −0.393 | 0.217 | −0.143 | −0.031 | −0.356 |
| I9 | 0.370 | 0.414 | −0.296 | −0.395 | −0.053 | 0.096 | −0.069 | −0.073 | 1.000 | 0.035 | 0.264 | −0.190 | −0.502 | −0.274 | −0.197 |
| I10 | 0.336 | −0.146 | 0.388 | 0.066 | −0.522 | −0.662 | 0.817 | 0.096 | 0.035 | 1.000 | −0.096 | 0.517 | −0.456 | −0.545 | −0.207 |
| I11 | −0.258 | 0.667 | −0.739 | −0.061 | 0.419 | 0.180 | −0.318 | −0.393 | 0.264 | −0.096 | 1.000 | −0.301 | −0.249 | −0.511 | −0.282 |
| I12 | 0.053 | −0.187 | 0.337 | 0.302 | −0.552 | −0.694 | 0.543 | 0.217 | −0.190 | 0.517 | −0.301 | 1.000 | −0.021 | −0.160 | −0.109 |
| I13 | −0.783 | −0.179 | 0.055 | 0.558 | −0.142 | 0.063 | −0.026 | −0.143 | −0.502 | −0.456 | −0.249 | −0.021 | 1.000 | 0.212 | 0.289 |
| I14 | 0.117 | −0.162 | 0.114 | −0.119 | 0.166 | 0.336 | −0.420 | −0.031 | −0.274 | −0.545 | −0.511 | −0.160 | 0.212 | 1.000 | 0.226 |
| I15 | 0.027 | −0.095 | 0.171 | −0.230 | 0.080 | 0.224 | −0.139 | −0.356 | −0.197 | −0.207 | −0.282 | −0.109 | 0.289 | 0.226 | 1.000 |
| Component | ||||
|---|---|---|---|---|
| 1 | 2 | 3 | 4 | |
| Procurement Potential | 0.841 | 0.292 | −0.203 | 0.207 |
| Government Competency | −0.777 | −0.040 | 0.159 | −0.294 |
| Bankability | −0.773 | −0.289 | 0.308 | 0.018 |
| Performance | 0.762 | −0.315 | 0.434 | 0.033 |
| Legal Support | 0.712 | 0.136 | −0.126 | 0.087 |
| Capital Diversity | 0.700 | 0.588 | 0.015 | 0.165 |
| Risk Allocation | −0.604 | 0.485 | −0.423 | 0.265 |
| Cost Accuracy | −0.572 | 0.508 | −0.492 | −0.173 |
| Income Potential | 0.051 | −0.789 | −0.511 | 0.083 |
| Life span | −0.258 | 0.647 | 0.177 | 0.062 |
| Exemplary | −0.205 | −0.628 | 0.397 | 0.105 |
| Integration | 0.097 | 0.434 | 0.853 | 0.135 |
| Competitiveness | 0.500 | −0.338 | −0.679 | −0.218 |
| Scale | 0.426 | −0.078 | 0.417 | −0.732 |
| Acceptance | −0.126 | −0.423 | 0.190 | 0.716 |
| Component | ||||
|---|---|---|---|---|
| 1 | 2 | 3 | 4 | |
| Procurement Potential | 0.928 | 0.120 | −0.026 | −0.017 |
| Capital Diversity | 0.858 | 0.021 | 0.340 | −0.110 |
| Bankability | −0.841 | −0.052 | 0.127 | 0.226 |
| Government Competency | −0.785 | −0.244 | 0.142 | −0.149 |
| Legal Support | 0.706 | 0.205 | −0.074 | −0.062 |
| Exemplary | −0.505 | 0.480 | −0.088 | 0.336 |
| Risk Allocation | −0.122 | −0.890 | 0.120 | 0.164 |
| Cost Accuracy | −0.182 | −0.868 | 0.022 | −0.266 |
| Performance | 0.396 | 0.842 | 0.022 | 0.048 |
| Integration | 0.053 | 0.319 | 0.916 | 0.044 |
| Income Potential | −0.110 | 0.141 | −0.888 | 0.268 |
| Competitiveness | 0.412 | 0.060 | −0.806 | −0.220 |
| Lifespan | 0.012 | −0.398 | 0.596 | −0.084 |
| Acceptance | −0.139 | 0.190 | −0.029 | 0.829 |
| Scale | 0.015 | 0.630 | 0.102 | −0.700 |
| Extraction Sums of Squared Loadings | Rotation Sums of Squared Loadings | ||||
|---|---|---|---|---|---|
| Total | % of Variance | Cumulative % | Total | % of Variance | Cumulative % |
| 4.747 | 31.647 | 31.647 | 4.082 | 27.211 | 27.211 |
| 3.053 | 20.354 | 52.001 | 3.323 | 22.150 | 49.361 |
| 2.636 | 17.577 | 69.578 | 2.825 | 18.834 | 68.195 |
| 1.402 | 9.345 | 78.923 | 1.609 | 10.728 | 78.923 |
| of | Cpri | Cpub | Cuser |
|---|---|---|---|
| entropy value | 0.909389 | 0.934844 | 0.909388 |
| entropy weight | 0.367772 | 0.264454 | 0.367774 |
| of | CPRI | CPUB |
|---|---|---|
| entropy value | 0.909389 | 0.934844 |
| entropy weight | 0.58171 | 0.41829 |
| a | b | p | n | Cpri | Cpub | Cuser | Weighted Sum |
|---|---|---|---|---|---|---|---|
| 0.487381 | 17.64895 | 1.98632 | 12.38446 | -0.0982 | 2.231788 | 1.98632 | 1.284605 |
| a | b | rg | CPRI | CPUB | Weighted Sum |
|---|---|---|---|---|---|
| 0.487917 | 89.15039 | 0.079737 | −1,252,278 | 2,137,844 | 165,775.7 |
| −20% | −10% | 0 | 10% | 20% | |
|---|---|---|---|---|---|
| when rcap changed | 3804.055 | −7795.05 | −19,394.1 | −30,993.3 | −42,592.4 |
| when rg changed | −19,394.1 | −19,394.1 | −19,394.1 | −19,394.1 | −19,394.1 |
| when rp changed | −59,664.9 | −38,980.1 | −19394.1 | −835.989 | 16,760.19 |
| when Coy changed | −56,123.2 | −37,758.7 | −19,394.1 | −1029.62 | 17,334.92 |
| when Crisky changed | −27,075.6 | −23,234.9 | −19,394.1 | −15,553.4 | −11,712.7 |
| when Qi changed | 70,829.07 | 25,717.46 | −19,394.1 | −64,505.8 | −109,617 |
© 2018 by the authors. Licensee MDPI, Basel, Switzerland. This article is an open access article distributed under the terms and conditions of the Creative Commons Attribution (CC BY) license (http://creativecommons.org/licenses/by/4.0/).
Share and Cite
Liu, F.; Liu, J.; Yan, X. Quantifying the Decision-Making of PPPs in China by the Entropy-Weighted Pareto Front: A URT Case from Guizhou. Sustainability 2018, 10, 1753. https://doi.org/10.3390/su10061753
Liu F, Liu J, Yan X. Quantifying the Decision-Making of PPPs in China by the Entropy-Weighted Pareto Front: A URT Case from Guizhou. Sustainability. 2018; 10(6):1753. https://doi.org/10.3390/su10061753
Chicago/Turabian StyleLiu, Feiran, Jun Liu, and Xuedong Yan. 2018. "Quantifying the Decision-Making of PPPs in China by the Entropy-Weighted Pareto Front: A URT Case from Guizhou" Sustainability 10, no. 6: 1753. https://doi.org/10.3390/su10061753
APA StyleLiu, F., Liu, J., & Yan, X. (2018). Quantifying the Decision-Making of PPPs in China by the Entropy-Weighted Pareto Front: A URT Case from Guizhou. Sustainability, 10(6), 1753. https://doi.org/10.3390/su10061753