Article

Designing Business Solutions for Plastic Waste Management to Enhance Circular Transitions in Kenya

1
Climate Change Economics Research Centre, Szent István University, Páter Károly 1, 2100 Godollo, Hungary
2
Doctoral School of Management and Business Administration, Szent István University, Páter Károly 1, 2100 Godollo, Hungary
*
Author to whom correspondence should be addressed.
Sustainability 2018, 10(5), 1664; https://doi.org/10.3390/su10051664
Submission received: 23 March 2018 / Revised: 1 May 2018 / Accepted: 9 May 2018 / Published: 21 May 2018
(This article belongs to the Special Issue Circular Economy—Sustainable Energy and Waste Policies)

Abstract

:
Least-developed countries face many challenges regarding their plastic waste management systems. In 2017, Kenya imposed a selective ban targeting manufacturers and consumers of plastic carrier bags. However, this selectivity does not avoid the continuous use of other plastic products. The present paper states that circular priorities, which have been defined to advanced economies, would not be entirely valid for the rest of the world. While high-income countries face only the impacts of their own consumption, developing nations must endure the externalities of these developed economies. Thus, the focus of the least developed part of the world must not be on reducing its relatively normal (or even low) consumption, but to manage its surplus material flow. According to the employed circular evaluation methodology (CEV—Circular Economic Value), the circularity level in Kenya’s plastic material flow stands on a rather low stage with 32.72%. This result outlines the linear deficiencies of the plastic waste management system and urges the prevention of further material leakage (such as energy use). Through the Business Model Canvas (BMC) approach this study offers a holistic business solution which can improve the system’s sustainability.

1. Introduction

Kenya, a country in East Africa, is one of the most interesting cases regarding plastic waste. In 2017, the country enacted strict regulation banning the manufacture and use of plastic carrier bags almost entirely. Only specific cases (e.g., hospitals, duty-free shops) fall out of this law’s umbrella. This endeavor is considered a significant achievement, as the same initiative had already failed two times in the past decade. This was due to challenges the country faced managing its plastic waste. Plastic waste management continues to be a source of concern for most countries, with some formulating varying strategies to address the same problem.
Poor disposal of plastic carrier bag waste is responsible for seasonal flooding and mosquito breeding, as it blocks drainage and waterways [1]. Moreover, studies show animals may die if they consume plastic materials [2]. East African Union member states have equally been faced with the plastic menace. In 2008, Rwanda took the bold step of banning plastic bags. In developing economies (like Kenya), the growth rate of most cities exceeds 4% annually. The concern that the 20–40% of municipal (county) revenues spent in managing the waste is not sufficient to handle the rising trend of the generated waste [3]. The Kenyan National Environment Management Authority (NEMA) states that about 100 million bags were being offered by supermarkets alone, with only half of these ending up in the solid waste stream. Thus, plastic bags pose a major challenge to solid waste management systems in the country. Before the ban, the country produced roughly 4000 tons of plastic waste monthly. Orset et al. [4] analyzed the purchasing behavior of plastic-packed products as a response to environmental policies by regulators. The study found that consumers are normally not aware of the true environmental impacts of their consumption. However, their attitude can be influenced by providing them the sufficient information. The behavior change can be tracked down through their willingness to pay (WTP). Wagner [5] finds local governments increasingly adopting a variety of measures specifically intended to reduce the store-level consumption of single-use shopping bags through bans, fees, and taxes, minimum product design of bag requirements, consumer education, and retailer take-back programs. Due to the success of these policy measures, local governments in the U.S. started to enact similar regulations regarding other single-use plastic products. However, to counter these rising plastic banning trends, lobby groups influenced 11 different states to prohibit local governments from single-use plastic bag regulation. Martinho et al. [6] state that tax imposition led to the reduction of plastics. Though the role of hypermarkets and supermarkets in providing alternatives by distributing reusable plastic bags was equally important in Portugal. Similar tax impositions are documented by other researchers [7], whereas the European Union came up with regulations that govern the life cycle of plastic bags [8]. Willis et al. [9] analyzed the success of the ban in the Australian marine sector. The result of Kenya’s newly-introduced regulation cannot be judged yet, but it is not the focus of the present paper. Plastic waste comes in many different forms and banning the use of plastic carrier bags solves only one aspect of the much broader problem of plastic waste management. Thus, this research is concerned with the global deficiencies of Kenya’s plastic waste stream.
There exist studies on strategies formulated by countries to address the plastic waste problem. Poor waste management in developing countries is assumed to be related to both weak economic status and socio-economic factors attributable to a lack of proper environmental legislation, financial management, and administrative capacities [10]. Rudolph et al. [11] give a general perspective on how to increase the potential of plastic waste recycling. The current trends indicate a new perspective which recognizes this material as a resource rather than a burden. A circular approach to plastic production and use is preferable to the linear economy; the outcome being a cleaner environment and job opportunities, among others [12]. There is a consensus that mankind is passing by a period of severe natural resource depletion. A linear economy being characterized by the product being discarded at the end of its use is one of the main causes of natural depletion [13]. Kobza and Schuster [14] define the circular economy as pertaining to life-cycle planning that aims at preserving materials or products in the value chain for as long as possible. Thus, a product turns into a raw material at the end of its life phase. The circular approach has been practiced in various sectors of the economy [15]. To ease the transition to a circular economy, it is necessary to establish factors that can trigger and sustain such progress [16]. Concerns regarding environmental degradation, resource scarcity, and price volatility due to traditional linear production methods are what brought about an increased focus on a transition to a circular economy in Europe [17]. Kenya, through circular businesses (consisting e.g., ‘remanufacturing’, ‘upcycling’, or other circular features in their business model), can address several environmental concerns resulting from plastic waste. However, the transition from a linear to a circular economy is not easy. Urbinati et al. [18] state that despite the desire for a circular economy, many governments, policy-makers, and businesses lack a framework of explaining how companies could adapt this new economic paradigm.
The essential problem of Kenya’s current plastic waste management is that the country receives a considerable amount of this material and leaves it without further utilization after the useful lifespan. The Kenyan office of the Japan International Co-operation Agency (JICA) reports that only one third of the generated plastic waste is suitable for recycling because of the material composition of the products. Nevertheless, the real problem lies in the utilization patterns. According to JICA, only a minor share of the recyclable plastic amount goes to actual recycling. This is due to a low collection rate and to inaccurate waste management mechanisms (e.g., the mixture of different polymers and the appearance of contamination). Most of the collected plastic waste ends up at dumping sites or is incinerated, despite being recyclable [19]. Therefore, this paper aims at developing a circular model, a departure from the traditional linear approach of plastic waste management in Kenya. The next section will elaborate on the differences of linear and circular perspectives and provide an overview of theoretical sustainability concepts applied to least-developed countries. The methodology section describes a circular evaluation tool to analyze the level of circularity in Kenya’s plastic material flow. The results will introduce the key findings regarding the potential development paths of the system. Finally, the study discusses an offered business solution to enhance circular transitions in Kenya and summarizes the main conclusions of the research.

2. Theoretical Background

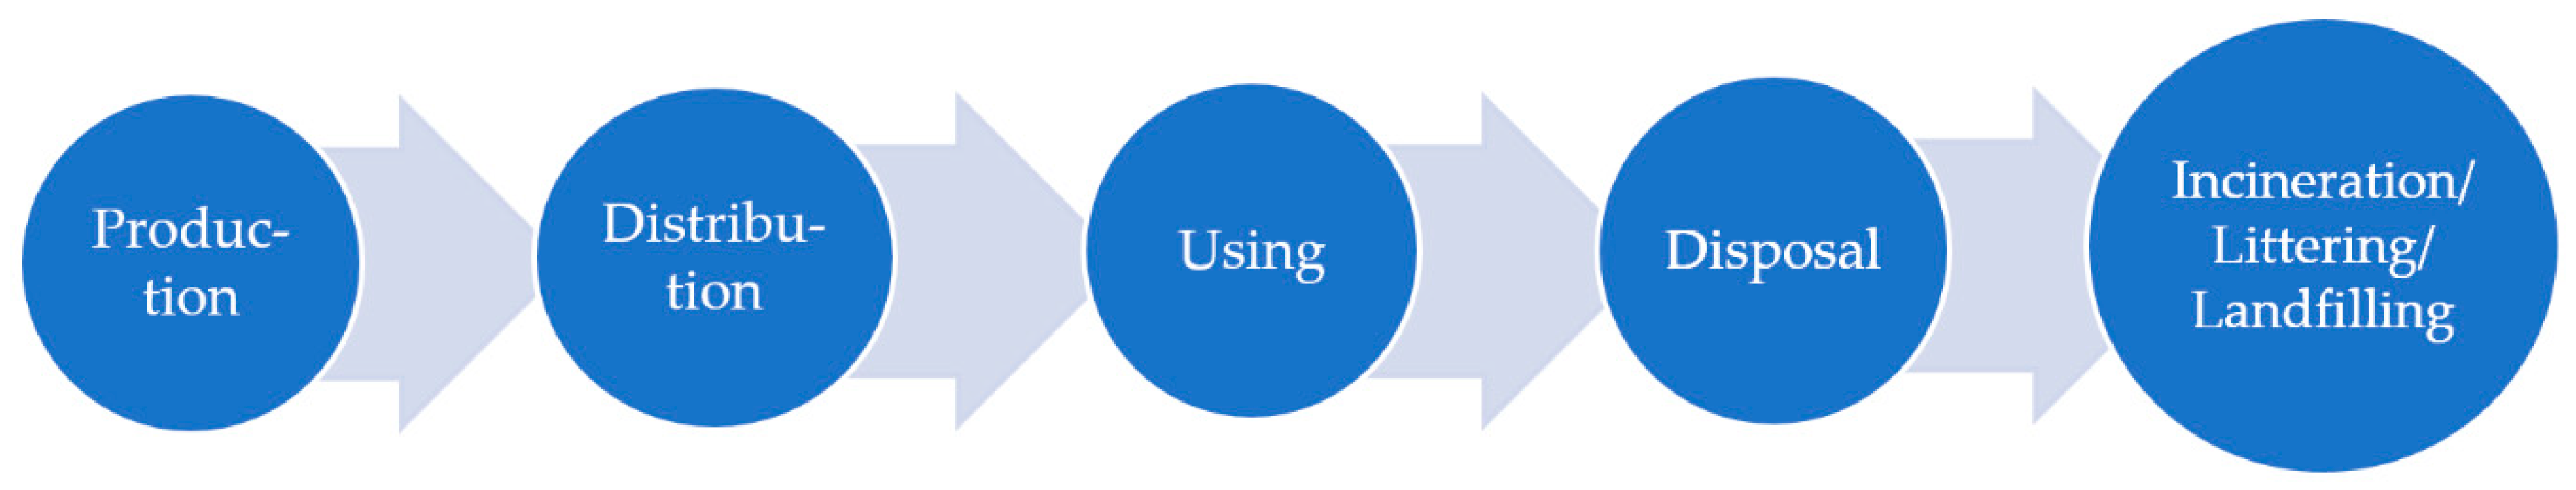
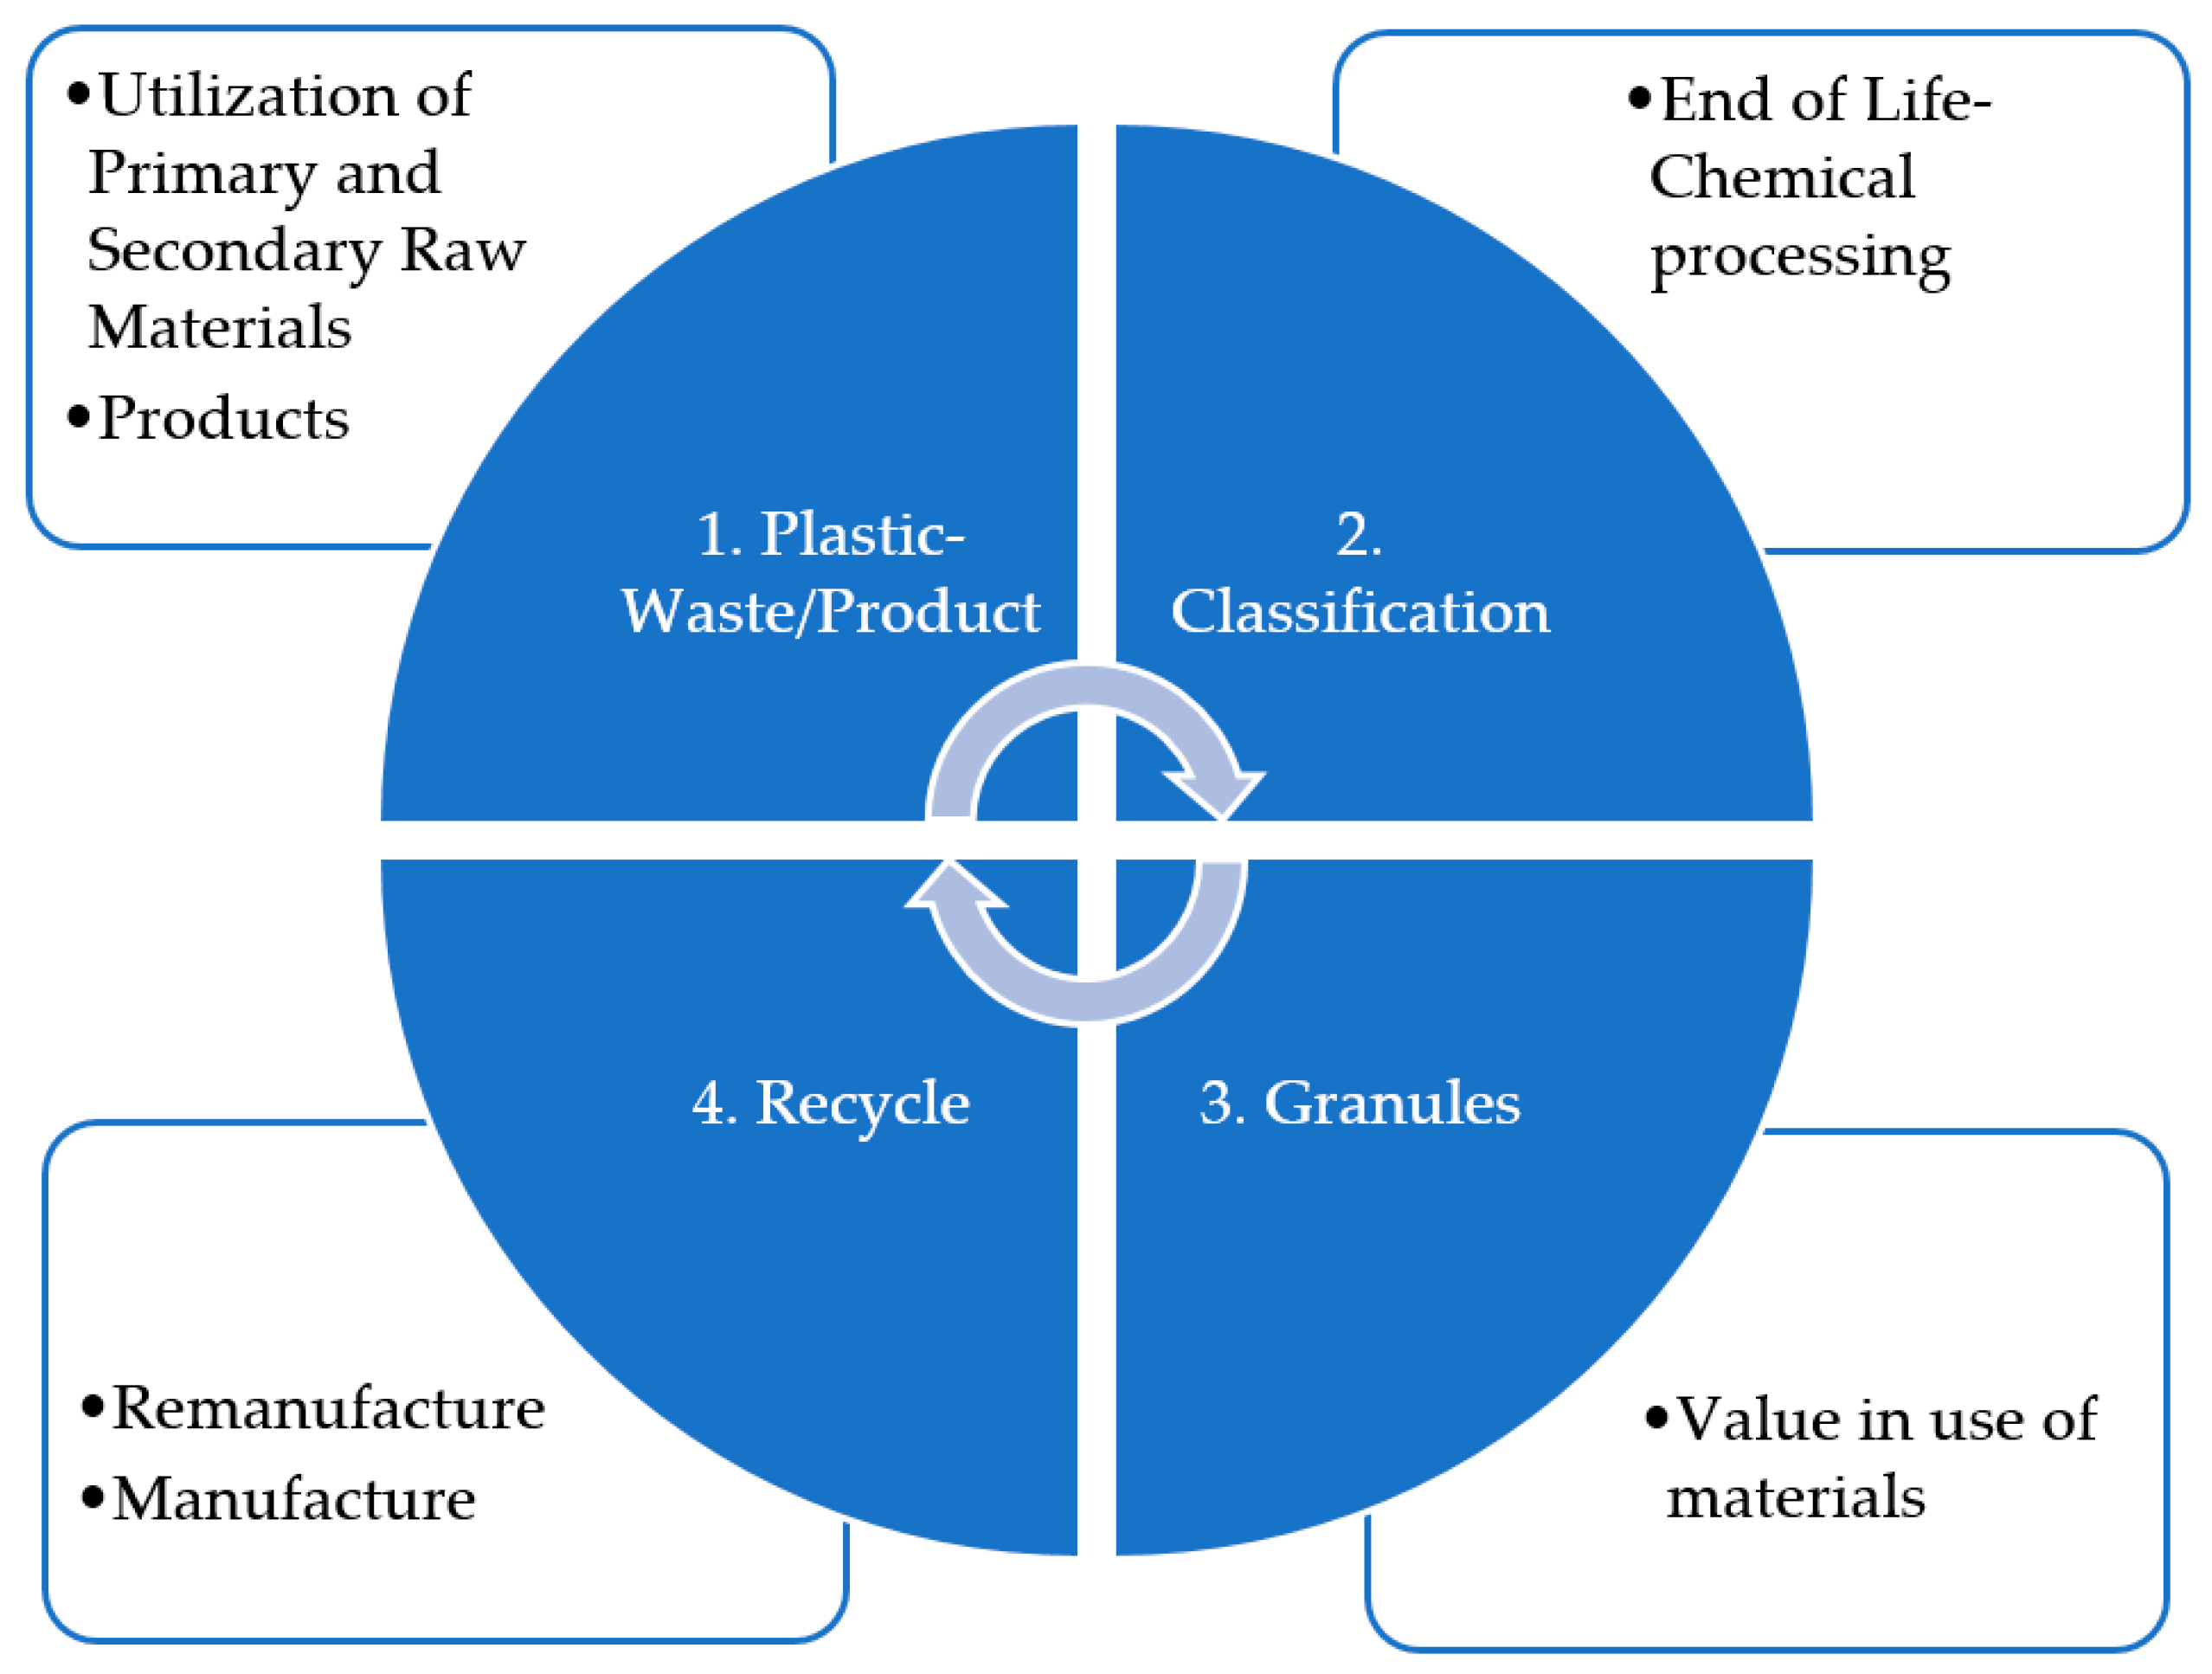
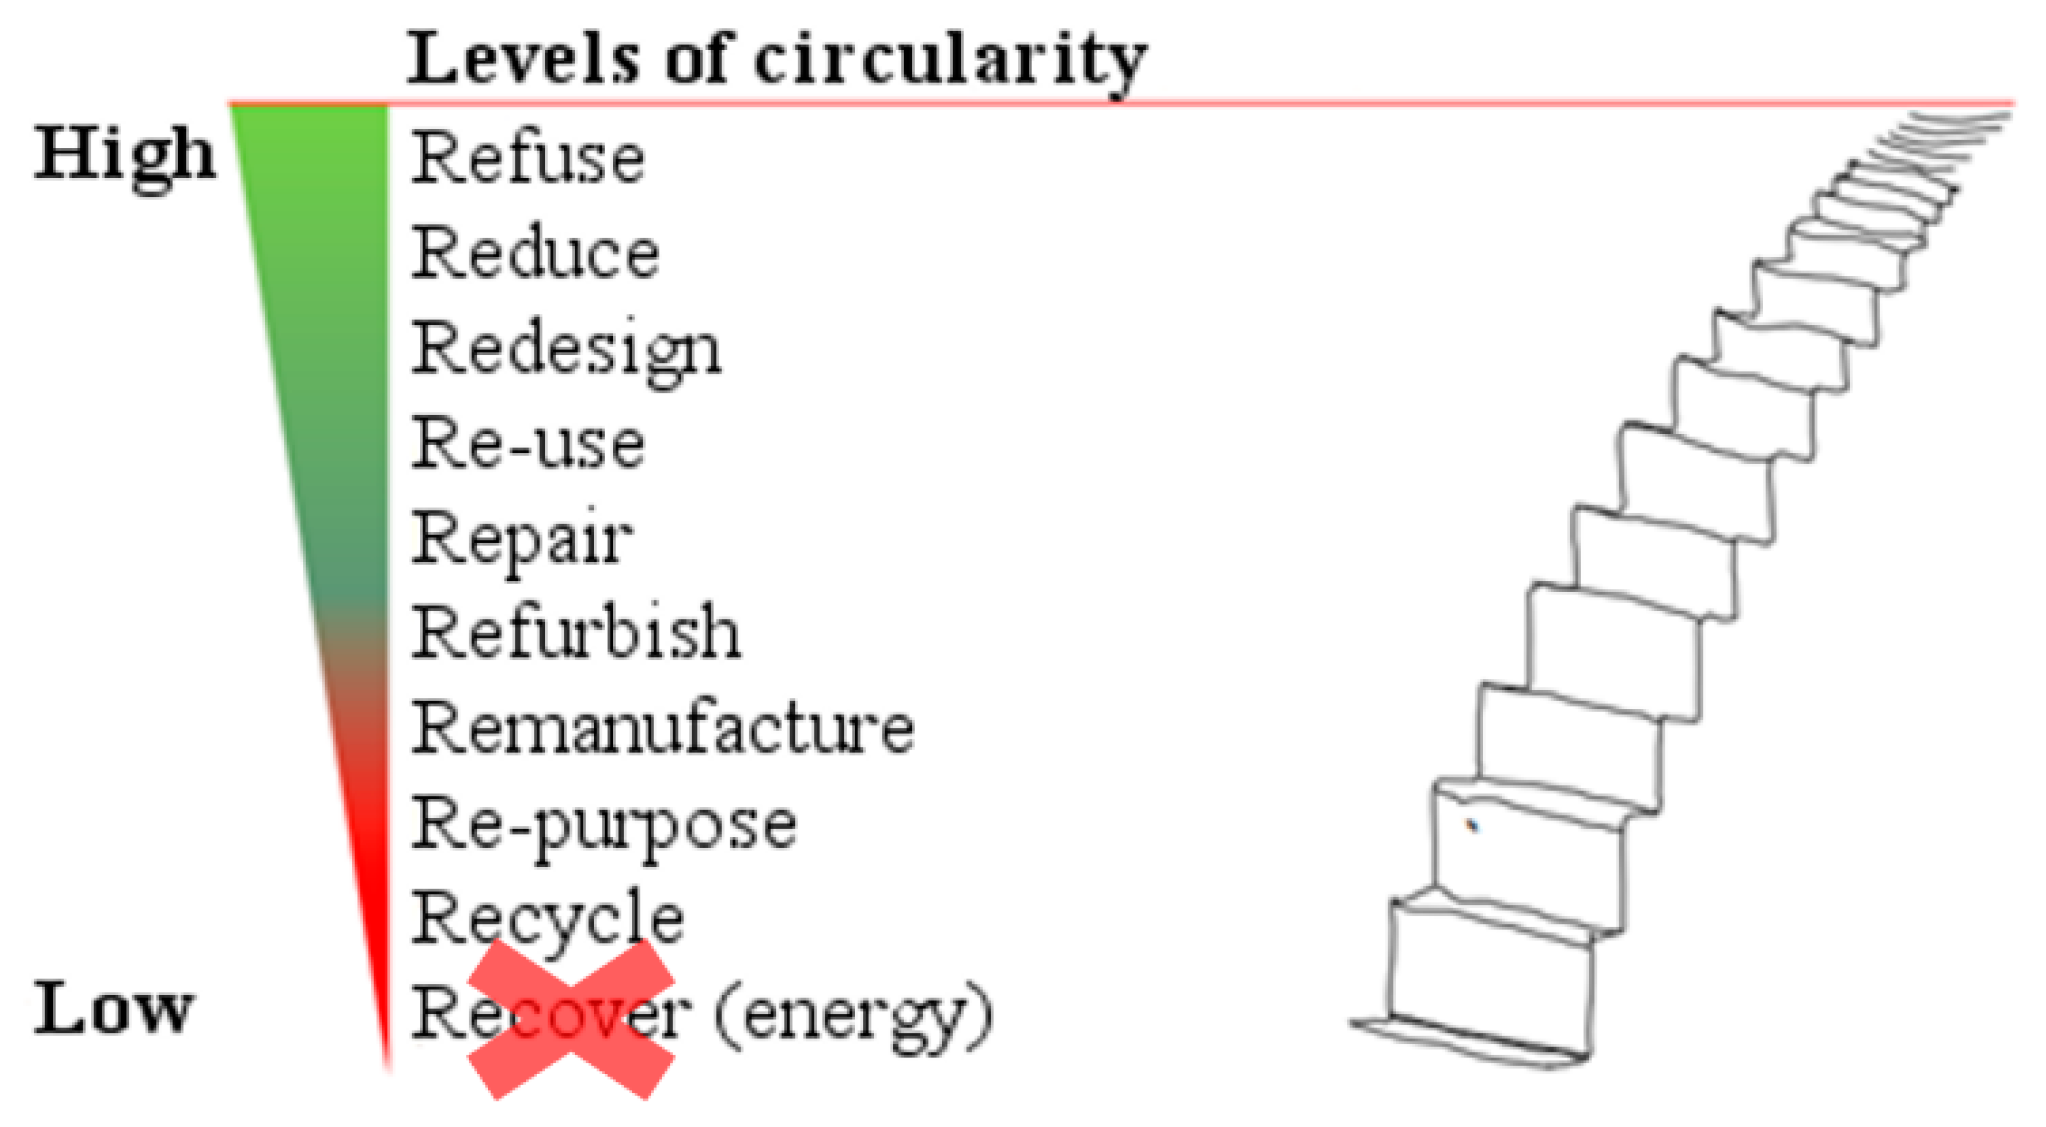
2.1. Linear to Circular Approach

George et al. [20] presented a theoretical model incorporating the concept of circular economic activities by constructing a circular economy model with two types of economic resources: a polluting input, and a recyclable input. There are countries that have made an effort to implement circular economy models in the plastic packaging industry, such as Austria [21], the United States [6], Sweden [22], Finland [23], and the Netherlands [24]. Figure 1 below outlines the linear nature of plastic management in Kenya. The greatest challenge in managing plastic waste in the country has been the end-of-life-cycle stage. Such waste from the public and industrial/private sector is managed formally by county environmental departments through the collection, disposal in designated places, and incineration. Therefore, linear business models result in many environmental challenges as resources become depleted, ending up as waste and emission since they rely on virgin resources [5].
There exist various studies and models on how to prolong life-span, re-use, and recycle plastic products, more so at the end-of-life stage [25]. The circular economy is frequently defined as a combination of reduction, reuse, and recycling activities [26]. The reduction is mostly achieved through policy measures as bans, restrictions, and taxes. Researchers have analyzed how plastic waste can be recycled and used in the production of other products as a raw material. Circular business models based on remanufacturing and reusing bring about significant cost savings associated with radical reductions in the environmental impact; the models are a potential way for industries or companies to profitably achieve a significant increase in resource productivity [27]. Thompson et al. [28] find that given the declining reserves of fossil fuels, and finite capacity for disposal of waste to landfill, linear use of hydrocarbons, through packaging and other short-lived applications of plastic, will not prove sustainable in the long run [29].
The other problem is that certain types of plastics are unsuitable for recycling. For example, composite plastics with multiple layers of different resin codes (e.g., beverage containers) are highly problematic in recycling. They have little use and must be down-cycled to recover energy from plastic waste. This process emits a considerable amount of air pollutants and deprives plastic from its future utilization possibilities as a material. Therefore, it is below recycling on the waste management hierarchy. Additionally, food contamination is a significant issue. These aspects leave refuse-derived fuel as the only possible solution. Nwabue et al. [1] demonstrate how recovery of the plastic wastes into refuse-derived fuel by incorporation in the production of bio-coal briquettes can be considered as part of waste management options, especially in developing countries. Similar studies were conducted by Gayo [30], and Lu and Chiang [31]. Likewise, there are studies on how plastic waste can be converted into fuel capable of running machines [32,33,34]. Rinaldini et al. [35] studied the performance of machines running on these oils. Its use in the construction industry has been equally extensively studied [36,37,38], whereas other researchers analyzed the significance of recycled plastic components in construction [39,40,41], and others examined how such waste could produce plastic cement [42]. The illustrated examples are an indicator to the fact that plastic waste can be recycled for various desired outcomes.
The model (Figure 2) starts with recycled plastic waste as a source of raw material. The recycled waste is collected by both public and private solid waste handlers across towns, and placed at selected locations for the next process. The collection and transportation of segregated plastic is the most difficult and expensive factor of the process. This is due to the segmented nature of classification. The waste is mostly sorted into two categories: one, more than 95% pure and segregated plastic waste that can be recycled physically; and two, less than 95% pure non-segregated plastic waste that has reached its end of product life that can be recycled chemically. In chemical recycling products, such as industrial diesel, petrochemical products, and lubricants, are manufactured. The other category of more than 95% pure and sorted waste, through a process, produces granules that are secondary virgin raw materials. The 95% pureness is essential for certain types of plastic wastes (e.g., HDPE, PE, PP) to be suitable for remolding [43]. It is important to stress that a plastic recycling system would face structural deficiencies even within circular circumstances. There would be collection losses and materials unsuitable for recycling anyway. As going back to the figure, at the third stage granules are physically recycled back to plastic products where the process ends, but begins again. The recycled granules can be used to remanufacture the same type of product. This enables the product to have multiple life cycles [17]. Similarly, part of the recycled waste can be used to create other products different from those remanufactured, such as roofing tiles [44]. There may be some shortcomings in the initial implementation, but the authors believe the model to be beneficial to the country. It must be stressed that in between these stages are many other related processes, such as transportation.
Sharuddin et al. [45] note drawbacks attributable to some recycling methods, namely, high labor costs for the separation process, and water contamination that reduces the sustainability of the process. Such challenges require a concerted effort by the government and other players. As illustrated by various studies quoted above, recycled plastic waste can manufacture various products, such as oil, cement, or construction materials, such as tiles, or even in the automobile industry [46]. In Kenya, the circular economy in the plastic industry has begun taking shape. For example, Alternative Energy Solutions (AES), a company that deals with producing synthetic oil from plastic waste first on the African continent, although South Africa is test running the same. The technology used by the company can convert all types of plastic, including thin-gauge plastic waste that is below 30 microns, which other industries cannot recycle. This company has a capacity to handle 16 tons per day. There are other many small-scale recyclers located in major towns, albeit with minimal impact. Though this research focuses on the recycling of plastic, the recovery of materials and energy from used products is not the top priority of the circular economy. The concept prefers to avoid mass material flows instead of further utilizing them by employing additional energy and production facilities. However, this paper emphasizes that considering the initial nature of circular transitions, the development of well-functioning recycling capacities is essential. The reason being that least-developed nations have a special role in global markets. The following section introduces the preferred hierarchy of activities in the circular economy and argues for the importance of the ones which appear insignificant in western civilization.

2.2. Priorities in a Circular Economy

Cramer [47] developed a concept known as the ‘Ladder of Circularity’, an expanded toolset of waste management and prevention with higher levels of ‘R’ given priority, as in Figure 3 below. The hierarchy has been defined by two major aspects: the first being the ‘function before the material’ policy, which aims at lengthening the product life for as long as possible; the second priority is the minimization of the used energy, that is, at the effective end of a product’s life cycle, where it can be used for other purposes with the least possible energy requirement.
The refusal has the highest priority on the ladder; this applies to both consumers and recyclers of plastic waste. For example, in Japan, recyclers refuse to use plastic wastes containing PVC/D in significant quantities [48]. However, the shortcoming of this approach is its narrow view, focusing only on nature by way of waste elimination. Moreover, the attitude of consumers is of greater importance at higher levels of circular priorities whereas, at a lower level, production becomes more relevant [49]. Similarly, there are various ways of reintroducing a product in the market, such as repair, refurbish, reuse, and repurpose [47]. Recycling and recovery are the least-prioritized levels with minimum importance in circularity. Recycling allows the use of secondary raw materials, while recovery is more energy-dependent on combustion technology, with negative environmental impact [50]. The logic of the hierarchy is clearly based on the principle of minimizing the material and energy flow per action. However, the conclusions of the ladder seem to be narrowed down to the most developed nations of western civilization. Fogarassy et al. [49] state that due to different business environments, the interpretation of the listed priorities may vary as well. A classic example of re-use business models is a second-hand business that functions well in Western Europe. The same case highly differs in Visegrad Group countries in Central Europe. The region serves as a landing destination for surplus products (e.g., clothes) from western countries. Many products sold in these markets have never been used in their original country. Therefore, unused foreign products end up in local second-hand stores. This phenomenon contributes to a linear material flow rather than to the life-extension of used goods.
This example proves that the mechanisms of global market flows can be easily deceitful regarding the recognition of linear and circular actions. By moving towards nations with a lower income level, a similar pattern rises. The least-developed world receives a massive amount of products (e.g., second-hand goods, electronics) from advanced economies in the form of donation. However, these products tend to be near the end of their lifecycle or no longer functioning [51]. This is a movement which seems to cover the deficiencies of the consumer attitude in developed countries instead of truly serving circular priorities. Thus, the top circular preference of a wealthy economy must be to decrease consumption, but the poorly-prioritized recycling and recovering activities turn out to be essential in developing regions. Europe has also been struggling with recycling plastic waste, but its post-consumer waste streams are more expensive to sort due to relatively high labor costs and the cost of virgin plastic is still too cheap to justify greater plastic recycling and sorting efforts. For a deeper elaboration on this pattern, a different environmental concept must be employed.

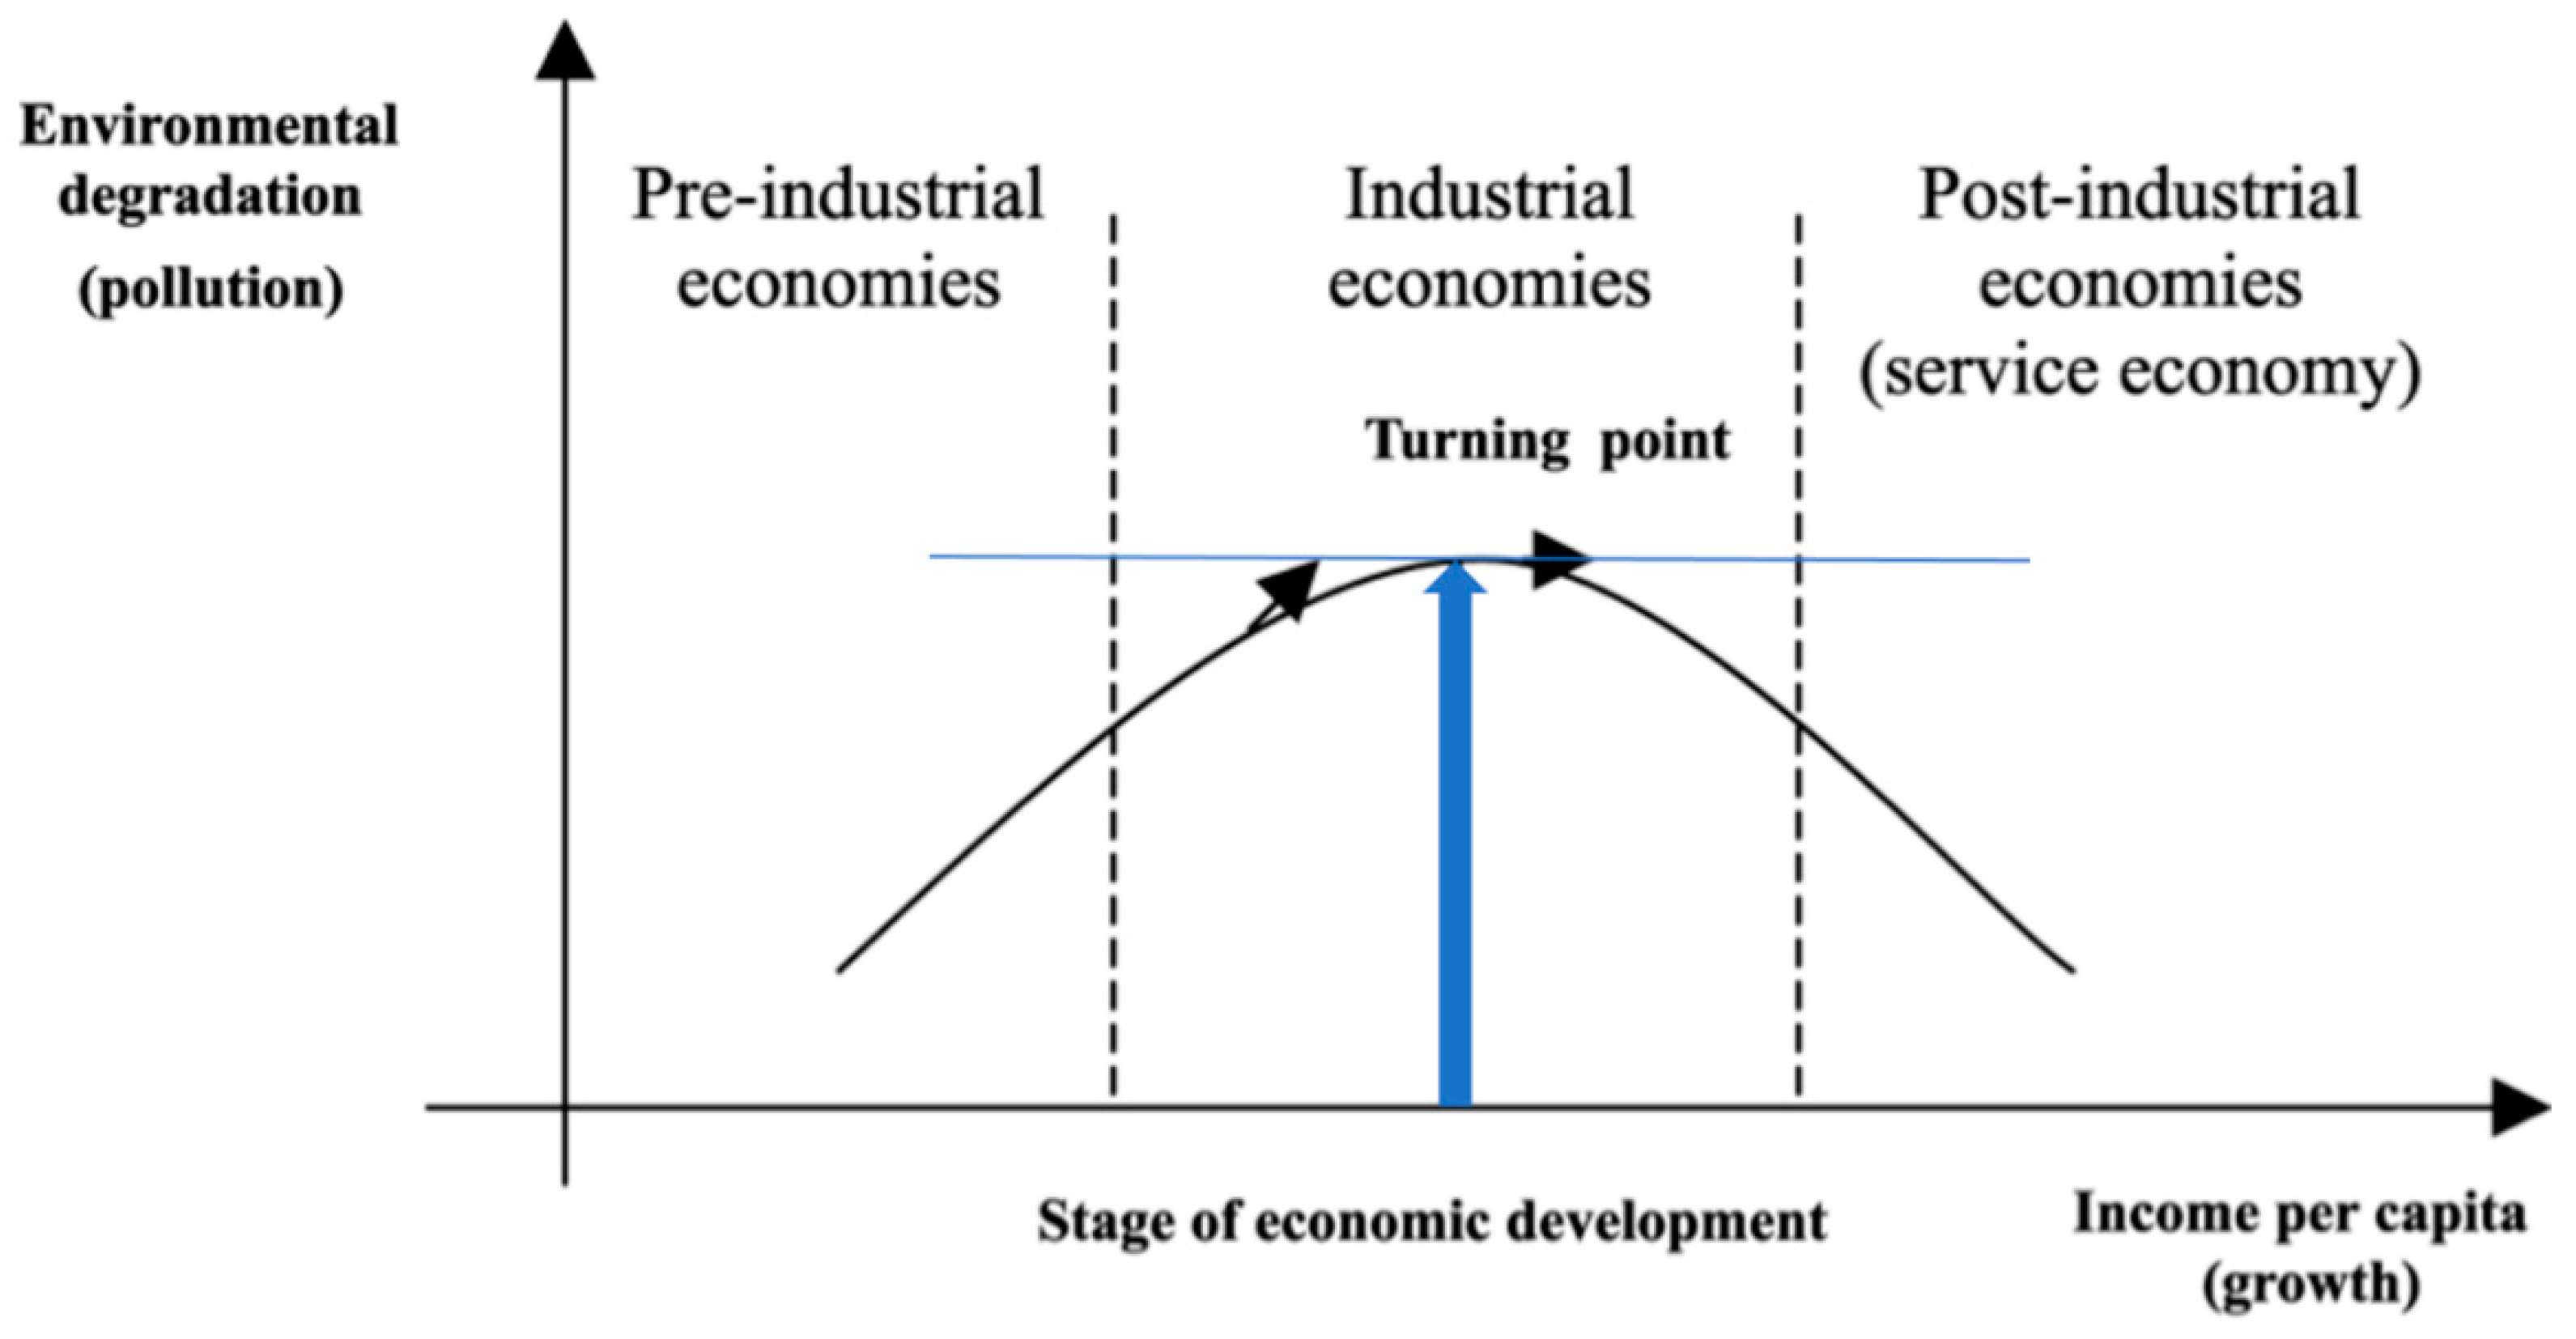
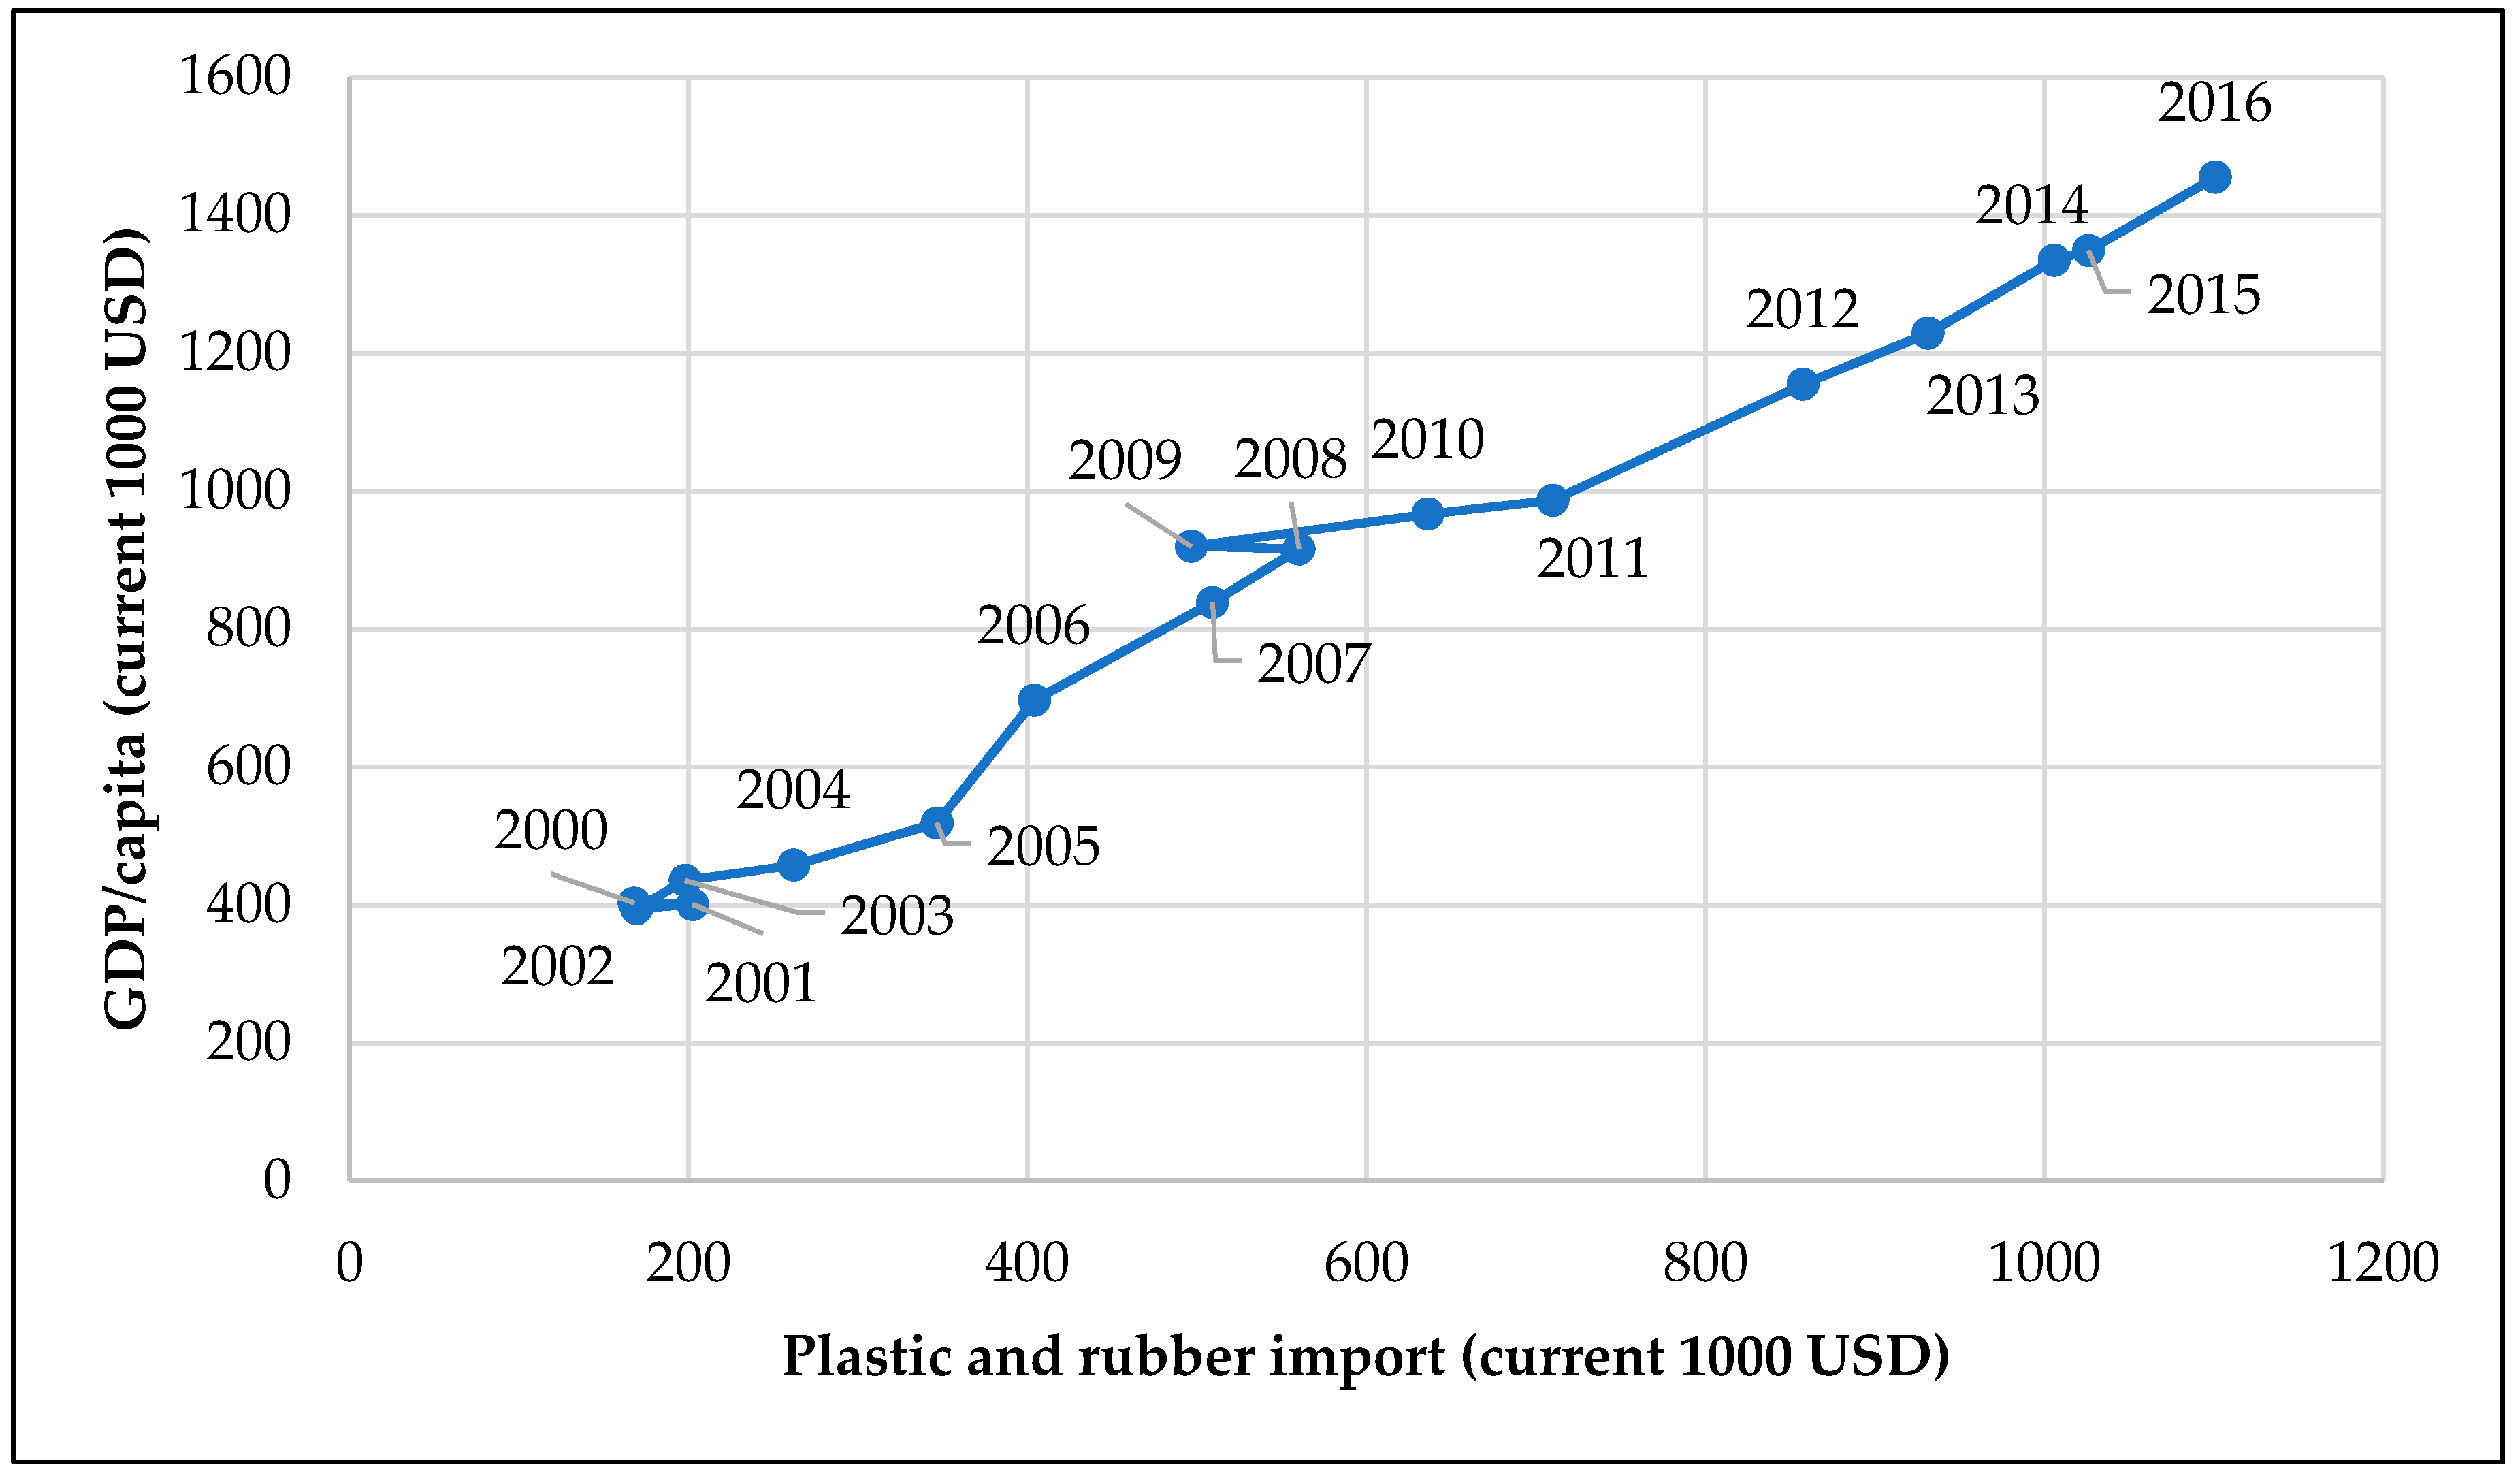
2.3. Environmental Kuznets Curve Functioning in Developing Economies

Economist Simon Kuznets developed the Kuznets curve graph in the 1950s and 1960s. The original Kuznets curve assumed a hypothesized relationship between various parameters of economic inequality and income per capita. At early stages of economic growth, inequality increases, however, beyond some level of income per capita (depending on different parameters) the trend reverses, such that at high-income levels economic growth leads to economic equality between urban and rural territories. The Kuznets curve has been modified and improved on over time. In the early 1990s, the same theory was applied on the relationship between environmental issues and the same effect of economic growth [52]. Due to similarities in logic with its predecessor, this modified concept has been labeled as the ‘Environmental Kuznets Curve’ (EKC). The logic of the curve is the assumption that after a certain development level, policymakers would be forced to implement new, stricter environmental policies. This stems from the society’s emerging need for a clean environment in addition to economic growth. Technological change comes along with the development of a nation. At a higher income level, the theory expects more capital to be invested in R and D activities. This aspect then contributes to the implementation of green technologies [53]. Thus, the environmental curve highlights two main indicators which lead to the turning point (Figure 4): policy-making and technological change.
Researchers have attempted to hypothesize the inverse U curve. For example, Suri and Chapman [54] note of the curve being explained in terms of structural changes in the composition of economic output and increased environmental regulation at higher income levels. For Andreoni and Levinson [55] pollution is about externalities, whose appropriate internalization requires relatively advanced institutions for collective decision-making that may only be implementable in developed economies. Other studies suggest that pollution stops increasing, but decreases with improved income for with economic growth, some constraints become non-binding. However, there are authors who have questioned the Kuznets curve hypothesis. Stern [56] argues that the EKC’s logic fails to follow the mechanism of globalization. Once a developed country introduces strict environmental regulations, manufacturers decide to outsource their production to developing nations. Therefore, the pollution might seem to decrease, but it is not due to true technological development, but rather to outsourced productions.
Developing economies continue to face a delicate trade-off between economic growth and environmental degradation. The situation is worsened by some developed nations keen on exploiting weak environmental policies of least-developed nations. Suri and Chapman [54] attribute the inverse U mechanism as being facilitated by advanced economies exporting their pollution-intensive production processes to less-developed countries by outsourcing. They further quantified the impact of the actual movement of pollutant goods between countries. Emerging economies, such as those in sub-Saharan Africa, India, Indonesia, and China, among others growing their per capita GDP are associated with increasing pollution [57]. Kenya, an emerging economy, has faced a similar trade-off between economic growth and environmental protection. According to Al-Mulali et al. [58], the hypothesis of the curve is valid in Kenya. The researchers investigated the air pollution levels in the country between 1980 and 2012. Their analysis demonstrates technological change as being an essential tool to achieve both short and long-term results. They also found that, despite its “low-income” recognition, the continuous GDP growth from the early 2000s has earned Kenya ninth position on the list of Africa’s most developed nations.
This perspective becomes rather important in the case of the current study. It seems that previous studies already recognized Kenya as a country near a turning point on the EKC. Another weakness in EKC theory is that it does not function equally in all kinds of pollutions/pollutants. The more harmful the pollutant is, the sooner action will take place. As the present analysis focuses only on plastic waste pollution, it is important to note the country’s current stand on plastic. Unfortunately, the country (as most of them in the least-developed world) lacks an appropriate inventory on plastic. The presence of such material can only be inferred from its international trade characteristics. A total of 80% of the local plastic industry’s raw materials comes from imports, thus, most of the plastic has external origins [59]. Equally, World Bank stores data regarding the monetary value of the global plastic and rubber material flow. Figure 5 employs this data as a substitute for the quantity of plastic found in Kenya. The figure does not go into deep methodological detail, but uses the initial logic of the EKC. It illustrates the relationship between the economic growth of the country and the import intensity of plastic and rubber.
After 2003, both aspects show a mutual growing trend with only one slump period at the time of the economic crisis. In the time interval of 2003–2016, the national economy has grown by 70% and the plastic and rubber imports by 80%. The 2017 plastic bag ban was the third attempt in the past 10 years to introduce such a regulation. Previous initiatives had failed due to the fear of emerging unemployment, lost governmental revenues, and reduced or wasted capital investments. The rigorous regulation implies that Kenya may be reaching its turning point in the case of plastic waste pollution. For least-developed countries, the social demand for a clean environment could be earlier than expected, depending on their level of economic development. This is because such countries shoulder not only the burden of their own consumption waste but also the externalities of the developed world. This might be the answer as to why Al-Mulali et al. [58] found that the EKC’s logic seems to work despite Kenya’s ‘low-income’ stage. However, technological change is more relevant in their case than it was for developed economies. Outsourced production must not be an answer anymore to global environmental issues and, even without this moral aspect, the question arises: would it even be possible to move forward with the production? The developing countries have been used as dumping sites for plastic waste and other polluting externalities from the developed world. Thus, the previous logic of the ladder of circularity changes here as well. Consumption patterns truly come first, but the mechanisms have a lower priority in western civilization (e.g., recycling).
The conclusion to the theoretical section is that priorities of the circular economy change by moving towards economies with lower income levels. These priorities are interpreted differently not only in varying European business environments, but also on a global scale. Advanced economies prefer the reduction of consumption patterns as their consumer society starts to overgrow them. However, these issues are experienced much more in developing economies as they have always shouldered the burden of negative externalities for a long time [60,61,62,63]. Currently, these nations are protesting the inequality in global resource distribution. It is not necessarily because of their economic development, but simply due to having reached the limitations of their environmental capabilities. In 2017, Kenya became one of the pioneers in plastic waste management by its radical regulations when it almost entirely banned any plastic bag products. The implemented policies bear correspondence with the EKC’s logic. This regulation has decreased local consumption, but a technological change is still required. This study argues that proper technology to effectively recycle plastic waste in the country is still missing. The next chapter examines the plastic material flow in Kenya and highlights its deficiencies to foster circular innovation.

3. Materials and Methods

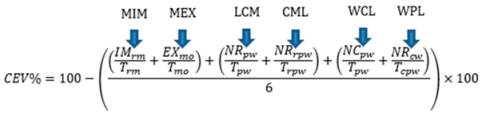
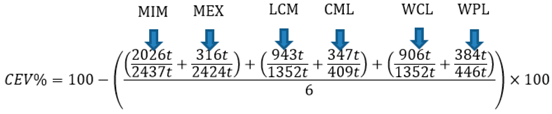
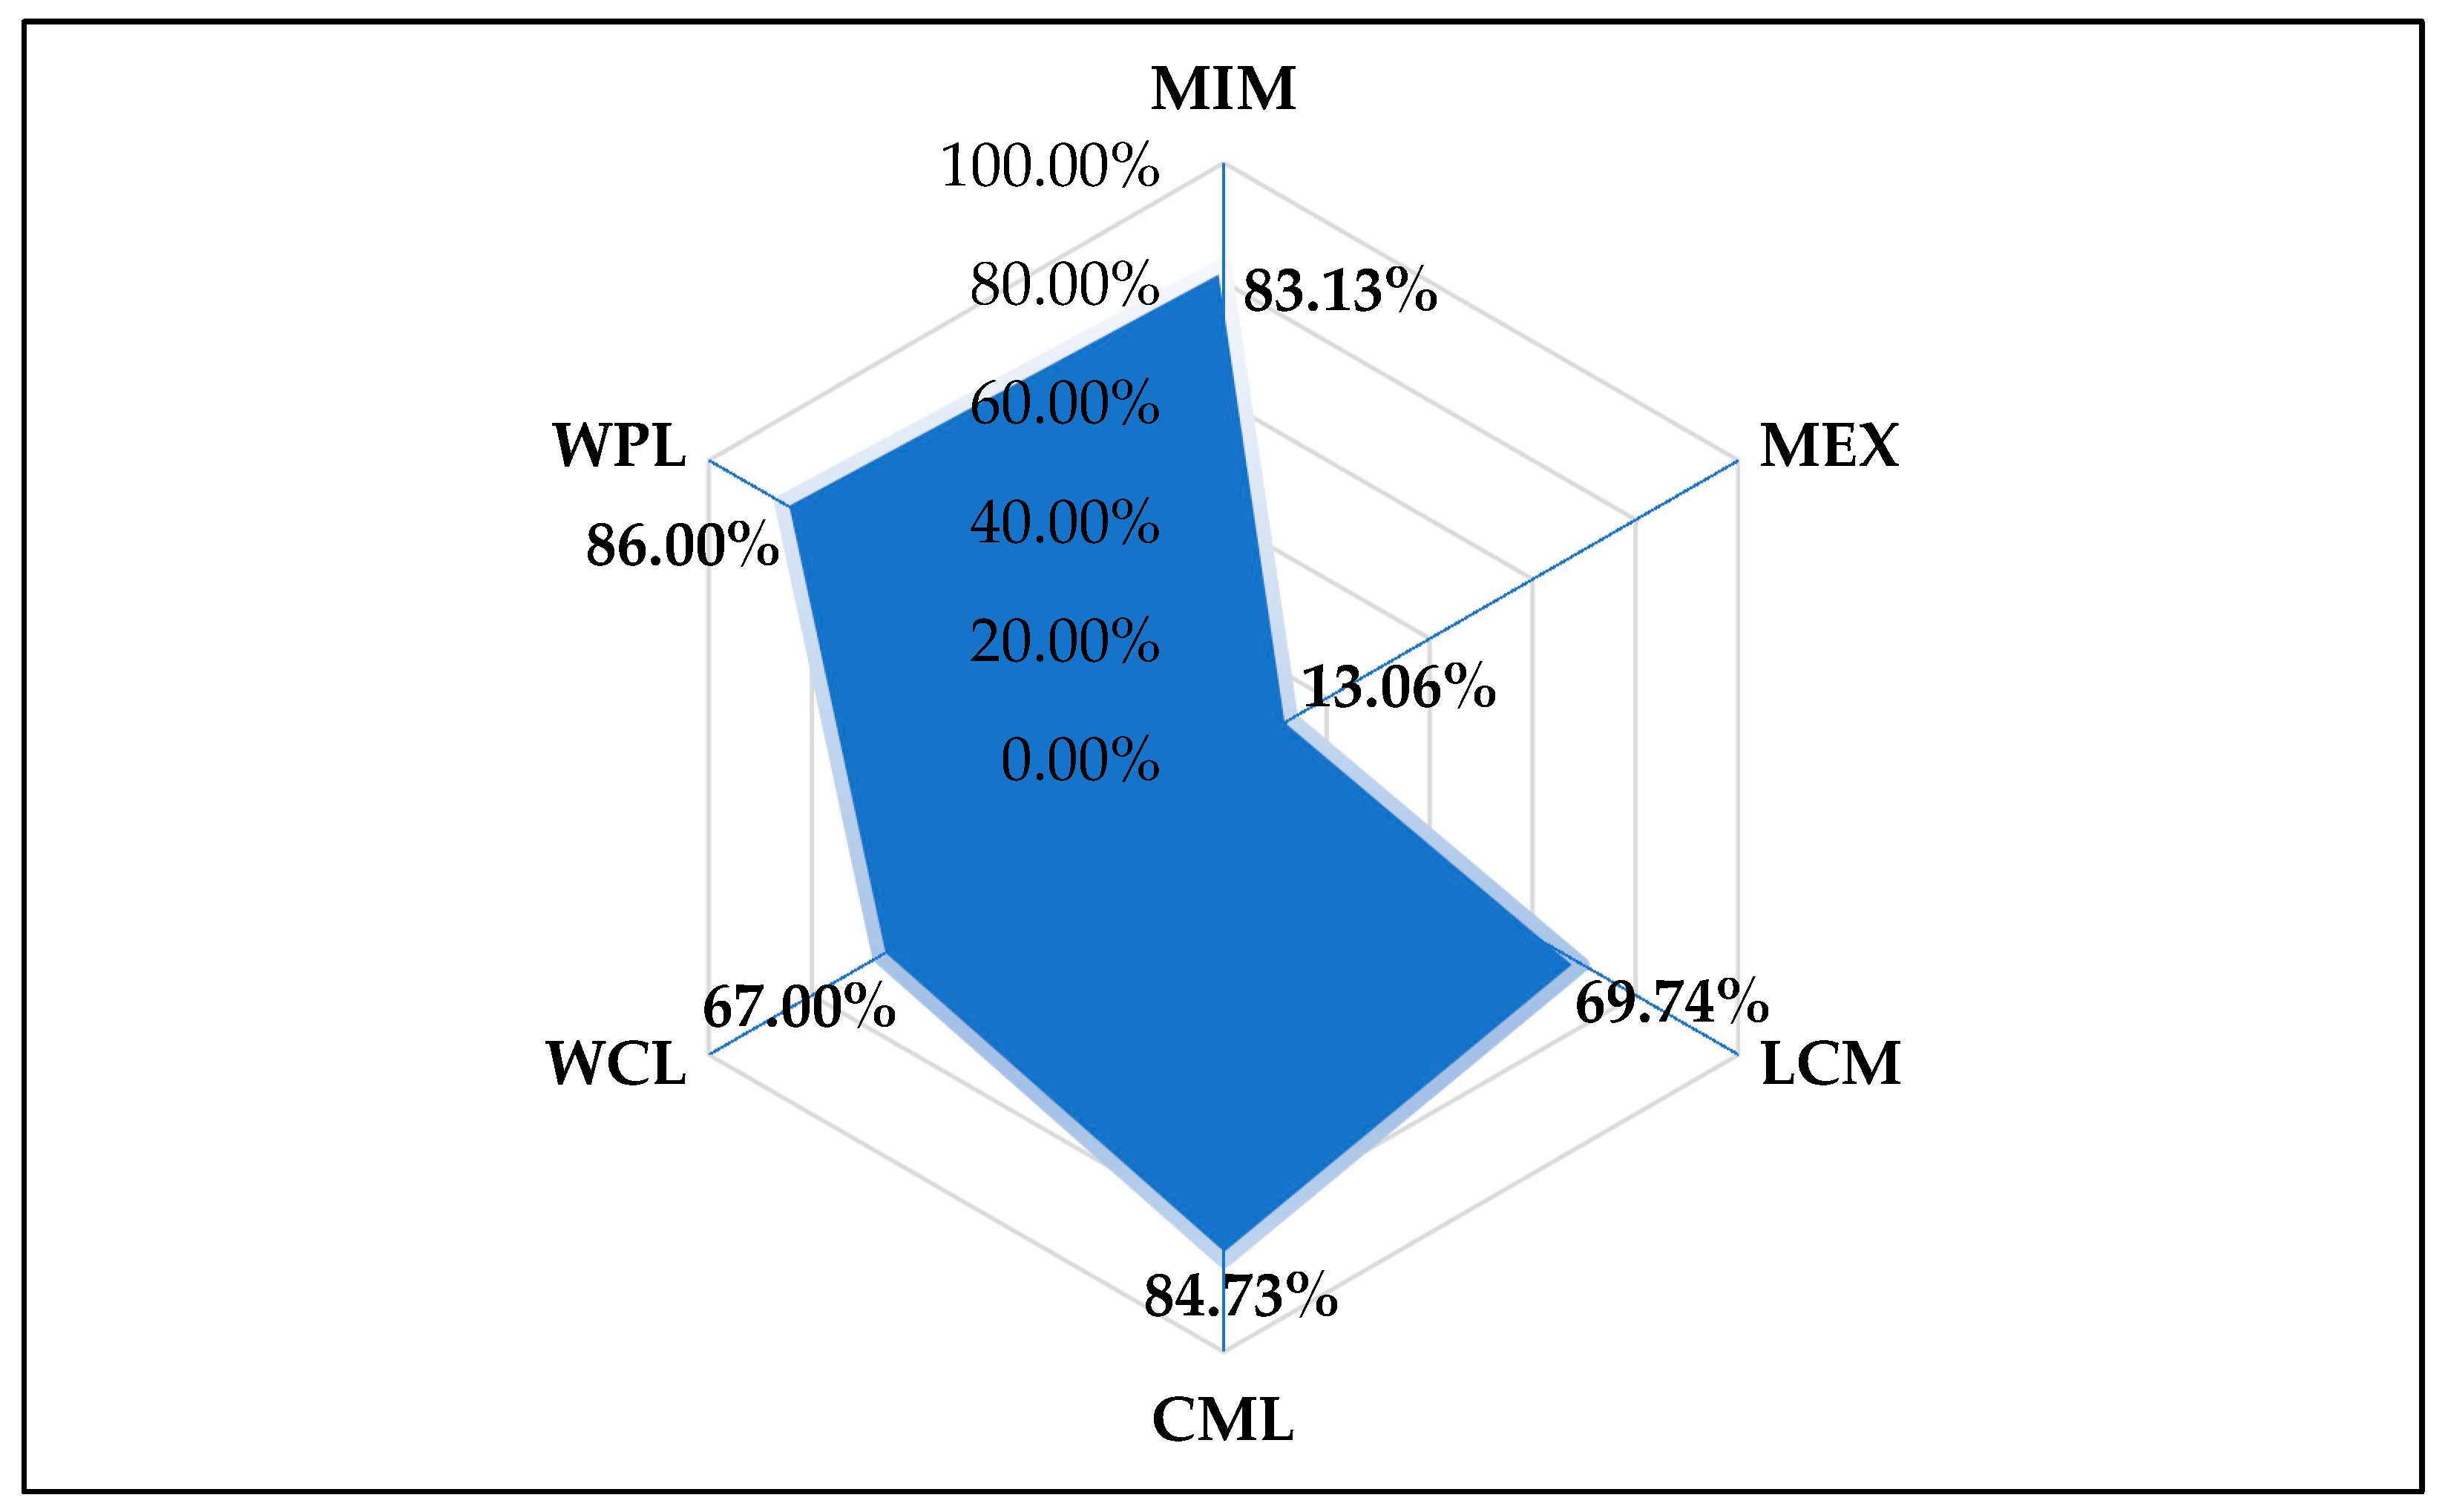
3.1. Circular Economic Value

The Circular Economic Value (CEV) is a methodology to measure system attributes and detect its improvement points to enhance circular performance. Fogarassy et al. [64] declare that CEV takes into consideration the material flow and energy usage of production systems, single products, or any activities. It follows the basic circular principles urging the minimization of material and energetic needs of any analyzed objects. The methodology offers only a universal framework which can be used and interpreted to certain cases. Data concerning the energy usage is unavailable, therefore, the emphasis will be on the material aspects. The availability of data would lead to the application of a material flow analysis, but it is not aligned with the aim of the research. The present study aims at defining the level of circularity in Kenya’s plastic waste stream instead of tracking its flow and locating its leakage points. The focus of this research is rather on the areas which must be further improved to enhance the circular transition. The tailor-made mechanism of the CEV calculation is illustrated in Equation (1):
Sustainability 10 01664 i001
Given: CEV = Circular Economic Value; MIM = ratio of imported plastic raw materials (IMrm) to the total volume of plastic manufacture inputs (Trm); MEX = ratio of exported plastic products (EXmo) to the total volume of plastic manufacture outputs (Tmo); LCM = ratio of non-recyclable plastic waste (NRpw) to the total plastic waste amount (Tpw); CML = ratio of non-recycled recyclable plastic waste (NRrpw) from the total recyclable plastic waste amount (Trpw); WCL = ratio of non-collected plastic waste (NCpw) to the total plastic waste amount (Tpw); and WPL = ratio of non-recycled collected plastic waste (NRcw) to the collected plastic waste amount (Tcpw).
As seen from the nature of the equation, it puts emphasis on the linear processes of individual indicators. This approach helps to highlight the malfunctioning elements of the systems. However, the overall value represents a reverse form of their final combination to indicate the level of circularity. The analysis focuses on three main areas where the input-output relations would show the system’s actual level of circularity. First, it takes into consideration the international trade relations of the national plastic manufacturing industry. These patterns are represented by the MIM (material import) and MEX (material export) values. The former shows the reliance of manufacture on imported raw materials (IMrm) and the latter indicates how much of the total manufactured plastic output (Tmo) goes to export (EXmo). The concept of the circular economy to closed material loops means not only the recovery of materials, but also to keep their flow at the lowest regional level as possible. Of course, national autonomy would not be the aim in the world of globalization. It is important, though, not to rely strongly on external resources and to avoid export of products which could be tomorrow’s resources. The second aspect considers the plastic consumption features. It includes the linear consumption materials (LCM) and the material losses of consumption (CML). It was previously mentioned in a previous part of this study that even a positive attitude regarding plastic recycling could be hindered by the nature of the different plastic materials. Some forms of plastics are not recyclable at all and some of them suffer contamination through usage which makes it non-recyclable. The aim of these two indicators is to highlight the amount of plastic waste which cannot be recycled (NRpw) after usage and to investigate how much of the total recyclable plastic waste (Trpw) will remain non-recycled (NRrpw). Their comparison shows where the true material losses appear. Is it the use making plastic unsuitable for recycling or do the managing facilities fail at recycling the suitable materials? Eventually, the third examination field is the waste management efficiency, including the waste collection (WCL) and procession losses (WPL). The first indicator emphasizes the share of the non-collected plastic waste (NCpw) from the total generated amount (Tpw). Then, the second measures how much of the total collected plastic waste (Tcpw) would not be recycled (NRcpw). The question is similar regarding the connection of these data. Is it the process that causes the material losses, or is it the collection of plastic waste being inefficient? The next section elaborates on the source and the application of the data employed through the calculation of the CEV.

3.2. Data Collection and Research Boundaries

As it was highlighted before, Kenya has poor inventory data on the plastic material flow, an impediment to essential information for a deeper examination. However, Wanjiku Mukui [59] provides a thorough analysis based on the country’s latest plastic inventory. That study focuses on the capital city, Nairobi, and employs a complex material flow analysis to track the flow of plastic in and out of the city. That data source is highly reliable, since it is based on the official plastic stream inventory of the municipality. Nevertheless, it cannot be handled as a representative source for the whole country. Still, it is sufficient for a case study which highlights the linear-circular circumstances within the core of Kenya’s plastic production and consumption location. Thus, the data for defining the CEV of Kenya’s plastic management system has been obtained from that research. Equation (2) presents an applied form of the CEV calculation, which has been filled with the relevant data from the inventory:
Sustainability 10 01664 i002
The next section introduces the outcome of the analysis and offers recommendations for the circular transition of the system.

4. Results and Discussion

4.1. The Circular Economic Value of the Current State of Plastic Material Flow

The aim of the case study was to determine the level of circularity of Nairobi’s plastic flow. The limitation of the research is its focus on Nairobi and surrounding environs. Nevertheless, as the backbone of the country’s plastic production and consumption. The result of the CEV calculation indicates a 32.72% value as the level of circularity in the local plastic material flow. The performance of the individual indicators is presented in Figure 6.
The final value is hardly a surprise after considering some of the system’s pillars. The obvious paradox is the major share of external raw materials (MIM = 83.13%) used in plastic manufacturing while the internal material flow offers a reasonable amount of secondary resources. The MEX value shows that wide regional leakage cannot be accounted for since only 13.06% of the manufactured products are transported abroad.
The fact that 69.74% (LCM) of the consumed plastic is not suitable for recycling should be a concern. It would be interesting to know whether it is the result of its consumption patterns (e.g., food contamination, etc.) or simply the material is not applicable for further utilization (e.g., quality matters). The CML (84.73%) value implies that almost the entire recyclable plastic amount remains un-utilized. This could be due to lack of adequate capacity of the waste management systems.
Only 1/3 of the total generated plastic waste is collected through mainstream solid waste channels, and the rest (WCL = 67%) falls out of the system’s operational boundaries. A total of 86% (WPL) of the gathered waste gets to the final stage, that is, incineration or official dumping sites, such as Dandora.
The results of the LCM-CML and WCL-WPL relation imply to the same conclusion on the local plastic waste stream. Waste management facilities might be negatively influenced by external factors (such as low recyclable input and low collection rate), though it is clear that they are unable to properly process the available amounts of plastic. The recycle potential of recoverable plastics is strongly under-utilized.
The introduced regulation will certainly bring significant systematic changes to Kenya’s plastic material flow in the next two or three years. However, it is only valid for bags, with some exceptions. As previous experiences showed, policies alone, are not sufficient [58]. They must be complemented with further technological applications to achieve long-term changes. While conducting regulations falls under the umbrella of policymakers, the role of the private sector is essential in innovation. The paper previously argued that higher circular priorities are rather influenced by consumers and the responsibility of producers increases at lower levels. This not only means manufacture of circular products, which are easier to recycle or last longer, but also that, with technological novelties, new business approaches must come, such as means of encouraging consumers to embrace material recycling or longer product use. Similarly, there is a need for methods contributing to this attitude by taking responsibility for the producers’ own materials and goods [65]. The least developed world’s handicap of lacking infrastructure could be an advantage in the long run. As latecomers in the field of innovation, they would have the benefit of learning from their predecessors and build best practices instead of reinventing the wheel. The basic application of the CEV analysis aims at drawing attention to system elements which need further development. Such outcomes are usually followed by scenario analyses focusing on progress in the highlighted areas. However, the major lesson is that many pillars of Kenya’s plastic waste management functions on a rather low level. This result implies a more complex nature of system transitions. Thus, instead of exact development scenarios, it is rather important to focus on an initial framework of that process [66,67]. After the demonstration of the plastic industry’s linear nature in Kenya, the paper focuses on its initial aim by discussing a holistic recycling model. The following chapter offers a business solution involving many plastic utilization options and stakeholders from the private and public sector.

4.2. Recommendations for Business Stakeholders

The analysis clearly indicated not only the basic deficiencies of Kenya’s plastic waste management, but also the lack of data to design development scenarios. Therefore, the authors decided to introduce the main components of a possible business solution to avoid material leakage (such as energy use) in the country’s plastic flow. This draft concept is based upon the Business Model Canvas (BMC) perspective of Osterwalder and Pigneur [68]. The selected model allows the detailed description of the most significant business development cornerstones. The following idea is expected to enhance the performance of Kenya’s plastic waste management and to foster the country’s circular transition. Except for “Ratio of exported plastic products to the total volume of plastic manufacture outputs”, the CEV has a rate of linearity of nearly 70%, which can be associated with a wide range of circular solutions for all BMC indicators. Below is an outline of important facts relating directly to the proposed model.

4.2.1. Key Partnerships

For the circular business model to be successful, various stakeholders must join forces. The government, through the National Environment Management Authority, is the most critical player, since it is solely responsible for the formulation of policies. Studies exist on the effect of government regulations on plastic manufacturing and management [12,69,70]. Policies formulated by any government should be aimed at encouraging employment and investment [33]. The Kenyan national government needs to formulate policies that will encourage investment and recycling of plastic waste; for example, tax subsidies for recycling companies, and easing the process of acquiring the necessary technology. County governments, through environmental departments, are the other players; by maintaining cleanliness through waste collection and formulation of environmental regulations at the county level [49,71]. County environmental departments, together with other contracted solid waste handlers, act as the link to those responsible for recycling. Plastic products manufacturers, through their umbrella organization, Kenya Association of Manufacturers (KAM), are the other group; these associations are both in emerging and mature economies [21,23,72]. Such manufacturers bring in investment, provide jobs, pay taxes, and are affected by any regulation touching on plastic products. Further, for the model to be a success, these investors must be willing to use recycled plastic. However, one of the challenges in plastic waste management has been the reluctance by plastic manufacturers to use recycled plastic as a raw material. This is due to the lack of incentives by governments [29] and to the lack of knowledge of the exact material properties of recycled material. The Kenyan government must avoid a similar situation by offering necessary support and legislation. Finally, the consumer of products packaged using plastic bags must be considered as the post-consumption behavior is important. They need to be educated and advised on handling the waste [6,12]. However, not only education and knowledge influence disposal attitudes, but also local infrastructure and access to convenient disposal systems play a major role [73]. Other players may include environmental lobby groups (NGOs) and related financial institutions (long-term contract and responsibility within the partnership).

4.2.2. Key Activities and Resources

There are four main activities that must be fulfilled for the model to be a success, namely, 3R (reuse, recycle, remanufacturing) and disposal. The process begins at the disposal stage, which is usually at the end of a product’s life cycle. The objective is to minimize littering and cut off incineration. At disposal, there are other activities that are equally important. For example, sorting of plastic waste is key, as this determines the quality of secondary virgin raw materials. Getting the right technology to mechanize the process cannot be overemphasized [74,75]. The next step is the recycling of the sorted plastic waste to obtain the right micro size. Equally, the mechanization of the process is important [76,77]. Recycled plastic waste as a raw material is then used in the manufacture of new products or remanufacture of the original products [78]. These products, as noted earlier, can be in a liquid form, such as diesel or gasoline [79,80], or in solid form, such as plastic products and tiles among others. Reuse is the last key activity in the circular process. For less energy and material utilization, the manufacturers of plastic products must be encouraged to produce long-lasting and recycle products [23]. The four activities do require resources and proper legislation such as how to deal with scrap waste. The government must support investors and facilitating funding where necessary. The initial cost of investment will be higher due to acquiring the right technology, research, and equipping manpower with the right skills. In the example of Africa Energy Solutions (AES), the Kenyan government, through its investment arm, ICDC, provided 46% of the funding. Equally, policies and regulations enacted must be aimed at encouraging investors to embrace the circular models (sharing schemes, take back management practices, or circular franchise selling) in the plastic industry [17].

4.2.3. Value Proposition

Adoption of the circular model (building blocks) in the country has several positive outcomes. On the environment, use of recycled plastic reduces reliance on virgin raw materials, leading to reduced extraction of natural resources. In addition, the model ensures that the environment will be cleaner as the non-biodegradable plastic waste will be in circular use, or its production curtailed. Given that the country must continuously import virgin raw materials required for plastic products, a circular model will minimize the outflow of monetary resources. Furthermore, pollution of air due to incinerating plastic waste or health problems attributable to hazardous gases produced during the process will be addressed. On the economic front, the country will spend less on the importation of virgin raw materials for plastic products. There may be growth in investment as other investors may be attracted by favorable policies, support, or legislation [81]. Furthermore, the government would improve its revenue streams through taxes associated with the management of scrap waste [6]. More business opportunities for other auxiliary players will be created, such as waste picking, transportation, sorting, recyclers, and energy savings. Improved opportunities in the country eventually translate to economic growth and improved revenue streams for the government. An improved investment environment brings about employment opportunities and improvement of legislatively requiring recycled content. These are goals the Kenyan government should aim at achieving rather than discourage investors. Socially, job opportunities bring about a desirable quality of life for those employed and their families. A cleaner environment is desirable and will bring about the sense of belonging or community participation in maintaining clean surroundings, that is, aesthetic value.

4.2.4. Customer Relation

Creating and maintaining productive relationships among various players is key to the success of the model and these touch on the government, universities or technical institutions, manufacturers of public products and the public at large who are the major consumers. One such factor is how the government relates with other players in the circle and consumers of plastic products through the formulation of policies and regulations, whether from a national or county level [82]. Whether on a national or country level, policies and regulations enacted should be aimed at encouraging both investment and use of recycled raw materials. The government should offer attractive incentives to plastic manufacturers willing to embrace a circular business model [83]. Equally, regulations and policies should accommodate consumers of plastic waste. Punitive legislation, such as bans, may ultimately have undesired outcomes. The government and plastic manufacturers should implement strategies that educate and create awareness among consumers or the public at large on plastic use and waste management. Any fears on the quality and health concerns on the use of recycled products should be addressed fully. Awareness on disposal, the first key activity as shown above, is important. The government must provide an enabling environment that would bring about good relations insofar as funding and business support is concerned. Investors to embrace the model need funding for acquiring or developing new technology [84].
New technology is capital intensive and acceptable business support by the government may trigger financiers, such as banking institutions, to offer the much-needed credit facilities. This is because, as a developing economy, the government may not be able to provide all the monetary support needed. The model can only be successful if the public is well-educated and willing to participate in the process fully. Similarly, county environmental departments that are mandated in collecting waste and other relevant institutions should teach the public how to go about the disposal stage [17]. Another equally important relationship is between training institutions and industry for the acquisition of required skills. The government, plastic industry manufacturers, and institutions of higher education must agree on how to carry out research and development, as well as the education of manpower. Given that this would be a new concept in the county, research and development funding is paramount [85]. Research allows innovation and designing of better products. As such, the government should partially or fully fund research aimed at obtaining continuous value throughout the life cycle of plastic products. Plastic manufacturers who are the ultimate consumers of skilled manpower should liaise with training institutions, such that trained manpower has both practical and theoretical know-how [18].

4.2.5. Distribution Channels and the Consumer Segment

Existing manufacturers of plastic products can still use existing supply channels. This is better and cheaper than negotiating for new vendor contracts. Current suppliers have established relationships with large wholesale and retail outlets that push their products to customers. The only challenge would be to new entrants who may have to form and negotiate their own contracts or use existing supply channels where possible. Other options using sharing platforms where the products and services are shared among customers is a new and cheaper way of product distribution practice. Distribution channels for solid plastic products may not be such a problem but, rather, for new products, such as fuel. The government can assist in the supply chain of fuel products (synthetic oil) through its well-established national oil corporation footprints. Alternatively, it can support local independent energy distributors to offer the much-needed supply chain link. The reasoning behind this is that multinational and established companies may be reluctant to embrace energy or petrochemical products from recycled plastic.
The market is readily available for plastic products since everyone is used to these products so long as there are no health concerns. Still, the challenge would be on energy products. However, so long as quality and safety issues have been taken care of, the market should not be a problem. Depending on the pricing, these products can be sold to consumers with less disposable income, such as those in informal settlements and rural places. There are many operators of diesel-powered machines who would welcome the idea of affordable green fuel whose supply is assured and constant.

4.2.6. Cost Structure and Revenue Streams

The circular model proposed in this paper has cost implications, but which are manageable if there is goodwill among the key players identified above. This is a capital-intensive model in the initial phase, but the benefits are expected to far outweigh the investment cost. As previously stated, the government must take a proactive role. For example, it may give incentives, such as tax holidays, subsidies, technical support, and favorable legislation, among others, to stimulate a favorable response from other key players. Some of these costs are stated below:
  • Research and Development (R and D)
  • Feasibility studies such as profitability, pilot test, SWOT analysis, production costs, capital and operating costs estimation
  • Technology selection—mechanical and electrical
  • Man-power selection and training
  • Environmental compliance and safety audits
  • Channel costs—raw material and vendor selection
  • Processing plant design and outlay
On the revenue side, bearing in mind government support, use of recycled materials would be a cost-saving measure for companies that have to import virgin raw materials by cutting costs associated with freight, insurance, delivery delays, negotiation fees, and taxes. Equally, producers of plastic markets who have been in the industry for long will still benefit from contractual sales agreements while using the same supply chains. All of the components of the described business solution frame are summarized in Table 1.
An existing investor in plastic products who diversifies into fuel, petrochemical, and lubricants can generate new revenue streams assuming government support allows below-market pricing for easier penetration of intended market segments, some of which have already been discussed.

5. Conclusions

The study points out that the utilization of plastic waste, especially in developing countries, is needed to avoid unnecessary energy use. Relying on secondary raw materials significantly reduces energy needs and, therefore, production costs. Although waste incineration can produce mass amount of energy for the given regions, the energetic application results in considerable leakage in the material stream. This system property needs to be highlighted because the energy from burned (recyclable) plastic waste is much less than the amount needed for the production of plastic products from virgin materials. However, the study has also found that, in some cases, energy recovery is the only way of further utilization. As a developing economy, Kenya must focus on the application of best practices from developed countries. As latecomers in the field of innovation, least developed nations would have the benefit of learning from their predecessors instead of reinventing the wheel. Nevertheless, the well-functioning models of mature business environments might appear deceitful in their case. Due to the intense global material flow of the 20th century developed countries could afford the application of linear economic circumstances. The reason is that externalities generated by this manner could have been outsourced to the developing part of the world. Traditional business models are wasteful as they lead to depletion of limited natural resources with undesirable environmental impacts. The beneficial allure of economic growth misled the high-income countries. Their frequently-emerging problems showed that their attitude cannot be sustainable in the long-term. This pattern led them to the need of a radical paradigm shift instead of previously-applied minor system alterations.
The circular economy urges the considerate use of resources and a long-term perspective regarding their management. Although the concept requires a regime change, this new economic approach needs bottom-up initiatives as novel business solutions. Circular businesses are being embraced across the globe in various sectors of the economy. Several studies outlined in this article demonstrate the ability of circular business models in addressing economic, social, and environmental challenges posed by plastic waste. Some studies support recycling plastic waste by documenting positive outcomes, a position the paper shares. Furthermore, there are researchers who opine differently, as far as plastic recycling is concerned. However, their argument is not entirely refused in this research. The authors even emphasized the same opinion throughout their previous studies. In the case of wealthy societies, the refusal and reduction of endless consumption is essential. Recycling or recovering activities must not only be treated as a lower priority, but they might not even be considered as circular solutions. They only give a social relief that wasteful behavior is acceptable because the attached disadvantages are taken care of.
One of the most important patterns highlighted in this research is the variable nature of circular priorities due to their interpretation to different business environments. This phenomenon has been proved previously by the authors through the consideration of the European business region. As consumption intensity has risen in western nations, used products have been moved to Central and Eastern European countries for further utilization. This process has made lower circular priorities (e.g., repair, refurbish, remanufacture, repurpose) more significant in such nations. Though the circular economy prefers local supply chains, this model enabled lifespan expansion through an extended territorial perspective. Nevertheless, the case of developing countries is different. Their imported material flow consists of products nearing the end of their useful life. Kenya appears to be the most interesting as it has already introduced serious policy tools against mass plastic quantities. This act envisions a future path on a way to achieve sustainable environmental development next to economic growth. However, the long-term efficiency of this system requires accompanying technological innovations and business solutions. Due to harmful global effects, the circular priorities—defined to developed countries—are interpreted differently in this business environment. The less prioritized material recycling and recovering activities would be cornerstones of the circular transition and the country needs business solutions contributing to this area.
Throughout the study, there was an emphasis on the significance of varying welfare states in circular transition. Evidently, this is a highly context-dependent process and the development level of a country is only one of the many aspects to define it. The local consumption patterns, main economic activities, and international trade relations are also relevant macroeconomic factors of this transition. The current analysis focused on the general characteristics of a certain material flow to present a case study which can be further improved and applied to other countries. Though the reason to choose Kenya was due to its recent waste policy measures, the lessons of this research are replicable to other developing nations facing the same challenges. For future studies it will be important to develop a better understanding of the appropriate, and more concrete, circular business elements for the effective planning. The results indicated the poor level of circularity regarding Kenya’s plastic waste management system. The paper introduced the most relevant system components through the BMC approach and emphasized the business potential of a holistic plastic recycling initiative.

Author Contributions

E.M. and C.F. had the initial idea of the manuscript. E.M. performed the literature material. B.H. and C.F. designed the research methodology and analyzed the data. E.M. and B.H. wrote the paper with the supervision of C.F.

Acknowledgments

Supported by the ÚNKP-17-3 New National Excellence Program of the Ministry of Human Capacities.

Conflicts of Interest

The authors declare no conflicts of interest.

References

  1. Nwabue, F.I.; Unah, U.; Itumoh, E.J. Production and characterization of smokeless bio-coal briquettes incorporating plastic waste materials. Environ. Technol. Innov. 2017, 8, 233–245. [Google Scholar] [CrossRef]
  2. Njeru, J. The urban political ecology of plastic bag waste problem in Nairobi, Kenya. Geoforum 2006, 37, 1046–1058. [Google Scholar] [CrossRef]
  3. Othman, S.N.; Noor, Z.Z.; Abba, A.H.; Yusuf, R.O.; Hassan, M.A.A. Review on life cycle assessment of integrated solid waste management in some Asian countries. J. Clean. Prod. 2013, 41, 251–262. [Google Scholar] [CrossRef]
  4. Orset, C.; Barret, N.; Lemaire, A. How consumers of plastic water bottles are responding to environmental policies? Waste Manag. 2017, 61, 13–27. [Google Scholar] [CrossRef] [PubMed]
  5. Wagner, T.P. Reducing single-use plastic shopping bags in the USA. Waste Manag. 2017, 70, 3–12. [Google Scholar] [CrossRef] [PubMed]
  6. Martinho, G.; Balaia, N.; Pires, A. The Portuguese plastic carrier bag tax: The effects on consumers’ behavior. Waste Manag. 2017, 61, 3–12. [Google Scholar] [CrossRef] [PubMed]
  7. Rivers, N.; Shenstone-Harris, S.; Young, N. Using nudges to reduce waste? The case of Toronto’s plastic bag levy. J. Environ. Manag. 2017, 188, 153–162. [Google Scholar] [CrossRef] [PubMed]
  8. Steensgaard, I.; Syberg, K.; Rist, S.; Hartmann, N.B.; Boldring, A.; Hansen, S.F. From macro- to microplastics - Analysis of EU regulation along the life cycle of plastic bags. Environ. Pollut. 2017, 224, 289–299. [Google Scholar] [CrossRef] [PubMed]
  9. Huysman, S.; De Schapmeester, J.; Ragaert, K.; Dewulf, J.; De Meester, S. Performance indicators for a circular economy: A case study on post-industrial plastic waste. Resour. Conserv. Recycl. 2017, 120, 46–54. [Google Scholar] [CrossRef]
  10. Ilić, M.; Nikolić, M. Drivers for development of circular economy—A case study of Serbia. Habitat Int. 2016, 56, 191–200. [Google Scholar] [CrossRef]
  11. Rudolph, N.; Kiesel, R.; Aumnate, C. Plastic Waste of the World: Increasing Potential of Recycling. In Understanding Plastics Recycling; Carl Hanser Verlag GmbH & Co. KG: Munich, Germany, 2017; pp. 87–102. [Google Scholar] [CrossRef]
  12. Willis, K.; Maureaud, C.; Wilcox, C.; Hardesty, B.D. How successful are waste abatement campaigns and government policies at reducing plastic waste into the marine environment? Mar. Policy 2017. In Press. [Google Scholar] [CrossRef]
  13. Michelini, G.; Moraes, R.N.; Cunha, R.N.; Costa, J.M.H.; Ometto, A.R. From Linear to Circular Economy: PSS Conducting the Transition. Procedia CIRP 2017, 64, 2–6. [Google Scholar] [CrossRef]
  14. Kobza, N.; Schuster, A. Building a responsible Europe—The value of the circular economy. IFAC-PapersOnLine 2016, 49, 111–116. [Google Scholar] [CrossRef]
  15. Mondello, G.; Salomone, R.; Ioppolo, G.; Saija, G.; Sparacia, S.; Lucchetti, C. Comparative LCA of Alternative Scenarios for Waste Treatment: The Case of Food Waste Production by the Mass-Retail Sector. Sustainability 2017, 9, 827. [Google Scholar] [CrossRef]
  16. Mativenga, P.T.; Sultan, A.A.M.; Agwa-Ejon, J.; Mbohwa, C. Composites in a Circular Economy: A Study of United Kingdom and South Africa. Procedia CIRP 2017, 61, 691–696. [Google Scholar] [CrossRef]
  17. Whicher, A.; Harris, C.; Beverley, K.; Swiatek, P. Design for circular economy: Developing an action plan for Scotland. J. Clean. Prod. 2017, 172, 3237–3248. [Google Scholar] [CrossRef]
  18. Urbinati, A.; Chiaroni, D.; Chiesa, V. Towards a new taxonomy of circular economy business models. J. Clean. Prod. 2017, 168, 487–498. [Google Scholar] [CrossRef]
  19. JICA. Preparatory Survey for Integrated Solid Waste Management in Nairobi City in the Republic of Kenya; CTI Engineering International Co., Ltd.: Nairobi, Kenya; NJS Consultants Co., Ltd.: Nairobi, Kenya, 2010.
  20. George, D.A.R.; Lin, B.C.; Chen, Y. A circular economy model of economic growth. Environ. Model. Softw. 2015, 73, 60–63. [Google Scholar] [CrossRef]
  21. Van Eygen, E.; Laner, D.; Fellner, J. Circular economy of plastic packaging: Current practice and perspectives in Austria. Waste Manag. 2017, 72, 55–64. [Google Scholar] [CrossRef] [PubMed]
  22. Singh, J.; Cooper, T. Towards a Sustainable Business Model for Plastic Shopping Bag Management in Sweden. Procedia CIRP 2017, 61, 679–684. [Google Scholar] [CrossRef]
  23. Dahlbo, H.; Poliakova, V.; Mylläri, V.; Sahimaa, O.; Anderson, R. Recycling potential of post-consumer plastic packaging waste in Finland. Waste Manag. 2017, 71, 52–61. [Google Scholar] [CrossRef] [PubMed]
  24. Brouwer, M.T.; van Velzen, T.; Augustinus, A.; Soethoudt, H.; De Meester, S.; Ragaert, K. Predictive model for the Dutch post-consumer plastic packaging recycling system and implications for the circular economy. Waste Manag. 2017, 71, 62–85. [Google Scholar] [CrossRef] [PubMed]
  25. Oghazi, P.; Mostaghel, R. Circular Business Model Challenges and Lessons Learned—An Industrial Perspective. Sustainability 2018, 10, 739. [Google Scholar] [CrossRef]
  26. Kirchherr, J.; Reike, D.; Hekkert, M. Conceptualizing the circular economy: An analysis of 114 definitions. Resour. Conserv. Recycl. 2017, 127, 221–232. [Google Scholar] [CrossRef]
  27. Linder, M.; Williander, M. Circular Business Model Innovation: Inherent Uncertainties. Bus. Strategy Environ. 2017, 26, 182–196. [Google Scholar] [CrossRef]
  28. Thompson, R.C.; Moore, C.J.; vom Saal, F.S.; Swan, S.H. Plastics, the environment, and human health: Current consensus and future trends. Philos. Trans. R. Soc. B Biol. Sci. 2009, 364, 2153–2166. [Google Scholar] [CrossRef] [PubMed]
  29. Mwanza, B.G.; Mbohwa, C. Major Obstacles to Sustainability in the Plastic Industry. Procedia Manuf. 2017, 8, 121–128. [Google Scholar] [CrossRef]
  30. Gayo, F.; García, R.; Diez, M.A. Modelling the Gieseler fluidity of coking coals modified by multicomponent plastic wastes. Fuel 2016, 165, 134–144. [Google Scholar] [CrossRef]
  31. Lu, C.H.; Chiang, K.Y. Gasification of non-recycled plastic packaging material containing aluminum: Hydrogen energy production and aluminum recovery. Int. J. Hydrog. Energy 2017, 42, 27532–27542. [Google Scholar] [CrossRef]
  32. Faussone, G.C. Transportation fuel from plastic: Two cases of study. Waste Manag. 2017, 73, 416–423. [Google Scholar] [CrossRef] [PubMed]
  33. Miandad, R.; Barakat, M.A.; Rehan, M.; Aburiazaiza, A.S.; Ismail, I.M.I.; Nizami, A.S. Plastic waste to liquid oil through catalytic pyrolysis using natural and synthetic zeolite catalysts. Waste Manag. 2017, 69, 66–78. [Google Scholar] [CrossRef] [PubMed]
  34. Owusu, P.A.; Banadda, N.; Zziwa, A.; Seay, J.; Kiggundu, N. Reverse engineering of plastic waste into useful fuel products. J. Anal. Appl. Pyrolysis 2018, 130, 285–293. [Google Scholar] [CrossRef]
  35. Rinaldini, C.A.; Mattarelli, E.; Savioli, T.; Cantore, G.; Garbero, M.; Bologna, A. Performance, emission and combustion characteristics of a IDI engine running on waste plastic oil. Fuel 2016, 183, 292–303. [Google Scholar] [CrossRef]
  36. Al-Tulaian, B.S.; Al-Shannag, M.J.; Al-Hozaimy, A.R. Recycled plastic waste fibers for reinforcing Portland cement mortar. Constr. Build. Mater. 2016, 127, 102–110. [Google Scholar] [CrossRef]
  37. Coppola, B. Investigation on the use of foamed plastic waste as natural aggregates replacement in lightweight mortar. Compos. Part B Eng. 2016, 99, 75–83. [Google Scholar] [CrossRef]
  38. Arulrajah, A.; Yaghoubi, E.; Wong, Y.; Horpibulsuk, S. Recycled plastic granules and demolition wastes as construction materials: Resilient moduli and strength characteristics. Constr. Build. Mater. 2017, 147, 639–647. [Google Scholar] [CrossRef]
  39. López-Gil, A.; Fernández, A.; Arranz, A.; Lorenzana, A.; Nieto, D.V.; de Saja, J.A.; Ruiz-Herrero, J.L.; Rodríguez-Pérez, M.; Merino, S. Mechanical and thermal performance of concrete and mortar cellular materials containing plastic waste. Constr. Build. Mater. 2016, 104, 298–310. [Google Scholar]
  40. Bhogayata, A.C.; Arora, N.K. Fresh and strength properties of concrete reinforced with metalized plastic waste fibers. Constr. Build. Mater. 2017, 146, 455–463. [Google Scholar] [CrossRef]
  41. Thorneycroft, J.; Orr, J.; Savoikar, P.; Ball, R. Performance of structural concrete with recycled plastic waste as a partial replacement for sand. Constr. Build. Mater. 2018, 161, 63–69. [Google Scholar] [CrossRef]
  42. Jassim, A.K. Recycling of Polyethylene Waste to Produce Plastic Cement. Procedia Manuf. 2017, 8, 635–642. [Google Scholar] [CrossRef]
  43. Soler, T.O. Identification and segregation of materials in mixed waste. Technol. Adv. Work Waste 1992, 57, 123–131. [Google Scholar] [CrossRef]
  44. Mezni, A.; Saber, N.B.; Alhadhrami, A.A.; Gobouri, A.; Aldalbahi, A.; Hay, S.; Santos, A.; Losic, D.; Altalhi, T. Highly biocompatible carbon nanocapsules derived from plastic waste for advanced cancer therapy. J. Drug Deliv. Sci. Technol. 2017, 41, 351–358. [Google Scholar] [CrossRef]
  45. Sharuddin, A.; Dayana, S.; Faisal, A.; Daud, W.; Ashri, W.M.; Kheireddine, A.M. A review on pyrolysis of plastic wastes. Energy Convers. Manag. 2016, 115, 308–326. [Google Scholar] [CrossRef]
  46. Gu, F.; Guo, J.; Zhang, W.; Summers, P.A.; Hall, P. From waste plastics to industrial raw materials: A life cycle assessment of mechanical plastic recycling practice based on a real-world case study. Sci. Total Environ. 2017, 601–602, 1192–1207. [Google Scholar] [CrossRef] [PubMed]
  47. Cramer, J. The Raw Materials Transition in the Amsterdam Metropolitan Area: Added Value for the Economy, Well-Being, and the Environment. Environ. Sci. Policy Sustain. Dev. 2017, 59, 14–21. [Google Scholar] [CrossRef]
  48. Nakatani, J.; Konno, K.; Moriguchi, Y. Variability-based optimal design for robust plastic recycling systems. Resour. Conserv. Recycl. 2017, 116, 53–60. [Google Scholar] [CrossRef]
  49. Fogarassy, C.; Horvath, B.; Borocz, M. The Interpretation of Circular Priorities to Central European Business Environment with Focus on Hungary. Visegr. J. Bioecon. Sustain. Dev. 2017, 6, 2–9. [Google Scholar] [CrossRef]
  50. Ni, H.G.; Lu, S.Y.; Mo, T.; Zeng, H. Brominated flame retardant emissions from the open burning of five plastic wastes and implications for environmental exposure in China. Environ. Pollut. 2016, 214, 70–76. [Google Scholar] [CrossRef] [PubMed]
  51. Basel Convention. Where are WEee in Africa? Findings from the Basel Convention E-Waste Africa Programme; Secretariat of the Basel Convention: Basel, Switzerland, 2011. [Google Scholar]
  52. Panayotou, T. Empirical Tests and Policy Analysis of Environmental Degradation at Different Stages of Economic Development; Working Paper WP 238; Technology and Employment Programme, International Labour Office: Geneva, Switzerland, 1993. [Google Scholar]
  53. Horvath, B.; Bakosne, B.M.; Fogarassy, C. How does the European Unions’ climate policy function on global level?—The effects of “Carbon Leakage”. In Proceedings of the Science Connecting Nations: 2nd VUA YOUTH Conference, Godollo, Hungary, 23 November 2015; pp. 665–687. [Google Scholar]
  54. Suri, V.; Chapman, D. Economic growth, trade, and energy: Implications for the environmental Kuznets curve. Ecol. Econ. 1998, 25, 195–208. [Google Scholar] [CrossRef]
  55. Andreoni, J.; Levinson, A. The simple analytics of the Environmental Kuznets Curve. J. Public Econ. 2001, 80, 269–286. [Google Scholar] [CrossRef]
  56. Stern, D.I. The Rise and Fall of the Environmental Kuznets Curve. World Dev. 2004, 32, 1419–1439. [Google Scholar] [CrossRef]
  57. Dasgupta, S.; Laplante, B.; Wang, H.; Wheeler, D. Confronting the Environmental Kuznets Curve. J. Econ. Perspect. 2002, 16, 147–168. [Google Scholar] [CrossRef]
  58. Al-Mulali, U.; Solarin, S.A.; Ozturk, I. Investigating the presence of the environmental Kuznets curve (EKC) hypothesis in Kenya: An autoregressive distributed lag (ARDL) approach. Nat. Hazards. 2015, 80, 1729–1747. [Google Scholar] [CrossRef]
  59. Wanjiku Mukui, N. Mass Balance of Plastics: Case Study for Nairobi City; University of Nairobi: Nairobi, Kenya, 2015. [Google Scholar]
  60. Cobbing, M. Toxic Tech.: Not in Our Backyard—Uncovering the Hidden Flows of e-Waste; Full Report; Greenpeace: Amsterdam, The Netherlands, 2008. [Google Scholar]
  61. Ongondo, F.O.; Williams, I.D.; Cherrett, T.J. How are WEEE doing? A global review of the management of electrical and electronic wastes. Waste Manag. 2011, 31, 714–730. [Google Scholar] [CrossRef] [PubMed]
  62. Perkins, D.N.; Drisse, M.N.B.; Nxele, T.; Sly, P.D. E-Waste: A Global Hazard. Ann. Glob. Health 2014, 80, 286–295. [Google Scholar] [CrossRef] [PubMed]
  63. McCann, D.; Wittmann, A. E-Waste Prevention, Take-back System Design and Policy Approaches; Solving the E-Waste Problem (STEP) Green Paper, 13 February 2015; United Nations University: Bonn, Germany, 2015. [Google Scholar]
  64. Fogarassy, C.; Horvath, B.; Kovacs, A.; Szoke, L.; Takacs-Gyorgy, K. A Circular Evaluation Tool for Sustainable Event Management—An Olympic Case Study. Acta Polytech. Hung. 2017, 14, 161–177. [Google Scholar]
  65. Lewandowski, M. Designing the Business Model for Circular Economy—Towards the Conceptual Framework. Sustainability 2016, 8, 43. [Google Scholar] [CrossRef]
  66. Pethető, A.; Vecsenyi, J. Vállalkozz okosan! -Az Ötlettől a Piacra Lépésig [In Eng: Venture Smart!—From the Idea to Entering the Market]; HVG könyvek [HVG books]: Budapest, Hungary, 2017. [Google Scholar]
  67. Vecsenyi, J.; Pethető, A. How can you define your new venture? From the Business Model Canvas, through Lean canvas to The Business Concept Map. In Proceedings of the II International Conference on University-Based Entrepreneurship and Regional Development: Theory, Empirics and Practical Implementation, Book of Abstract, Pécs, Hungary, 1–2 December 2017; pp. 28–29. [Google Scholar]
  68. Osterwalder, A.; Pigneur, Y. Business Model. Generation: A Handbook for Visionaries, Game Changers, and Challengers; John Wiley and Sons: Hoboken, NJ, USA, 2010. [Google Scholar]
  69. Neffa, G.C.; Lourenco, S.V.M.; Acordi, V.P.E.B.; de Oliveira, C.G.M.J.; Vasconcelos, F.M.A. Management of plastic wastes at Brazilian ports and diagnosis of their generation. Mar. Pollut. Bull. 2017, 124, 67–73. [Google Scholar] [CrossRef] [PubMed]
  70. Öncel, M.S.; Bektas, N.; Bayar, S.; Engin, G.; Caliskan, Y.; Salar, L.; Yetis, Ü. Hazardous wastes and waste generation factors for plastic products manufacturing industries in Turkey. Sustain. Environ. Res. 2017, 27, 188–194. [Google Scholar] [CrossRef]
  71. Areeprasert, C.; Asingsamanunt, J.; Srisawat, S.; Kaharn, J.; Inseemeesak, B.; Phasee, P.; Khaobang, C.; Siwakosit, W.; Chiemchaisri, C. Municipal Plastic Waste Composition Study at Transfer Station of Bangkok and Possibility of its Energy Recovery by Pyrolysis. Energy Procedia 2017, 107, 222–226. [Google Scholar] [CrossRef]
  72. Rahim, R.; Abdul Raman, A.A. Carbon dioxide emission reduction through cleaner production strategies in a recycled plastic resin producing plant. J. Clean. Prod. 2017, 141, 1067–1073. [Google Scholar] [CrossRef]
  73. Rousta, K.; Ordonez, I.; Bolton, K.; Dahlén, L. Support for designing waste sorting systems: A mini review. Waste Manag. Res. 2017, 35, 1099–1111. [Google Scholar] [CrossRef] [PubMed]
  74. Lupo, E.; Moroni, M.; La Marca, F.; Fulco, S.; Pinzi, V. Investigation on an innovative technology for wet separation of plastic wastes. Waste Manag. 2016, 51, 3–12. [Google Scholar] [CrossRef] [PubMed]
  75. Moroni, M.; Lupo, E.; La Marca, F. Hydraulic separation of plastic wastes: Analysis of liquid-solid interaction. Waste Manag. 2017, 66, 13–22. [Google Scholar] [CrossRef] [PubMed]
  76. Shen, Y.; Zhao, R.; Wang, J.; Chen, X.; Ge, X.; Chen, M. Waste-to-energy: Dehalogenation of plastic-containing wastes. Waste Manag. 2016, 49, 287–303. [Google Scholar] [CrossRef] [PubMed]
  77. Kalargaris, I.; Tian, G.; Gu, S. The utilization of oils produced from plastic waste at different pyrolysis temperatures in a DI diesel engine. Energy 2017, 131, 179–185. [Google Scholar] [CrossRef]
  78. Ruggieri, A.; Braccini, A.M.; Poponi, S.; Mosconi, E.M. A Meta-Model of Inter-Organisational Cooperation for the Transition to a Circular Economy. Sustainability 2016, 8, 1153. [Google Scholar] [CrossRef]
  79. Panda, A.K.; Singh, R.K.; Mishra, D.K. Thermolysis of waste plastics to liquid fuel. A suitable method for plastic waste management and manufacture of value-added products-A world prospective. Renew. Sustain. Energy Rev. 2010, 14, 233–248. [Google Scholar] [CrossRef]
  80. Caballero, B.M.; de Marco, I.; Adrados, A.; López-Urionabarrenechea, A.; Solar, J.; Gastelu, N. Possibilities and limits of pyrolysis for recycling plastic rich waste streams rejected from phones recycling plants. Waste Manag. 2016, 57, 226–234. [Google Scholar] [CrossRef] [PubMed]
  81. Jambeck, J.; Hardesty, B.D.; Brooks, A.L.; Friend, T.; Teleki, K.; Fabres, J.; Beaudoin, Y.; Bamba, A.; Francis, J.; Ribbink, A.J.; et al. Challenges and emerging solutions to the land-based plastic waste issue in Africa. Mar. Policy 2017. In Press. [Google Scholar] [CrossRef]
  82. Meng, T.; Klepacka, A.M.; Florkowski, W.J.; Braman, K. Determinants of recycling common types of plastic product waste in environmental horticulture industry: The case of Georgia. Waste Manag. 2016, 48, 81–88. [Google Scholar] [CrossRef] [PubMed]
  83. Gradus, R.H.J.M.; Nillesen, P.H.L.; Dijkgraaf, E.; van Koppen, R.J. A Cost-effectiveness Analysis for Incineration or Recycling of Dutch Household Plastic Waste. Ecol. Econ. 2017, 135, 22–28. [Google Scholar] [CrossRef]
  84. Fischer, A.; Pascucci, S. Institutional incentives in circular economy transition: The case of material use in the Dutch textile industry. J. Clean. Prod. 2017, 155, 17–32. [Google Scholar] [CrossRef]
  85. Saavedra, Y.M.B.; Iritani, D.; Pavan, A.L.; Ometto, A. Theoretical contribution of industrial ecology to circular economy. J. Clean. Prod. 2018, 170, 1514–1522. [Google Scholar] [CrossRef]
Figure 1. Linear economy model.
Sustainability 10 01664 g001
Figure 2. The circular economy model.
Sustainability 10 01664 g002
Figure 3. Ladder of Circularity. Source: adapted from Cramer [47].
Sustainability 10 01664 g003
Figure 4. Environmental Kuznets Curve. Source: adapted from Panayotou [52].
Sustainability 10 01664 g004
Figure 5. The relations of plastic and rubber material flow and the GDP in Kenya. Source: self-made based on data adapted from World Bank, 2018.
Sustainability 10 01664 g005
Figure 6. The characteristics of the linear plastic material flow in Kenya. Source: self-made based on data adapted from Wanjiku Mukui [59].
Sustainability 10 01664 g006
Table 1. The Business Model Canvas of a plastic recycling business solution in Kenya.
Key partners:
  • Plastic produce manufactures
  • National and Regional governments
  • Specific investors and producers (produce only for order)
  • Specific financiers (long term contract and responsibility within the partnership)
Key activities:
  • Reuse (prolonged use)
  • Remanufacture (Product redesigning)
  • Recycle and disposal
  • Introduction of new sharing schemes
  • Take-back management and Franchise selling
Value proposition:
  • Environmental: Less budget on health, aesthetic value, rational waste management
  • Economic: Real plastic market, auxiliary businesses, job creation. Waste management and energy savings
  • Social: Improved quality of life. (Less plastic pollution in the drinking water)
Customer relation:
  • Consumer education and individual actions for consumer retention.
  • Viable business environment for investors—circular feedback about the market player and governmental guaranties
  • Positive regulations and policies for long term
Customer segment:
  • Various consumer segments:
    - manufacturers
    - entrepreneurs
  • Players of industrial symbiosis (cross-sectoral collaborators)
  • Using sharing platforms where the products and services are shared among customers
Key resource:
  • Recyclable material (no waste burning)
  • New technology (machinery)
  • Financial support (market-based and public)
Distribution channel:
  • New circular trading and service platforms
  • Strategic alliances for circular business
  • Government owned systems
Cost structure:
  • Processing plant design and outlay
  • Technology selection—mechanical and electrical (R&D costs)
  • Channel costs—raw material and vendor selection
Revenue stream:
  • Cost saving attributable to use of recyclable material flow
  • Diversification in circular products and materials
  • Government support such as tax holidays or low tax rates

