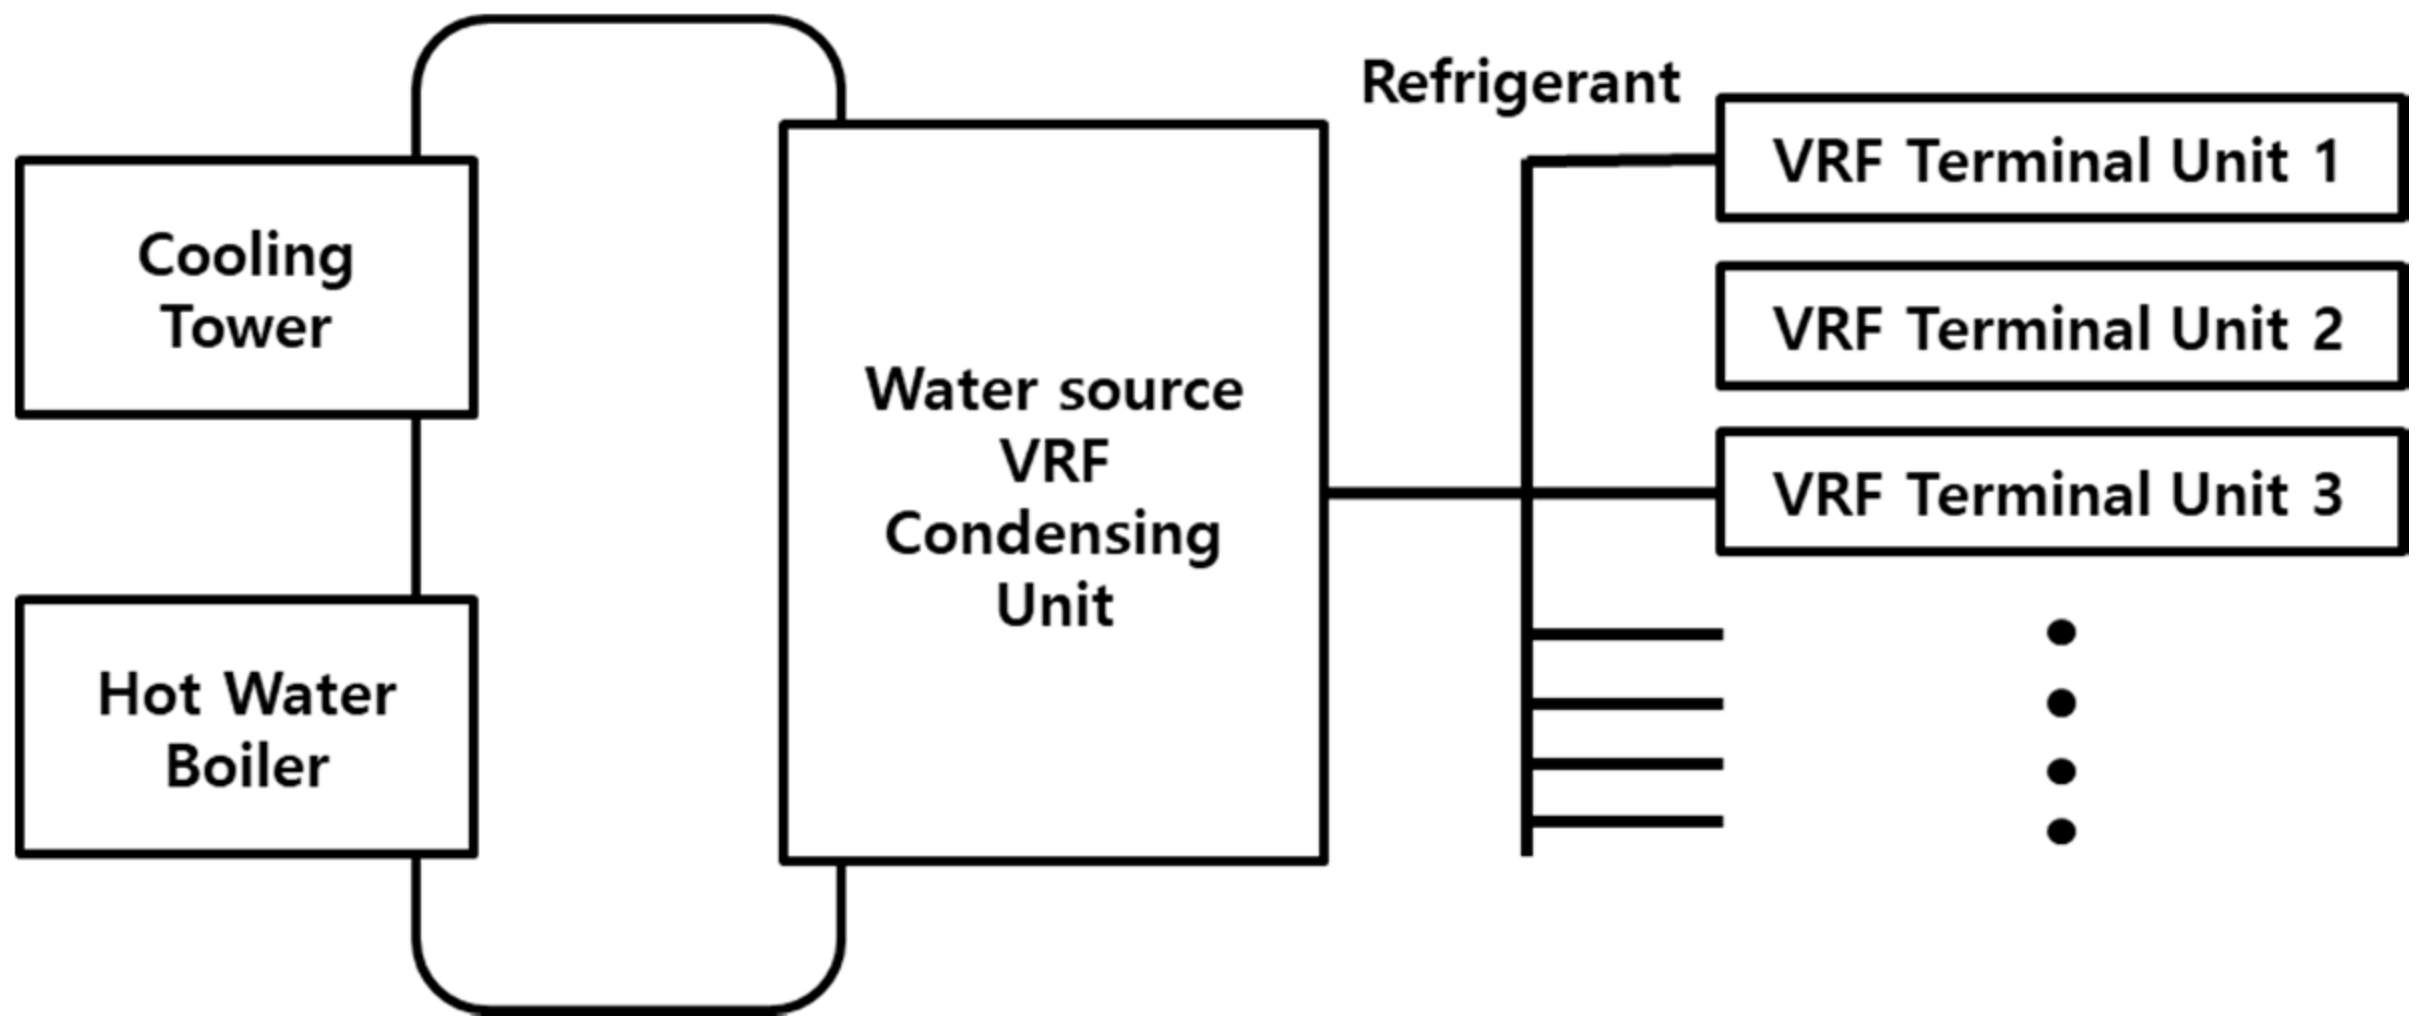
Figure 1.
Typical components of a water-source variable refrigerant flow (VRF) system.
Figure 1.
Typical components of a water-source variable refrigerant flow (VRF) system.
Figure 2.
Typical components of ground-source variable refrigerant flow (VRF) system.
Figure 2.
Typical components of ground-source variable refrigerant flow (VRF) system.
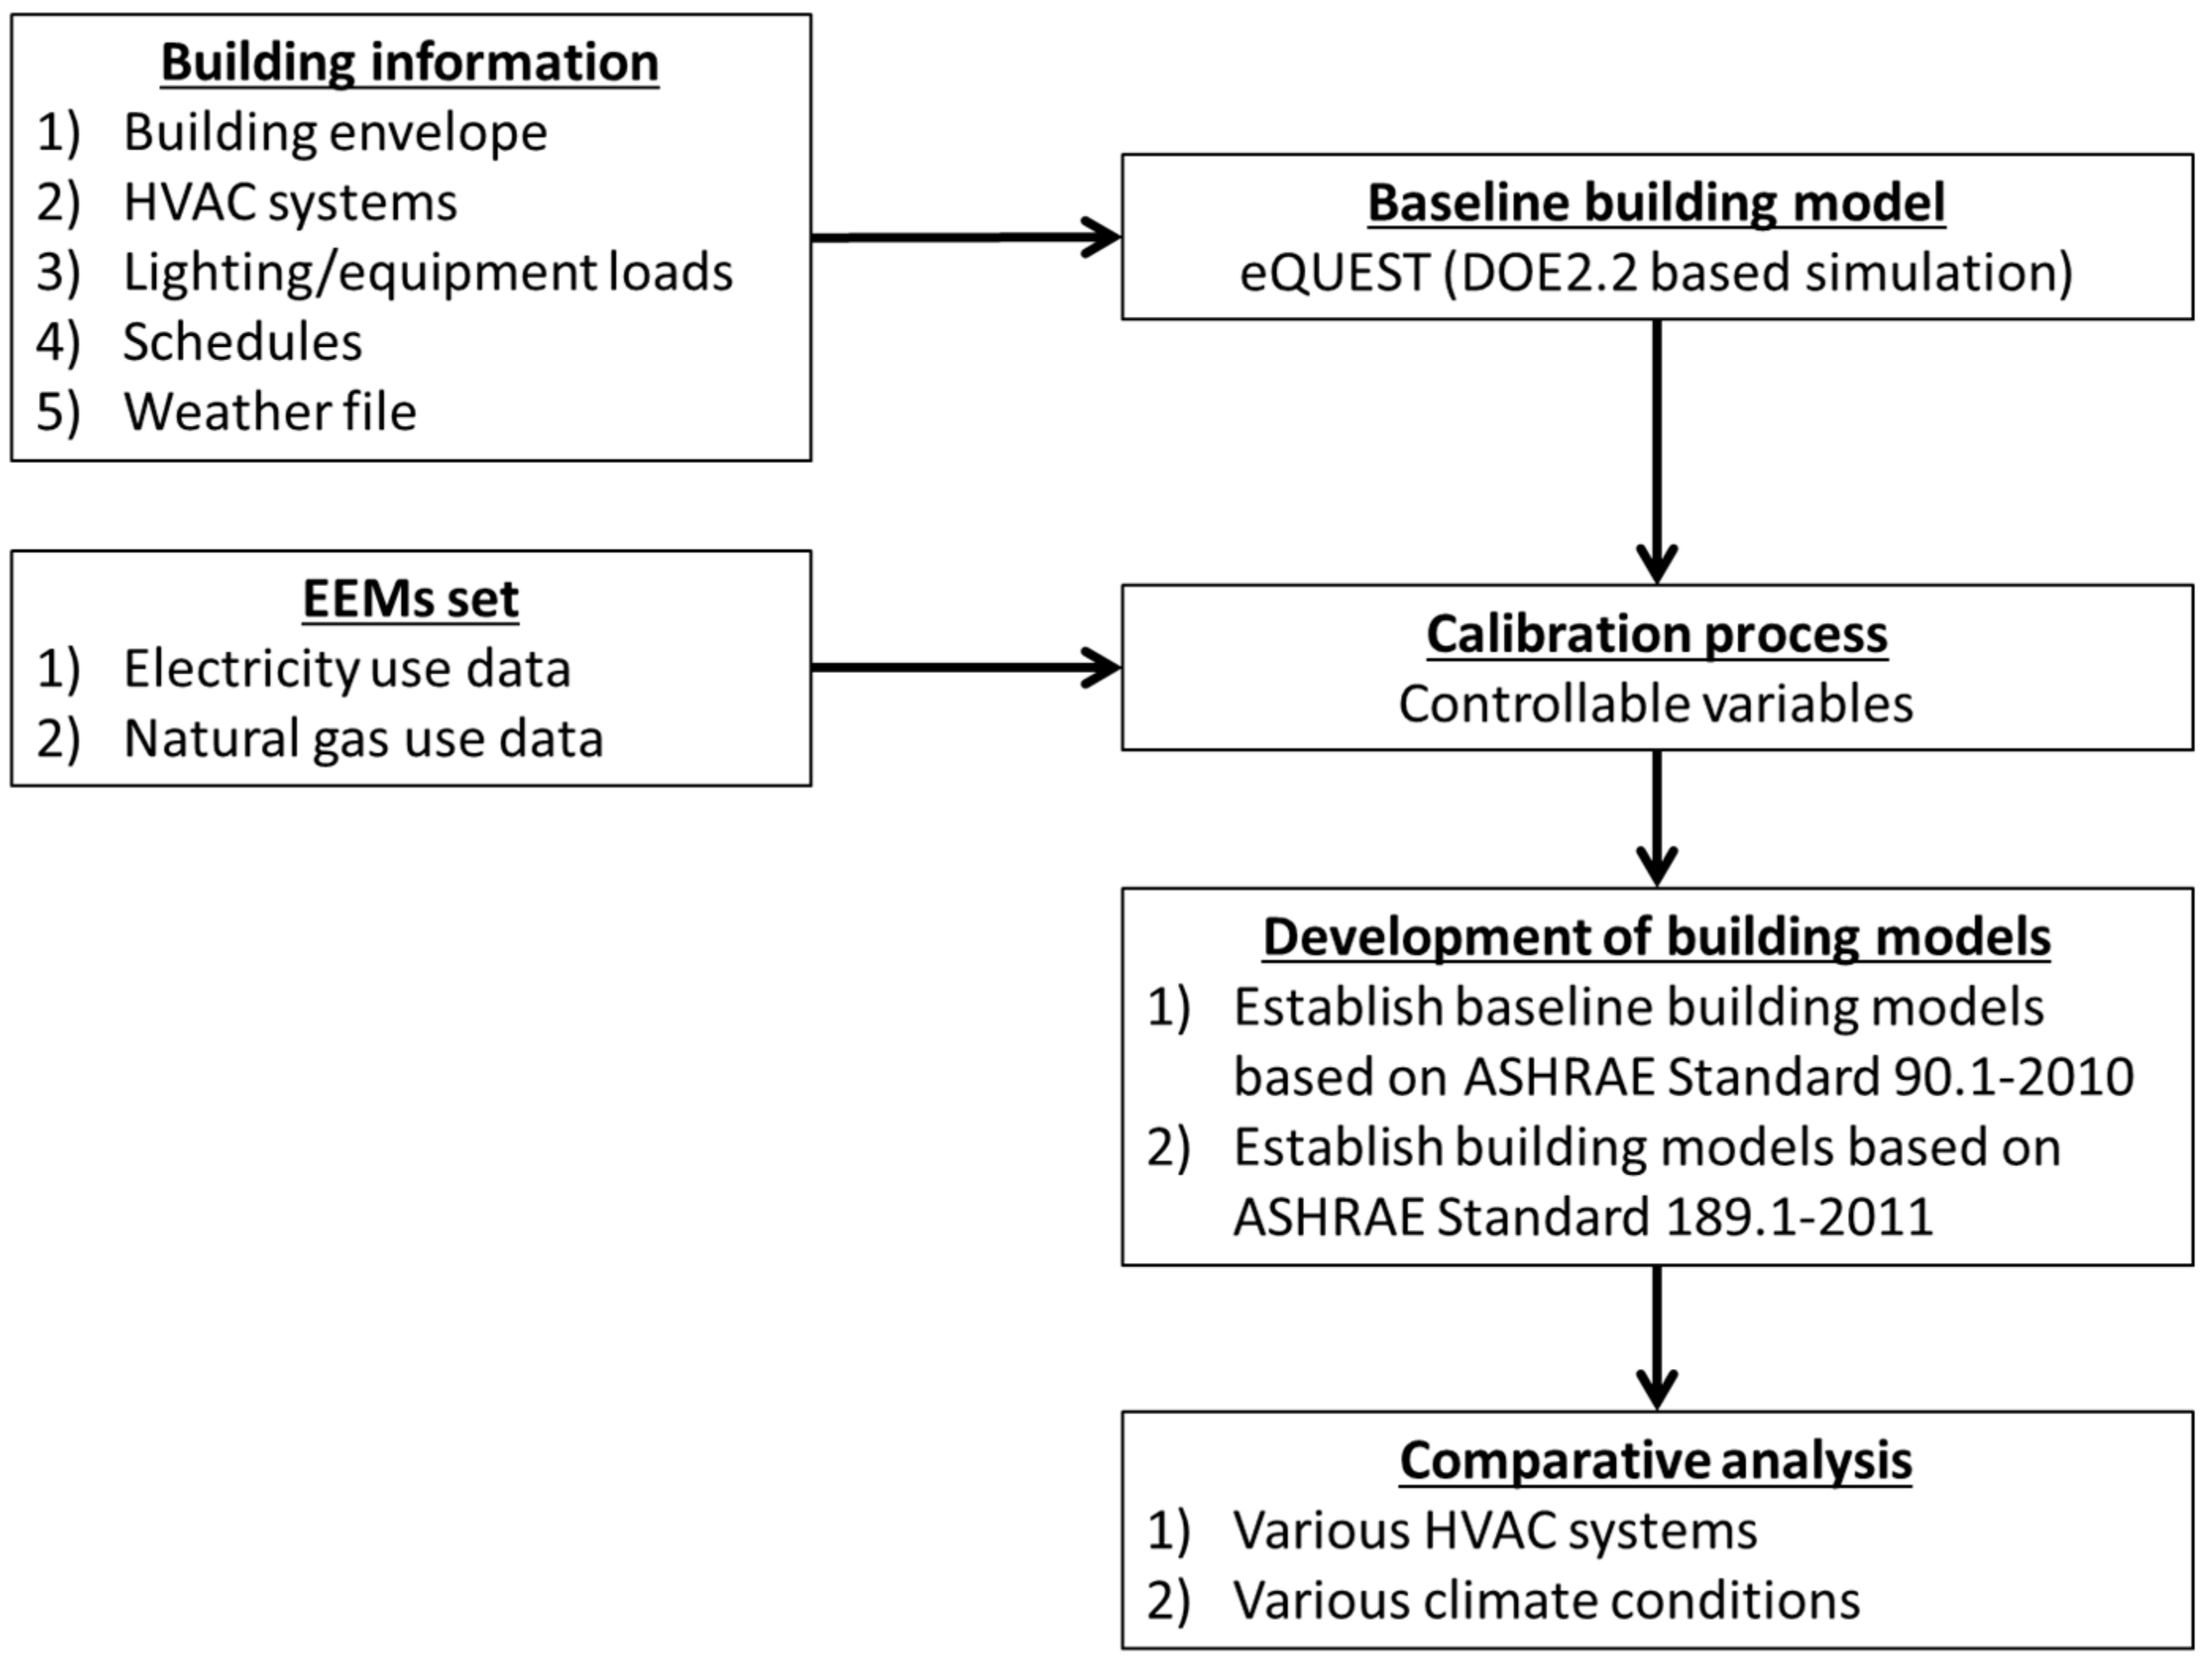
Figure 3.
Flowchart for the simulation environment for the ground-source variable refrigerant flow (GS-VRF) evaluation analysis.
Figure 3.
Flowchart for the simulation environment for the ground-source variable refrigerant flow (GS-VRF) evaluation analysis.
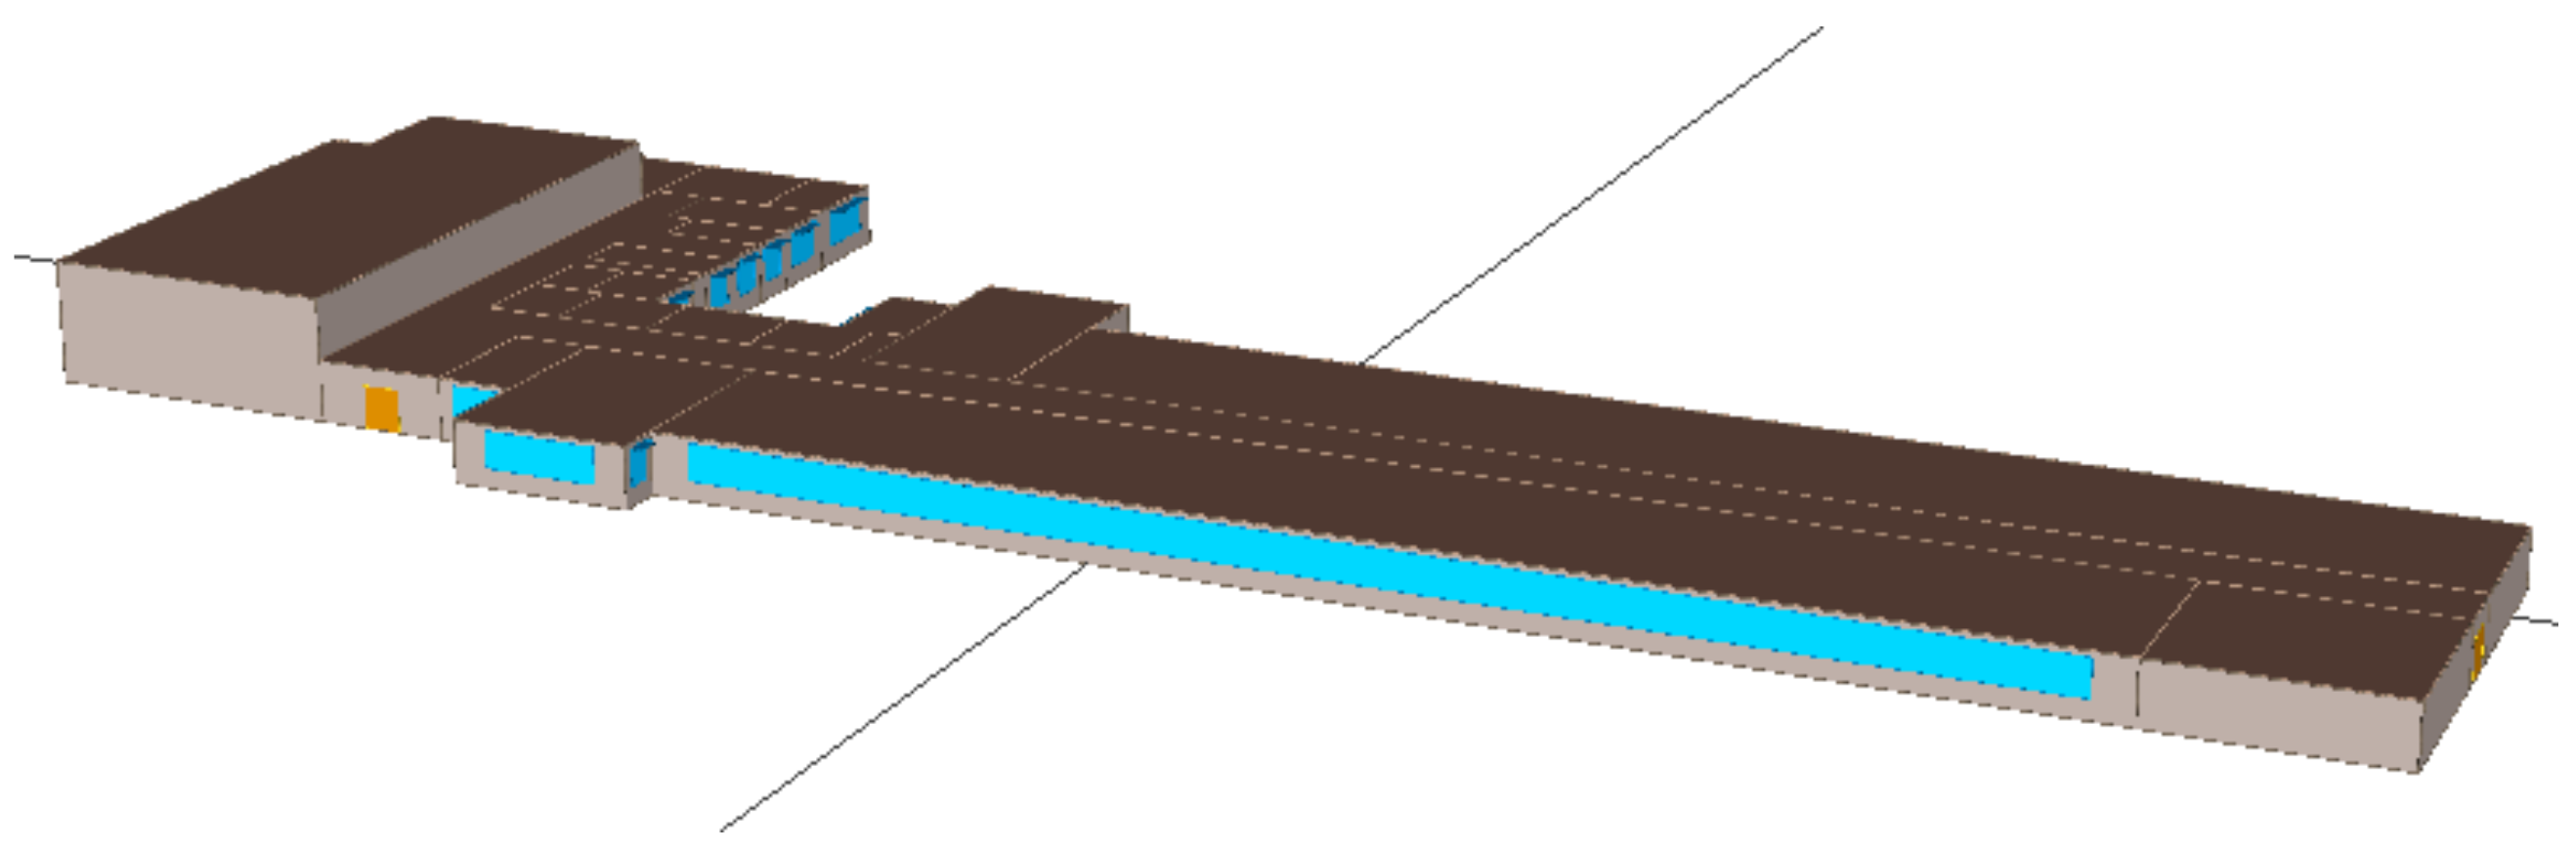
Figure 4.
Three-dimensional (3D) rendering of the office-building energy model.
Figure 4.
Three-dimensional (3D) rendering of the office-building energy model.
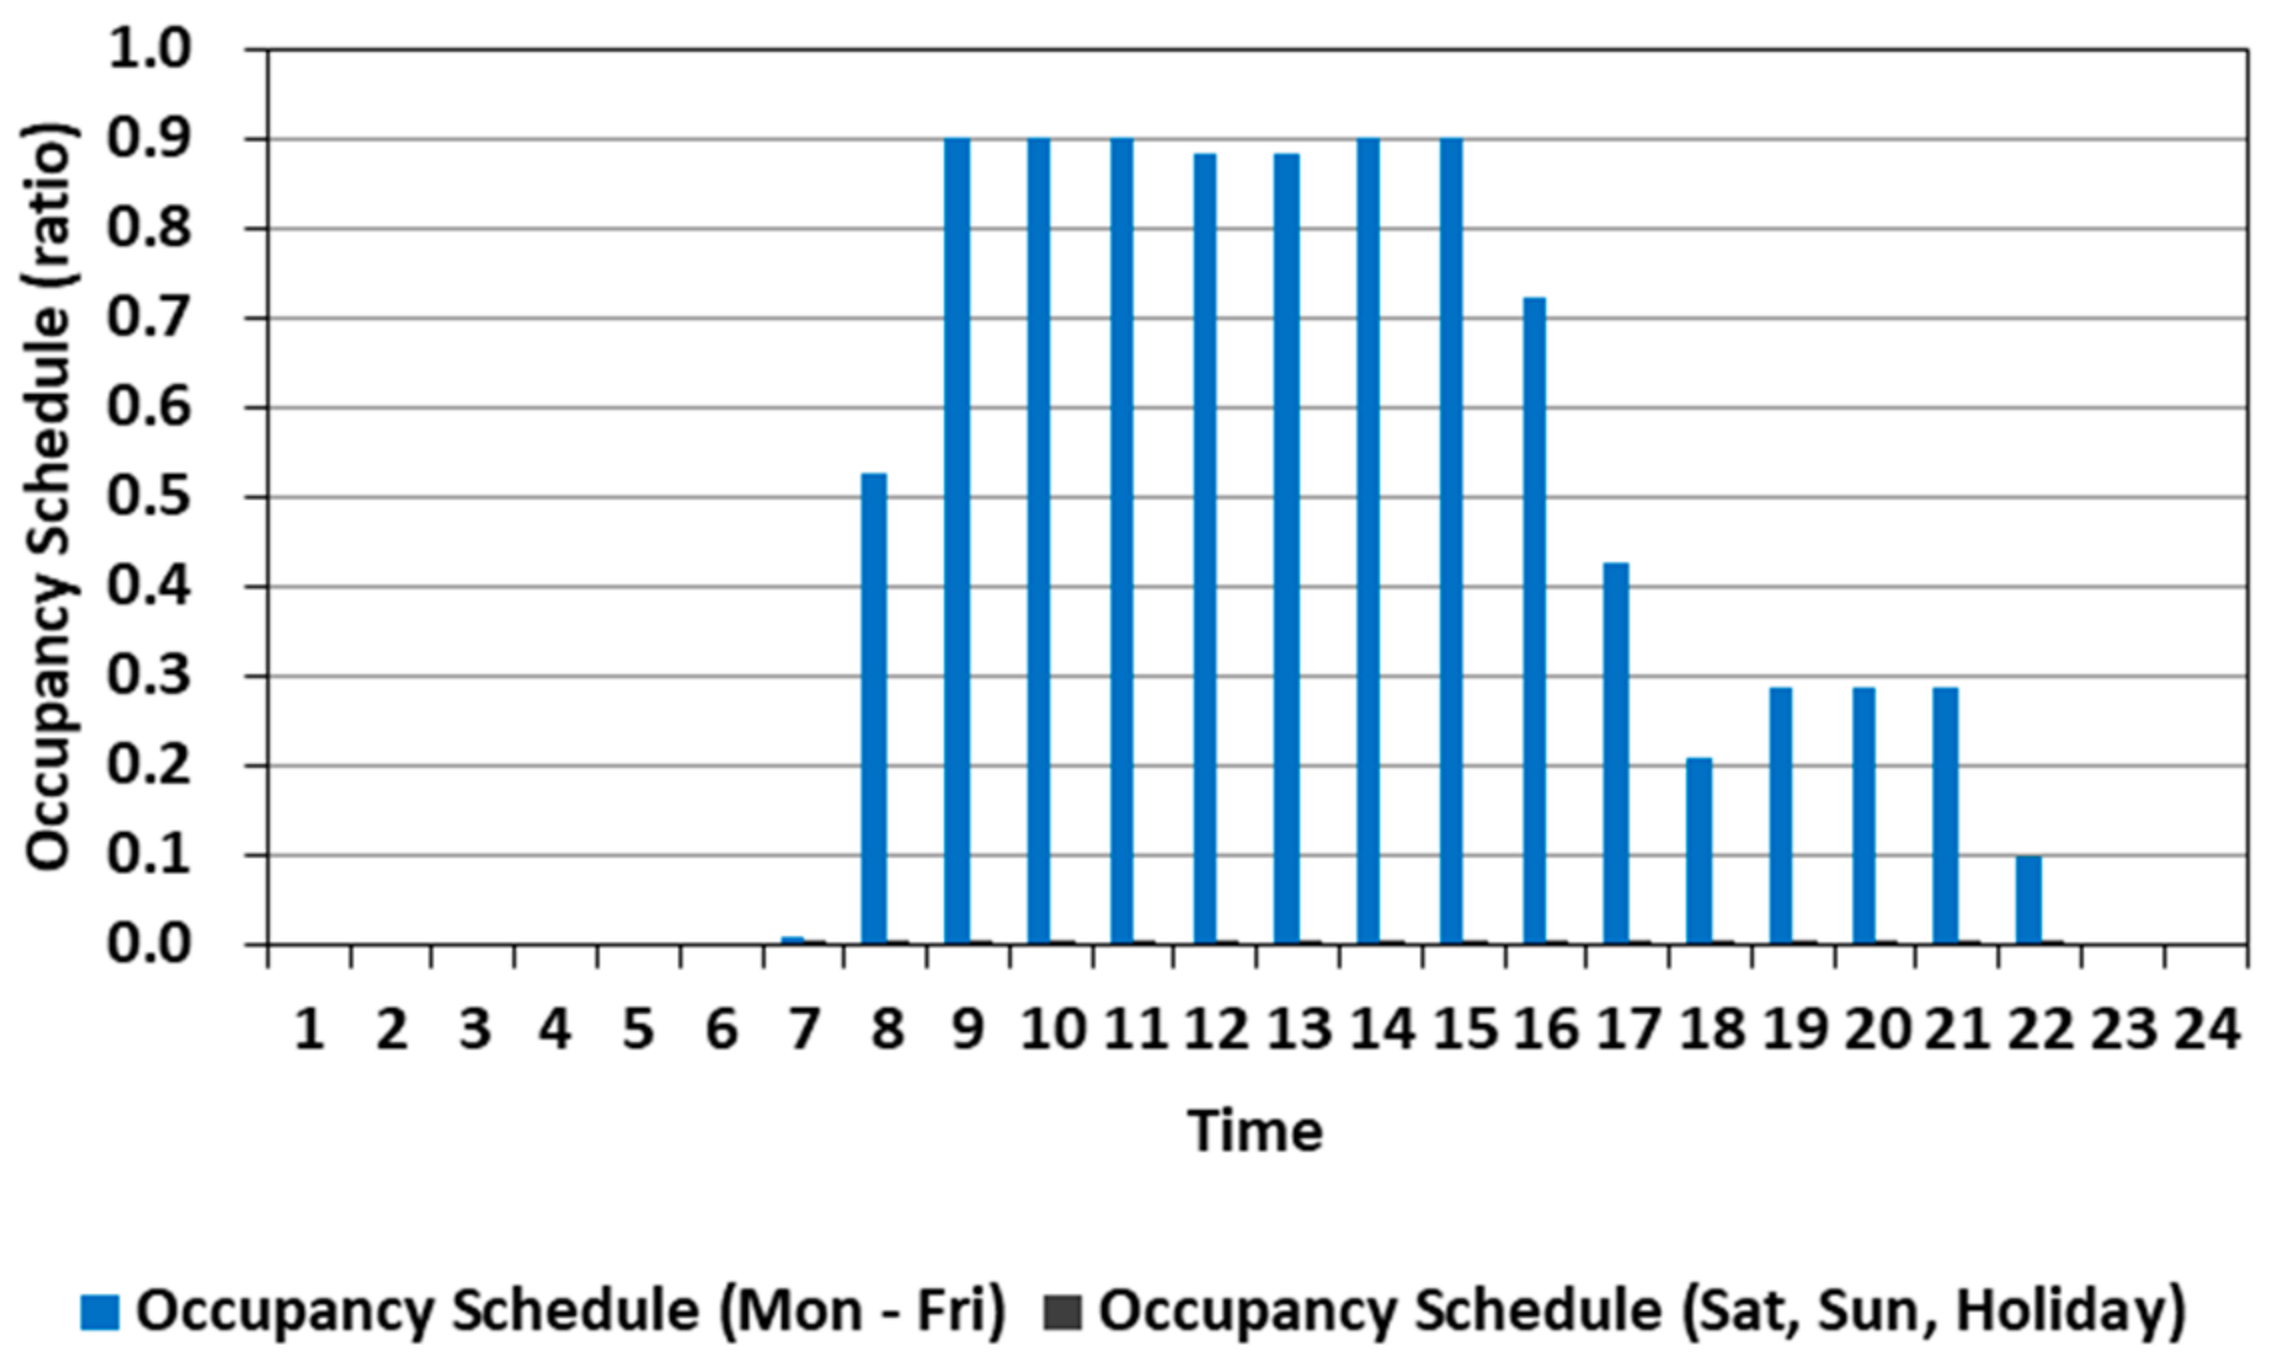
Figure 5.
Occupancy schedules used for the office-building model.
Figure 5.
Occupancy schedules used for the office-building model.
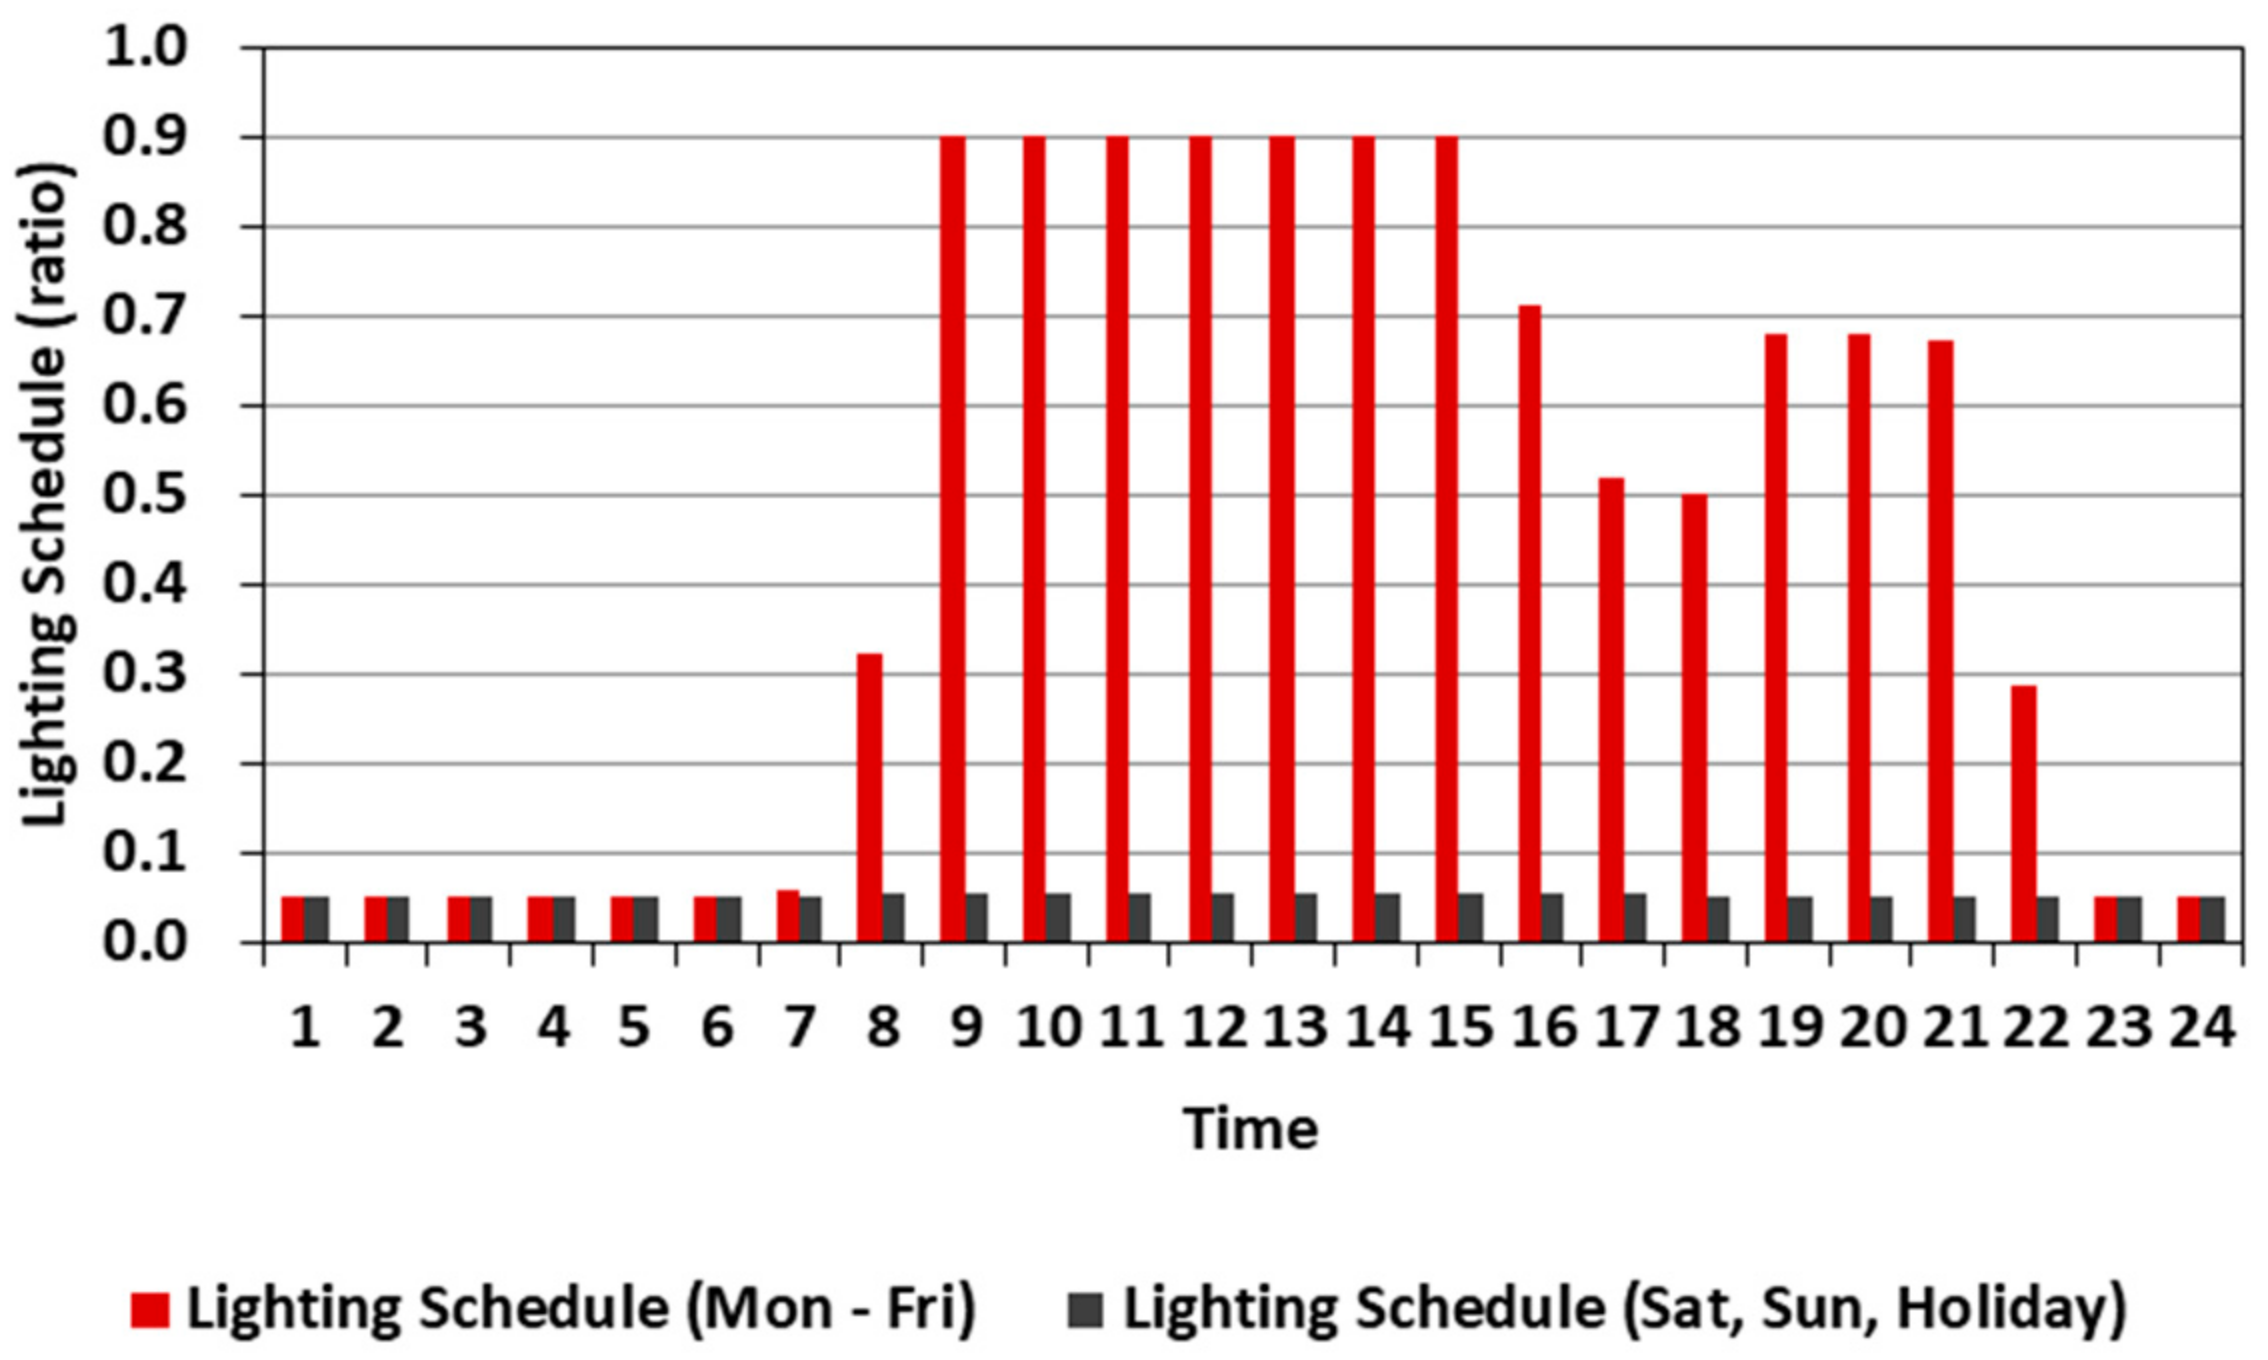
Figure 6.
Lighting schedules used for the office-building model.
Figure 6.
Lighting schedules used for the office-building model.
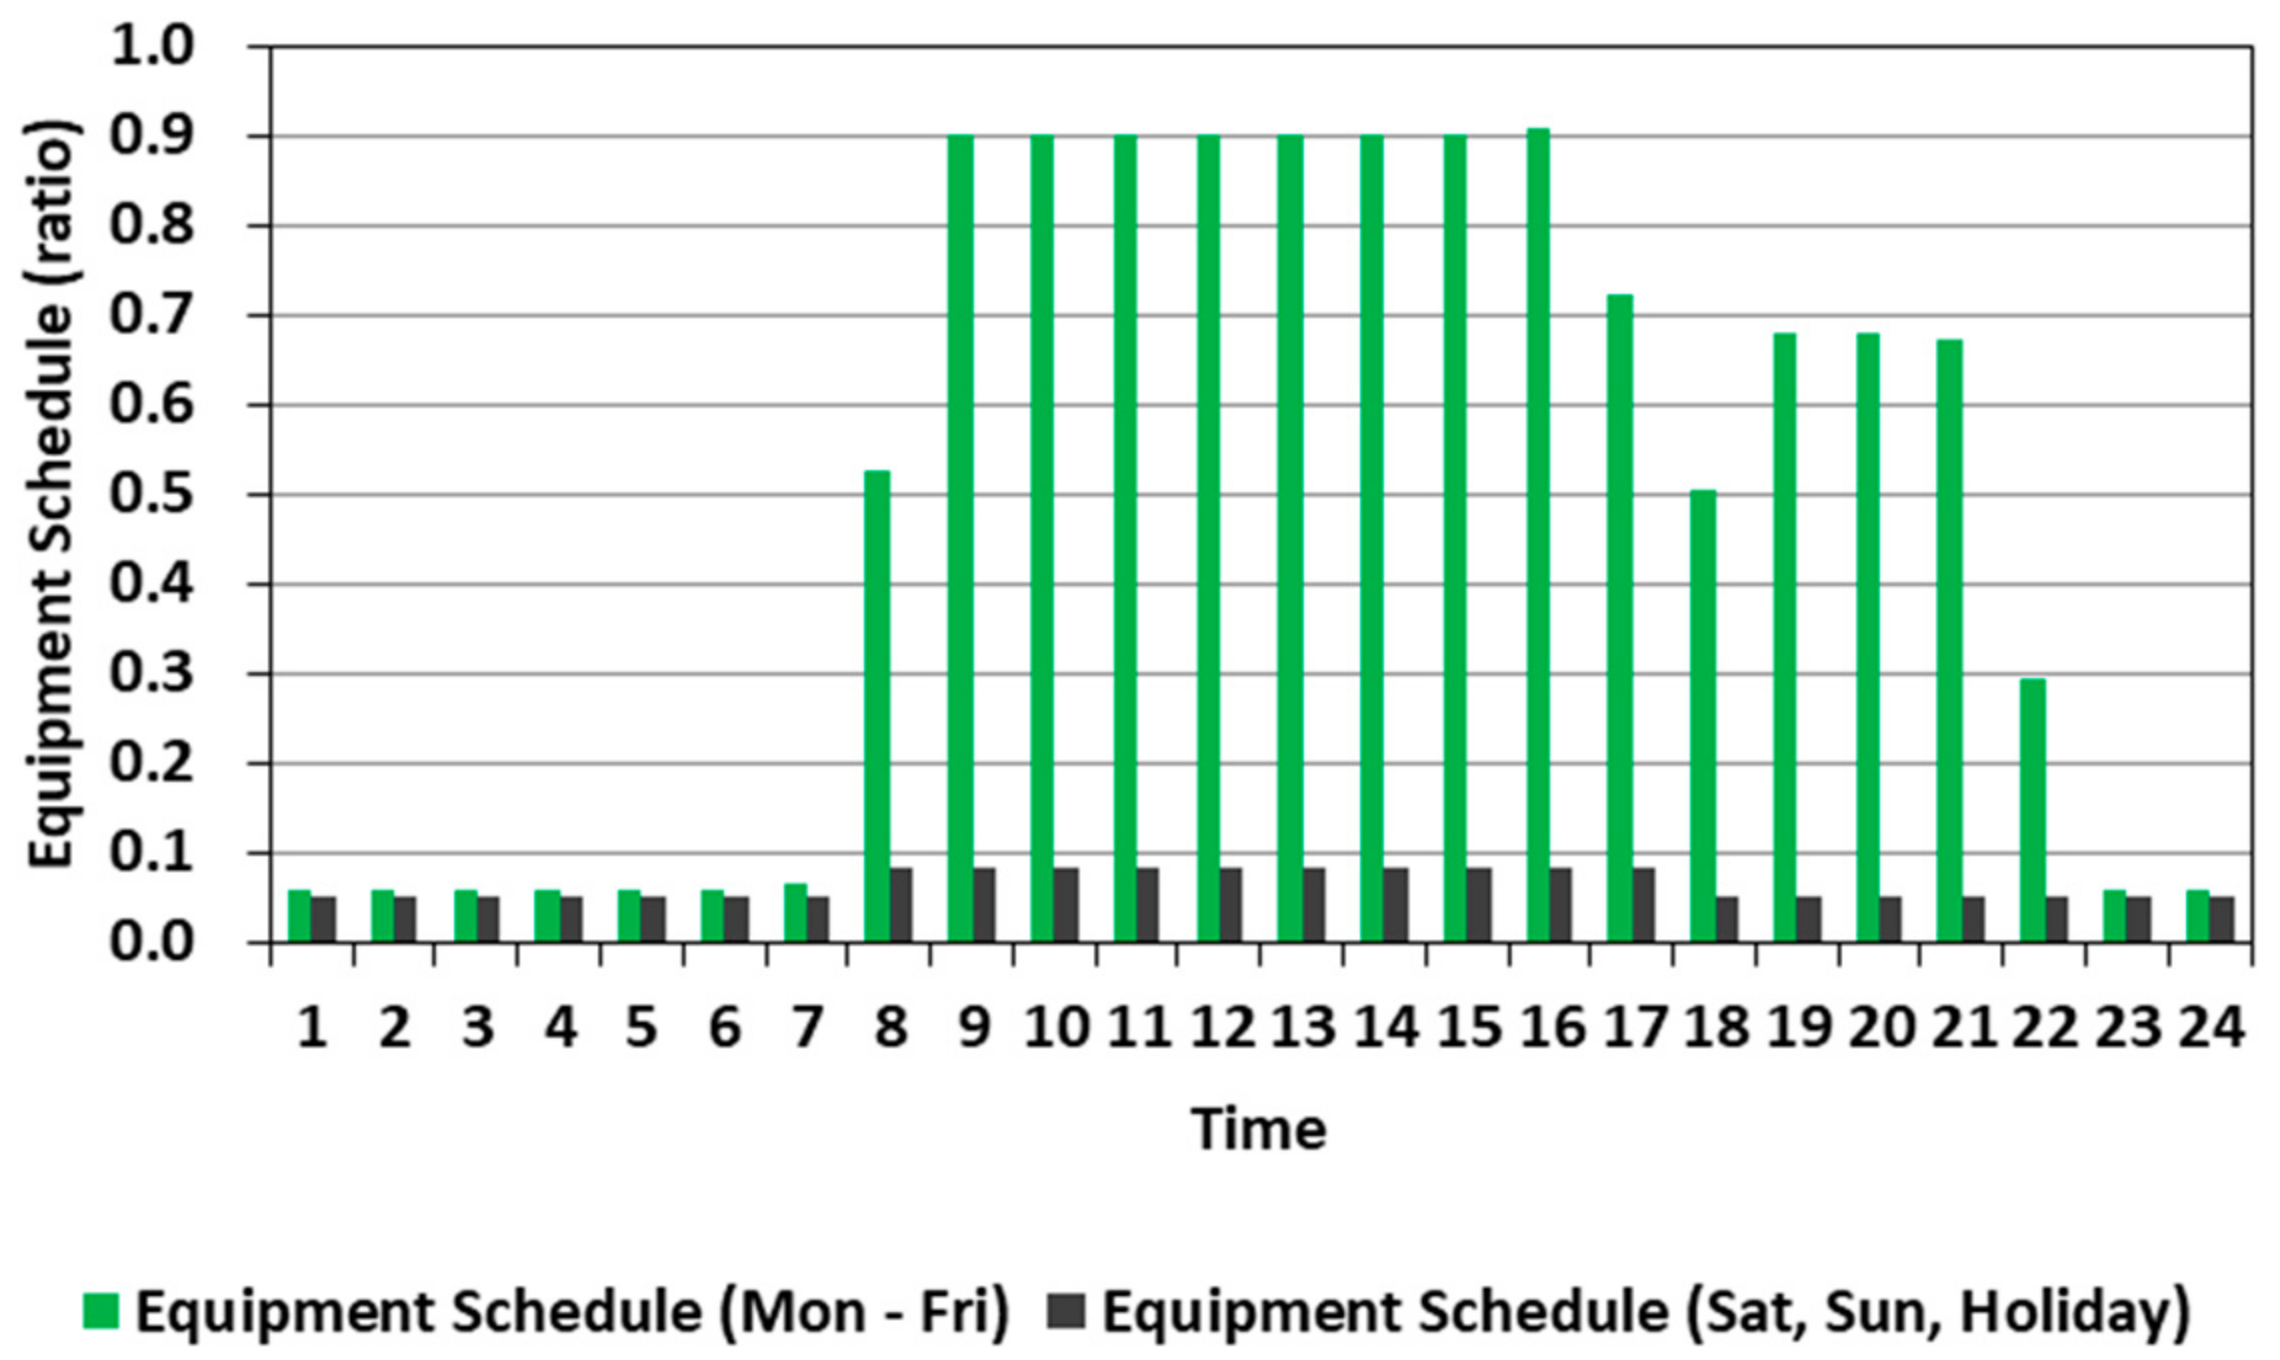
Figure 7.
Equipment schedules used for the office-building model.
Figure 7.
Equipment schedules used for the office-building model.
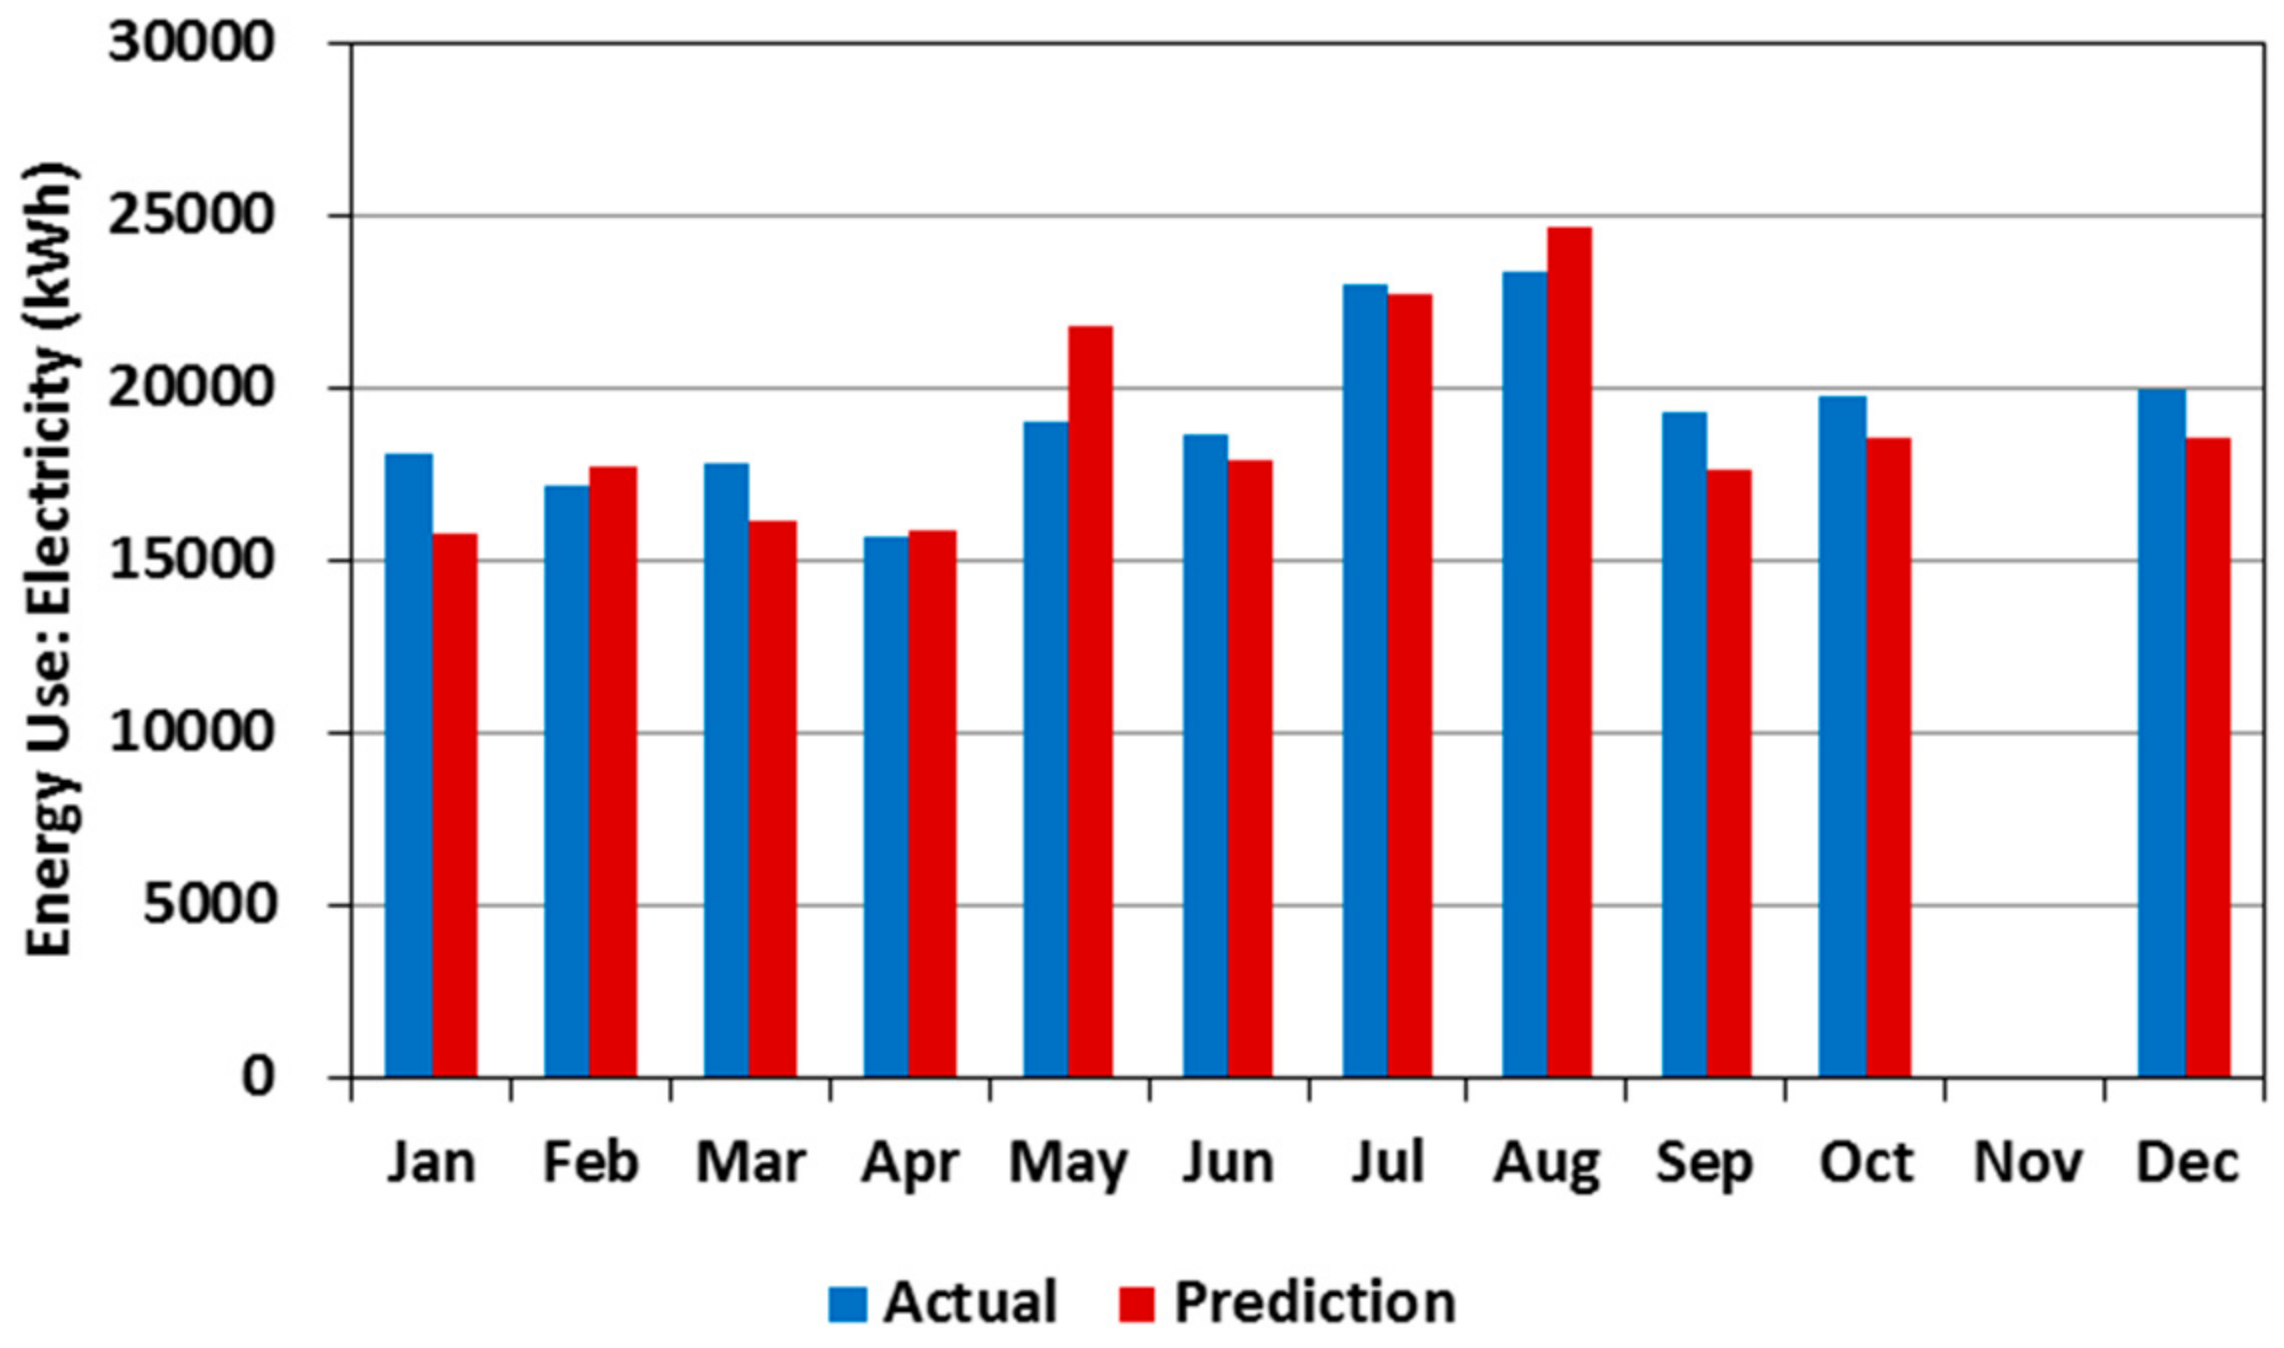
Figure 8.
Calibration results of electricity use for the office-building energy model.
Figure 8.
Calibration results of electricity use for the office-building energy model.
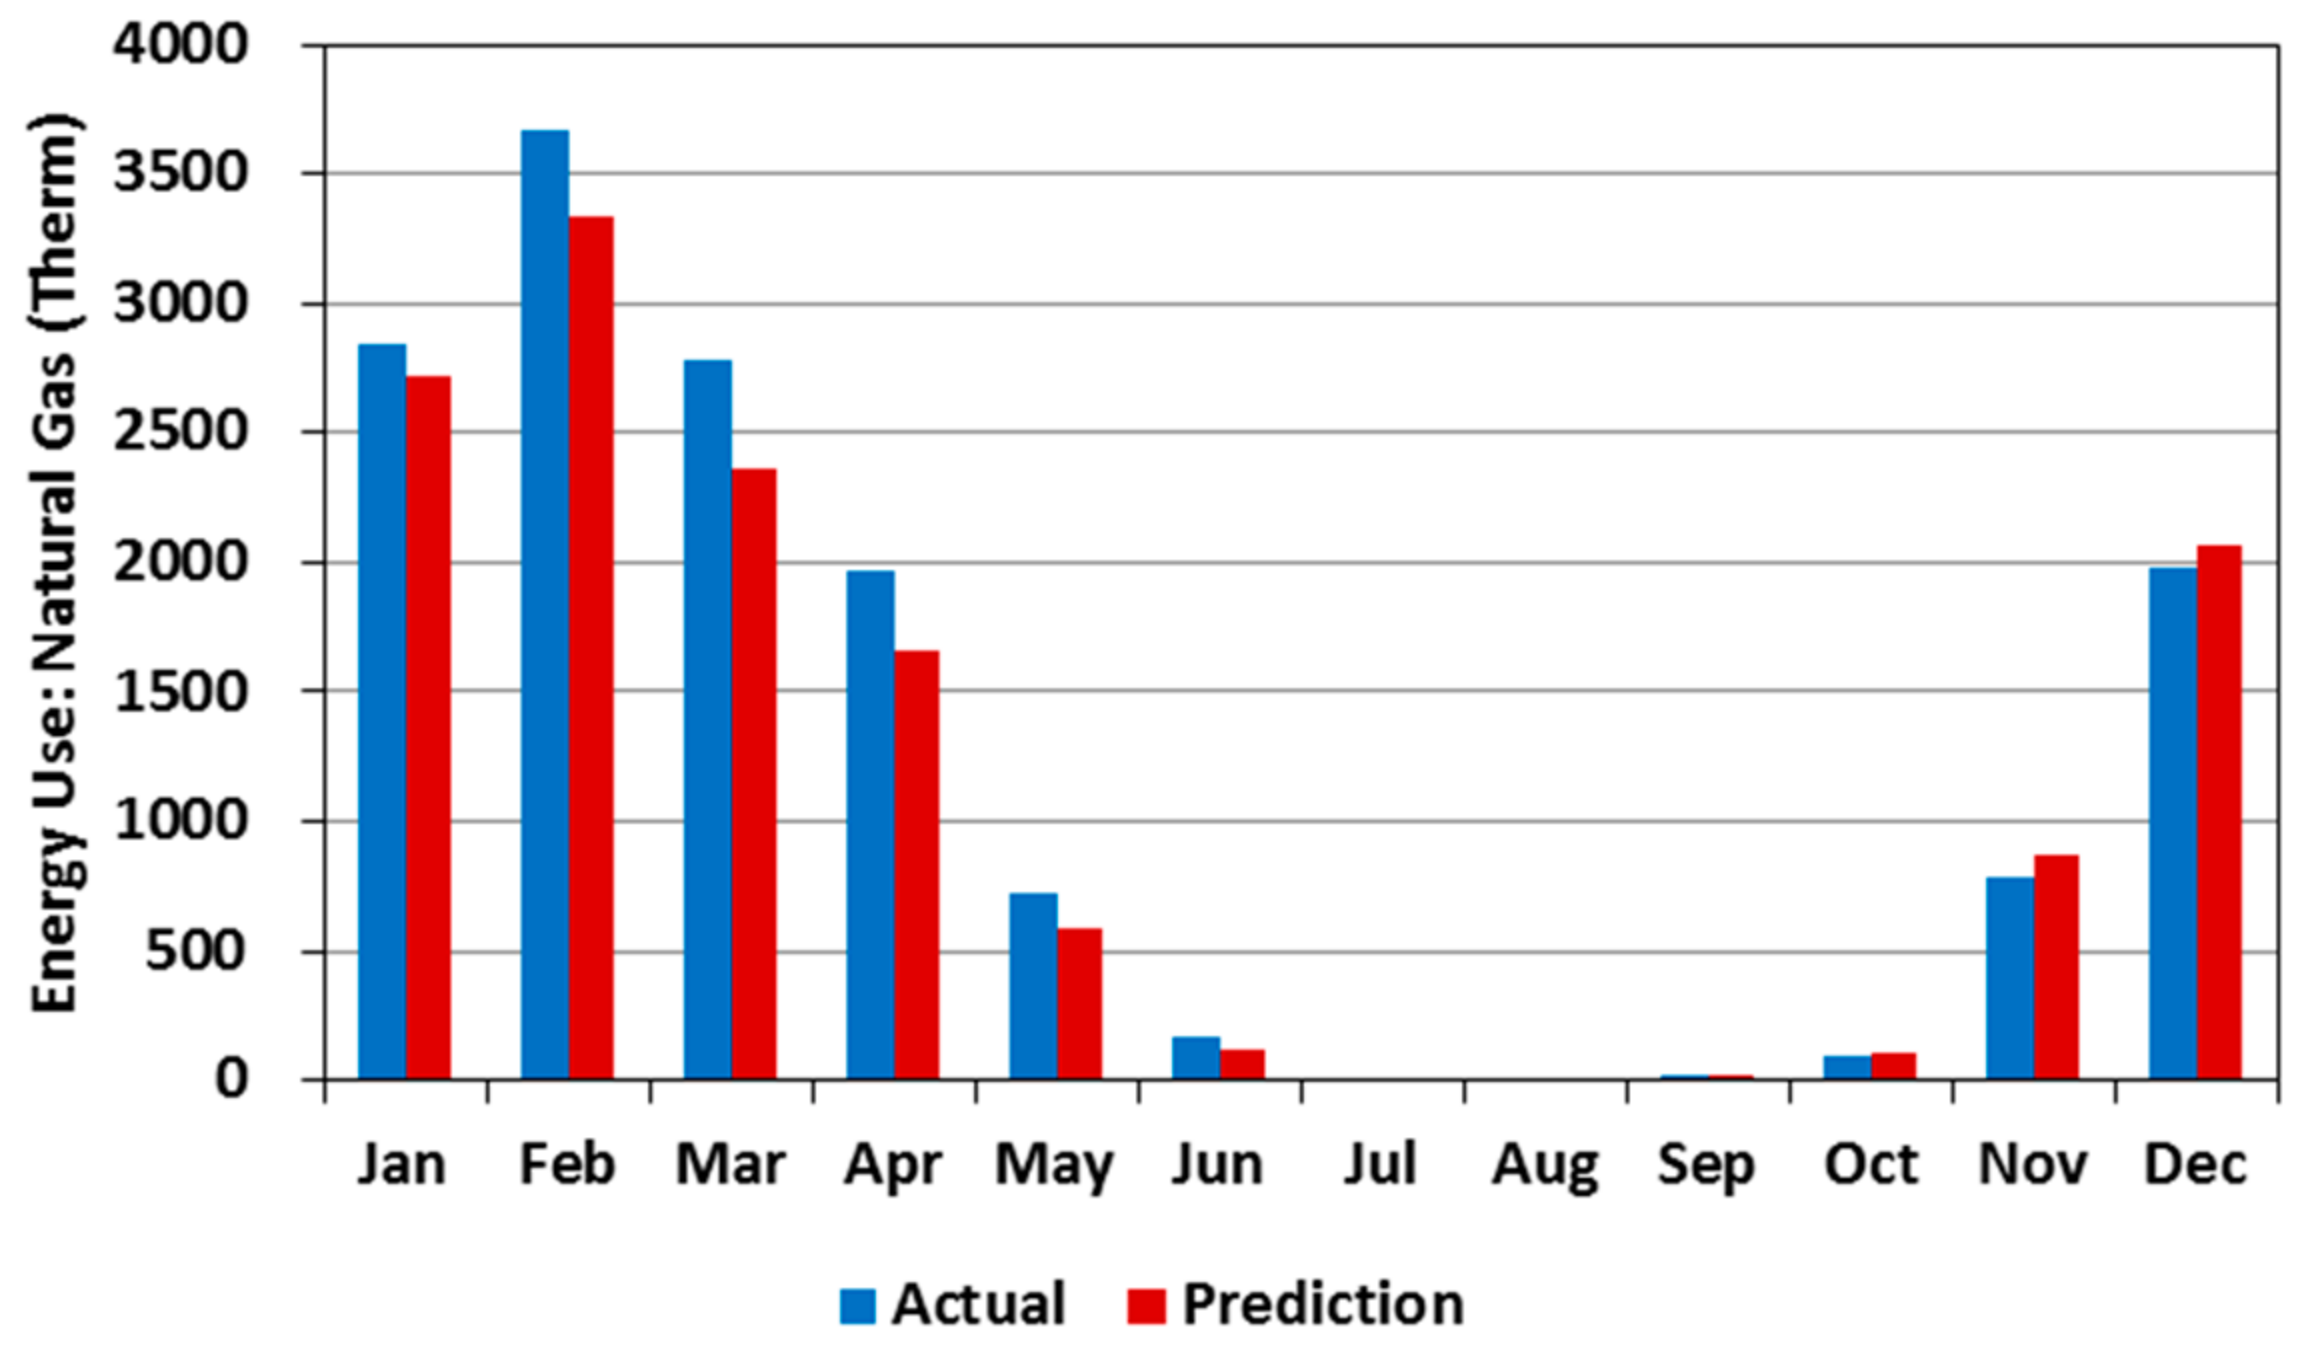
Figure 9.
Calibration results of natural gas consumption for the office-building energy model.
Figure 9.
Calibration results of natural gas consumption for the office-building energy model.
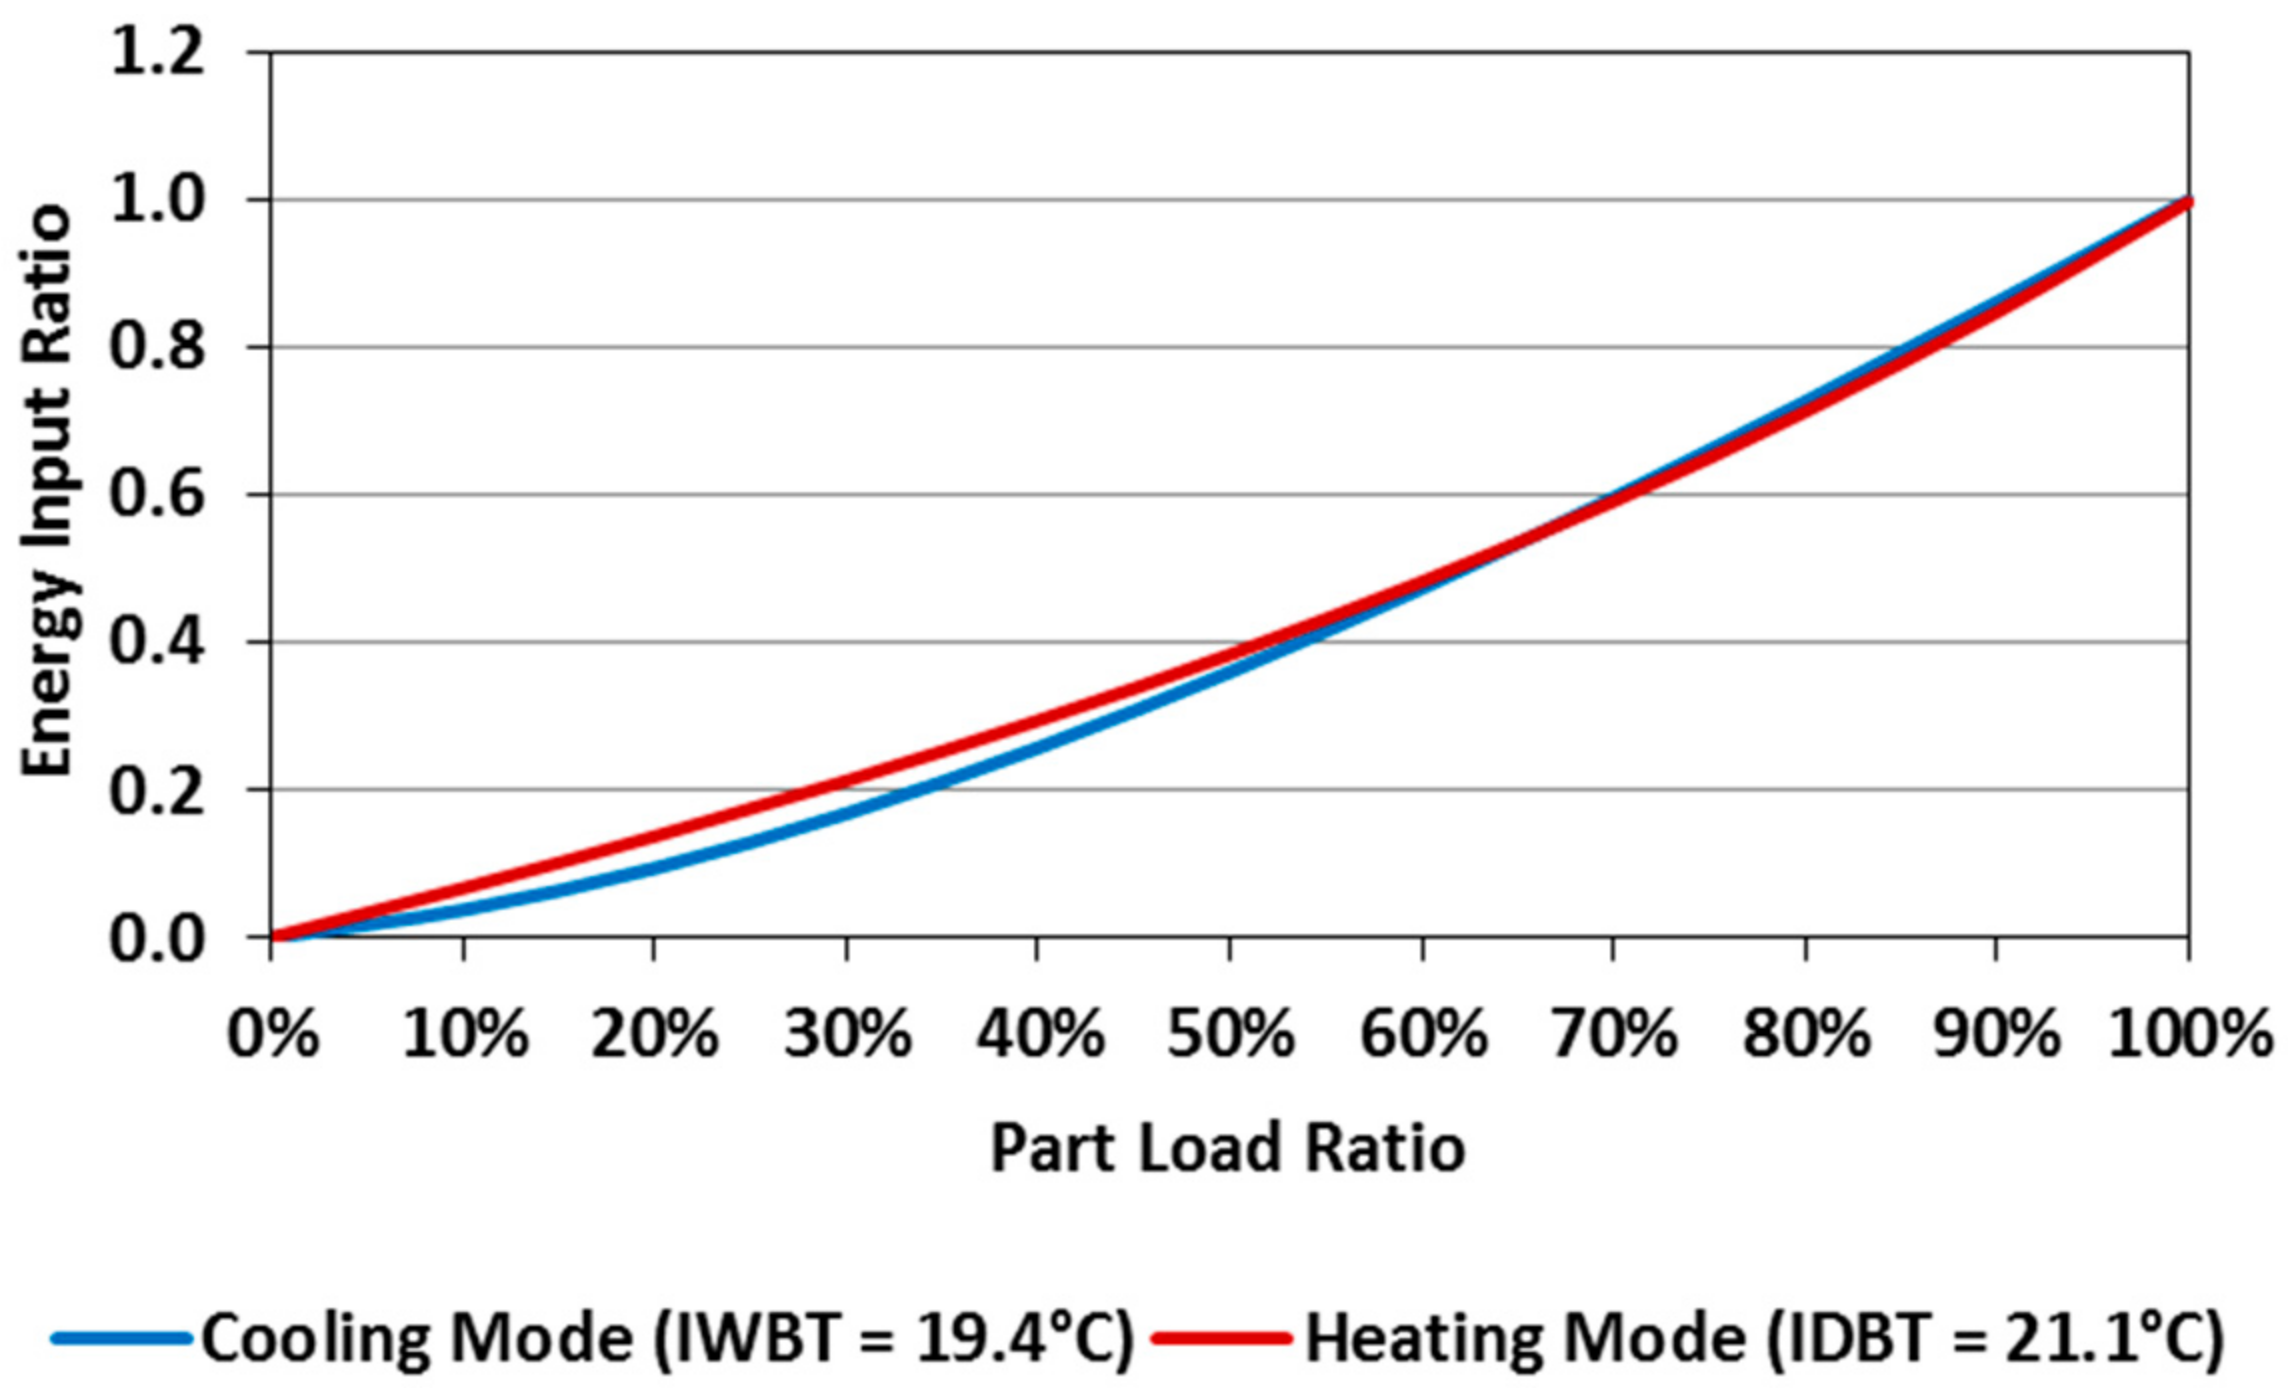
Figure 10.
Part-load performance curves of a water-source variable refrigerant flow (VRF) system for both heating and cooling modes.
Figure 10.
Part-load performance curves of a water-source variable refrigerant flow (VRF) system for both heating and cooling modes.
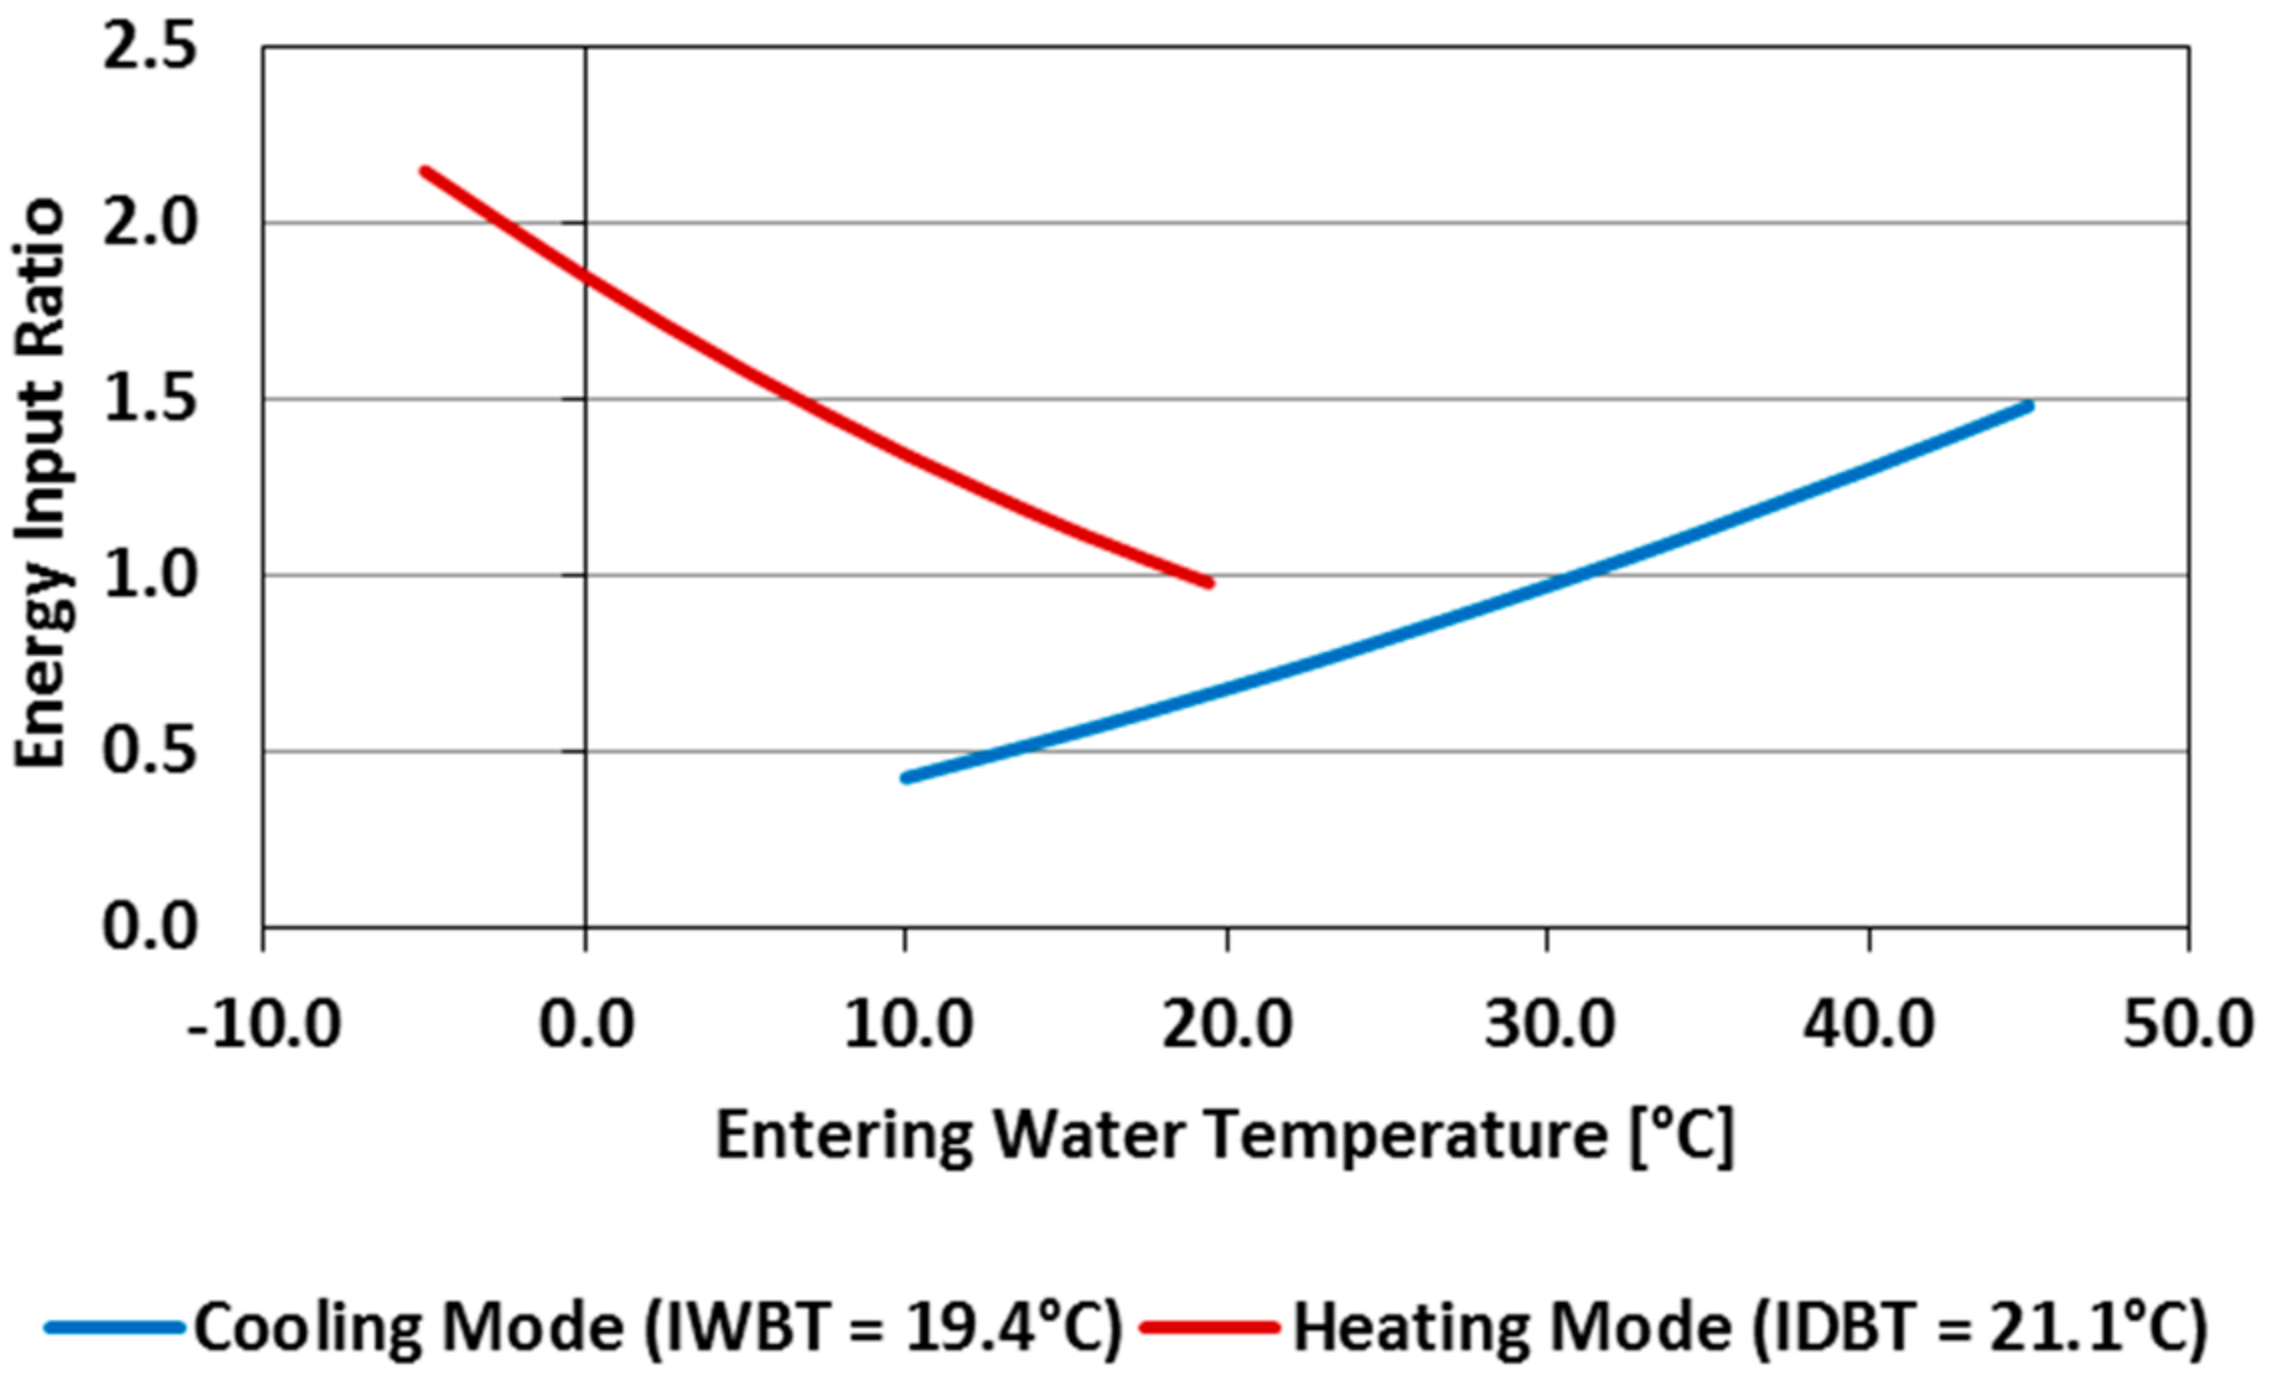
Figure 11.
Energy efficiency curves of a water-source variable refrigerant flow (VRF) system as a function of condensing medium temperature for both heating and cooling modes.
Figure 11.
Energy efficiency curves of a water-source variable refrigerant flow (VRF) system as a function of condensing medium temperature for both heating and cooling modes.
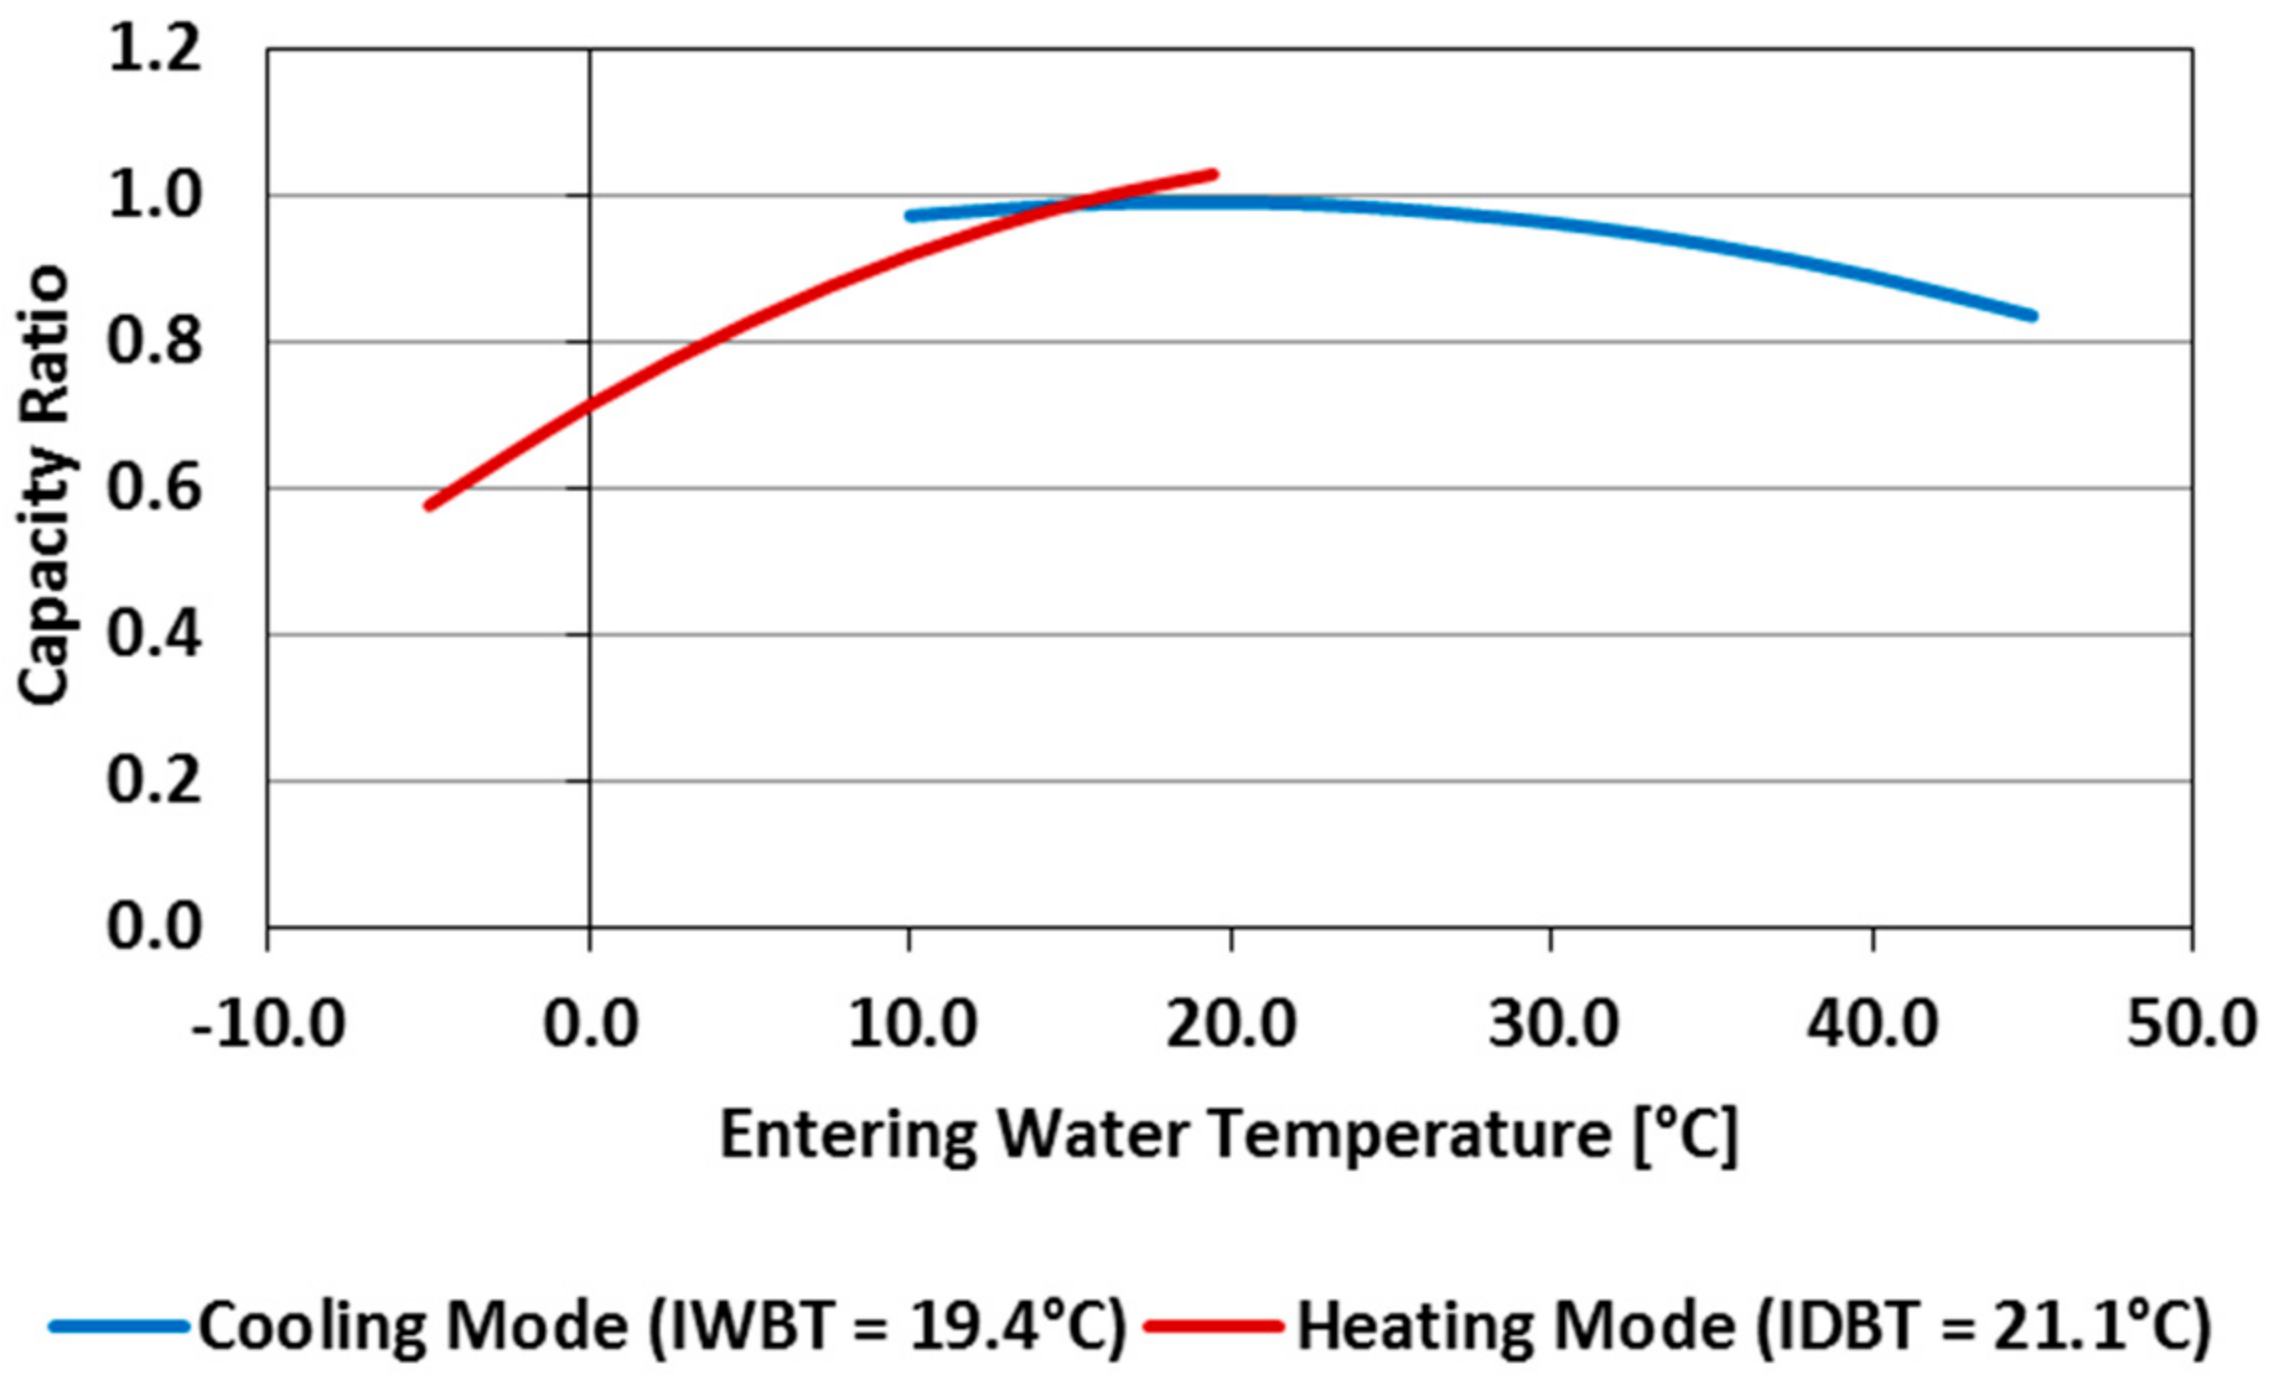
Figure 12.
Capacity curves of a water-source variable refrigerant flow (VRF) system as a function of condensing medium temperature for both heating and cooling modes.
Figure 12.
Capacity curves of a water-source variable refrigerant flow (VRF) system as a function of condensing medium temperature for both heating and cooling modes.
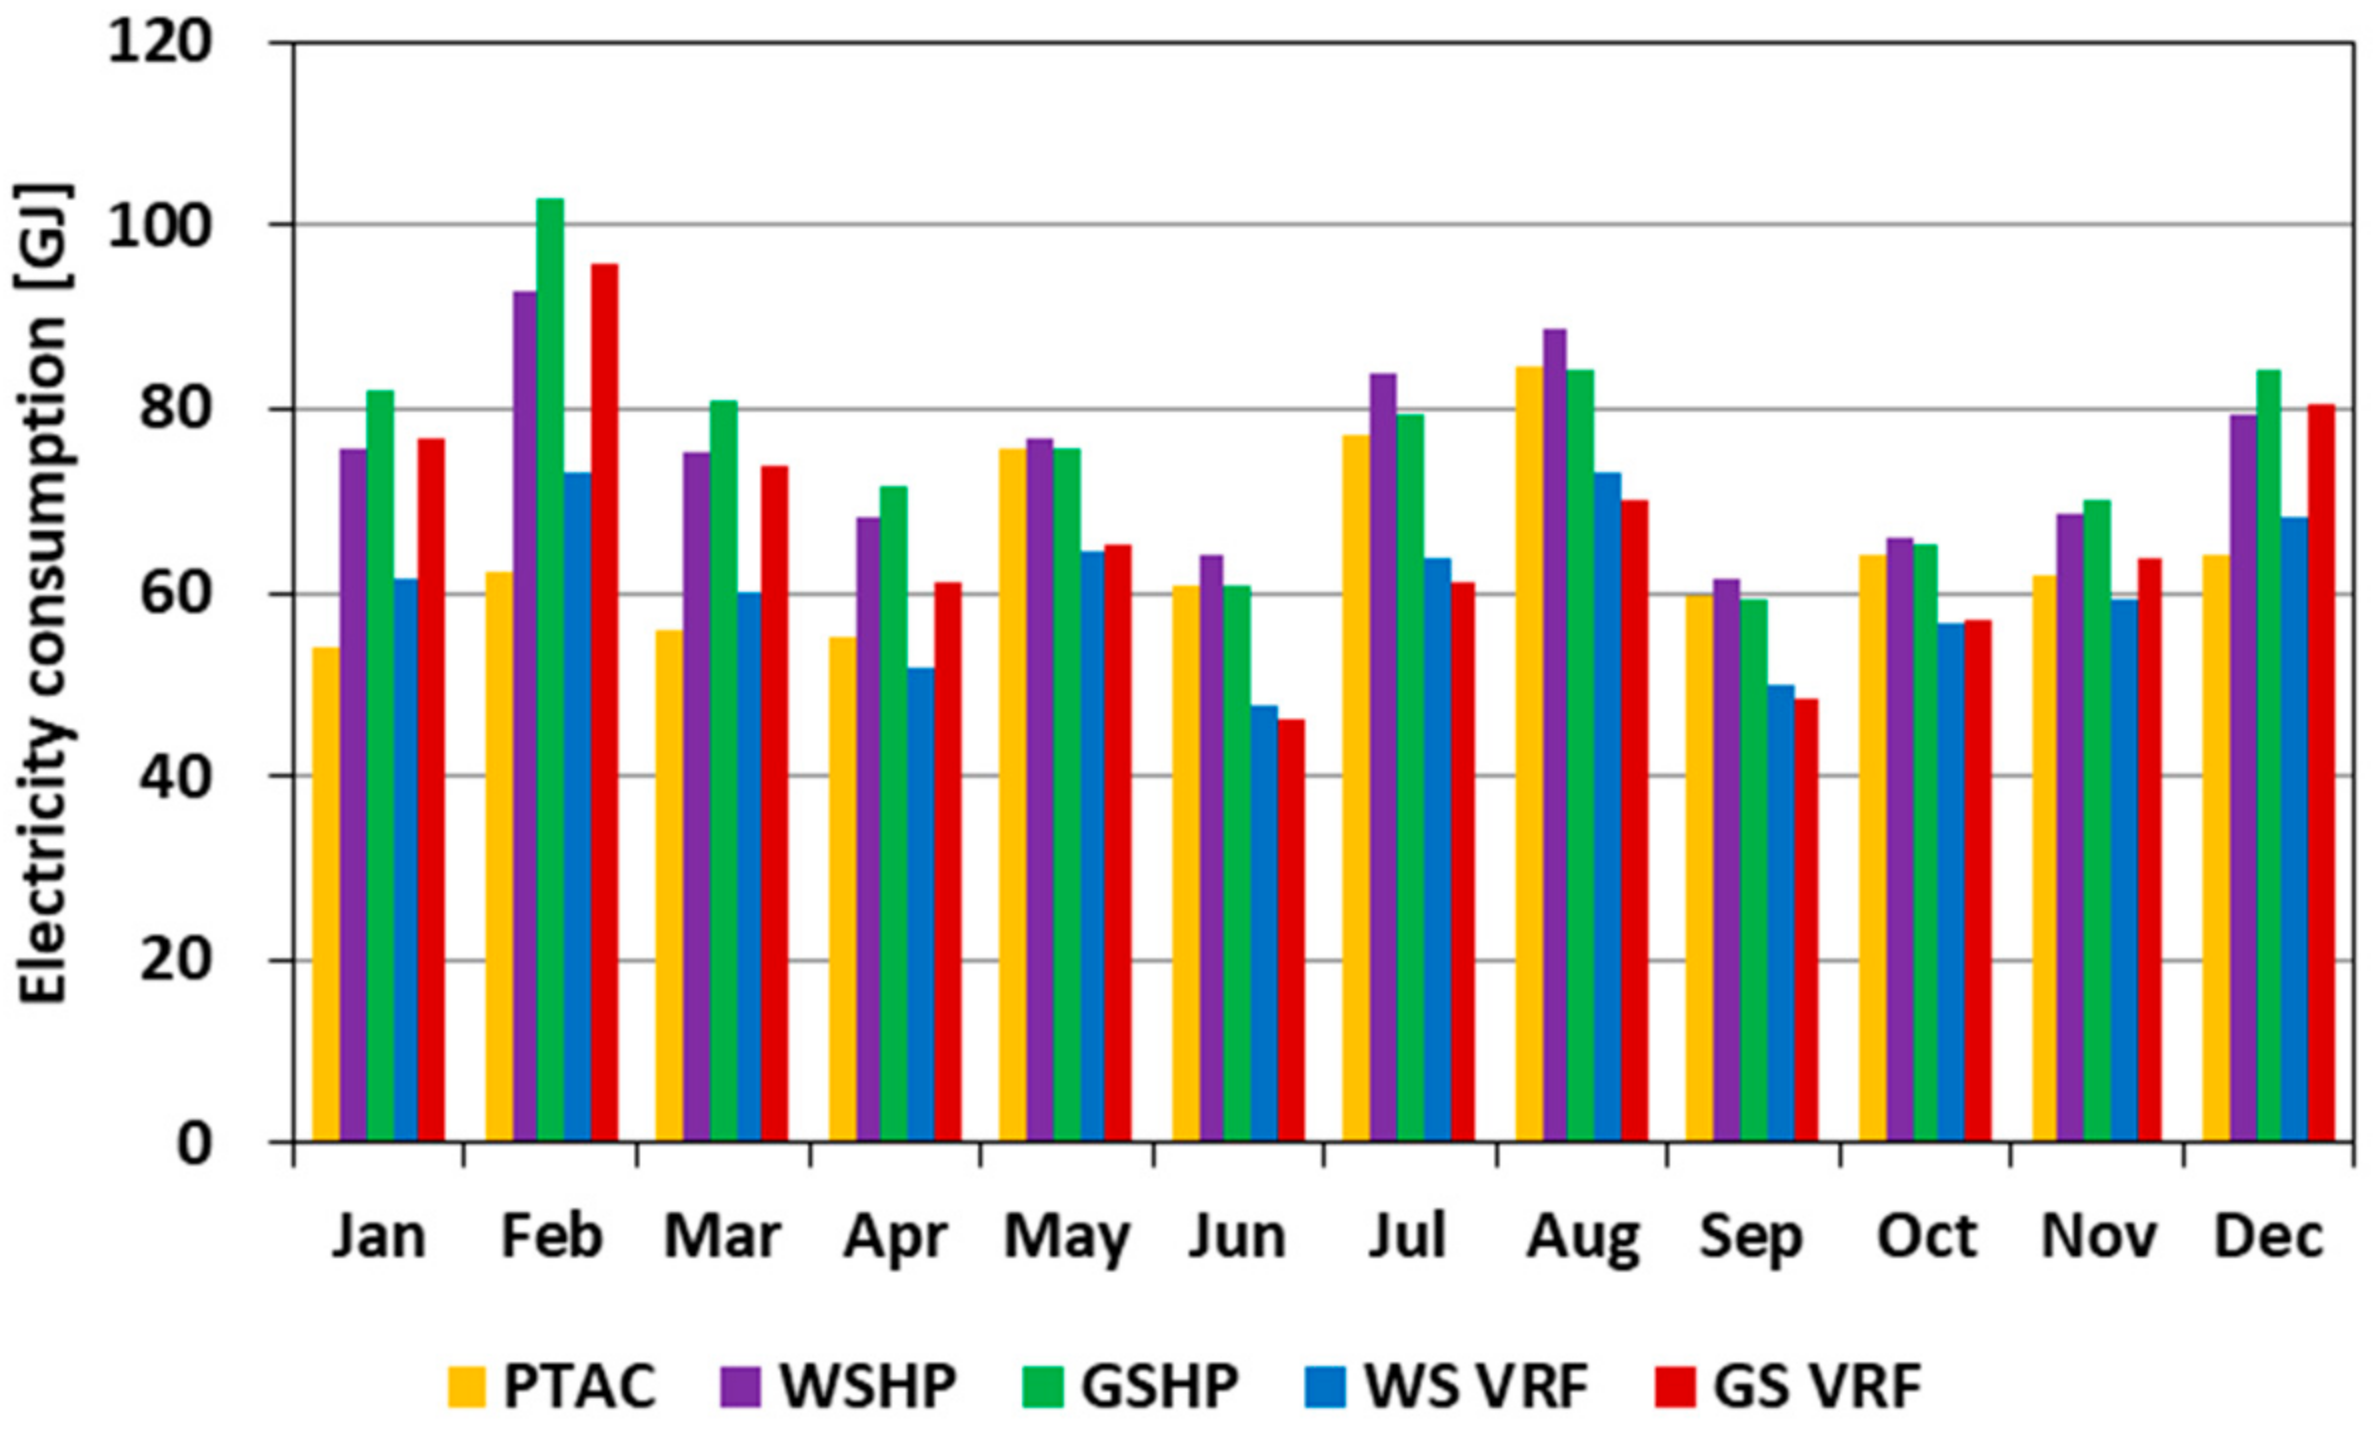
Figure 13.
Monthly electricity consumption of various heating, ventilating, and air-conditioning (HVAC) systems for the office building located in Barberton, OH.
Figure 13.
Monthly electricity consumption of various heating, ventilating, and air-conditioning (HVAC) systems for the office building located in Barberton, OH.
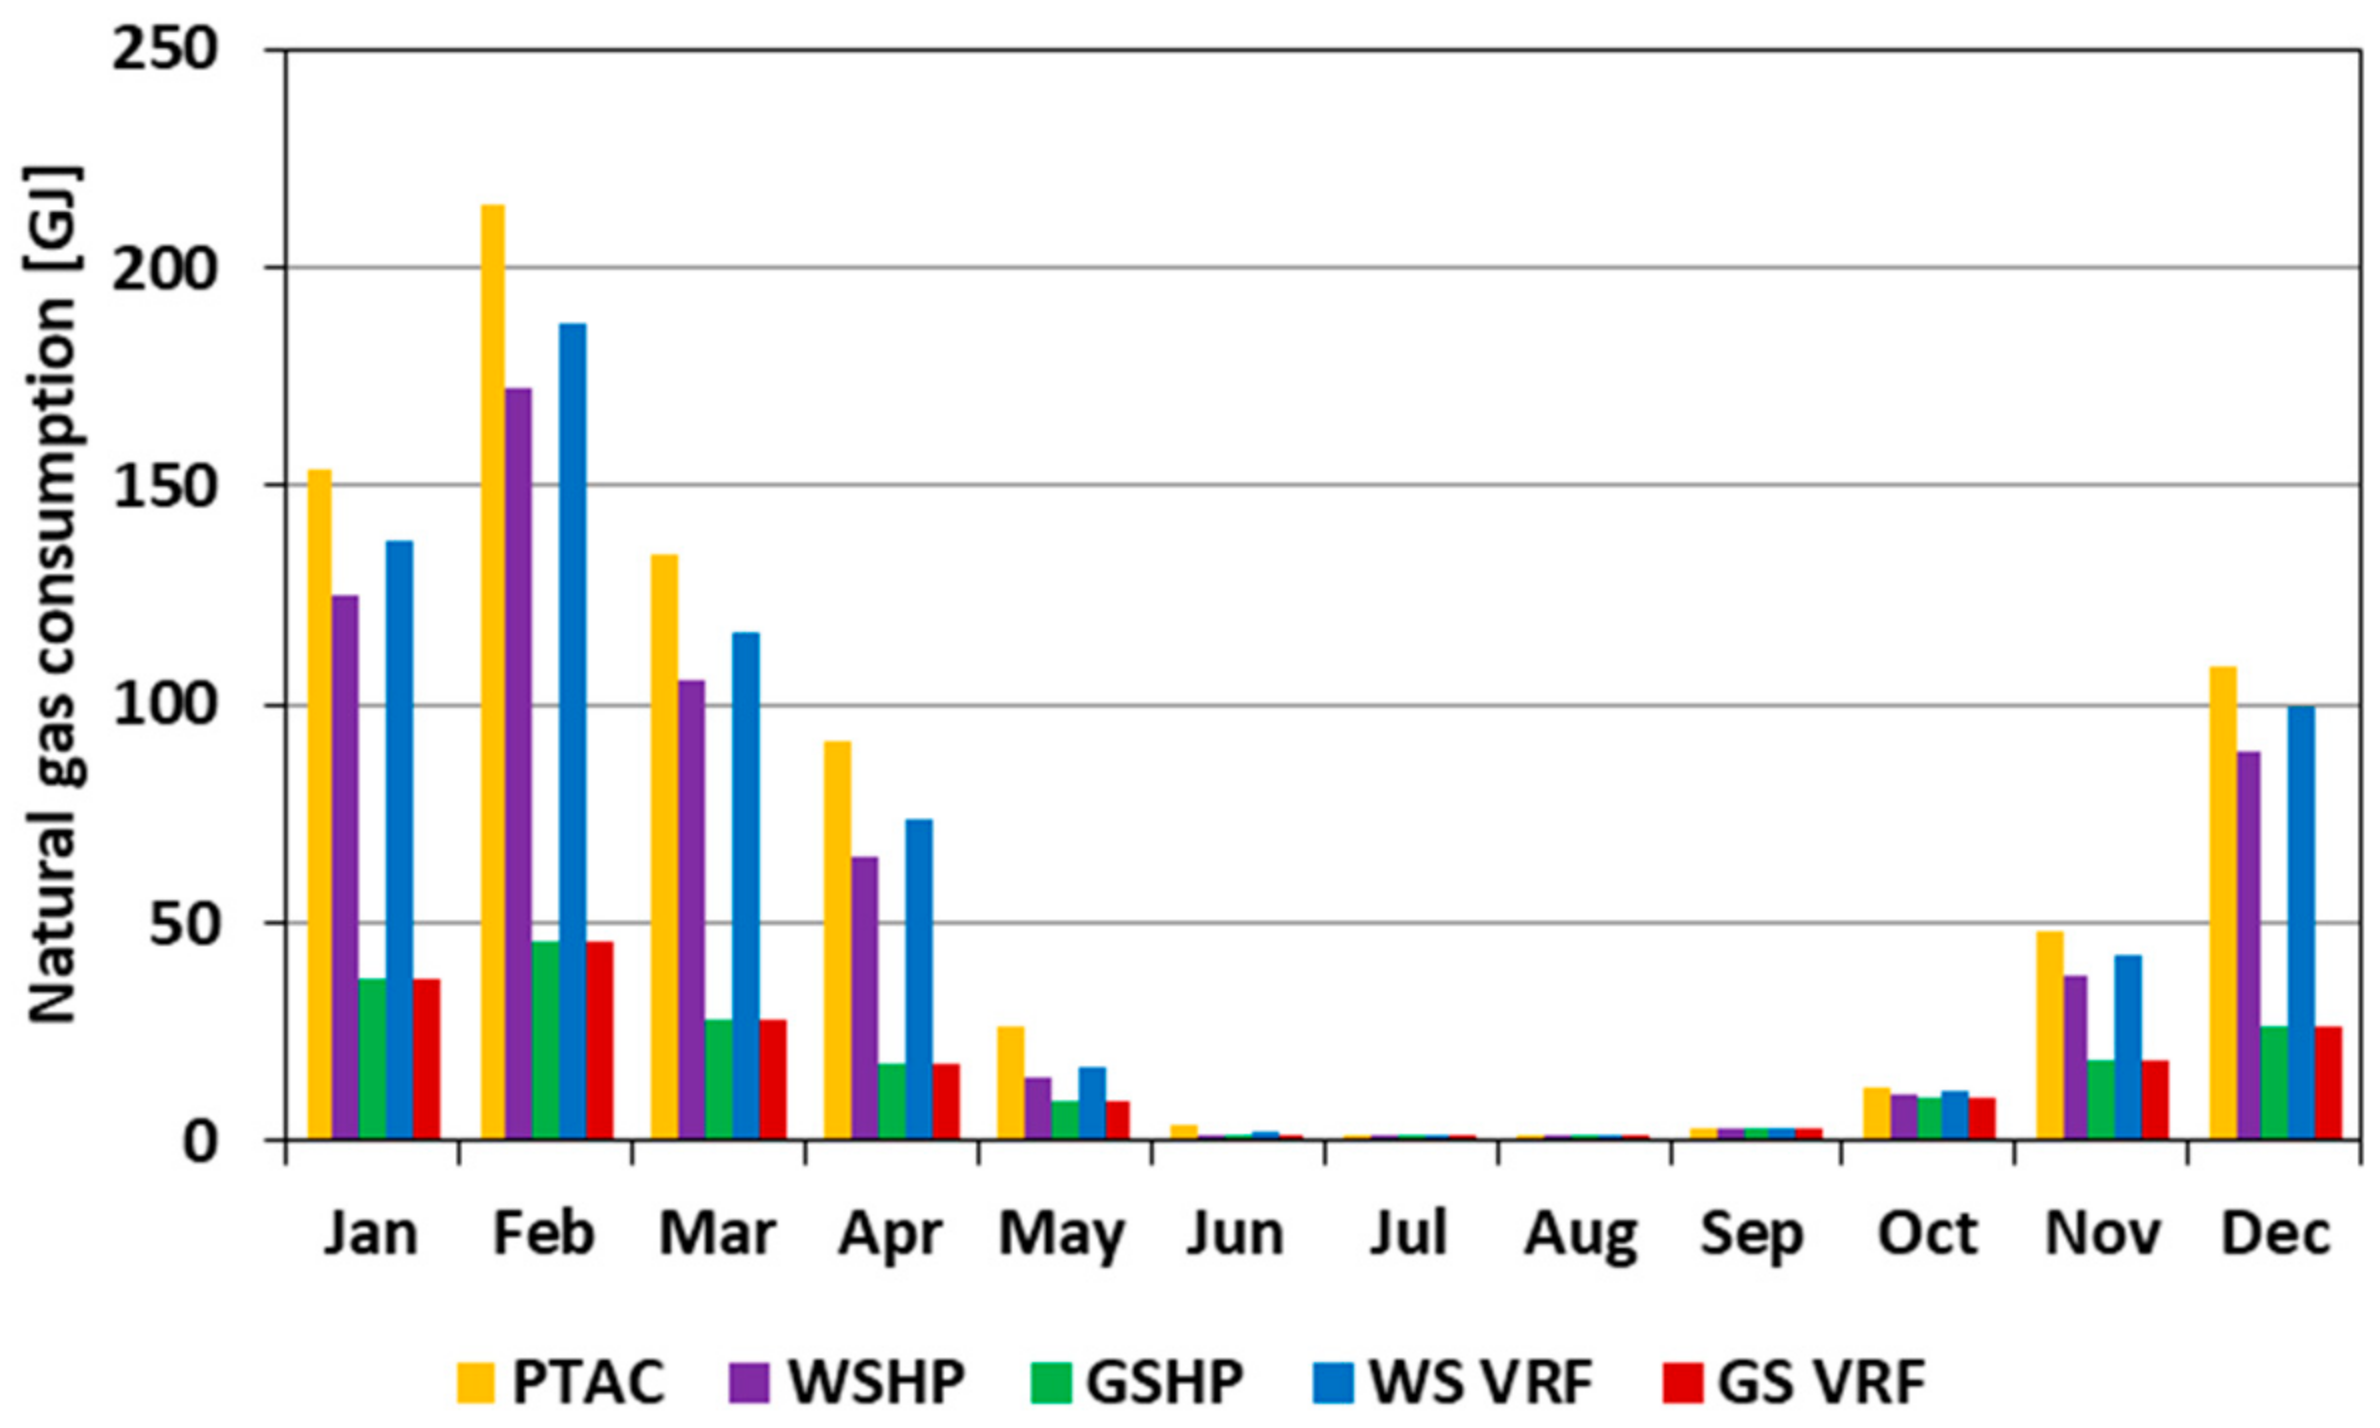
Figure 14.
Monthly natural gas consumption of various heating, ventilating, and air-conditioning (HVAC) systems for the office building in Barberton, OH.
Figure 14.
Monthly natural gas consumption of various heating, ventilating, and air-conditioning (HVAC) systems for the office building in Barberton, OH.
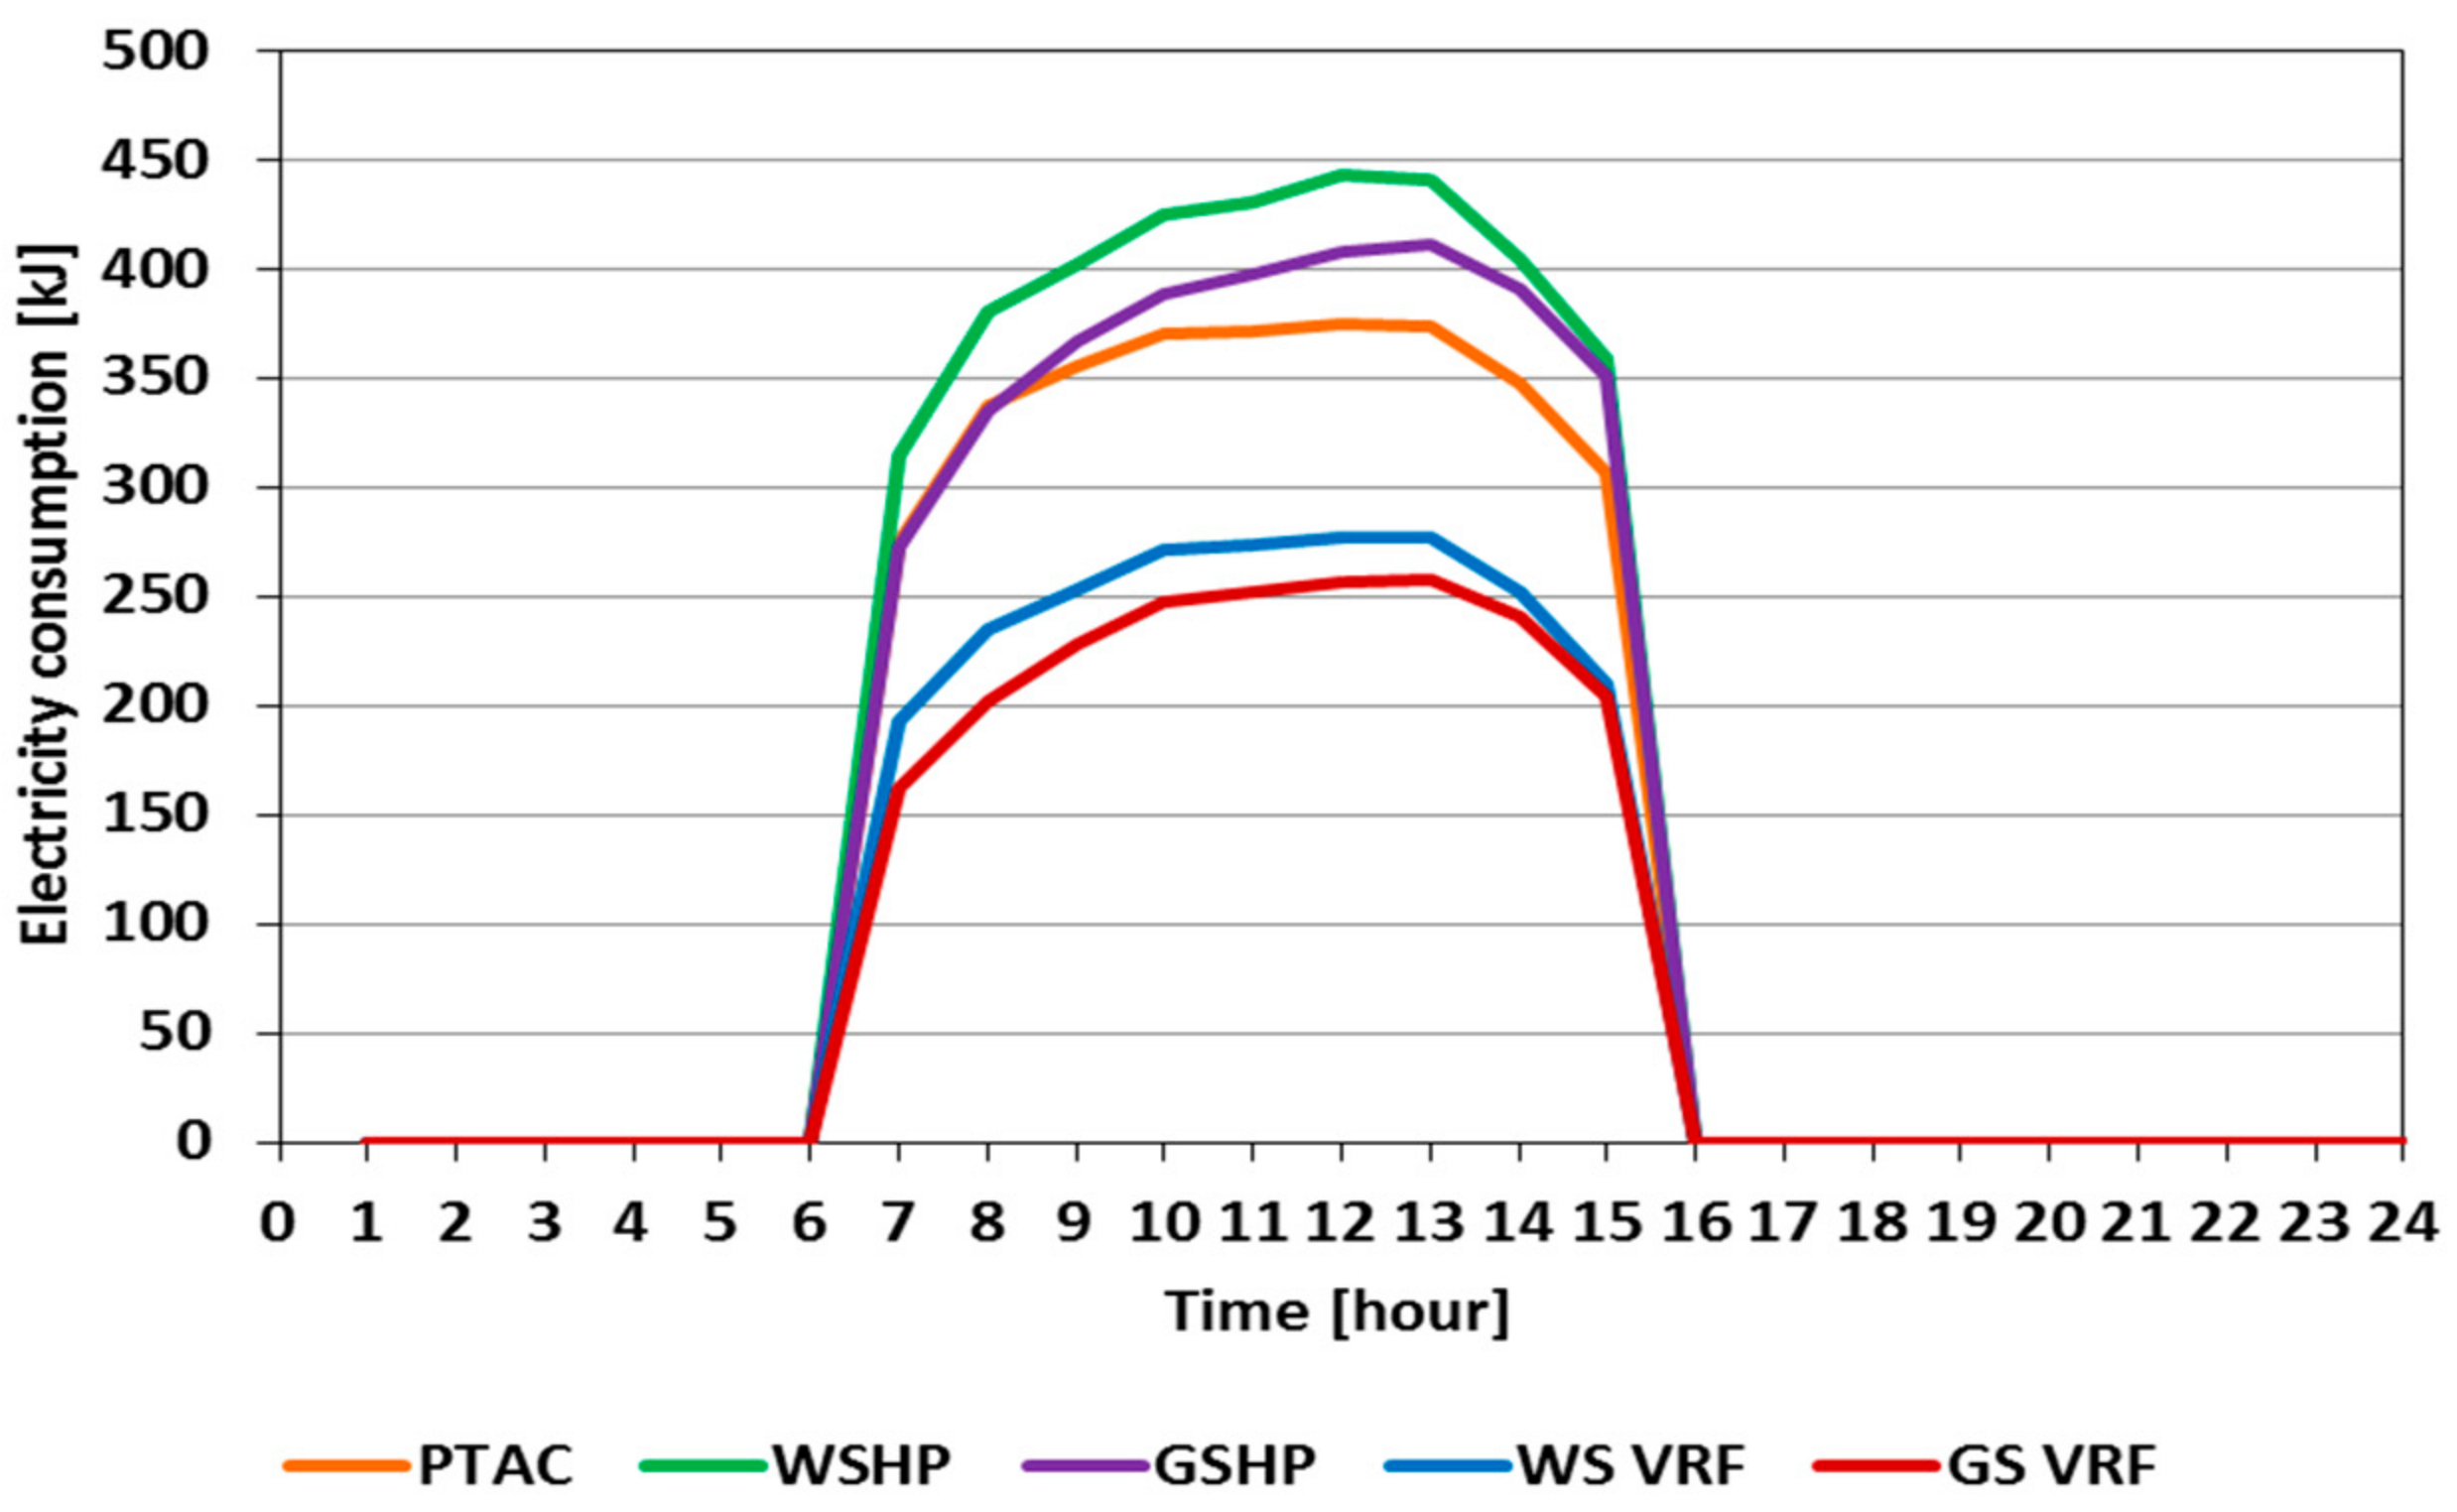
Figure 15.
Hourly electricity use for various heating, ventilating, and air-conditioning (HVAC) systems during the cooling design day (July 21) for the office building in Barberton, OH.
Figure 15.
Hourly electricity use for various heating, ventilating, and air-conditioning (HVAC) systems during the cooling design day (July 21) for the office building in Barberton, OH.
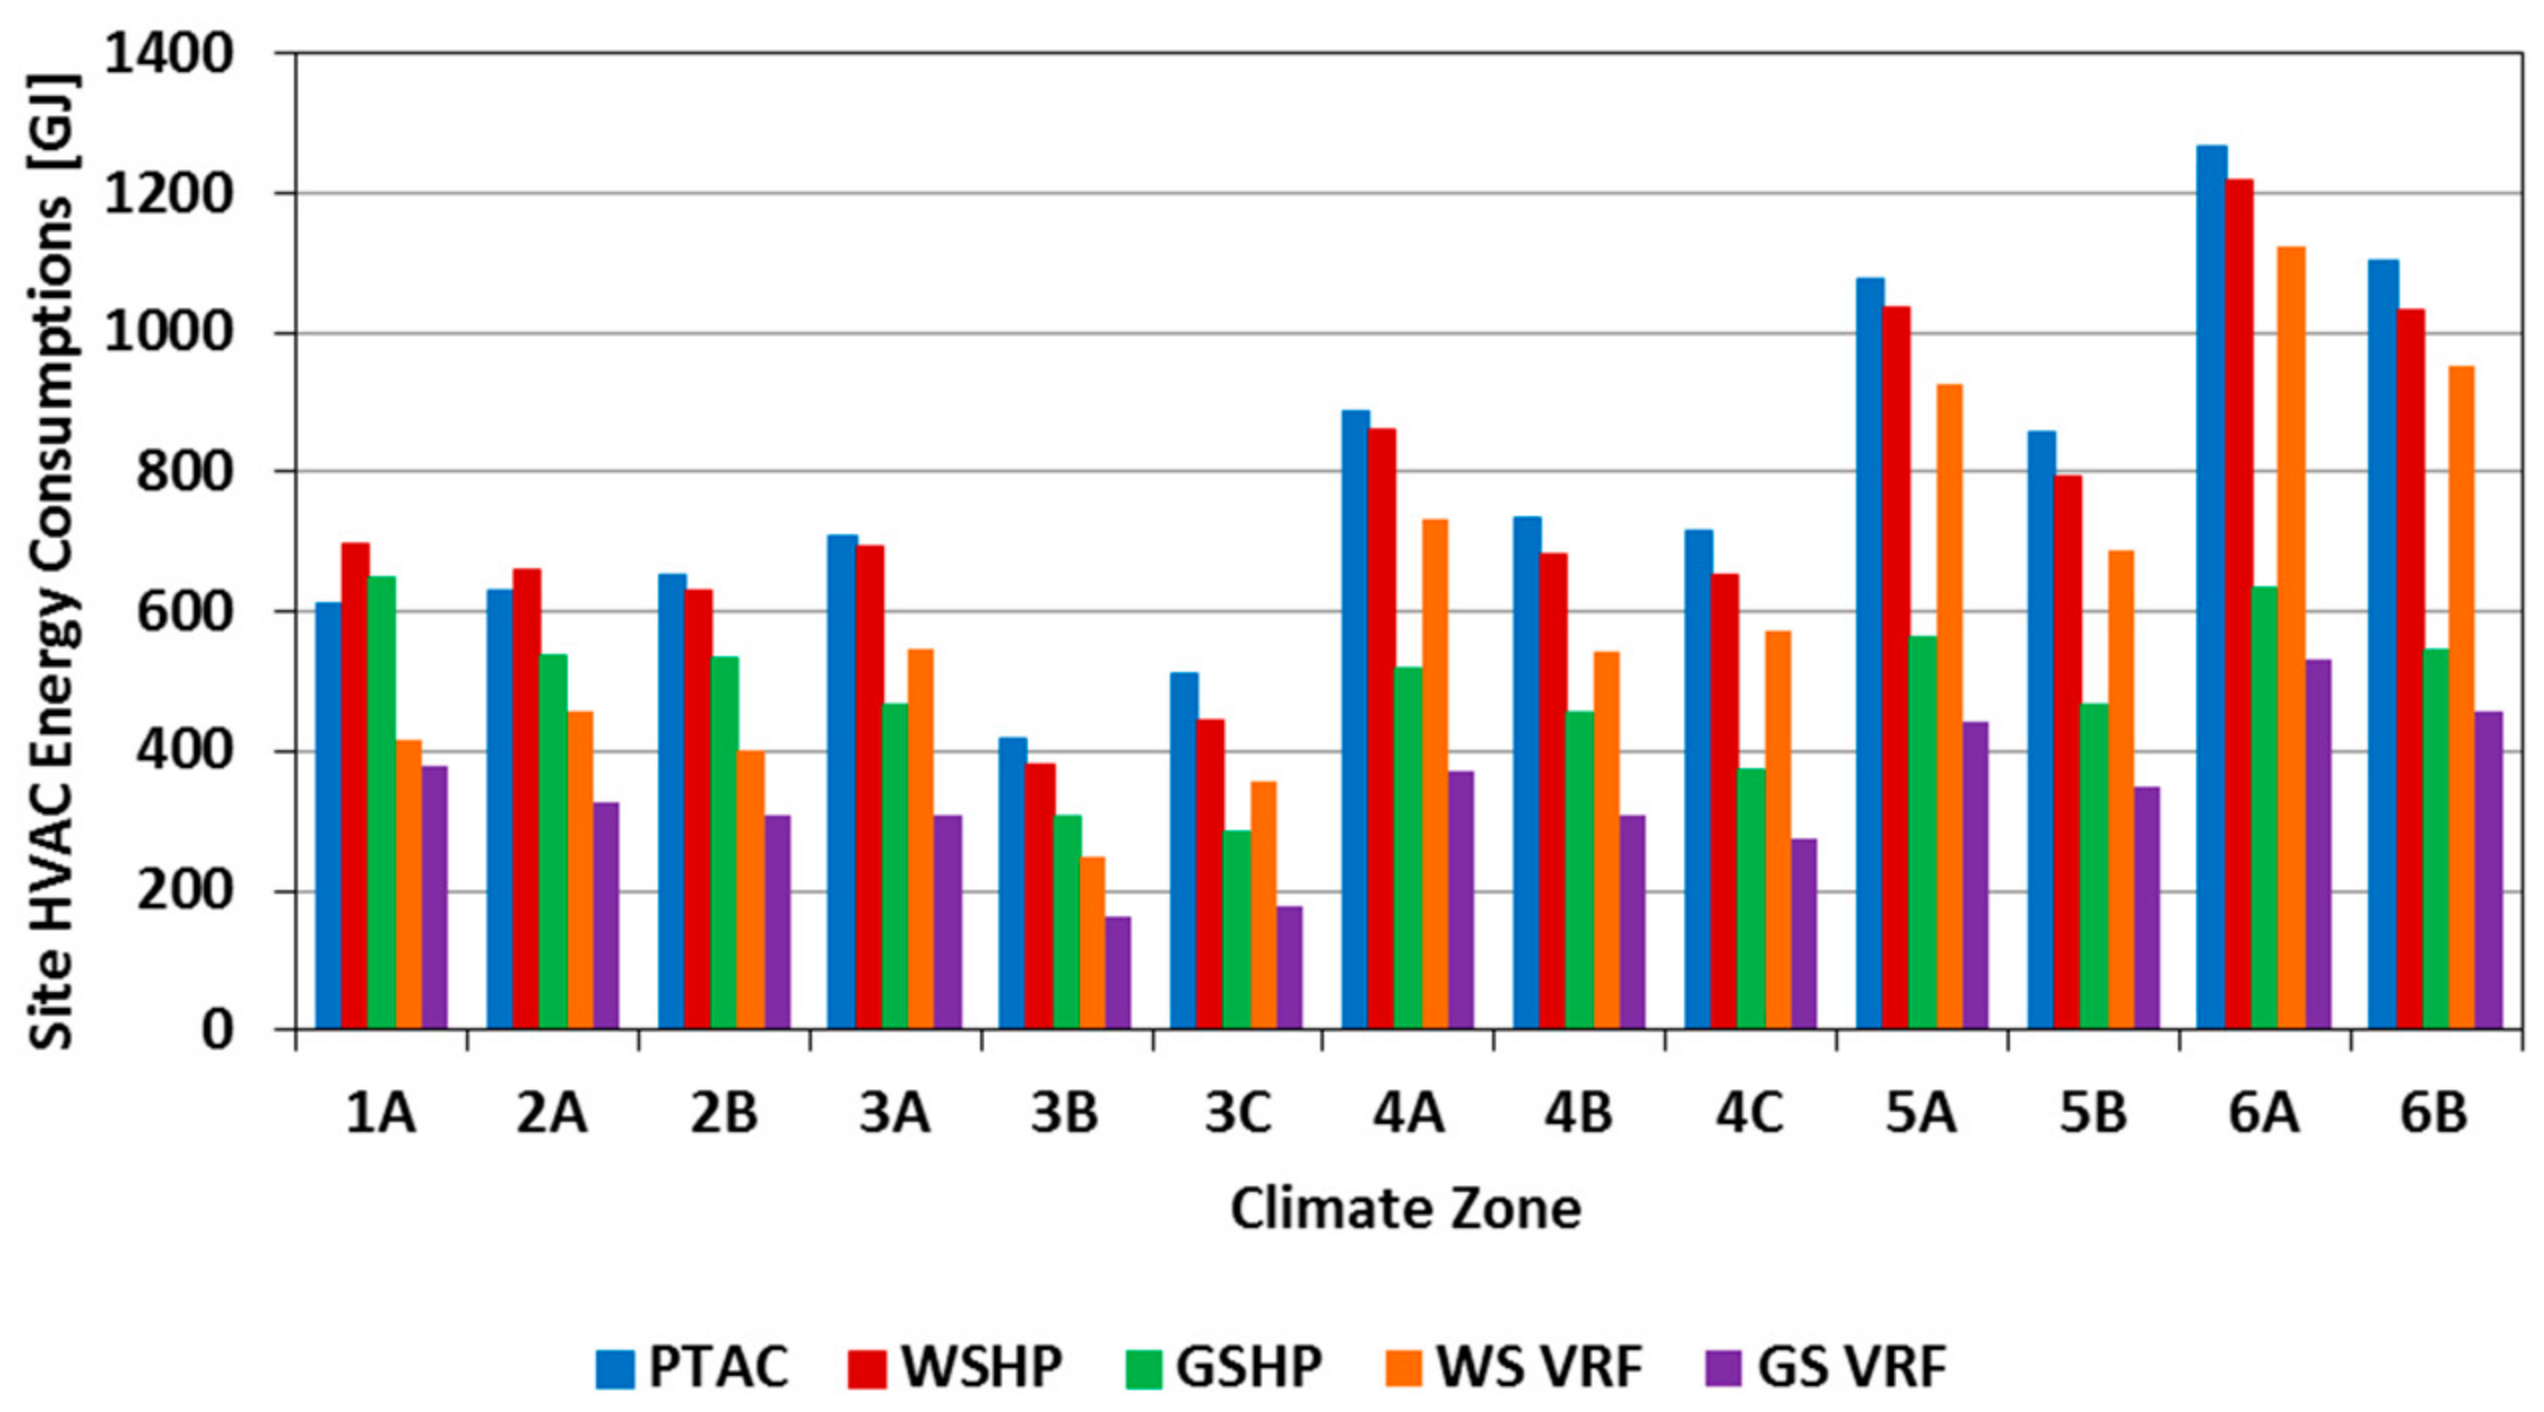
Figure 16.
Site heating, ventilating, and air-conditioning (HVAC) energy use for baseline office-building models in various U.S. climate zones.
Figure 16.
Site heating, ventilating, and air-conditioning (HVAC) energy use for baseline office-building models in various U.S. climate zones.
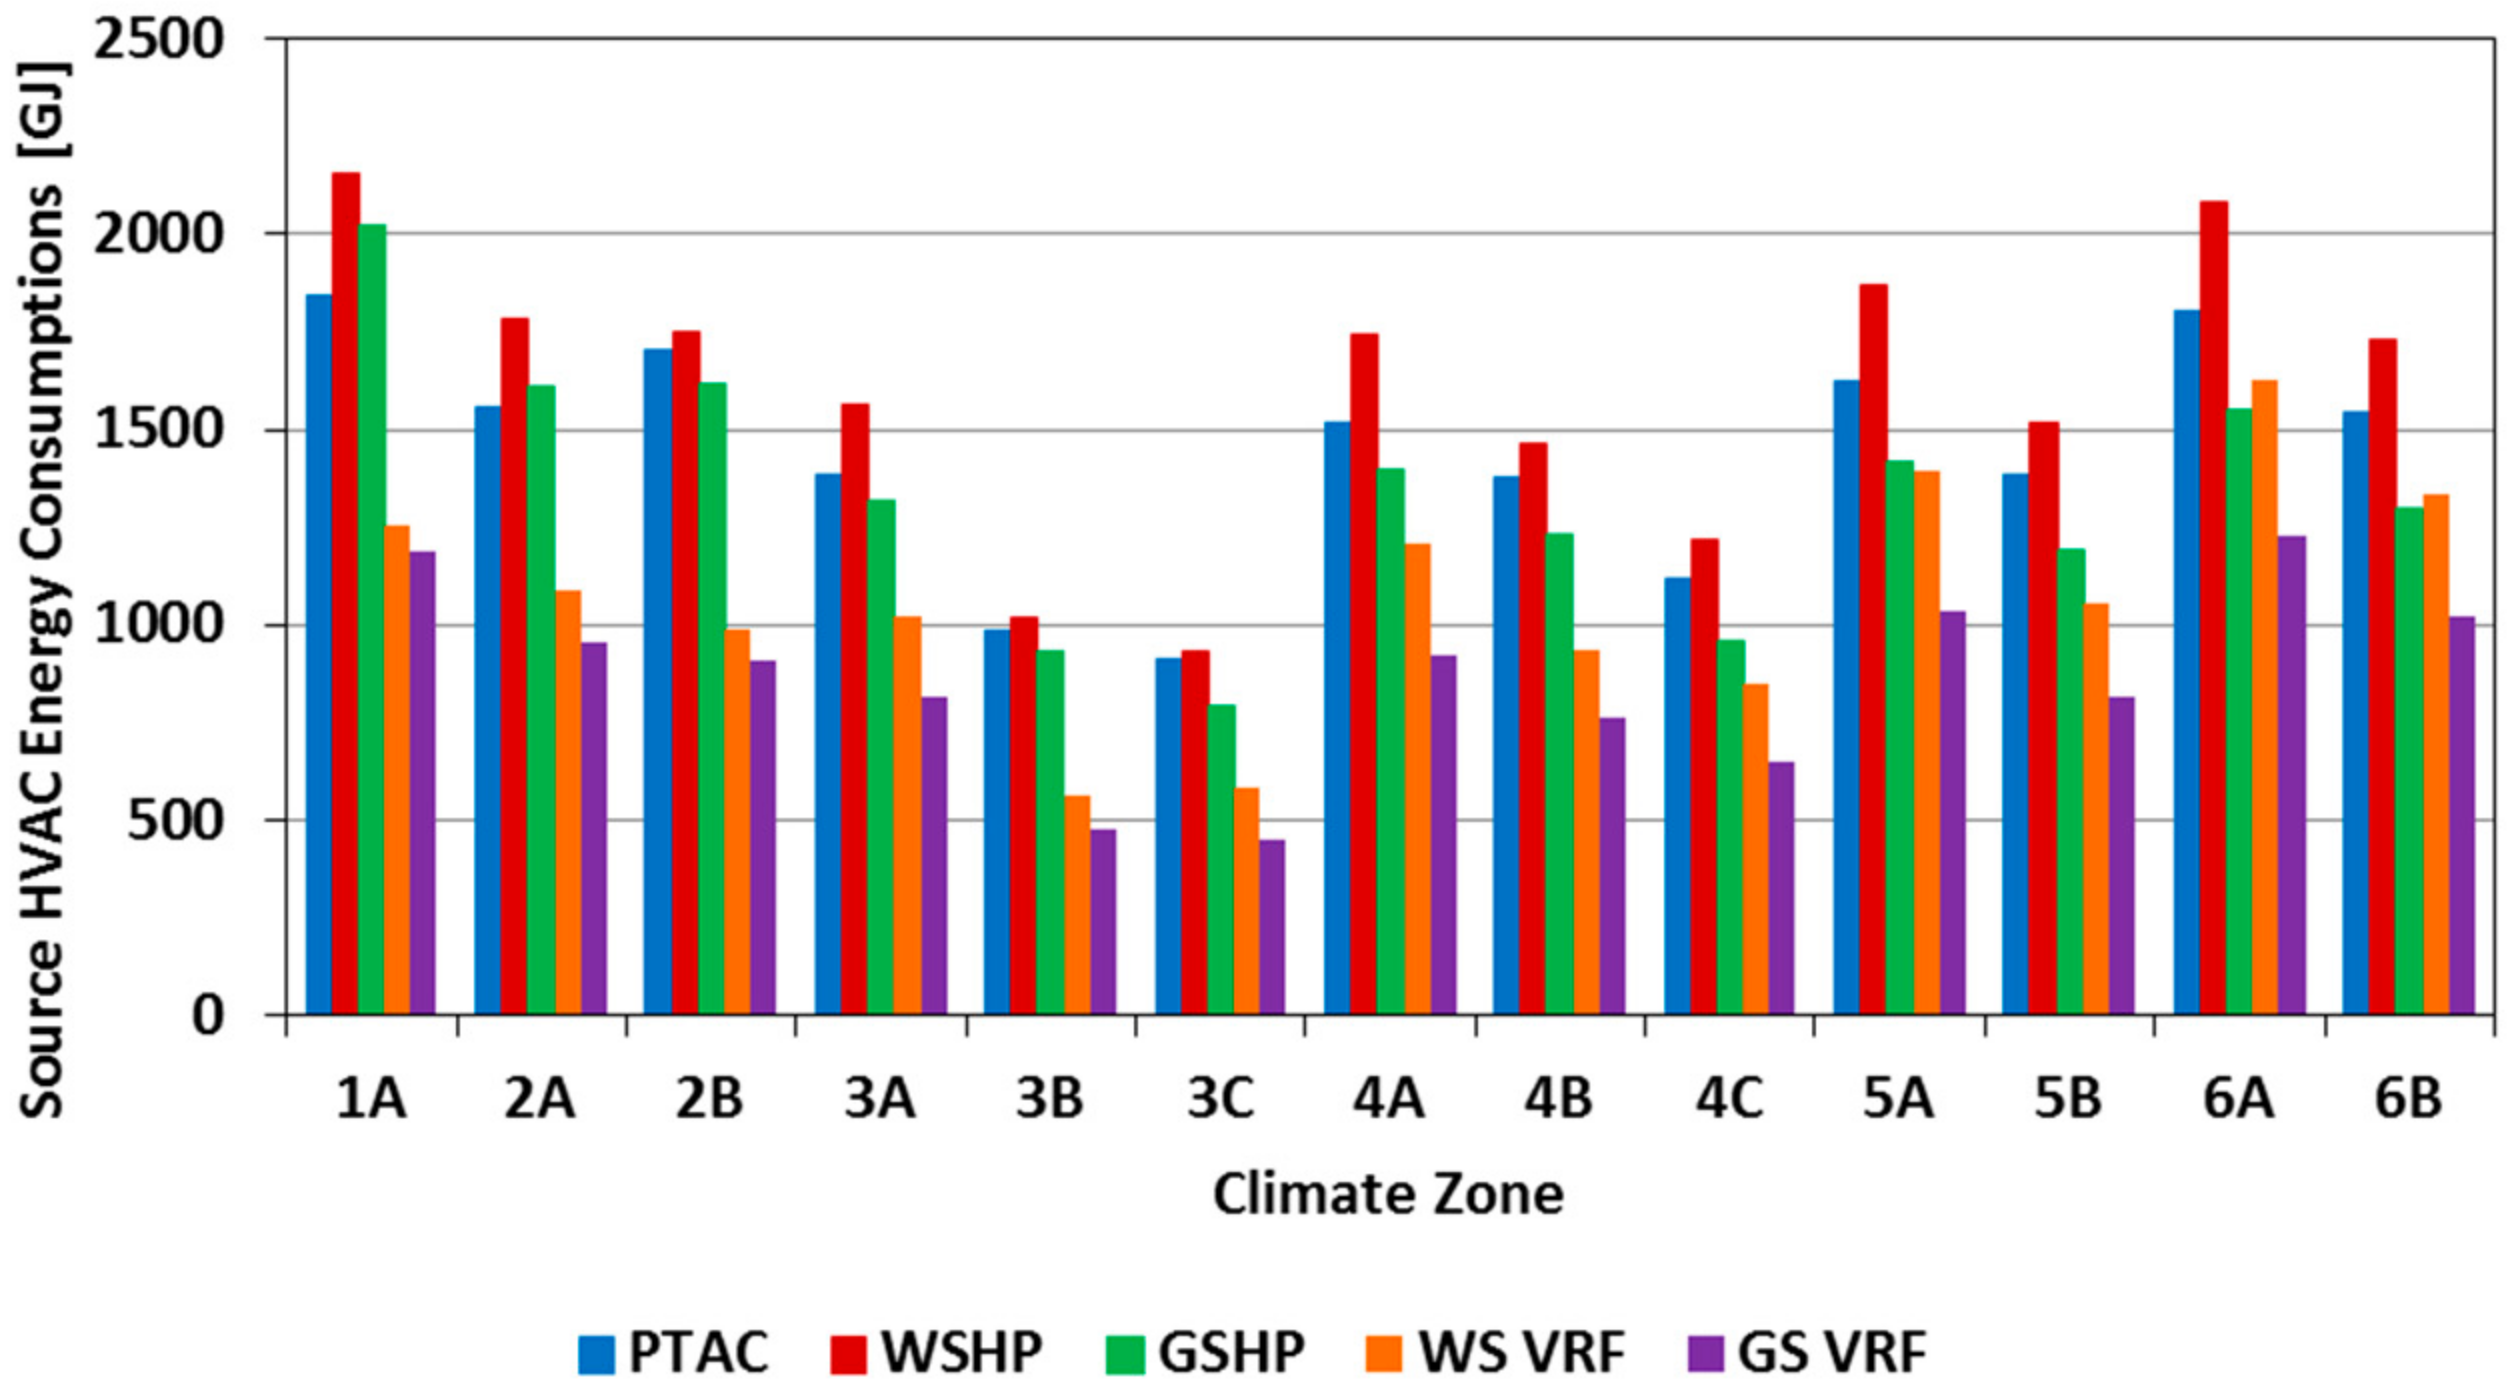
Figure 17.
Source heating, ventilating, and air-conditioning (HVAC) energy use for baseline office-building models in various U.S. climate zones.
Figure 17.
Source heating, ventilating, and air-conditioning (HVAC) energy use for baseline office-building models in various U.S. climate zones.
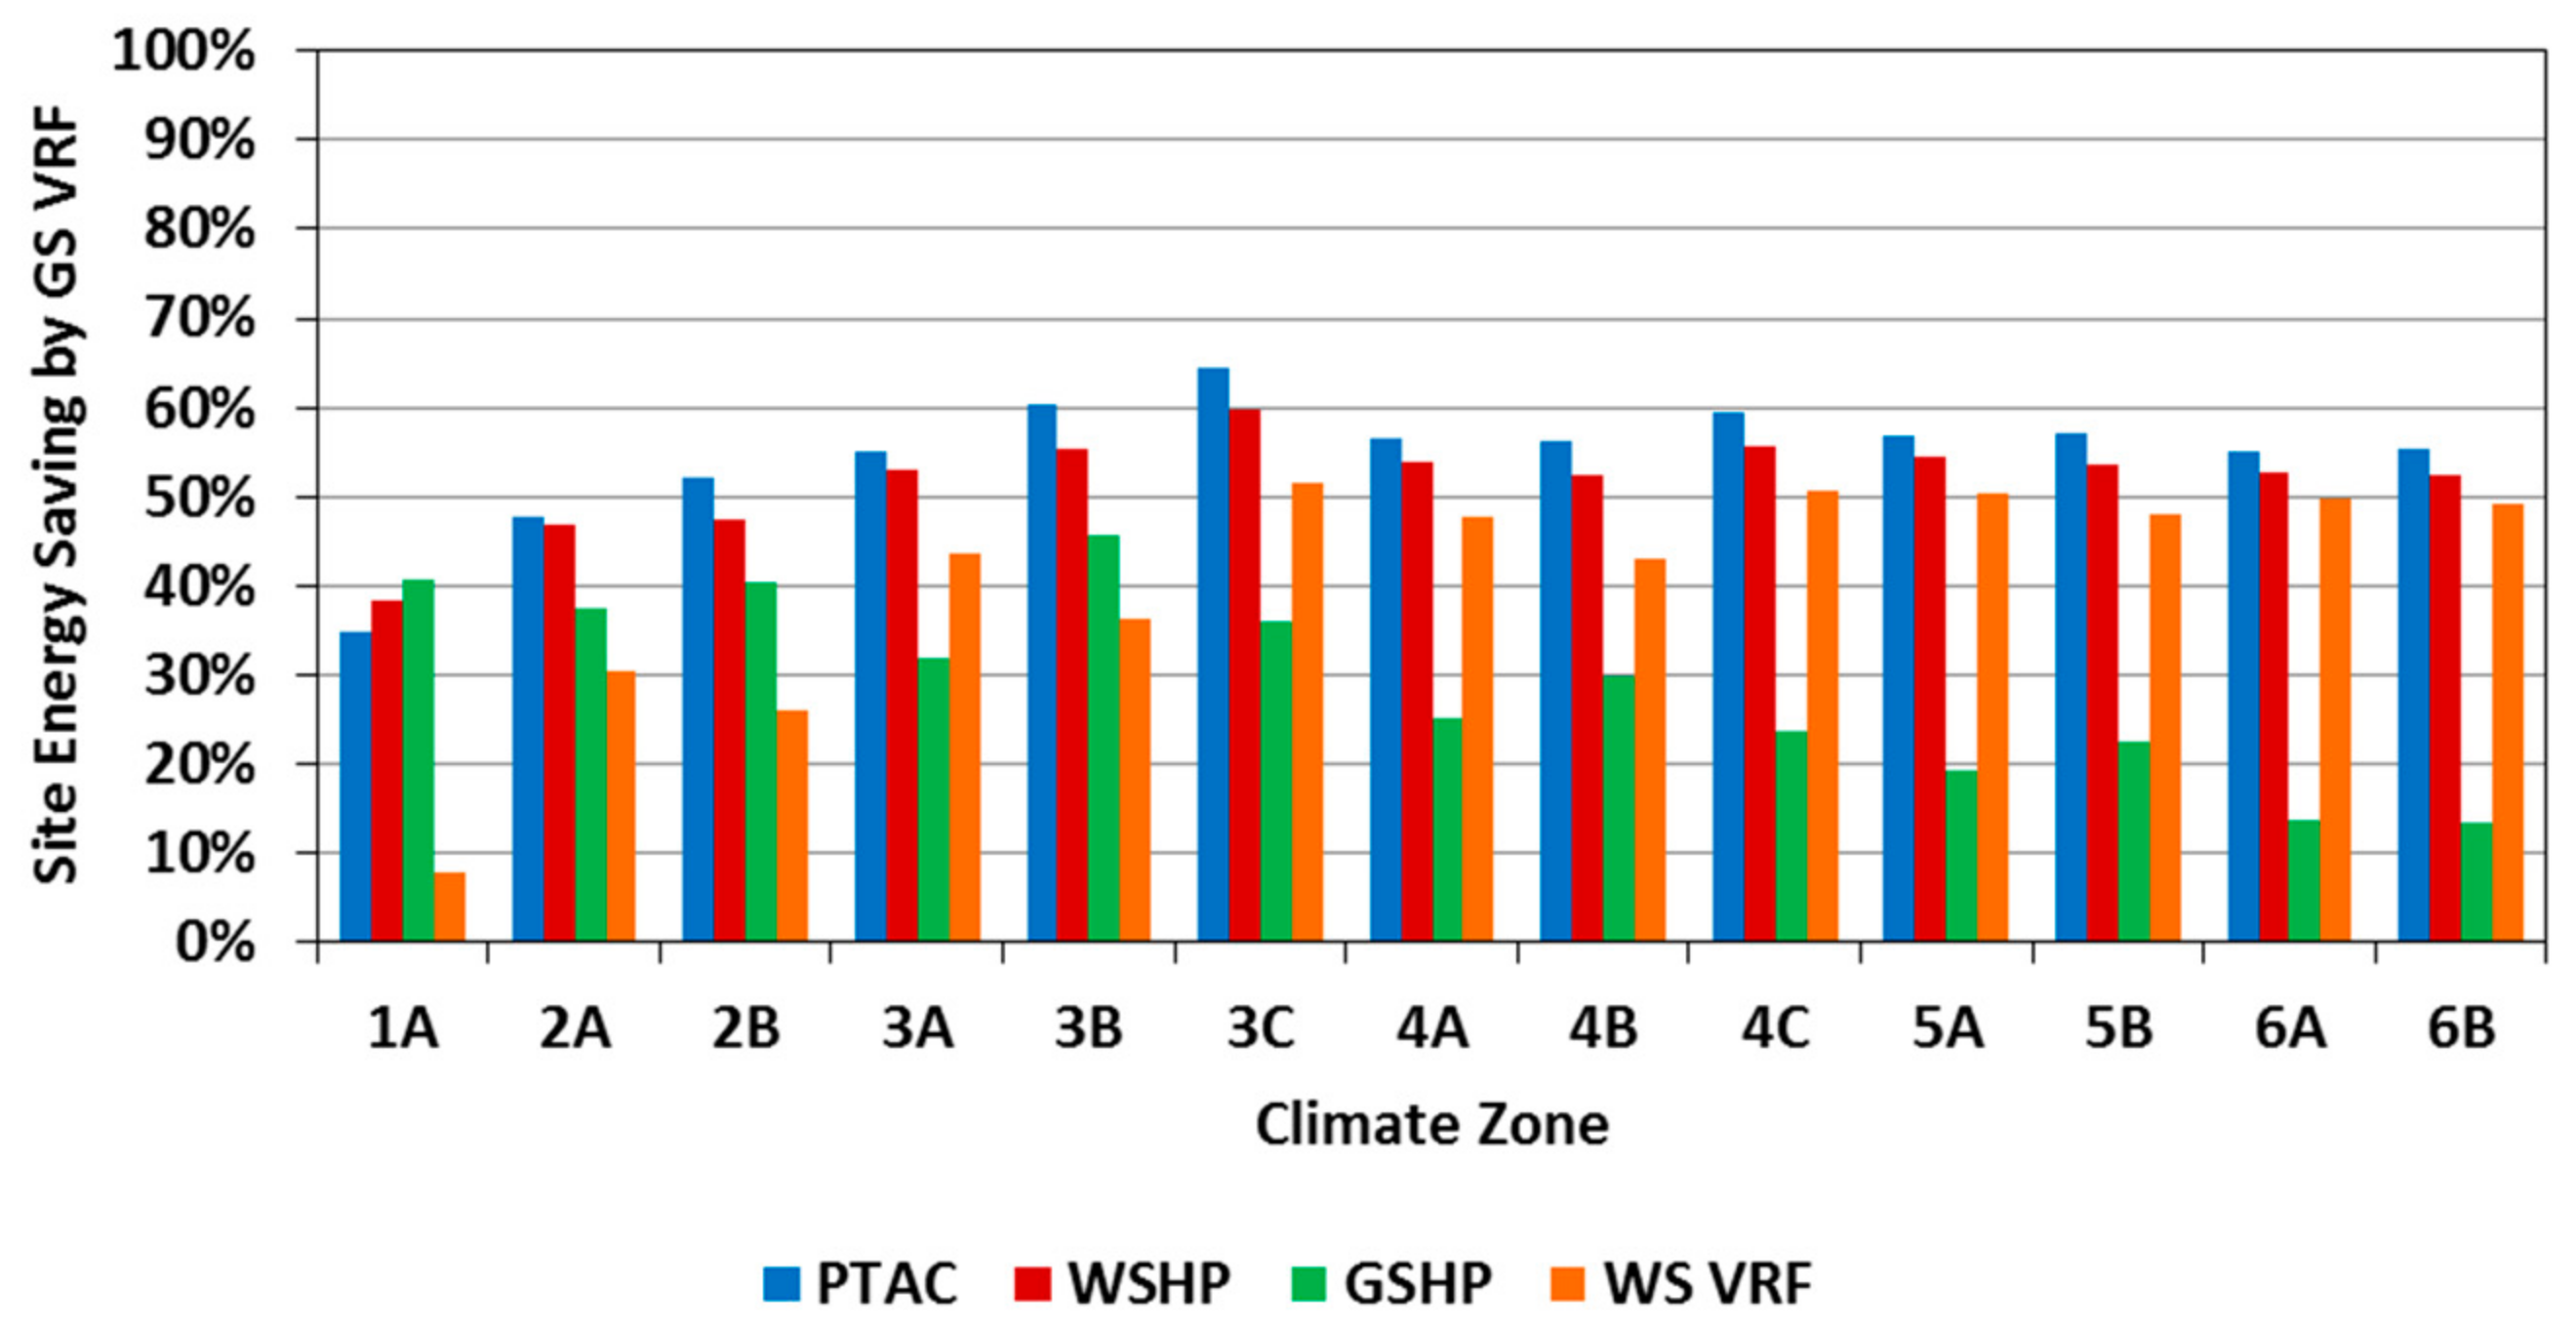
Figure 18.
Site heating, ventilating, and air-conditioning (HVAC) energy savings of ground-source variable refrigerant flow (GS-VRF) systems compared to other HVAC systems for baseline office-building models in various U.S. climate zones.
Figure 18.
Site heating, ventilating, and air-conditioning (HVAC) energy savings of ground-source variable refrigerant flow (GS-VRF) systems compared to other HVAC systems for baseline office-building models in various U.S. climate zones.
Figure 19.
Source heating, ventilating, and air-conditioning (HVAC) energy savings of ground-source variable refrigerant flow (GS-VRF) systems compared to other HVAC systems for baseline office-building models in various U.S. climate zones.
Figure 19.
Source heating, ventilating, and air-conditioning (HVAC) energy savings of ground-source variable refrigerant flow (GS-VRF) systems compared to other HVAC systems for baseline office-building models in various U.S. climate zones.
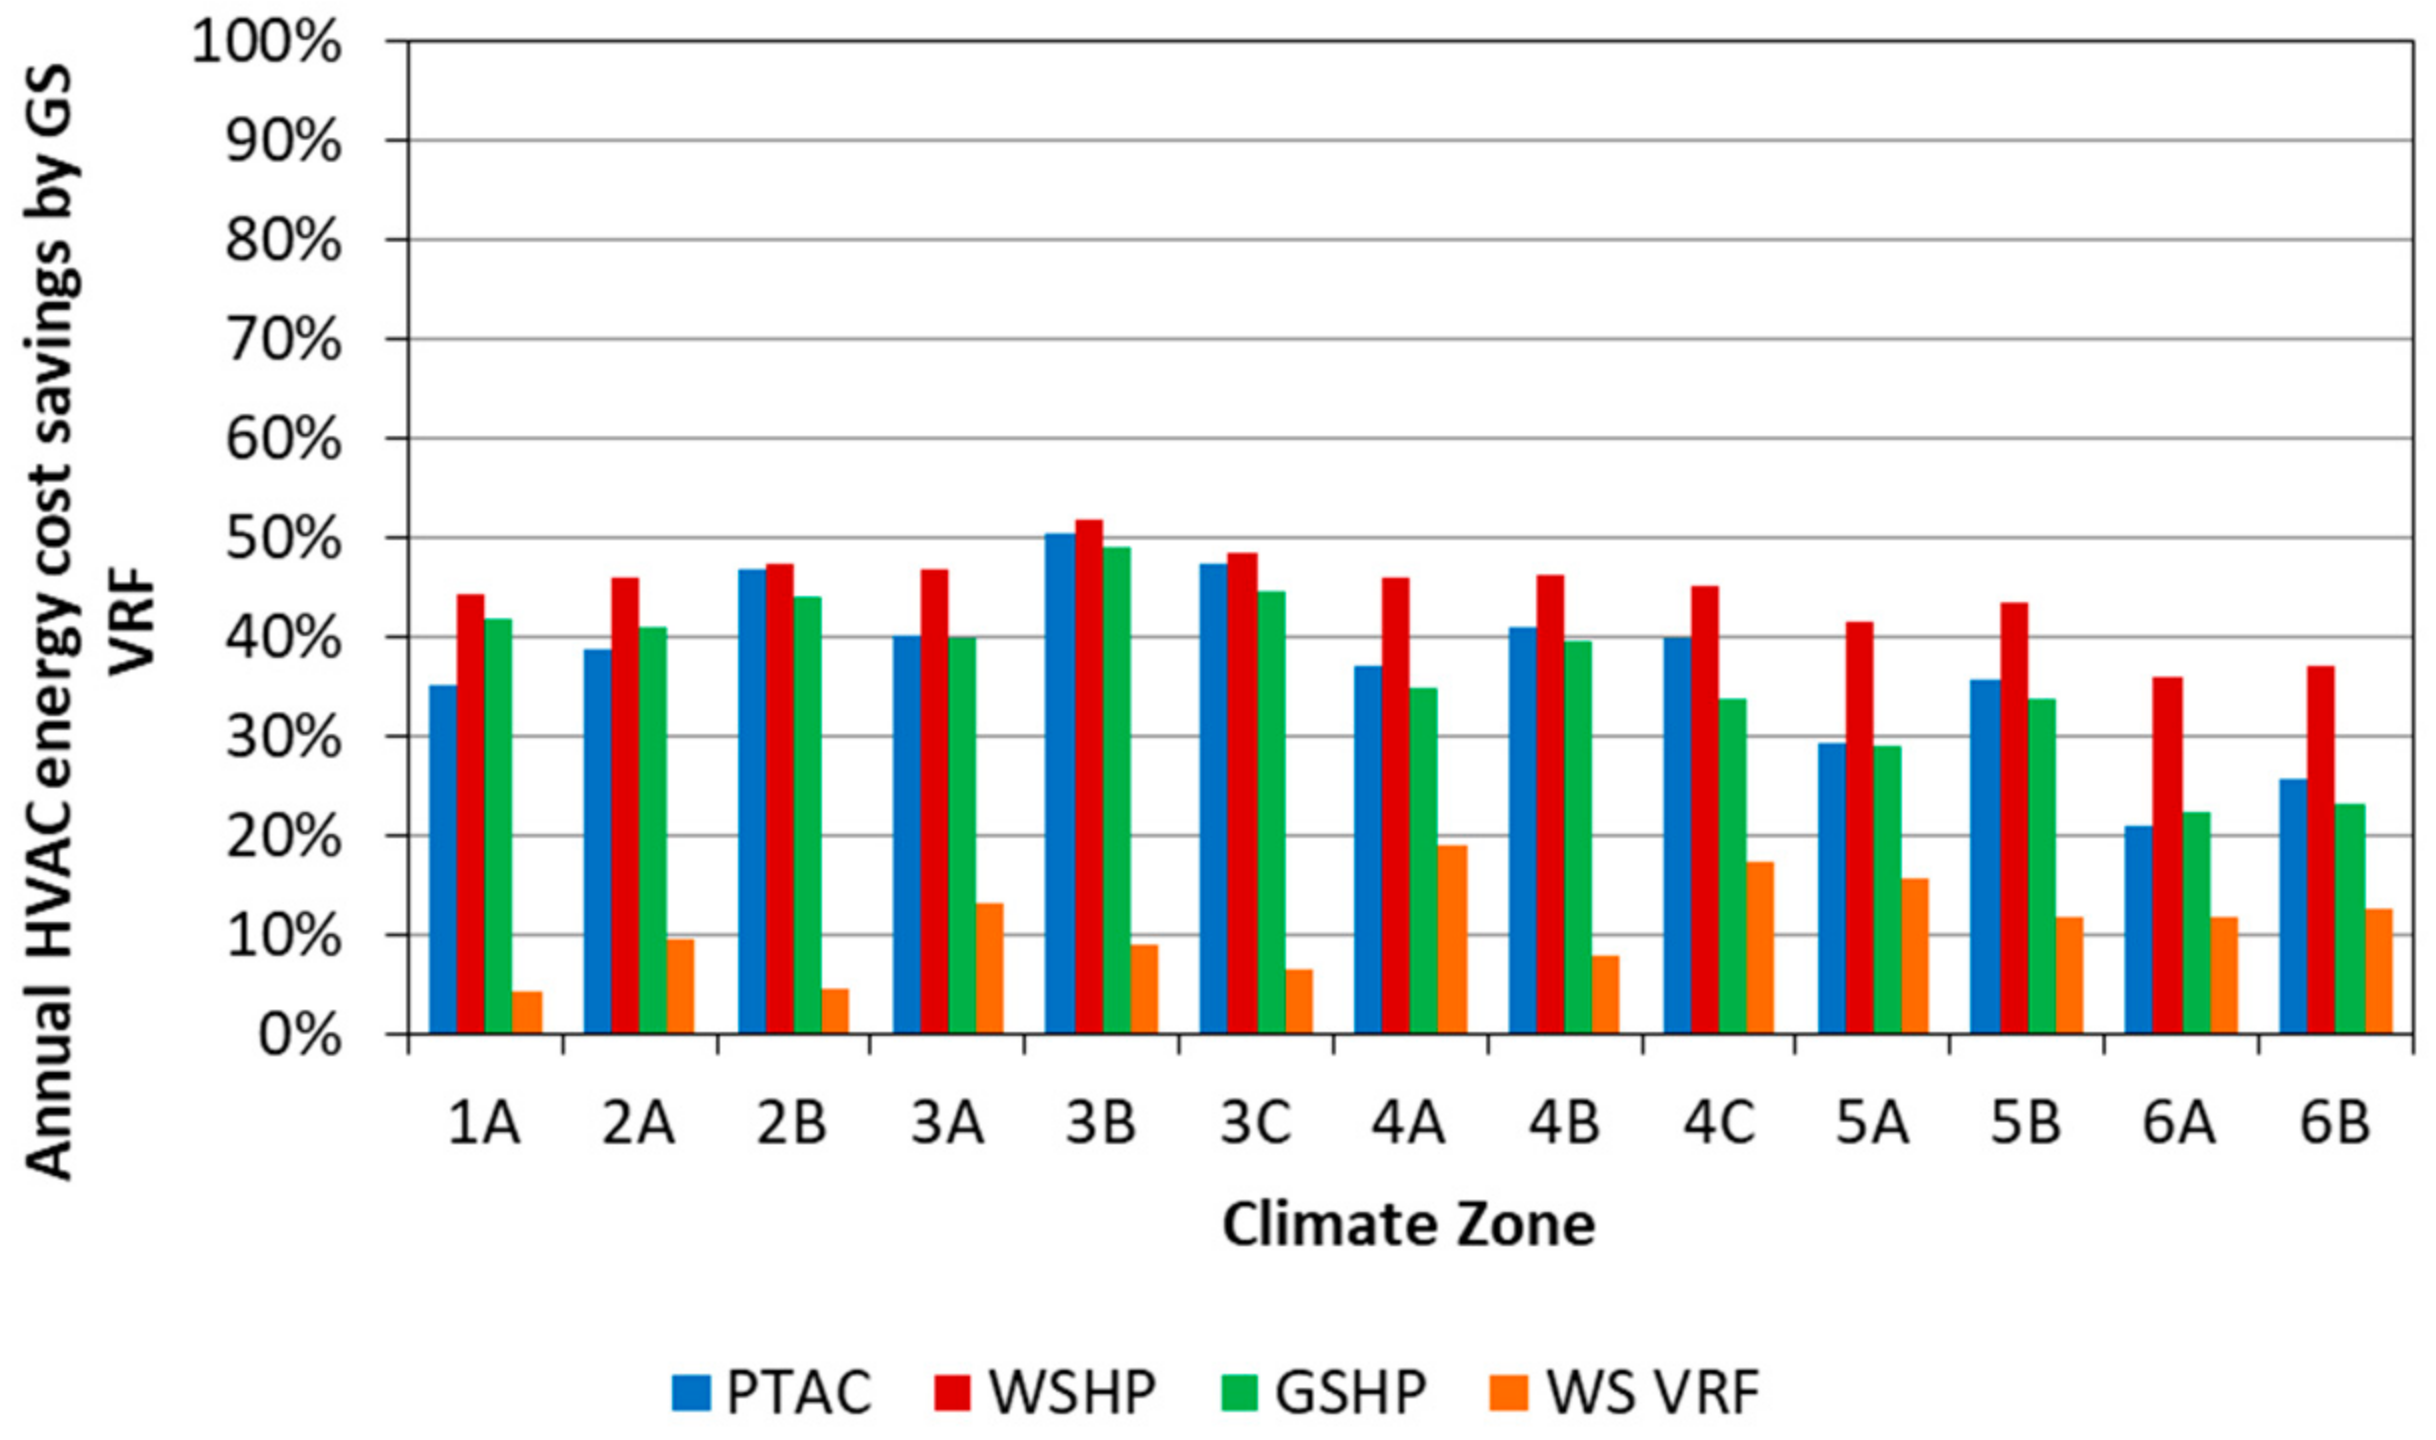
Figure 20.
Annual heating, ventilating, and air-conditioning (HVAC) energy-cost savings achieved by ground-source variable refrigerant flow (GS-VRF) systems compared to other HVAC systems for the baseline building-office models in various U.S. climate zones.
Figure 20.
Annual heating, ventilating, and air-conditioning (HVAC) energy-cost savings achieved by ground-source variable refrigerant flow (GS-VRF) systems compared to other HVAC systems for the baseline building-office models in various U.S. climate zones.
Figure 21.
Source energy-use savings achieved by the high-performance designs compared to the baseline designs for office buildings located in various U.S. climates.
Figure 21.
Source energy-use savings achieved by the high-performance designs compared to the baseline designs for office buildings located in various U.S. climates.
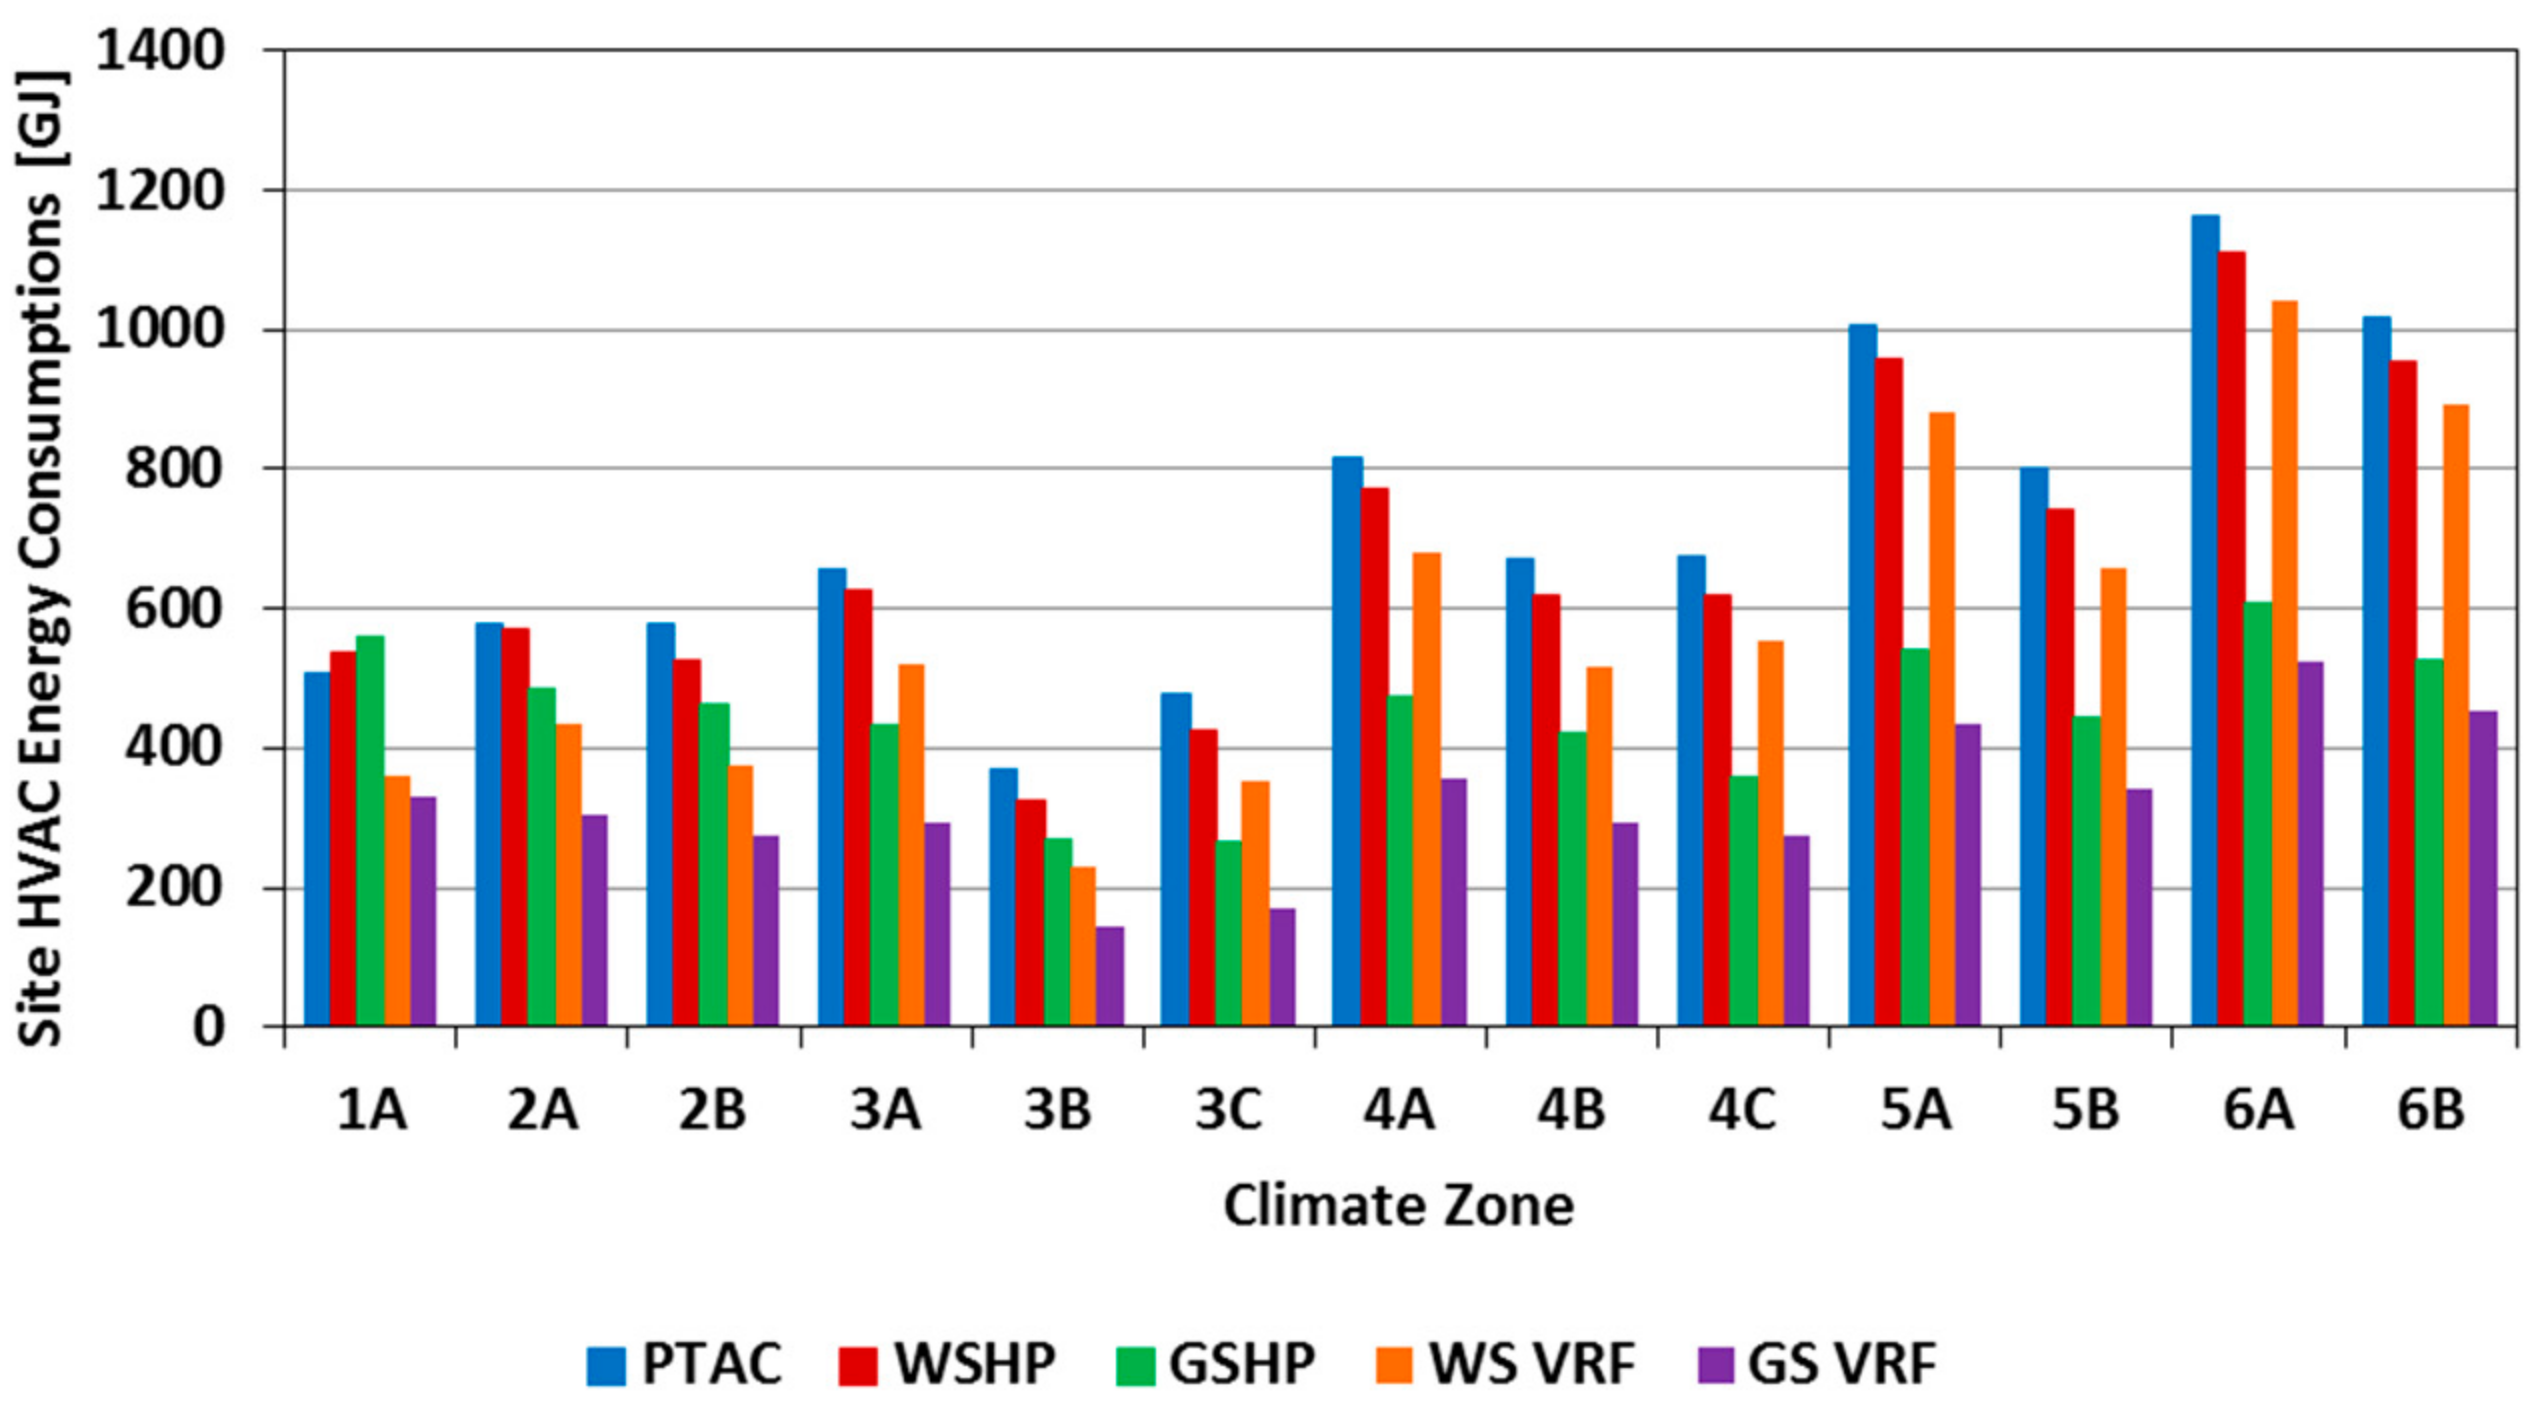
Figure 22.
Site heating, ventilating, and air-conditioning (HVAC) energy use for high-performance office buildings in various U.S. climates.
Figure 22.
Site heating, ventilating, and air-conditioning (HVAC) energy use for high-performance office buildings in various U.S. climates.
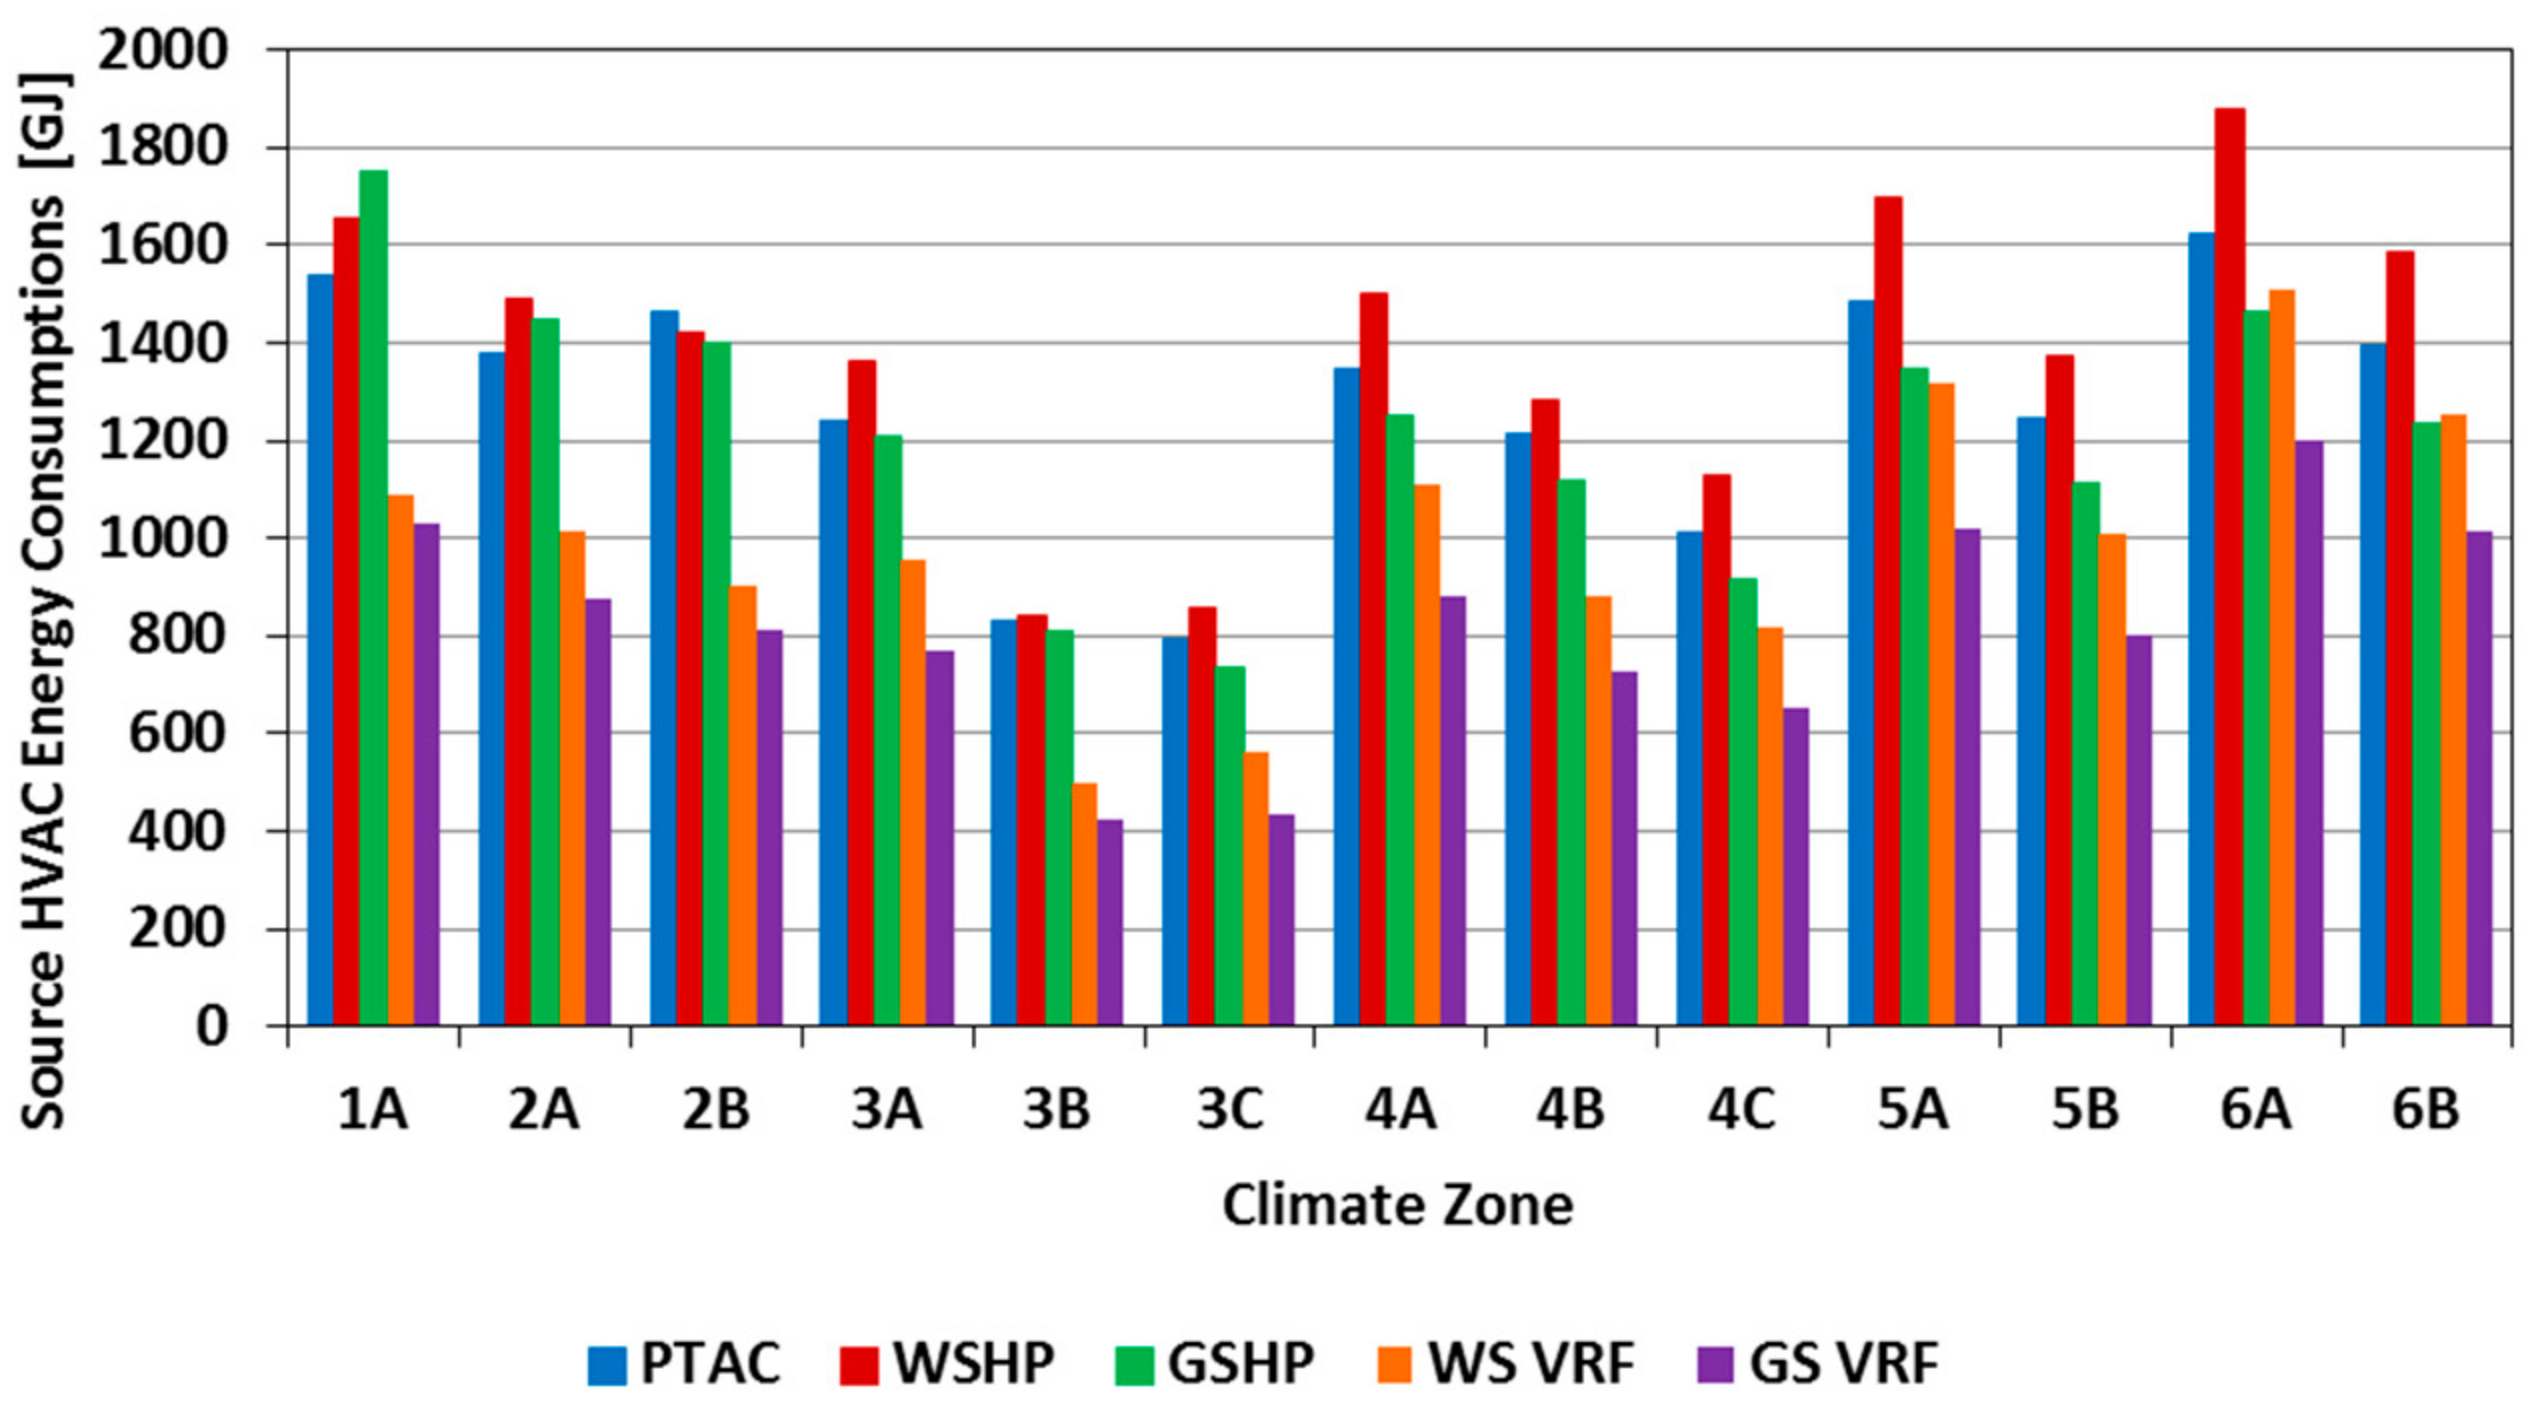
Figure 23.
Source heating, ventilating, and air-conditioning (HVAC) energy use for high-performance office buildings in various U.S. climates.
Figure 23.
Source heating, ventilating, and air-conditioning (HVAC) energy use for high-performance office buildings in various U.S. climates.
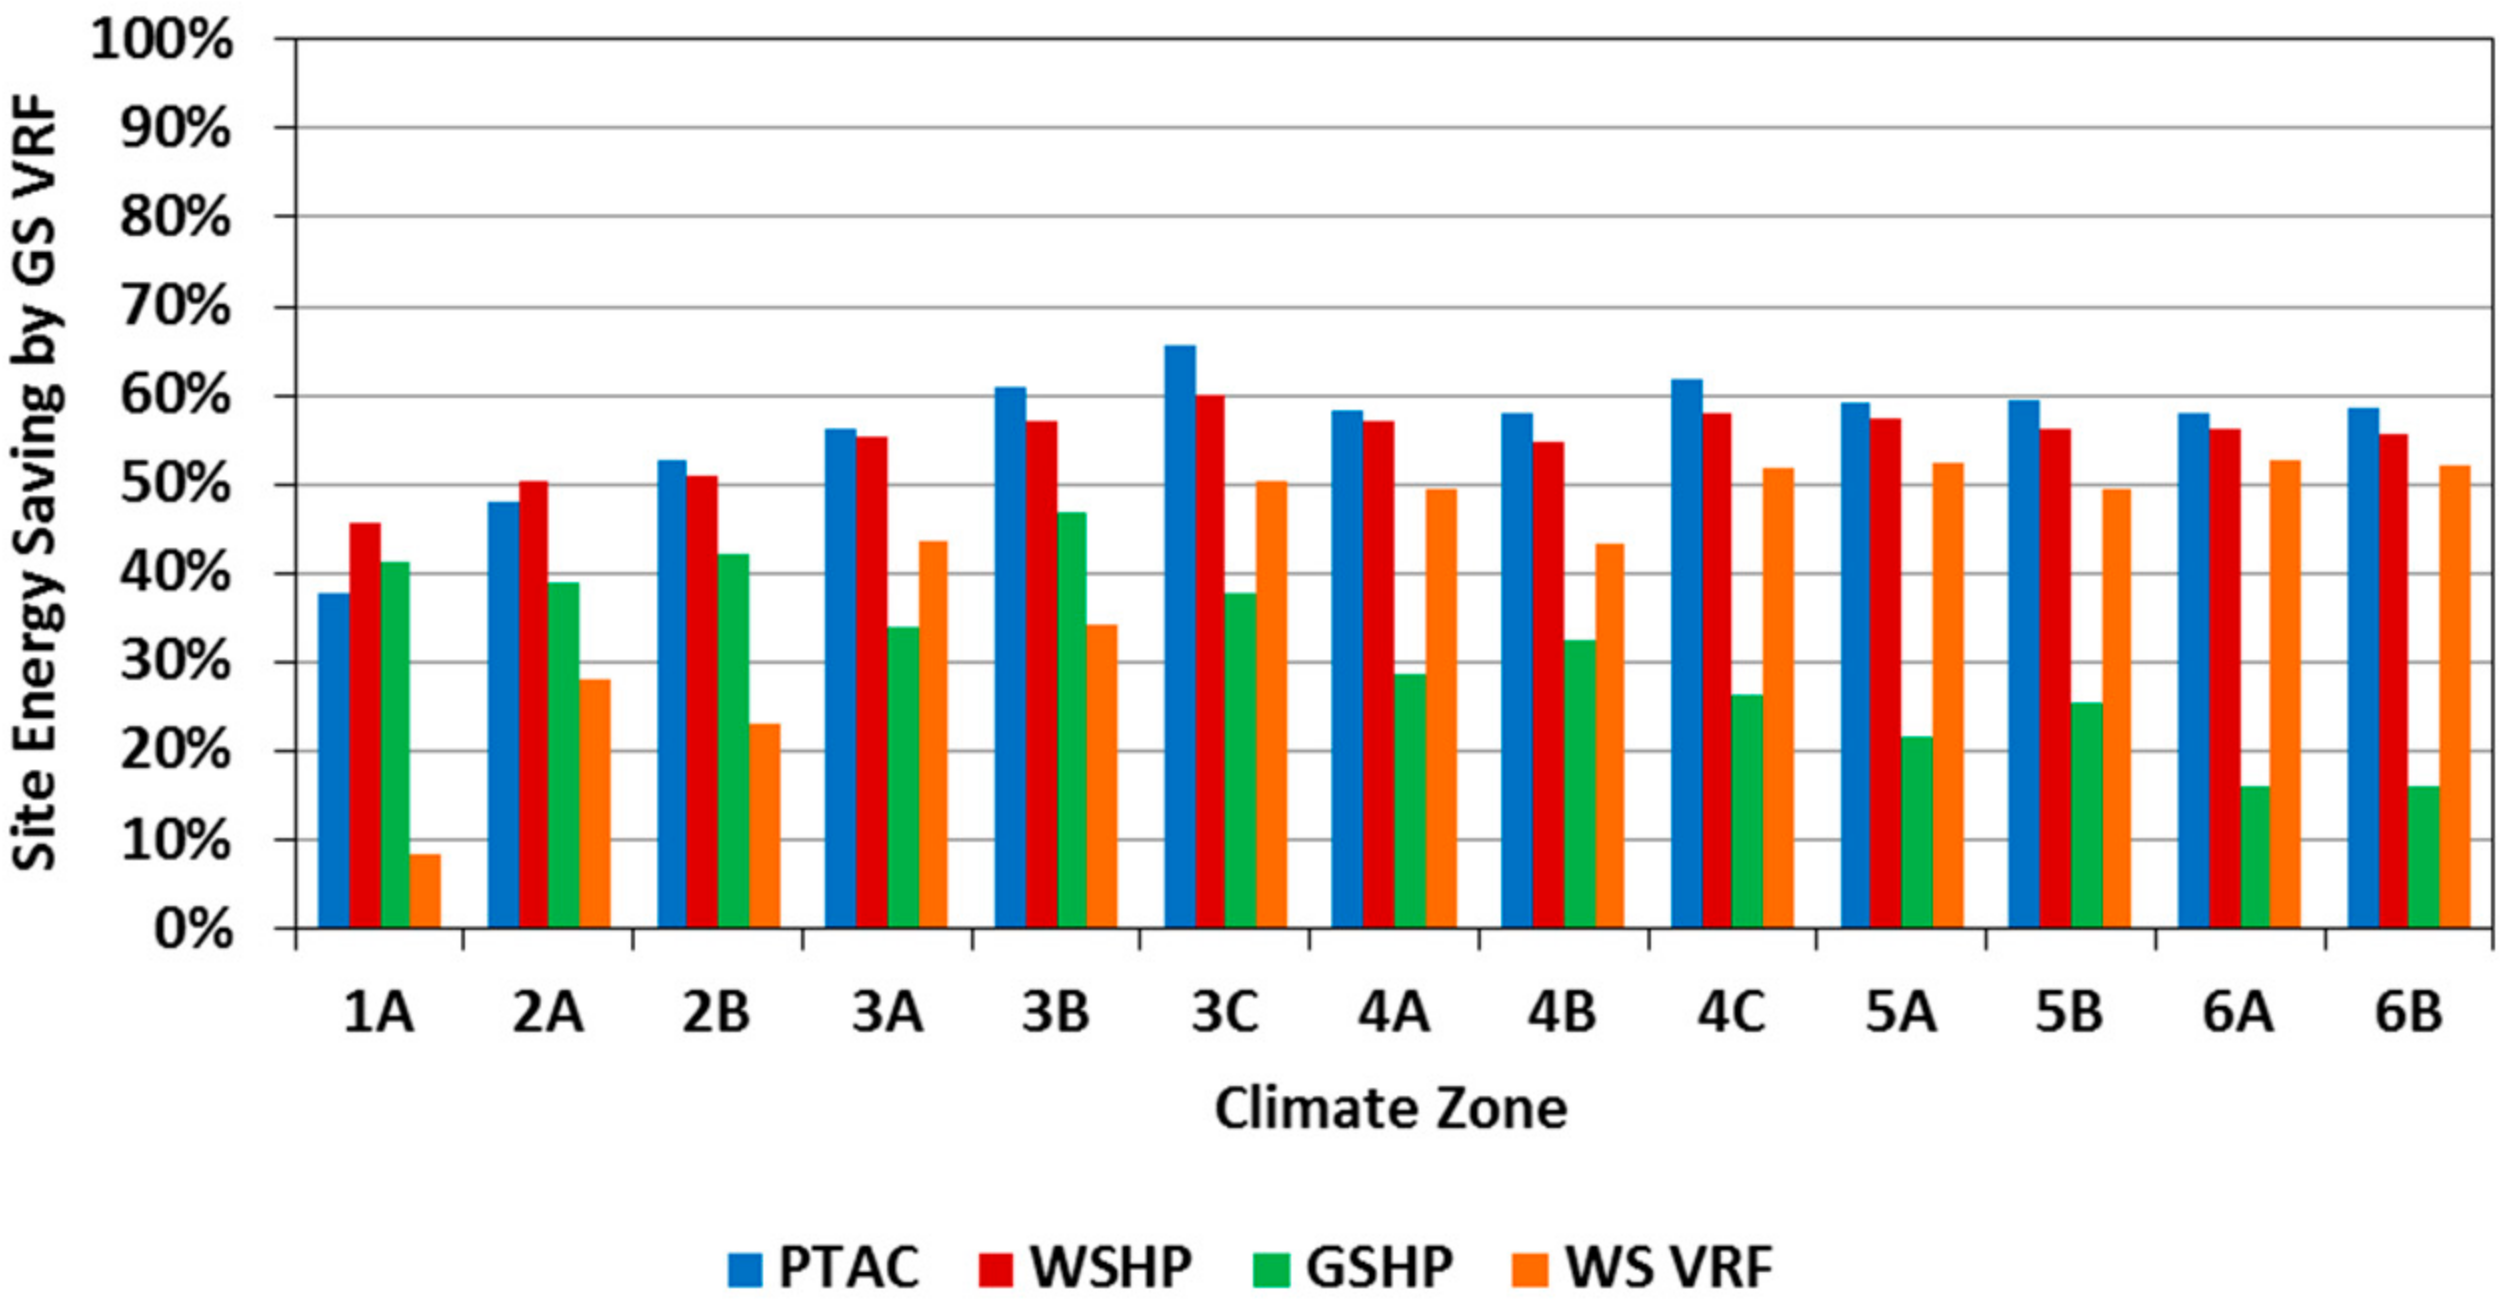
Figure 24.
Site energy savings achieved by ground-source variable refrigerant flow (GS-VRF) systems compared to other HVAC systems for high-performance office buildings in various U.S. climates.
Figure 24.
Site energy savings achieved by ground-source variable refrigerant flow (GS-VRF) systems compared to other HVAC systems for high-performance office buildings in various U.S. climates.
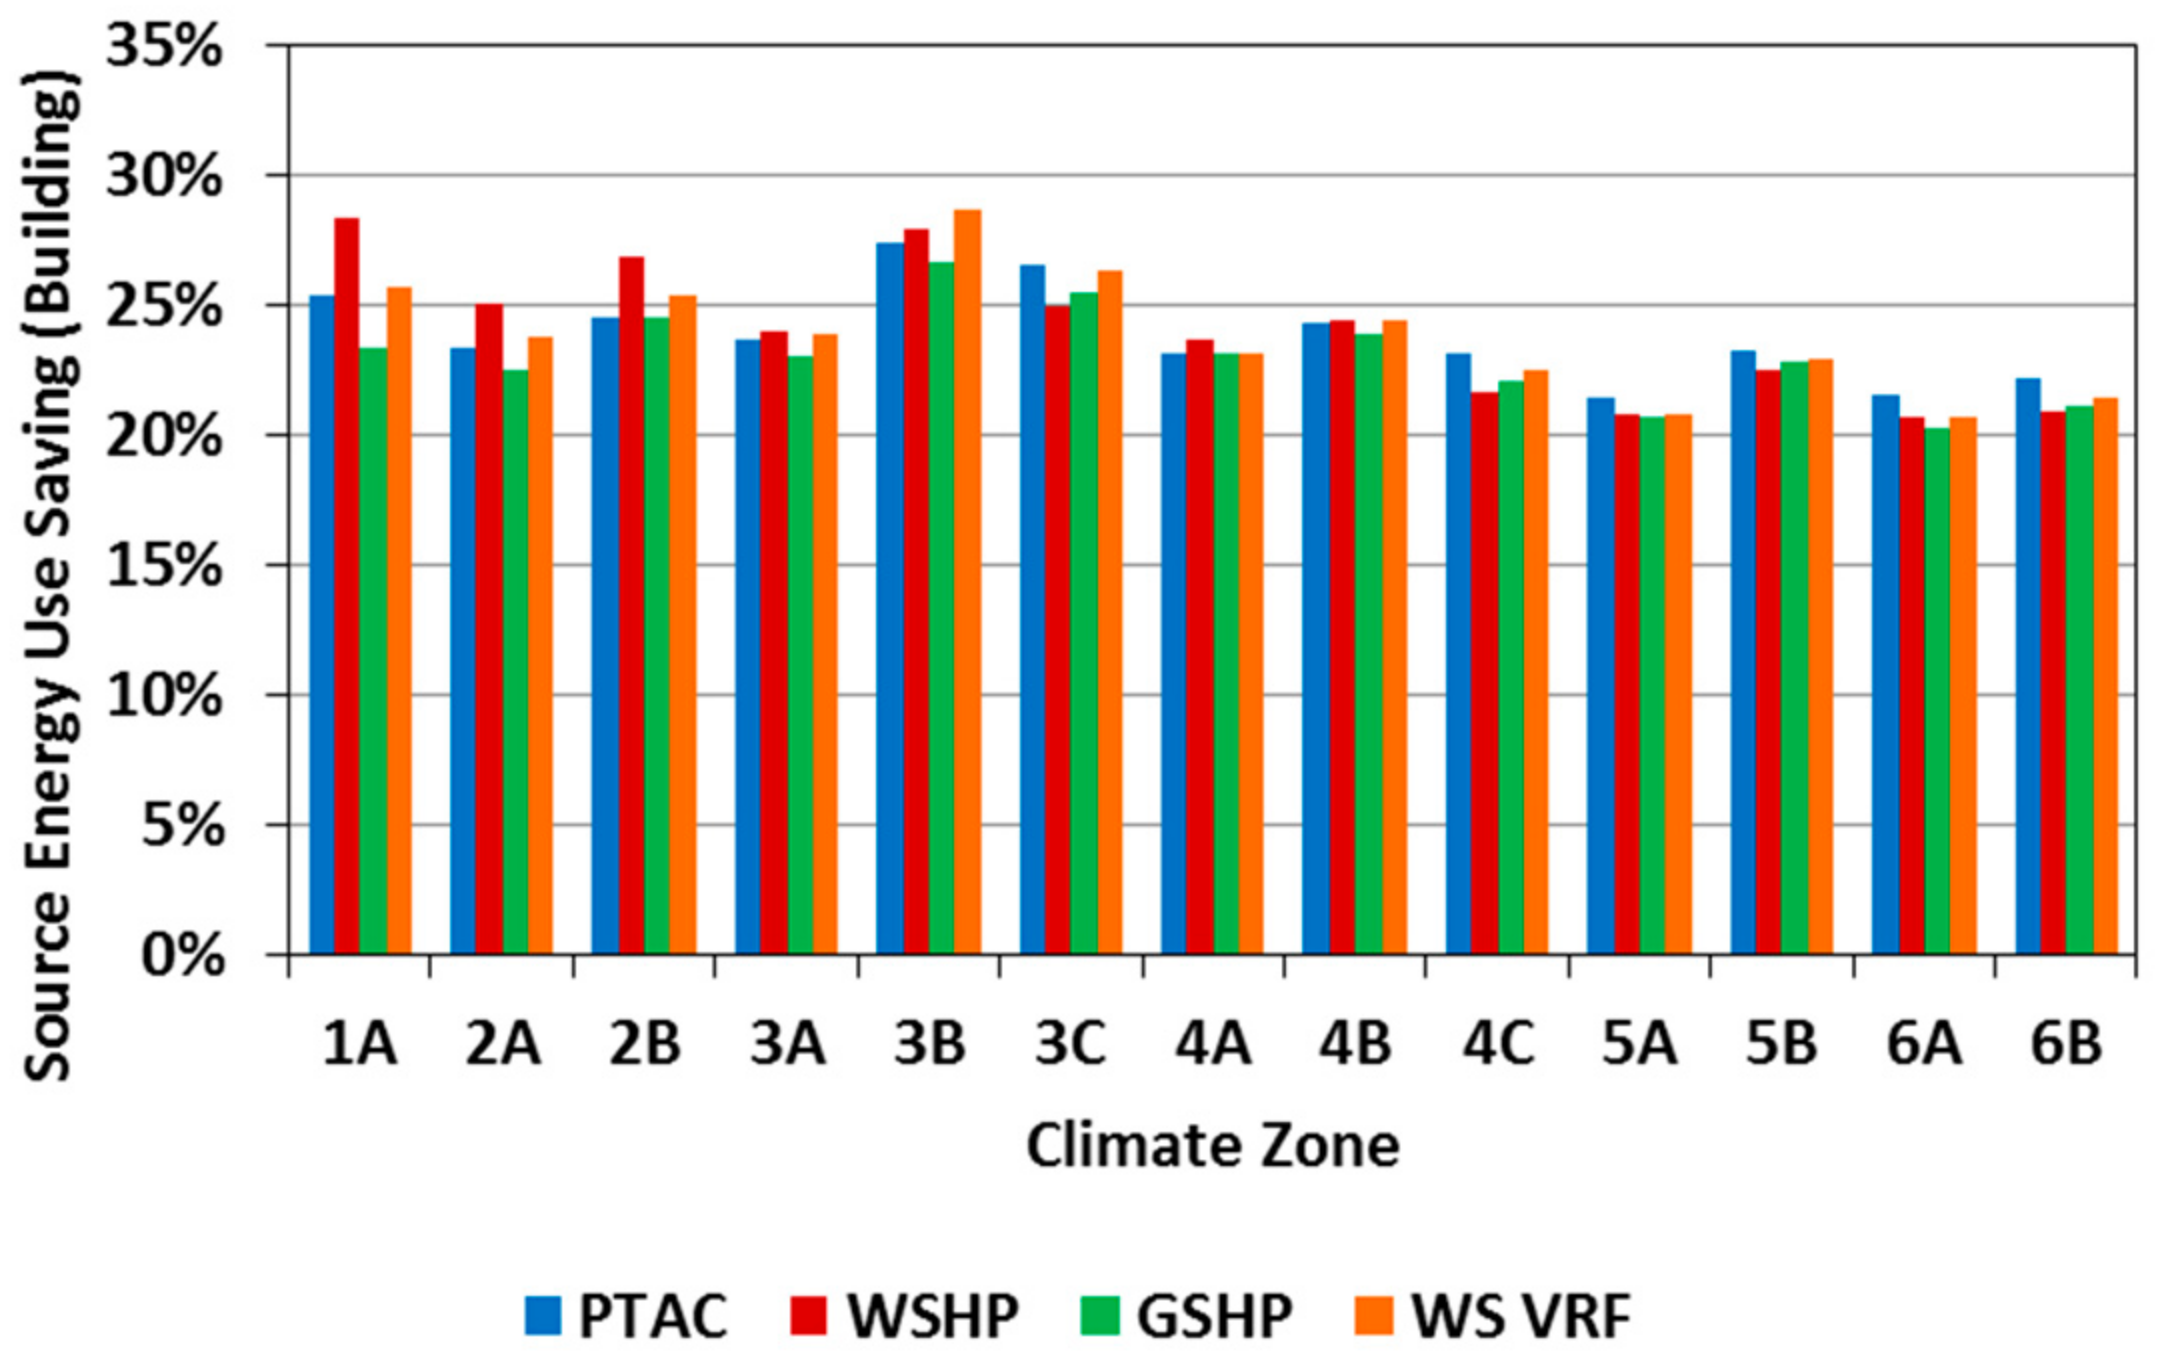
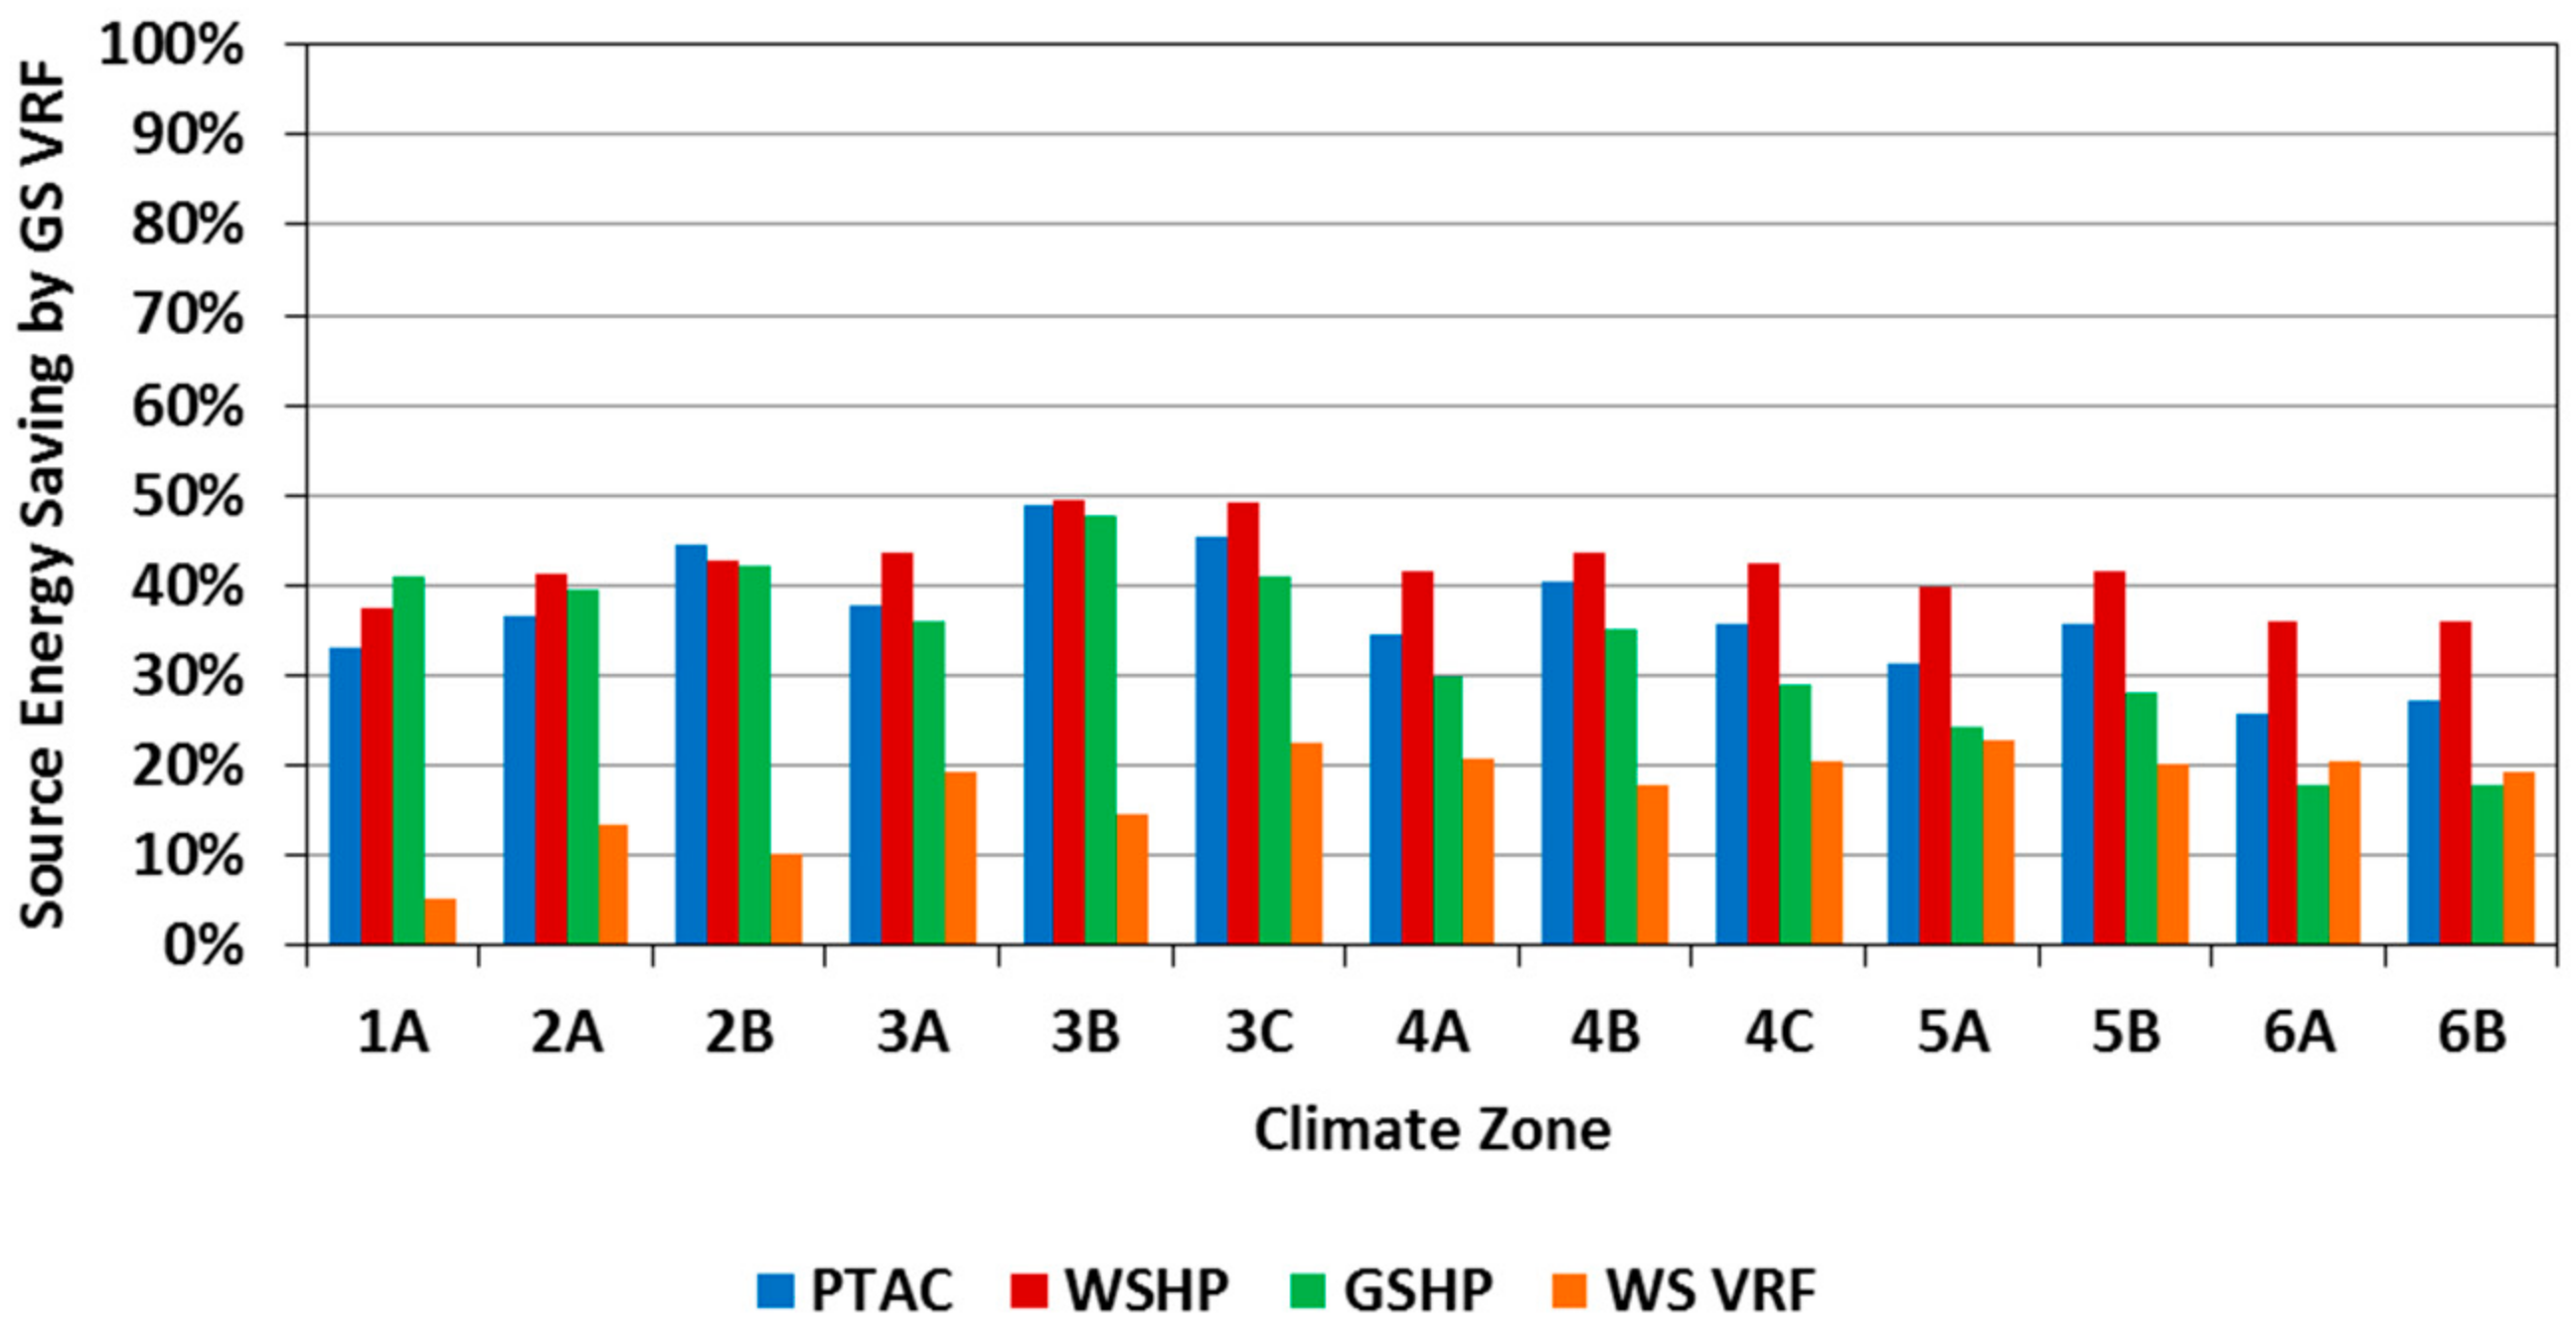
Figure 25.
Source energy savings achieved by ground-source variable refrigerant flow (GS-VRF) systems compared to other heating, ventilating, and air-conditioning (HVAC) systems for high-performance office buildings in various U.S. climates.
Figure 25.
Source energy savings achieved by ground-source variable refrigerant flow (GS-VRF) systems compared to other heating, ventilating, and air-conditioning (HVAC) systems for high-performance office buildings in various U.S. climates.
Table 1.
Characteristics of ground heat exchangers used for ground-source heat pumps (GSHPs) and ground-source variable refrigerant flow (GS-VRF) systems.
Table 1.
Characteristics of ground heat exchangers used for ground-source heat pumps (GSHPs) and ground-source variable refrigerant flow (GS-VRF) systems.
| Borehole depth | 76 m |
| Borehole diameter | 0.152 m |
| Grout conductivity | 1.47 W/m·K |
| Ground thermal conductivity | 2.91 W/m·K |
| Ground thermal diffusivity | 1.11 × 10⁻⁶ m2/s |
| Fluid | Ethylene glycol |
| Pipe diameter (outside) | 0.0267 m |
| Pipe diameter (inside) | 0.0218 m |
| Pipe conductivity | 0.398 W/m·K |
Table 2.
Characteristics of the baseline office building.
Table 2.
Characteristics of the baseline office building.
| Location | Barberton, OH |
|---|
| ASHRAE climate zone | 5A |
| Design temperature | Cooling, 29 °C, dry-bulb |
| (ASHRAE Standard 90.1-2010) | Heating, −18 °C, dry-bulb |
| Number of floors | 1 stories |
| Total conditioned floor area | 2746 m2 |
| Floor-to-floor height | 3 m |
| Window–wall ratio (WWR) | 30% |
| Roofs | U-value: 0.273 W/m2·°C |
| Exterior walls | U-value: 0.511 W/m2·°C |
| Window glazing | U-value: 2.27 W/m2·°C |
| (solar heat gain coefficient: 0.4) |
| Lighting power density (LPD) | 10.23 W/m2 |
| Equipment power density (EPD) | 9.58 W/m2 |
| Total cooling capacity | 2047 kW |
| Heating, Ventilation & Air-Conditioning | Cooling: PTAC (COP*: 2.73) |
| (HVAC) system | Heating: unit ventilator with hot-water boilers (efficiency: 80%) |
| (system efficiency including fan power) | (*COP = Coefficient of Performance) |
| Fan type (power) | Constant volume (0.6383 kW/m3/s) |
| Operation schedule | Monday–Friday: 8 a.m. to 5 p.m. |
| Saturday, Sunday, and holidays: closed |
| Thermostat set-point | Occupied hours: (cooling) 24.0 °C/(heating) 21.1 °C |
| Unoccupied hours: (cooling) 26.6 °C/(heating) 15.5 °C |
| Supply air temperature | Cooling, 12.8 °C, dry-bulb |
| Heating, 40.6 °C, dry-bulb |
Table 3.
Summary of performance data for water-source variable refrigerant flow (VRF) and ground-source variable refrigerant flow (GS-VRF) systems [
20].
Table 3.
Summary of performance data for water-source variable refrigerant flow (VRF) and ground-source variable refrigerant flow (GS-VRF) systems [
20].
| System | Water-Source VRF (WS-VRF) | Ground-Source VRF (GS-VRF) |
|---|
| Cooling efficiency | 5.20 COP at EWT of 30 °C | 6.14 COP at EWT of 25 °C |
| Heating efficiency | 5.76 COP at EWT of 20 °C | 2.99 COP at EWT of 0 °C |
| Fans | Constant volume (0.4660 kW/m3/s) | Constant volume (0.4660 kW/m3/s) |
| Outside air | DOAS | DOAS |
Table 4.
Performance indicators for baseline heating, ventilating, and air-conditioning (HVAC) systems on basis of ASHRAE Standard 90.1-2010 [
21].
Table 4.
Performance indicators for baseline heating, ventilating, and air-conditioning (HVAC) systems on basis of ASHRAE Standard 90.1-2010 [
21].
| System | Baseline 1 | Baseline 2 | Baseline 3 |
|---|
| Packaged Terminal Air-Conditioner (PTAC) | Water-Source Heat Pump (WSHP) | Ground-Source Heat Pump (GSHP) |
|---|
| Cooling efficiency | COP = 2.73 (Direct expansion cooling) | COP = 3.52 (at EWT of 30°C) | COP = 3.93 (at EWT of 25 °C) |
| Heating efficiency | Hot-water boiler (Efficiency = 80%) | COP = 4.2 (at EWT of 20 °C) Hot-water boiler (Efficiency = 80%) | COP = 3.10 (at EWT of 0 °C) |
| Fans | Constant volume (0.6383 kW/m3/s) | Constant volume (0.6383 kW/m3/s) | Constant volume (0.6383 kW/m3/s) |
| Outside air | DOAS | DOAS | DOAS |
Table 5.
Main climatic characteristics for 11 selected U.S. locations.
Table 5.
Main climatic characteristics for 11 selected U.S. locations.
| Location | Climate Zone | Design Temperature | Average Ground Temperature | Ambient Air Conditions |
|---|
| Cooling | Heating |
|---|
| Miami, Florida | 1A | 32.2 °C | 7.8 °C | 24.5 °C | Very Hot, Humid |
| Houston, Texas | 2A | 34.4 °C | −2.8 °C | 20.2 °C | Hot, Humid |
| Phoenix, Arizona | 2B | 42.2 °C | 1.1 °C | 22.7 °C | Hot, Dry |
| Atlanta, Georgia | 3A | 32.8 °C | −7.8 °C | 16.0 °C | Warm, Humid |
| Los Angeles, California | 3B | 27.2 °C | 6.1 °C | 16.8 °C | Warm, Dry |
| San Francisco, California | 3C | 25.6 °C | 2.8 °C | 13.3 °C | Warm, Marine |
| Baltimore, Maryland | 4A | 32.8 °C | −11.7 °C | 12.7 °C | Mixed, Humid |
| Albuquerque, New Mexico | 4B | 33.9 °C | −10.6 °C | 13.4 °C | Mixed, Dry |
| Seattle, Washington | 4C | 27.2 °C | −5.0 °C | 11.0 °C | Mixed, Marine |
| Chicago, Illinois | 5A | 31.1 °C | −21.1 °C | 9.9 °C | Cool, Humid |
| Boulder, Colorado | 5B | 32.2 °C | −19.4 °C | 10.0 °C | Cool, Dry |
| Minneapolis, Minnesota | 6A | 31.1 °C | −26.7 °C | 7.4 °C | Cold, Humid |
| Helena, Montana | 6B | 30.6 °C | −27.8 °C | 7.0 °C | Cold, Dry |
Table 6.
Envelope characteristics for the baseline office-building models for U.S. climate zones considered in the analysis.
Table 6.
Envelope characteristics for the baseline office-building models for U.S. climate zones considered in the analysis.
| Climate Zone | Roof U-Value (W/m2·°C) | Wall U-Value (W/m2·°C) | Floor U-Value (W/m2·°C) | Glazing U-Value (W/m2·°C) | Glazing SHGC |
|---|
| 1 (A) | 0.36 | 3.29 | 1.83 | 6.81 | 0.25 |
| 2 (A, B) | 0.27 | 0.86 | 0.61 | 4.26 | 0.25 |
| 3 (A, B, C) | 0.27 | 0.70 | 0.61 | 3.69 | 0.25 |
| 4 (A, B, C) | 0.27 | 0.59 | 0.49 | 3.12 | 0.35 |
| 5 (A, B) | 0.27 | 0.51 | 0.42 | 3.12 | 0.35 |
| 6 (A, B) | 0.27 | 0.45 | 0.36 | 3.12 | 0.4 |
Table 7.
Envelope characteristics for the high-performance office-building models for U.S. climate zones considered in the analysis.
Table 7.
Envelope characteristics for the high-performance office-building models for U.S. climate zones considered in the analysis.
| Climate Zone | Roof U-Value (W/m2·°C) | Wall U-Value (W/m2·°C) | Floor U-Value (W/m2·°C) | Glazing U-Value (W/m2·°C) | Glazing SHGC |
|---|
| 1 (A) | 0.27 | 0.86 | 0.78 | 6.81 | 0.25 |
| 2 (A, B) | 0.22 | 0.70 | 0.61 | 4.26 | 0.25 |
| 3 (A, B, C) | 0.22 | 0.59 | 0.61 | 3.12 | 0.25 |
| 4 (A, B, C) | 0.22 | 0.51 | 0.42 | 2.56 | 0.35 |
| 5 (A, B) | 0.22 | 0.45 | 0.36 | 2.56 | 0.35 |
| 6 (A, B) | 0.18 | 0.40 | 0.32 | 2.56 | 0.4 |
Table 8.
Energy-efficiency levels for heating, ventilating, and air-conditioning (HVAC) systems specific to high-performance office-building models.
Table 8.
Energy-efficiency levels for heating, ventilating, and air-conditioning (HVAC) systems specific to high-performance office-building models.
| System | Baseline 1 | Baseline 2 | Baseline 3 |
|---|
| Packaged Terminal Air-Conditioner | Water-Source Heat Pump | Ground-Source Heat Pump |
|---|
| Cooling efficiency | COP = 2.78 (Direct expansion cooling) | COP = 4.10 (at EWT of 30°C) | COP = 3.93 (at EWT of 25°C) |
| Heating efficiency | Hot-water boiler (Efficiency = 89%) | 4.2 COP = 4.20 (at EWT of 20°C)
Hot-water boiler (Efficiency = 89%) | COP = 3.10 (at EWT of 0 °C) |
| Fans | Constant volume (0.5745 kW/m3/s) | Constant volume (0.5745 kW/m3/s) | Constant volume (0.5745 kW/m3/s) |
Table 9.
Annual site energy end-uses for various heating, ventilating, and air-conditioning (HVAC) systems for the office building in Barberton, OH.
Table 9.
Annual site energy end-uses for various heating, ventilating, and air-conditioning (HVAC) systems for the office building in Barberton, OH.
| | | Space Cool | Heat Rejection | Space Heat | Fans | Pumps | Sum | HVAC Sum | Savings by GS-VRF |
|---|
| PTAC | Electricity (GJ) | 118 | 0 | 0 | 105 | 5 | 228 | 986 | 58.3% |
| Natural gas (GJ) | 0 | 0 | 759 | 0 | 0 | 759 |
| WSHP | Electricity (GJ) | 103 | 2 | 88 | 105 | 55 | 353 | 941 | 56.3% |
| Natural gas (GJ) | 0 | 0 | 588 | 0 | 0 | 588 |
| GSHP | Electricity (GJ) | 87 | 0 | 121 | 105 | 55 | 369 | 528 | 22.1% |
| Natural gas (GJ) | 0 | 0 | 159 | 0 | 0 | 159 |
| WS VRF | Electricity (GJ) | 58 | 1 | 54 | 30 | 39 | 181 | 835 | 50.7% |
| Natural gas (GJ) | 0 | 0 | 653 | 0 | 0 | 653 |
| GS VRF | Electricity (GJ) | 46 | 0 | 116 | 39 | 50 | 252 | 411 | — |
| Natural gas (GJ) | 0 | 0 | 159 | 0 | 0 | 159 |
Table 10.
Annual heating, ventilating, and air-conditioning (HVAC) energy costs of the existing office building in Barberton, OH.
Table 10.
Annual heating, ventilating, and air-conditioning (HVAC) energy costs of the existing office building in Barberton, OH.
| | PTAC | WSHP | GSHP | WS VRF | GS-VRF |
|---|
| Electricity | $6114 | $9481 | $9901 | $4872 | $6763 |
| Natural gas | $3743 | $2900 | $786 | $3222 | $786 |
| HVAC sum | $9857 | $12,381 | $10,687 | $8094 | $7549 |
| Saving by GS-VRF (%) | 23% | 39% | 29% | 7% | — |
Table 11.
Peak energy demand of heating, ventilating, and air-conditioning (HVAC) systems for the office building in Barberton, OH.
Table 11.
Peak energy demand of heating, ventilating, and air-conditioning (HVAC) systems for the office building in Barberton, OH.
| Peak Demand | PTAC | WSHP | GSHP | WS-VRF | GS-VRF |
|---|
| Electricity (kW) | 104 (July 21, 13:00) | 123 (July 21, 13:00) | 114 (July 21, 14:00) | 77 (July 21, 14:00) | 84 (Jan 19, 09:00) |
| Natural gas (kW) | 521 (Jan 19, 07:00) | 539 (Jan 19, 06:00) | 84 (Feb 17, 08:00) | 540 (Jan 19, 06:00) | 84 (Feb 17, 08:00) |
Table 12.
U.S. Energy Information Administration (EIA) energy rates [
24,
25].
Table 12.
U.S. Energy Information Administration (EIA) energy rates [
24,
25].
| $/GJ | 1A | 2A | 2B | 3A | 3B | 3C | 4A | 4B | 4C | 5A | 5B | 6A | 6B |
|---|
| Electricity | 26.9 | 22.7 | 27.5 | 27.5 | 40.0 | 40.0 | 30.3 | 26.2 | 25.8 | 23.9 | 26.4 | 26.8 | 27.9 |
| Natural Gas | 10.1 | 7.2 | 8.4 | 7.4 | 7.9 | 7.9 | 8.7 | 5.6 | 7.2 | 5.7 | 6.1 | 6.0 | 6.8 |
Table 13.
Annual heating, ventilating, and air-conditioning (HVAC) energy costs of the medium-size office building in various climate zones.
Table 13.
Annual heating, ventilating, and air-conditioning (HVAC) energy costs of the medium-size office building in various climate zones.
| System | PTAC | WSHP | GSHP | WS-VRF | GS-VRF |
|---|
| Utility | Elec. | Natural Gas | Elec. | Natural Gas | Elec. | Natural Gas | Elec. | Natural Gas | Elec. | Natural Gas |
|---|
| 1A | $15,537 | $342 | $18,365 | $176 | $17,347 | $32 | $10,574 | $232 | $10,149 | $32 |
| 2A | $9678 | $1477 | $11,798 | $1005 | $11,343 | $260 | $6644 | $1175 | $6608 | $260 |
| 2B | $13,421 | $1377 | $14,387 | $889 | $13,937 | $221 | $7531 | $1059 | $7749 | $221 |
| 3A | $8438 | $2984 | $11,020 | $2178 | $10,848 | $547 | $5843 | $2496 | $6478 | $547 |
| 3B | $10,462 | $1229 | $11,785 | $681 | $11,623 | $125 | $5792 | $823 | $5891 | $125 |
| 3C | $7138 | $2649 | $8950 | $1741 | $9431 | $383 | $4040 | $2015 | $5130 | $383 |
| 4A | $8467 | $5271 | $12,168 | $3991 | $12,291 | $987 | $6370 | $4527 | $7768 | $987 |
| 4B | $7587 | $2492 | $9434 | $1802 | $9415 | $540 | $4594 | $2066 | $5546 | $540 |
| 4C | $4526 | $3902 | $6565 | $2863 | $7005 | $726 | $3076 | $3265 | $4479 | $726 |
| 5A | $5649 | $4776 | $8967 | $3747 | $9470 | $952 | $4780 | $4131 | $6540 | $952 |
| 5B | $6146 | $3780 | $8609 | $2838 | $8870 | $796 | $4238 | $3197 | $5724 | $796 |
| 6A | $6064 | $6261 | $10,316 | $5010 | $11,309 | $1272 | $5720 | $5479 | $8589 | $1272 |
| 6B | $5150 | $6236 | $8686 | $4893 | $9697 | $1340 | $4488 | $5388 | $7254 | $1340 |
Table 14.
Peak electricity demand specific to all heating, ventilating, and air-conditioning (HVAC) systems for the baseline office building located in various U.S. climates.
Table 14.
Peak electricity demand specific to all heating, ventilating, and air-conditioning (HVAC) systems for the baseline office building located in various U.S. climates.
| Electricity (kW) | PTAC | WSHP | GSHP | WS-VRF | GS-VRF |
|---|
| 1A | 118 (Sep 7, 15:00) | 143 (Sep 7, 15:00) | 128 (Sep 7, 15:00) | 87 (July 29, 15:00) | 82 (July 29, 14:00) |
| 2A | 116 (July 30, 12:00) | 135 (July 30, 12:00) | 125 (July 30, 12:00) | 89 (July 30, 12:00) | 82 (July 30, 12:00) |
| 2B | 125 (July 19, 15:00) | 124 (Jun 8, 15:00) | 118 (Jun 8, 15:00) | 77 (July 19, 15:00) | 75 (July 19, 15:00) |
| 3A | 101 (July 29, 13:00) | 122 (July 29, 13:00) | 114 (July 29, 13:00) | 79 (July 29, 13:00) | 72 (July 29, 13:00) |
| 3B | 73 (Sep 9, 12:00) | 86 (Sep 9, 12:00) | 84 (Sep 9, 12:00) | 49 (Sep 9, 12:00) | 44 (Sep 9, 12:00) |
| 3C | 51 (Sep 15, 14:00) | 58 (Sep 2, 15:00) | 57 (May 26, 14:00) | 32 (Sep 2, 15:00) | 46 (Dec 20, 09:00) |
| 4A | 95 (Aug 17, 15:00) | 115 (Aug 17, 15:00) | 110 (July 26, 11:00) | 77 (Aug 17, 15:00) | 81 (Dec 20, 09:00) |
| 4B | 89 (July 19, 15:00) | 96 (July 19, 15:00) | 95 (July 19, 15:00) | 54 (July 19, 15:00) | 68 (Dec 27, 09:00) |
| 4C | 83 (Sep 2, 15:00) | 94 (Sep 2, 15:00) | 85 (Sep 2, 15:00) | 54 (Sep 2, 15:00) | 62 (Dec 20, 09:00) |
| 5A | 101 (Jun 8, 14:00) | 120 (Jun 8, 14:00) | 105 (July 19, 12:00) | 78 (Jun 8, 14:00) | 76 (Dec 27, 09:00) |
| 5B | 88 (July 19, 14:00) | 99 (July 19, 14:00) | 93 (July 19, 14:00) | 57 (July 19, 14:00) | 73 (Feb 16, 09:00) |
| 6A | 99 (July 15, 15:00) | 121 (July 15, 15:00) | 111 (Dec 20, 09:00) | 86 (Dec 20, 09:00) | 93 (Dec 20, 09:00) |
| 6B | 78 (July 19, 15:00) | 89 (July 19, 15:00) | 95 (Dec 27, 09:00) | 56 (Dec 27, 09:00) | 82 (Dec 13, 09:00) |


