Article

A Fusion Approach for Exploring the Key Factors of Corporate Governance on Corporate Social Responsibility Performance

1
Accounting School, Nanfang College of Sun Yat-sen University, Guangzhou 510970, China
2
Finance and Accounting Research Center, Nanfang College of Sun Yat-sen University, Guangzhou 510990, China
3
Department of Accounting, Chinese Culture University, Taipei 11114, Taiwan
4
English Program of Global Business, Chinese Culture University, Taipei 11114, Taiwan
*
Author to whom correspondence should be addressed.
Sustainability 2018, 10(5), 1582; https://doi.org/10.3390/su10051582
Submission received: 17 April 2018 / Revised: 10 May 2018 / Accepted: 11 May 2018 / Published: 15 May 2018

Abstract

:
It is widely recognized that a firm’s well-established corporate governance (CG) has a considerable impact on its corporate social responsibility (CSR) performance. How to determine the main trigger among CG’s indicators for strengthening CSR performance is thus an urgent and complicated task due to its (i.e., CSR) multi-dimensional and numerous perspectives. In order to solve this critical problem, the study breaks down CSR into four dimensions and further examines the impact of CG’s indicators on each CSR dimension by joint utilization of rough set theory (RST) and decision tree (DT). By doing so, users can realize which one CG indicator is the most essential to CSR performance. Managers can take the results as a reference to allocate valuable and scarce resources to the right place so as to enhance CSR performance in the future. To solidify our research finding, we transform the CSR forecasting model selection into a multiple criteria decision making (MCDM) task and execute a MCDM algorithm. By implementing the MCDM algorithm, users can achieve a much more reliable and consensus decision in today’s highly turbulent economic environment. The proposed mechanism, examined by real cases, is a promising alternative for CSR performance forecasting.

1. Introduction

A broad spectrum of corporate scandals, such as Enron’s collapse, the looting of Tyco, WorldCom’s accounting fraud, etc., highlights the importance of corporate governance (CG). Reforms in CG have developed unceasingly around the world over the last decade. CG mechanisms play a critical role in effective company operations and help achieve the implementation of sustainable development goals. In order to rebuild trust and confidence in enterprises, new CG rules based on ethical standards have been gradually constructed, such as the scrupulous consideration of an equally and mutually beneficial relationship with company stakeholders. The pressure for strong CG has come from investors’ requirements, as companies should adopt higher ethical standards and push for growing corporate social responsibility (CSR) initiatives. In Europe, for example, governments promote codes of conduct for CG. Thus, in order to meet the opportunities and challenges of corporate responsibility, the China Securities Regulatory Commission issued its own code of corporate governance for domestic listed companies in 2001 to reinforce the stable development of enterprises.
CG is defined by a whole set of mechanisms, including institutional arrangements, decision-making systems, and organization design. It also indicates how to protect the legitimate rights of stakeholders and the responsibility that must be shouldered as consigned by clients. Hence, CG implies ethical issues and accountability [1,2,3,4]. CG further leads to the separation of ownership and control, resulting in agency problems [5]. In fact, the core issue of CG is to solve the agency problem between shareholders and administrators. An effective structure of CG can help prevent the occurrence of illegal activities that harm stakeholders. Strong CG is a type of a guarantee for efficient operation performances and higher firm value [6,7] and the implementation of CSR activities.
The literature has recently redefined CG in terms of benefitting all shareholders as well as all constituents of society. The concept of common governance by stakeholders has arisen, whereby the establishment of relevant mechanisms can coordinate the relationship among stakeholders (such as senior management, consumers, and employees) in order to achieve the goal of maximizing the interests of all stakeholders [8]. Good CG practices should establish both public and market trust and take into account society and environment [9]. In fact, organizations are increasingly required to balance the social, political, economic, cultural, and environmental elements of their business, while at the same time creating shareholder value [10]. Jo and Harjoto [11] noted that CG involves the same main content as CSR and is related to enterprise value. The objective of CG is thus gradually consistent with the fulfillment of CSR. However, how to improve CG structures to maximize the profits of a company is also best for society in regards to the purposes of CSR.
The basic idea behind CSR is that business and society mutually influence each other rather than being independent entities [12]. The earliest concept of CSR was proposed by Sheldon [13], who claimed that CSR should include ethical factors, and that corporate ethics and social environment should be emphasized. The father of CSR, Bowen, believed that a company is obligated to pursue all activities that are in line with social values and social satisfaction, and profit cannot be used as a single objective [14]. Not only do enterprises have various economic and legal obligations, they are also required to be concerned about the environment and society in order to fulfill their social responsibilities. Carroll [15] indicated that social responsibility must be sufficient to satisfy the overall scope of corporate responsibilities to society. It includes economic, legal, moral, and disposable corporate factors to fully reflect corporate social responsibility performance. A practical corporate social responsibility assessment model should thus consider and improve upon the three aspects of corporate social responsibility principles and processes as well as the results of corporate behavior [12]. One should start from the three principles of institution, organization, and individual; the process should premeditate on an appropriate environmental assessment, stakeholder management, and problem management; the results of corporate behavior should include social impacts, social programs, and social policies. CSR can be viewed as the process by which managers are responsible for people affected by the company [16]. A company’s obligation to its stakeholders is to maximize its positive impact and minimize its negative impact [17].
CG closely relates to CSR performance, because they both reflect the commitment of an organization to its stakeholders and its interactions with the community as a whole [3,18]. Kolk and Pinkse [19] observed that strengthening the CG rules of companies denotes a focus that not only promotes the ethics of the board of directors and senior management, but also the active care for communities, the environment, and stakeholders. Some organizations firmly believe that their success is directly related to the well-being of the society in which they are located, since they cannot just prosper in isolation. Arora and Dharwadkar [20] presented robust evidence that good CG results in a reduction effect of negative CSR. Prior research [18,21,22] showed that CG is strongly and intricately associated with CSR, and they are like two sides of the same coin [23]. Therefore, according to the above, when a CG system is sound, the system influences the corporate administration, as it is able to execute a better implementation of CSR activities and thus increase firm performance.
Despite several decades of research [24,25,26], traditional regression analysis is still used to investigate the impacts of CG factors on CSR performance. This regression analysis can only be used correctly under the assumption of normal distribution, which is often not the case in the real world. With the great advancement in Internet and information technology, a favorable analytic tool has been proposed, called data mining (DM). While it does not obey strict statistical assumptions, it does offer superior generalization ability. One DM technique, namely rough set theory (RST) [27,28], soon arrived on the scene. It is able to handle data with uncertainty, vagueness, and imprecision, and it can also extract inherent knowledge and represent it in a human-readable format. Due to the abovementioned advantages of RST, we utilize it to examine the impact of CG on CSR performance and to further establish a CSR forecasting model.
The contributions of this study are four-fold. First, in comparison with traditional statistical-based models, the forecasting model grounded on RST poses higher forecasting quality and less biased outcome. Second, this study decomposes CSR into four sub-indicators of “Responsibility management”, “Market responsibility”, “Social responsibility”, and “Environment responsibility” and further examines the impact of CG on each dimension/sub-indicator. By doing so, users can realize which CG indicator is the most influential on CSR performance. Managers can then allocate scarce and valuable resources to the right place so as to improve their firm’s CSR performance. Third, this study transforms the CSR forecasting model selection into a multiple criteria decision making (MCDM) task and then utilizes a MCDM algorithm to solve it systematically. Fourth and finally, the inherent decision rules extracted from RST can be viewed as a reference for how to improve and solidify CSR in the future.
The remainder of this paper is organized as follows. It starts with a review of the literature. Next, it explains the research methodologies adopted herein, followed by research design and practical examinations. This paper then closes with conclusions and implications.

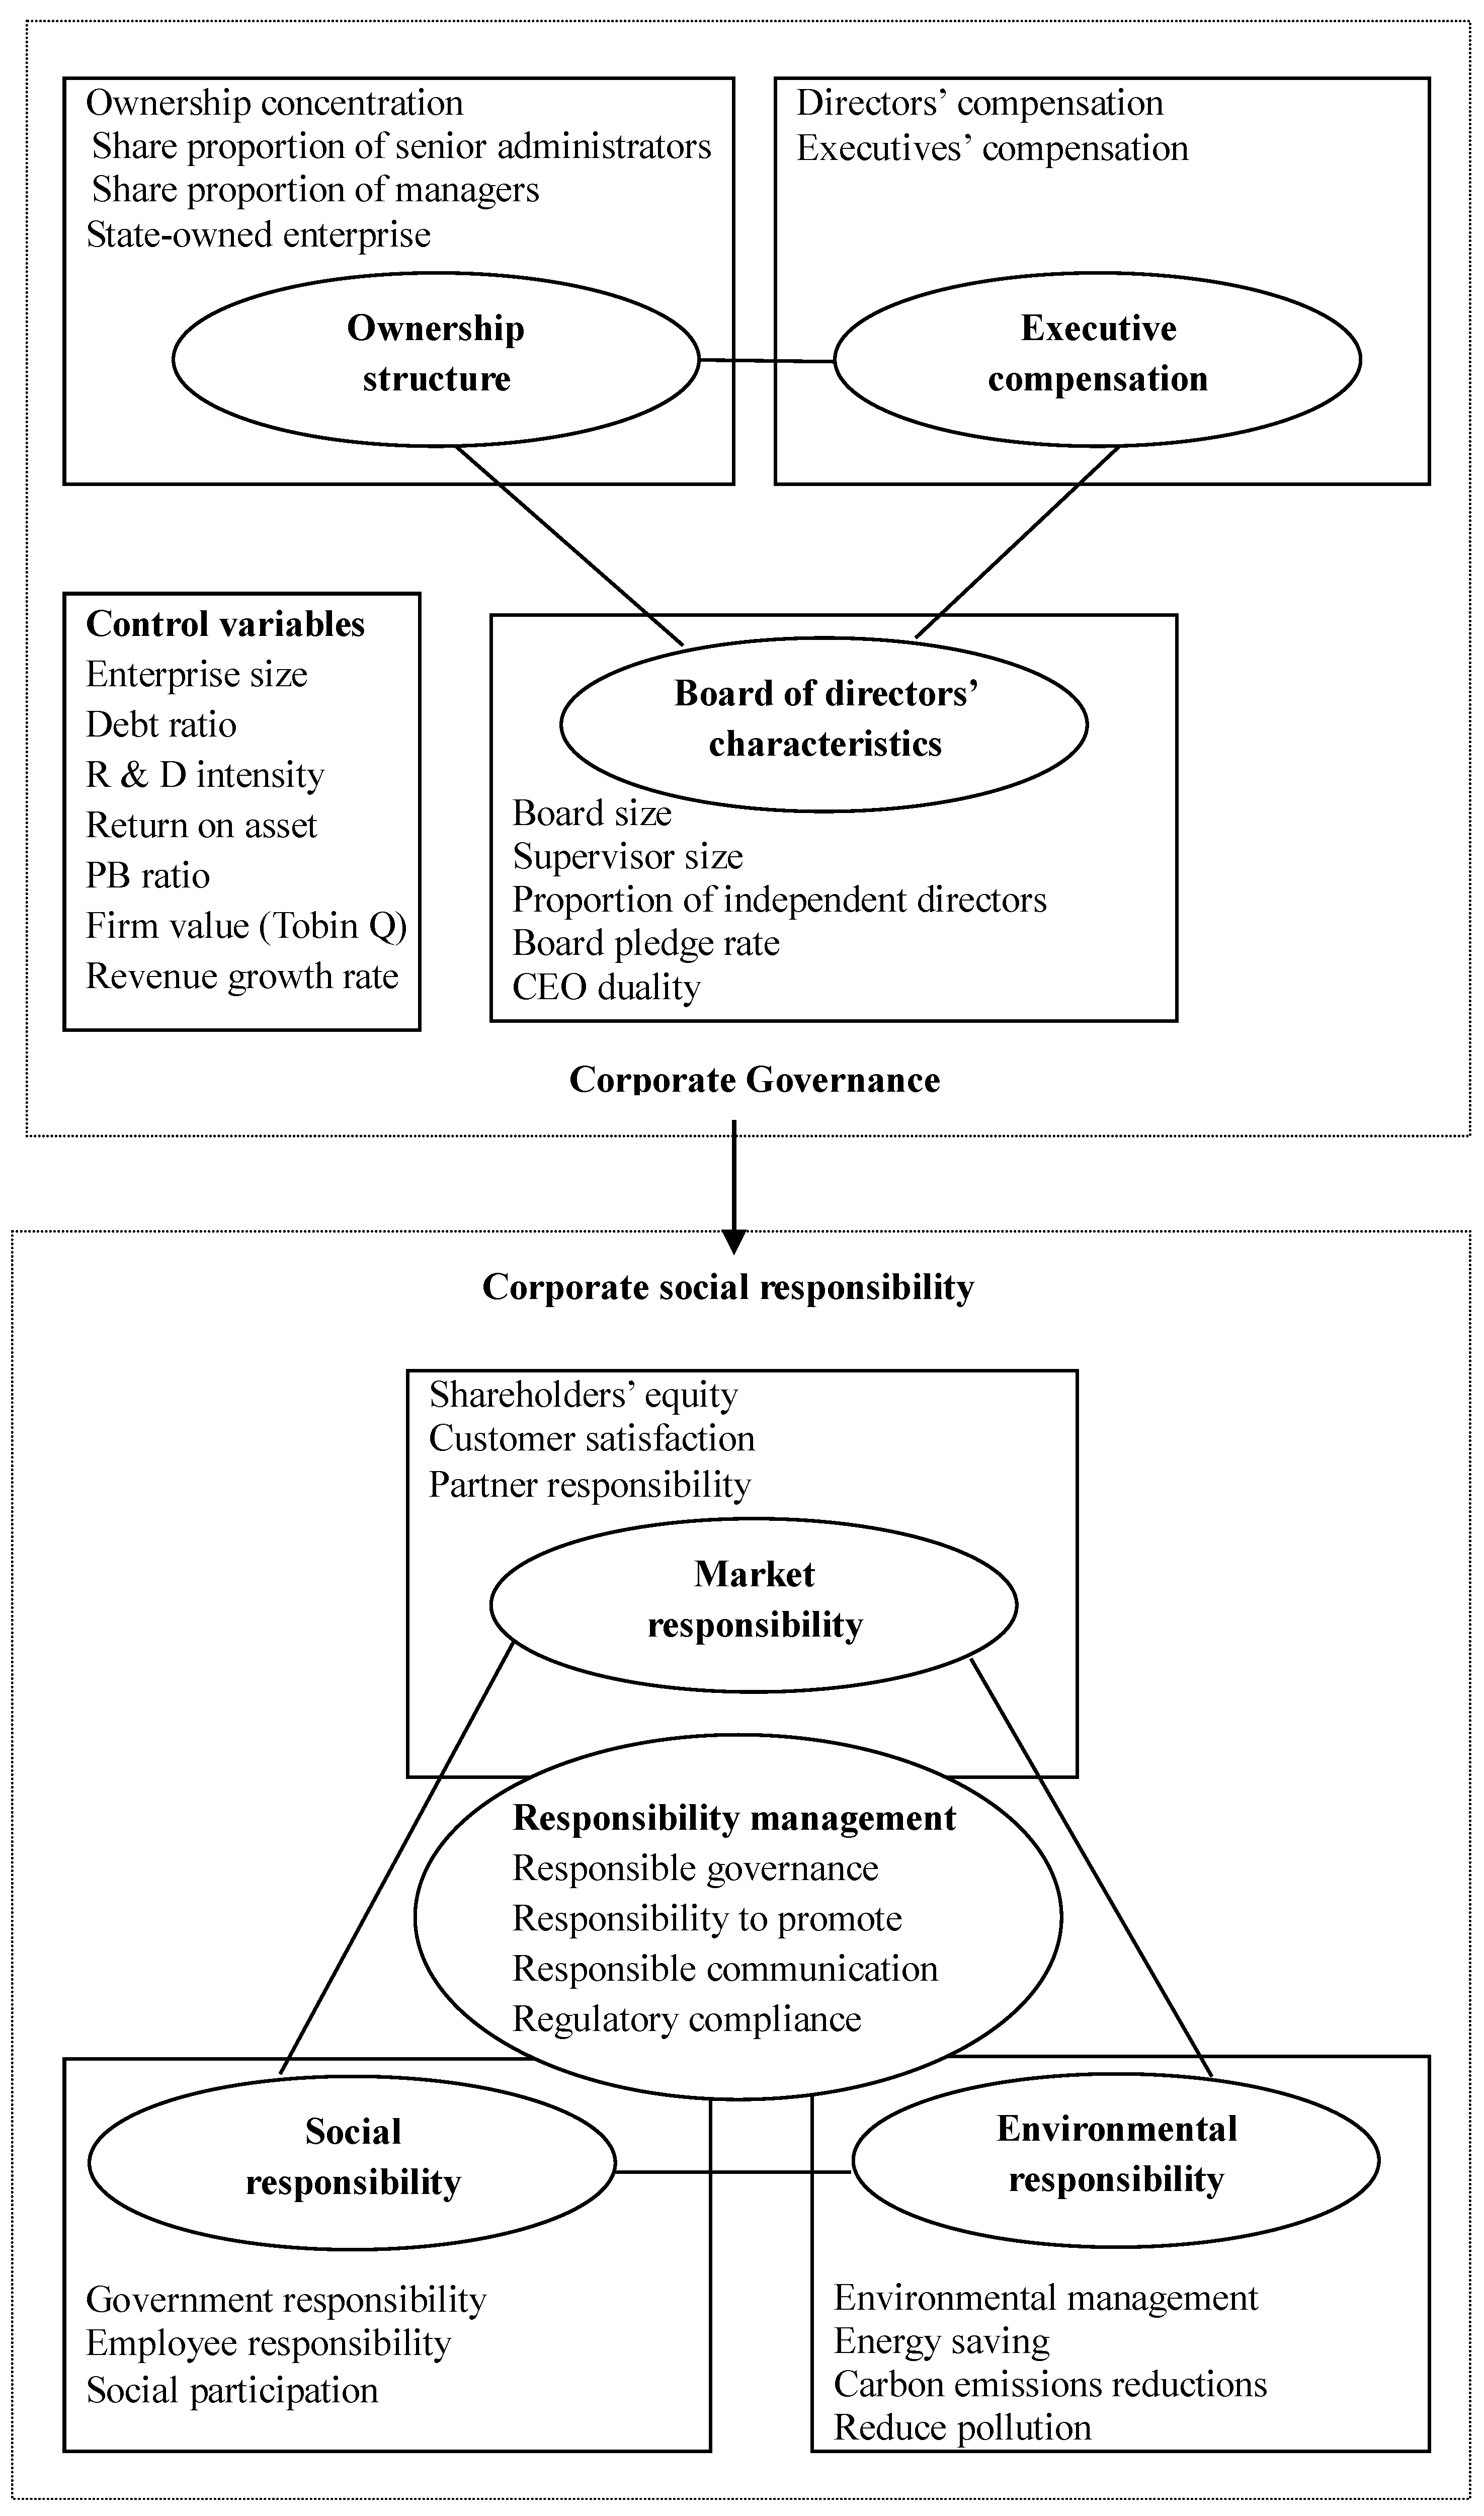
2. Corporate Governance and Corporate Social Responsibility

CG represents the much broader relationships between an enterprise and society. High levels of CG should help guarantee shareholders’ rights and ensure social responsibility. A comprehensive CG structure provides the means for CSR, and fulfilling social responsibility is the goal of a CG structure’s sustainable development [29,30]. Hence, an effective CG framework is the cornerstone for bearing social responsibility. Based on the literature review, we group many kinds of variables related to corporate governance’s impact on CSR into three categories (see Figure 1).

2.1. Board of Directors’ Characteristics

The board of directors plays a decisive role in the operating efficiency of a business, and directors’ actions affect CSR and firm performance [31]. The board of directors has a fiduciary responsibility to ensure that the company provides a reliable and integral CSR report [24]. Generally, a larger board size denotes a lesser ease of communication as well as worse decision-making efficiency for the enterprise. This could lead to a disregard for CSR, which is not conducive to its proper implementation [32].
Independent directors have greater external independence and professionalism for helping to supervise company operations and for protecting the interests of non-executive shareholders [33]. As a defender of shareholder rights, they might strengthen the corporate information disclosure system and improve the implementation of CSR [34]. The supervisory board is also one of the important factors in enterprise development, and its core function is to supervise the actions of directors and senior managers, thus assisting in the fulfillment of CSR [32]. A higher proportion of collateralized shares of directors and supervisors’ shareholdings implies that lower corporate performance [35] may lead to a decrease in CSR activities. CEO duality refers to the positions of board leadership and corporate management being held simultaneously by the same person. Thus, CEO duality is generally deemed to significantly expand CEO power, while the level of CSR disclosure is negatively associated with CEO duality [36,37,38].

2.2. Ownership Structure

Hu et al. [39] argued that the decision-making and quality of CSR disclosure can be recognized from the perspective of corporate ownership and whether firms pay attention to CSR engagement. Walls et al. [40] also pointed out that ownership structure can affect firms’ CSR activities in developed countries. Generally, when controlling shareholders are able to obtain a company’s internal information more easily, they typically will seek out personal benefits and plunder the interests of minority shareholders. Thus, they are less willing to expose their own company’s information and oftentimes provide no effort to implement CSR. China’s economic development is based on state-owned enterprises forming the main pillars, with the government as the controlling shareholder of state-owned enterprises. The government mainly provides public services and facilities to achieve social, economic, and environmental development goals, and hence state-owned enterprises there must bear more CSR. Moreover, ownership concentration negatively correlates to CSR disclosure for financial institutions [41], and a higher ratio of managers as shareholders represents less disclosure of CSR information [42].

2.3. Executive Compensation
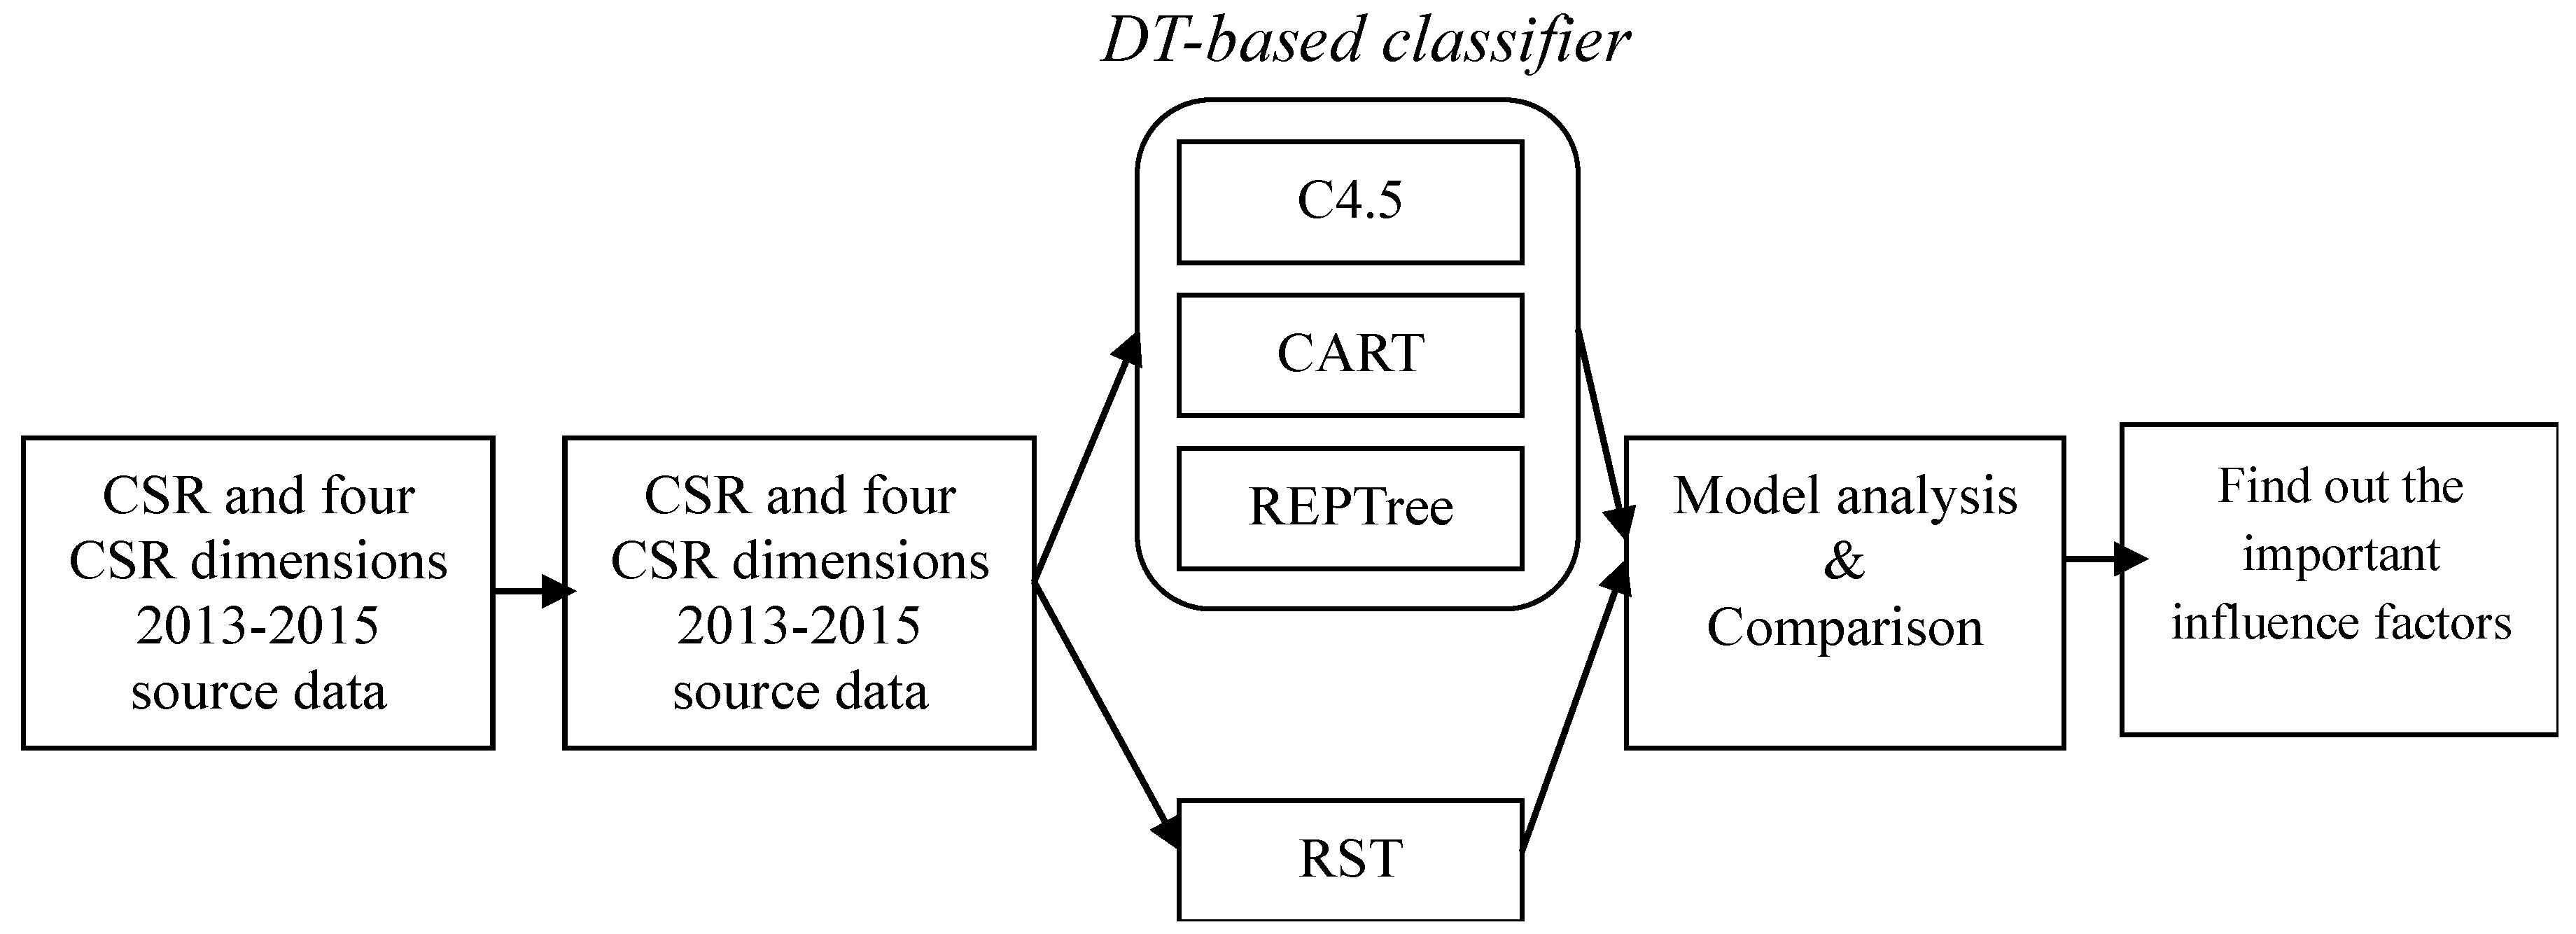
The agency problem refers to the information asymmetry between top executives and shareholders. Providing an appropriate incentive compensation for supervisors is the most effective tool to reduce agency costs. High remuneration levels may also motivate senior administrators to put forth greater efforts in business operations for the benefit of their company and shareholders, which would increase information disclosure and set up a more enthusiastic engagement of CSR initiatives [25]. Previous studies have presented an inconclusive relationship between senior executive compensation and CSR; some show it as being positive [16,25], while others see it as being negative [26,43,44,45]. Jian and Lee [44] suggested that the relationship between executive (CEO) compensation and CSR depends on whether CSR is normal (optimal expenditure in CSR activities) or abnormal (overinvestment in CSR activities). According to Rekker et al. [3], whether or not the compensation to the CEO is in the form of cash, bonus, or long-term incentive (such as equity), they all show a negative relationship between CSR activities and CEO compensation.

3. Data and Methods

This section describes the sample data construction and proposed methodology to illustrate the feasibility of rough set theory (RST) and decision tree (DT).

3.1. Data and Sample Construction

We collect the data related to the CSR variables herein from the top 100 enterprises in the Research Report on Corporate Social Responsibility of China from the Blue Book of Corporate Social Responsibility during 2013–2015. Owing to the complexity and multiple items of CSR performance, with big differences and requirements among industries, it is difficult to improve the performance of CSR. Therefore, in order to clearly understand the impact of CG on CSR, this study divides CSR into four sub-indicators of “Responsibility management”, “Market responsibility”, “Social responsibility”, and “Environmental responsibility” based on the Research Report on Social Responsibility of China in the Blue Book of Corporate Social Responsibility issued by Chinese Academy of Social Sciences [45]. Chinese Academy of Social Sciences is one of China’s CSR performance evaluation authoritative professional organizations, similar to KLD in the U.S. (Kinder, Lydenberg, and Domini), and the annual published CSR performance report is widely accepted by the public. The CG and control variables come from the China Center for Economic Research Sinofin Information Service (CCER/SinoFin). This study selects 15 independent and control variables that may influence CSR variables based on prior CG and CSR research. We exclude those firms with missing CG and control variables, leaving 201 samples for analysis by the following methodology.
According to previous literature, CG factors can be generalized into three categories that affect CSR activities: board of directors’ characteristics, ownership structure, and executive compensation. We select 11 CG factors for this study and measure them in order to determine which ones significantly influence CSR. Among them, “board size”, “supervisor size”, “proportion of independent directors”, “board pledge rate”, and “CEO duality” are used to measure the board characteristics; “ownership concentration”, “share proportion of senior administrators”, “share proportion of managers”, and “state-owned enterprise” are used to describe the ownership structure; share proportion of managers; “directors’ compensation” and “executives’ compensation” are used to illustrate executive compensation. In addition, in order to clarify the relationship between CSR performance and CG variables, this study also takes into consideration control variables that might affect CSR initiatives. Table 1 lists the details of the variable codes, variable names, and calculation methods.

3.2. Rough Set Theory:RST

Rough set theory (RST) is a widely accepted method for detecting hidden knowledge and for data mining practical applications in many domains [53,54,55,56]. Pawlak [57] proposed RST in order to overcome multi-attribute decision problems [53] and to determine the relative importance of each attribute. Rough set theory also clarifies any indiscernibility relation and processes with ambiguous information [54], helping to probe data patterns and decision-making procedures. Rough set theory belongs to a mathematical approach that deals with ambiguous information and uncertain data, the core content (such as information systems, indiscernibility relations, and approximation sets), reduct and core attribute sets, and decision rules. We shall discuss these issues herein.

3.2.1. Information Systems

We set up an information system IS = (U, A, V, γ), U = {x1, x2,…, xn}, where U is the universal object sets of IS; A = {c1, c2,…, cq}, where A denotes a finite set of the attributes/features; and V = U c A V c represents a domain of attribute a. Let γ : U × A V be an information function, where γ ( x , c ) V c for V c A , V x U [ 0 , 1 ] [27,28]. An information system is also used to form a decision table, including condition attributes and decision attributes.

3.2.2. Indiscernibility Relation and Approximation Accuracy

Every Q A determines an indiscernibility relation IND(Q) on U, and it is defined as c Q if γ x 1 ( c ) = γ x 2 ( c ) for every c A . Here, U/IND(Q) is a partition of U by Q and put in a group of an equivalence class; the process is called classification. The attributes of any xi of U that are represented in Q have the same class as elementary sets.
Let Q A and X U , and Q _ ( x ) denotes the lower approximation of X and Q _ ( x ) = { x U : [ x ] U / I N D ( Q ) X } ; Q ¯ ( x ) denotes the upper approximation of X and Q ¯ ( x ) = { x U : [ x ] U / I N D ( Q ) X ϕ } ; and B n d Q ( x ) = Q ¯ ( x ) Q _ ( x ) is the boundary region of X, which represents that the objects are ambiguous or undefinable.

3.2.3. Reduction of Attributes and Core Attribute Set

Rough set theory encompasses the two basic concepts of reduction and core attribute set. In an information system, some attributes may be redundant and useless and can be deleted without affecting the result [28,57]. The purpose of reduction is to improve the accuracy of decision-making, and so one reduces the elementary set number of attributes. However, the process of reduction may produce a number of sets for reduced attributes, and the intersection of the attribute sets yields a core attribute; this core attribute is the most important decision-making foundation. We let R E D ( P ) A , where R E D ( P ) consists of multiple reduced sets of attributes and is the minimum set of attributes. An information system may have multiple attribute sets, and the set of attributes obtained by the intersection of multiple minimum attribute sets is called a core C O R ( D ) = R E D ( P ) . Accordingly, we are able to find the reduced attribute sets and decision rules.

3.3. Decision Tree: DT

Decision tree is a data mining methodology for developing a tree-based model that can solve classification and prediction problems and has been applied to solve real-world problems [58,59]. Decision tree provides a binary model with a tree-shaped structure that separates a limited number of sub-nodes from the root node [60]. The tree is constructed from top to bottom, using suitable criteria for different input variables, and the nodes are created after repeated data partitioning until a stopping rule is achieved as the best partition (important variables) of the discovered objects. This study adopts the three decision tree (DT)-based models of CART, C4.5, and REPTree, which we describe as follows.

3.3.1. Classification and Recression Tree: CART

Classification and Regression Tree (CART) is a binary partition technique for data mining and a prediction algorithm established by Breiman et al. [61]. The binary decision tree generated by the CART algorithm is more accurate in many cases than the prediction criteria constructed by traditional statistical methods, and the more complex the data are or the more variables that exist, the more significant is the superiority of the algorithm. The CART algorithm is a non-parametric model that is a successive process of splitting data into smaller parts, in order to determine the maximum homogeneity criterion (right variable) of the response variable data. CART builds a sophisticated tree according to the results of the independent test data or cross-validation, which is then pruned to the optimal tree when no further improvements can be made [62,63,64]. With respect to missing values, the CART algorithm provides the best handling through alternatives. The aforementioned characteristics make CART a robust prediction tool that serves holistically ultraclean results.
The objective of the CART technique is to minimize the impurity of the leaf nodes when measuring the minimum Gini index to choose the best attribute. The Gini index is applied to the CART algorithm. We first suppose that the root (data) S include m categories D1, D2,…, DK, which have a set of attribute A’s values, aj, that are partitioned into two disjoint subset SL ansd SR. Let lk and rk denote the numbers in category Dk in subsets SL and SR, respectively, where k = 1,2,…,K. We present the Gini index of attribute A in S, resulting from the choice of partition A, as:
G i n i ( A , a ) = p [ 1 k = 1 K ( l k | S L | ) 2 ] + ( 1 p ) [ k = 1 K ( r k | S R | ) 2 ] ,
where p = | S L | | S | and 1 p = | S R | | S | denote the fraction of data elements from S. For a further explanation of the CART method, please refer to Breiman et al. [61].

3.3.2. C4.5 Decision Tree: C4.5

The ID3 model [59] is replaced by the C4.5 model, because the latter can deal with continuous attributes, missing values, tree pruning, and so on. The C4.5 decision tree algorithm chooses an independent variable in each node by measuring the information gain-ratio criterion, which has also been identified as a standard model for classification. We apply the algorithm to select the best attribute from the dataset based on the entropy-based concept, as it provides a bigger gain from using the entropy measure [64].
Let A = { A 1 , A 2 , , A m } be an attribute set, C = { C 1 , C 2 , , C n } is a class set, and S = { s i v , 1 i m , 1 v K } is the set of training data, where s i v represents the vth data value for Am, and K is the total amount of training data. The information entropy for the set S focuses on the choice of attribute Am, to be given by:
E n t r o p y ( S ) = g = 1 G p s ( g ) log 2 p s ( g ) ,
where G is the number of different values belonging to the class C n , and p s ( g ) = C n / K is the probability of the gth attribute value (each outcome) in set S.
The conditional entropy, E n t r o p y ( S , B k ) , is the weighted sum of the entropy (Si), which can be calculated as:
E n t r o p y ( S , B k ) = i = 1 n | s i | | s | E n t r o p y ( S i ) ,
where si is the number of instances in subset Si; and x is the number of instances for the training samples. Thus, the information gain should be computed as:
G a i n ( S , B k ) = E n t r o p y ( S ) E n t r o p y ( S , B k ) .
The split information S p l i t I n f o ( S , B k ) is measured by dividing the training data into the smaller subsets, which is defined as:
S p l i t I n f o ( S , B k ) = i = 1 n | s i | | s | l o g 2 ( | s i | | s | ) .
Generally, if there are many attributes, the information gain is high, and the split information is also high, then the gain in normalized entropy can reduce the flaws of the information gain. For the normalization of the information gain, the information gain-ratio can be computed as:
G a i n R a t i o ( S , B k ) = G a i n ( S , B k ) S p l i t I n f o ( S , B k ) .
The information gain-ratio, which is the number of values of an attribute and the proportion of these values in a database, helps improve the attribute bias of information gain. However, in a comparison with other attributes, the gain ratio can find the largest gain ratio. The maximization of the information gain ratio is used to select the attribute of the bigger gain in the procedure of each step of the C4.5 algorithm.

3.3.3. Reduces Error Pruning Tree: REPTree

Quinlan [59] first recommended the Reduces Error Pruning (REP) Tree method, which is based on information gain being the splitting criterion and executes reduced-error pruning or minimizes the variation. REPTree applies regression/decision tree logic and fabricates child trees in different iterations. It then chooses the best one from all child trees. The REPTree algorithm also can easily handle missing values, just like the C4.5 algorithm.

4. Results and Analysis

4.1. Descriptive Statistics

Figure 2 illustrates the research flowchart of this study, and Table 2 depicts the descriptive statistics of the independent variables. Table 2 demonstrates that the average scores of CSR and the four CSR dimensions are lower than 50, indicating that CSR practices are at the initial stage in China, and that there is still much room for improvement. Environmental responsibility has the lowest score of 32.43 among the four CSR dimensions, implying that enterprises’ awareness of environmental protection is still very weak and highlighting the serious environmental problems that need to be resolved in China. A minimum value of 33.33% for the proportion of independent directors shows that one-third of company boards achieve the basic requirements according to the Securities Exchange Act of China, and the average value of 39.98% is also not high. In fact, the establishment of an independent directors system is often not proactively done with the willingness of a listed company or its senior managers. Top management teams generally do not support the establishment of an independent director system, because it conflicts with their personal interests. The mean value of the board pledge rate representation is only 7.79%, with a maximum representation of 92.88%, indicating large differences among firms. Similarly, the maximum value of ownership concentration is 98.45%, and the minimum value is 2.89%, while the average value is 59.09%. Over concentration in ownership, state-owned shares or corporate shares occupying absolute controlling positions and the smaller proportion of public shares, which are most listed companies in China, represents ubiquitous characteristics of ownership structure.

4.2. Analysis of Empirical Results

Rough set theory and data mining are conducted on models to investigate the influence of CG factors on CSR and the sub-indicators (Responsibility management, Market responsibility, Social responsibility, and Environmental responsibility). How to evaluate the model’s forecasting quality is a critical task. One of the most commonly utilized assessment measures is the overall accuracy/error rate, but only executing one assessment measure and then reaching the final conclusion is not reliable or trustworthy. Thus, this study takes up two dissimilar assessment measures: Type I error and Type II error. Type I error means that a corporate with good CSR performance is misclassified as having bad CSR performance. Type II error means that a corporate with bad CSR performance is misclassified as having good CSR performance. Type I error results in an additional investigation. Type II error may result in destroying a corporate’s reputation and value as well as cause financial disturbance. Thus, the misclassification cost of Type II error is much more essential than that of Type I error [57,65,66].
DT-based classifiers (i.e., C4.5, REPTree, and CART) and RST have widely demonstrated their superior performance in feature selection (FS), but it is obvious that no specific FS technique can achieve optimal performance under all assessment measures [66]. The basic concept of ensemble learning is to complement the error made by a single mechanism. Based on this perspective, we realize that “Board pledge rate (X4)” is the most important feature—that is, this feature has the highest frequency of appearance (see Table 3).
Kao et al. [67] also stated that the ratio of collateralized shares by directors and supervisors aggravates the agency problem of the enterprise, thus preventing directors and supervisors from performing their duty and supervising the enterprise effectively. Therefore, the enterprise will more than likely neglect its social responsibility. Among the control variables, “Enterprise size (X12)” has the highest frequency of appearance, implying that this factor leads to a strong relationship between firm size and CSR performance. Differences in CSR activities indeed exist among corporates, with larger companies disclosing more information than smaller ones [68,69,70]. In general, product diversity and the geographies of large firms involve larger and more complex groups of stakeholders, thus attracting the concern of communities [8]. In addition, smaller enterprises are less able to fulfill their social responsibilities due to a lack of funds [71].
To examine the effectiveness of the proposed decision-making architecture, this study takes the other three DT-based models into comparison, presenting the results in Table 4. We see that no model has the best forecasting quality under all assessment measures. Rokach [72] stated that model selection can be converted into a multiple criteria decision making (MCDM) task. Before implementing the MCDM algorithm, the performance score of each model should be decided. The performance score is calculated by performing a paired t-test for each model at the 5% significance level. The aim of the paired t-test is to evaluate whether the superior or inferior performance score of one model over another model is statistically significant [73,74,75,76]. We conduct Technique for Order Preference by Similarity to an Ideal Solution (TOPSIS) (See Appendix A), one of the MCDM algorithms with an intuitive mathematical formulation and easy-to-understand decision procedure, to handle this MCDM task. Table 5 shows the performance score of each classifier. Figure 3 represents the result of TOPSIS. We can see that RST reaches the 1st rank under all assessment measures. Thus, RST is a promising alternative model for CSR status forecasting.
The Research Report on Social Responsibility of China established a “Four-in-One” framework with responsibility management as the core and market responsibility as the basis, with social responsibility and environmental responsibility as the two wings. It highlights the importance of responsibility management and supposes that effective responsibility management is the cornerstone for corporates to implement their social responsibilities. Without sound responsibility management, companies will likely find it hard to implement CSR. Responsibility management exposes the current situation of CSR management, including the concept, system, behavior, and performance of management for social responsibility governance, social responsibility promotion, social responsibility communication, and compliance with regulations. Market responsibility discloses corporate market responsibility performance, including shareholder responsibility, customer responsibility, and partner responsibility. Social responsibility reveals corporate social responsibility performance, including government responsibility, employee responsibility, and community participation. Environmental responsibilities ensure that companies do a good job in environmental management, saving energy, and reducing pollution and emissions.
According to the empirical results of this paper, there exists a lower environmental responsibility index among the four dimensions, implying that the problems of environmental pollution in China are quite serious. Tang and Tang [69] shared the same view and suggested that the Chinese public sector should strengthen environmental laws and regulations in an effort to reduce the environmental damage from small- and medium-sized enterprises (SMEs). Encouraging self-regulatory companies, peer pressure, and industry-wide ethical standards in industry will help improve the environmental performances of SMEs. Because of the huge environmental impact on overall CSR, the government can strengthen corporates’ environmental responsibilities by developing codes of conduct and certifications that require them to provide more transparent environmental reports [68,69]. Therefore, due to the large differences in social responsibilities among the industries, the general issues of CSR in this study are mainly used to establish general evaluation indicators and sub-indicators of CSR performance. In combination with China’s industry characteristics, we can thus establish China’s CSR development index.

5. Conclusions

It is widely recognized that CG is the main trigger for CSR performance, but CG contains so many features that identifies which one is the most essential is very complicated. To overcome this challenge, we employ FS to determine the most important features without deteriorating the model’s forecasting quality [77,78,79,80]. However, none of the specific FS techniques can reach the best performance under all assessment measures. It is obvious that different FS techniques lead to different outcomes [80,81].
The fundamental idea behind ensemble learning is to complement the error made by a single mechanism. Grounded in this theory, this study determines the most important features for CSR through a joint utilization of RST and DT. To make our research findings more robust, we further divide CSR into four different dimensions (i.e., “Responsibility management”, “Market responsibility”, “Social responsibility”, and “Environmental responsibility”) and examine each feature’s influence on each dimension. By doing so, we are able to realize that the most essential feature in CSR performance is “Board pledge rate”. This finding is in accordance with Kao [67], who stated that the ratio of collateralized shares by directors and supervisors aggravates the agency problem of an enterprise, thus preventing directors and supervisors from performing their duty and supervising the enterprise effectively [82]. In other words, the enterprise is more likely to neglect its social responsibility in this situation.
We then take the analyzed result to construct the model for CSR performance forecasting. To obtain a more overarching and comprehensive measurement, this study transforms the model selection task into a MCDM task and executes the MCDM algorithm to solve it. The result shows that RST ranks 1st under all assessment measures.
Although this paper performs a mixture of RST and DT to explore the most important factors of CG on CSR performance, some interesting points may be worth investigating in future research studies. Artificial intelligence has already become a widespread application across diverse sectors and industries in recent years, resulting in changes to the corporate environment, whereby CG factors related to artificial intelligence may generate different effects on CSR plans. These important influential factors could be considered for formulating a deliberate CG structure so as to evaluate the impact of CSR in future studies. The corporate governance variables used in this study are mainly based on CG in the CSR-related literature and the characteristics of Chinese companies. Different results may arise if other variables are used. Future studies can consider selecting different variables to perform a comparison analysis so as to provide better practical results. In addition, the number of samples can be increased in order to strengthen the reliability of the results.

Author Contributions

For research articles with several authors, a short paragraph specifying their individual contributions must be provided. K.-H.H. designed the experiments and performed the experiments; M.F.H. and S.-J.L. analyzed the data and performed MCDM technique to determine the final outcome; K.-H.H., S.-J.L. and M.F.H. cooperated to write the paper. Authorship must be limited to those who have contributed substantially to the work reported.

Acknowledgments

The authors would like to thank the Ministry of Science and Technology, Taiwan, R.O.C. for financially supporting this work under contracts No. 106-2410-H-034-046-MY2 and No. 106-2410-H-034-011-MY3.

Conflicts of Interest

No conflict of interest exists in the submission of this manuscript.

Appendix A. Technique for Order Preference by Similarity to an Ideal Solution (TOPSIS)

Hwang and Yoon [83] introduced one of the multiple criteria decision making (MCDM) algorithms, called Technique for Order Preference by Similarity to an Ideal Solution (TOPSIS). It can be executed to rank and identify a volume of externally chosen alternatives by calculating the distance. The fundamental assessing criteria is that the determined alternative should possess the shortest distance from an ideal solution and the largest distance from a negative ideal solution [34].
We assume the MCDM task has p alternatives ( B 1 , , B P ), and that q assesses measures ( G 1 , , G q ). Each alternative is evaluated with respect to q assessing those measures. Depending on the decision matrix ( X = ( x i j ) p × q ) , each alternative can realize the values with respect to each assessing criterion. The relative weight of each criterion is represented as W = ( w 1 , , w q ) , and the aggregation of each weight equals 1. A brief illustration of TOPSIS is expressed as follows [75,76,84].
Step 1: Normalize the decision matrix.
The decision matrix ( X = ( x i j ) p × q ) can be normalized by Equation (A1).
e i j = x i j / k = 1 p x k j 2 , i = 1 , , p ; j = 1 , , q ,
where e i j denotes the normalized value.
Step 2: Compute the weighted normalized decision matrix.
Equation (A2) expresses the weighted normalized decision matrix.
h i j = w j · e i j , i = 1 , , p ; j = 1 , , q ,
where the relative weight of the j th criterion is expressed as w j , and all the weights are aggregated to 1 ( j = 1 q w j = 1 ).
Step 3: Determine the positive ideal ( B * ) and negative ideal solution ( B ).
B * = { h 1 * , , h q * } = { ( max h i j | j Θ a j ) , ( min h i j | j Θ g j ) } B = { h 1 , , h q } = { ( max h i j | j Θ a j ) , ( min h i j | j Θ g j ) }
Step 4: Compute the Euclidean distance for each alternative grounded on the positive ideal solution and negative ideal solution.
K i * = j = 1 q ( h i j h j * ) , i = 1 , , p K i = j = 1 q ( h i j h j ) , i = 1 , , p
Step 5: Calculate the relative distance of each alternative to the ideal solution.
The relative closeness of alternative B i with respect to B * is determined by Equation (A5).
R C i = D i / ( D i * + D i ) , i = 1 , , p .
Step 6: Determine the best alternative.
We identify the best alternative based on the relative closeness to the ideal solution. The bigger R C i is, the better is alternative B i .

References

  1. Aguilera, R.; Jackson, G. The cross-national diversity of corporate governance: Dimensions and determinants. Acad. Manag. Rev. 2003, 28, 447–465. [Google Scholar] [CrossRef]
  2. Diamond, M.R. Corporations, a Contemporary Approach; Carolina Academic Press: Durham, NC, USA, 2015. [Google Scholar]
  3. Rekker, S.A.; Benson, K.L.; Faff, R.W. Corporate social responsibility and CEO compensation revisited: Do disaggregation, market stress, gender matter? J. Econ. Bus. 2014, 72, 84–103. [Google Scholar] [CrossRef]
  4. Ye, Q.; Li, Z. Do independent directors play a political role? Evidence from independent directors death events? China J. Account. Res. 2017, 10, 295–316. [Google Scholar] [CrossRef]
  5. La Porta, R.; Lopez-de-Silanes, F.; Shleifer, A.; Vishny, R. Investor protection and corporate valuation. J. Financ. 2002, 57, 1147–1170. [Google Scholar] [CrossRef]
  6. Wood, D.J. Corporate social performance revisited. Acad. Manag. Rev. 1991, 16, 691–718. [Google Scholar] [CrossRef]
  7. Zafar, F.; Akram, M. A novel decision-making method based on rough fuzzy information. Int. J. Fuzzy Syst. 2018, 20, 1000–1014. [Google Scholar] [CrossRef]
  8. Gill, A. Corporate governance as social responsibility: A research agenda. Berkeley J. Int. Law 2008, 26, 452. [Google Scholar]
  9. Bhaduri, S.N.; Selarka, E. Corporate Governance and Corporate Social Responsibility of Indian Companies; Springer: Singapore, 2016. [Google Scholar]
  10. McWilliams, A.; Siegel, D. Corporate social responsibility and financial performance: Correlation or misspecification? Strateg. Manag. J. 2000, 21, 603–609. [Google Scholar] [CrossRef]
  11. Jo, H.; Harjoto, M.A. The causal effect of corporate governance on corporate social responsibility. J. Bus. Ethics 2012, 106, 53–72. [Google Scholar] [CrossRef]
  12. Zahra, S.A. Public and corporate governance and young global entrepreneurial firms. Corp. Gov. 2014, 22, 77–83. [Google Scholar] [CrossRef]
  13. Sheldon, O. The Philosophy of Management; Sir Isaac Pitman & Sons: Bath, UK, 1923. [Google Scholar]
  14. Bowen, H.R. Social Responsibility of the Businessman; Harper and Row: New York, NY, USA, 1953. [Google Scholar]
  15. Carroll, A.B. A three-dimensional conceptual model of corporate performance. Acad. Manag. Rev. 1979, 4, 497–505. [Google Scholar] [CrossRef]
  16. Maignan, I.; Ralston, D. Corporate social responsibility in Europe and the U.S.: Insights from businesses’ self-presentations. J. Int. Bus. Stud. 2002, 33, 497–514. [Google Scholar] [CrossRef]
  17. Forker, J.J. Corporate governance and disclosure quality. Account. Bus. Res. 1992, 22, 111–124. [Google Scholar] [CrossRef]
  18. Jamali, D.; Safieddine, A.; Rabbath, M. Corporate governance and corporate social responsibility: Synergies and interrelationships. Corp. Gov. 2008, 16, 443–459. [Google Scholar] [CrossRef]
  19. Kolk, A.; Pinkse, J. The integration of corporate governance in corporate social responsibility disclosures. Corp. Soc. Responsib. Environ. Manag. 2010, 17, 15–26. [Google Scholar] [CrossRef]
  20. Arora, P.; Dharwadkar, R. Corporate governance and corporate social responsibility (CSR): The moderating roles of attainment discrepancy and organization slack. Corp. Gov. 2011, 19, 136–152. [Google Scholar] [CrossRef]
  21. Ferrell, A.; Liang, H.; Renneboog, L. Socially responsible firms. J. Financ. Econ. 2016, 122, 585–606. [Google Scholar] [CrossRef]
  22. Ferrell, O.C.; Fraedrich, J. Business Ethics: Ethical Decision Making and Cases; Houghton Mifflin: Boston, MA, USA, 2015. [Google Scholar]
  23. Bhimani, A.; Soonawalla, K. From conformance to performance: The corporate responsibilities continuum. J. Account. Public Policy 2005, 24, 165–174. [Google Scholar] [CrossRef]
  24. Ackers, B. Corporate social responsibility reporting: What boards of directors need to know. Corp. Board Role Duties Compos. 2014, 10, 38–59. [Google Scholar] [CrossRef]
  25. Mahoney, L.S.; Thorn, L. An examination of the structure of executive compensation and corporate social responsibility: A Canadian investigation. J. Bus. Ethics 2006, 69, 149–162. [Google Scholar] [CrossRef]
  26. Sharif, M.; Rashid, K. Corporate governance and corporate social responsibility (CSR) reporting: An empirical evidence from commercial banks (CB) of Pakistan. Qual. Quant. 2014, 48, 2501–2521. [Google Scholar] [CrossRef]
  27. Pawlak, Z. Rough sets. Int. J. Parallel Program. 1982, 11, 341–356. [Google Scholar] [CrossRef]
  28. Pawlak, Z. Rough classification. Int. J. Man-Mach. Stud. 1984, 20, 469–483. [Google Scholar] [CrossRef]
  29. Block, J.; Wagner, M. Ownership versus management effects on corporate social responsibility concerns in large family and founder firms. J. Fam. Bus. Strategy 2014, 5, 339–346. [Google Scholar] [CrossRef]
  30. Brammer, S.; Pavelin, S. Building a good reputation. Eur. Manag. J. 2004, 22, 704–713. [Google Scholar] [CrossRef]
  31. Hung, H. Directors’ roles in corporate social responsibility: A stakeholder perspective. J. Bus. Ethics 2011, 103, 385–402. [Google Scholar] [CrossRef]
  32. Maclagan, P.W. Management and Morality; Sage Publications: London, UK, 1998. [Google Scholar]
  33. Prado-Lorenzo, J.M.; Gallego-Alvarez, I.; Garcia-Sanchez, I.M. Stakeholder engagement and corporate social responsibility reporting: The ownership structure effect. Corp. Soc. Responsib. Environ. Manag. 2009, 16, 94–107. [Google Scholar] [CrossRef]
  34. Ghoul, S.E.; Guedhami, O.; Wang, H.; Kwok, C.C.Y. Family control and corporate social responsibility. J. Bank. Financ. 2016, 73, 131–146. [Google Scholar] [CrossRef]
  35. Cho, E.; Chun, S.; Choi, D. International diversification, corporate social responsibility, and corporate governance: Evidence from Korea. J. Appl. Bus. Res. 2015, 31, 743–764. [Google Scholar] [CrossRef]
  36. Gul, F.A.; Leung, S. Board leadership, outside directors’ expertise and voluntary corporate disclosure. J. Account. Public Policy 2004, 23, 351–379. [Google Scholar] [CrossRef]
  37. Muttakin, M.B.; Subramaniam, N. Firm ownership and board characteristics: Do they matter for corporate social responsibility disclosure of Indian companies? Sustain. Account. Manag. Policy J. 2015, 6, 138–165. [Google Scholar] [CrossRef]
  38. Paek, S.; Xiao, Q.; Lee, S.; Song, H. Does managerial ownership affect different corporate social responsibility dimensions? An empirical examination of US publicly traded hospitality firms. Int. J. Hosp. Manag. 2013, 34, 423–433. [Google Scholar] [CrossRef]
  39. Hu, Y.; Zhu, Y.; Hu, Y. Does ownership type matter for corporate social responsibility disclosure: Evidence from China? In Global Conference on Business and Finance Proceedings; The Institute for Business and Finance Research: Hilo, HI, USA, 2016; pp. 183–197. [Google Scholar]
  40. Walls, L.J.; Berrone, P.; Phan, P.H. Corporate governance and environmental performance: Is there really a link? Strateg. Manag. J. 2012, 33, 885–913. [Google Scholar] [CrossRef]
  41. Esa, E.; Zahari, A.R. Corporate social responsibility: Ownership structures, board characteristics & the mediating role of board compensation. Procedia Econ. Financ. 2016, 35, 35–43. [Google Scholar]
  42. Coombs, J.E.; Gilley, K.M. Stakeholder management as a predictor of CEO compensation: Main effects and interactions with financial performance. Strateg. Manag. J. 2005, 26, 827–840. [Google Scholar] [CrossRef]
  43. Darus, F.; Mad, S.; Yusoff, H. The importance of ownership monitoring and firm resources on corporate social responsibility (CSR) of financial institutions. Procedia Soc. Behav. Sci. 2014, 145, 173–180. [Google Scholar] [CrossRef]
  44. Jian, M.; Lee, K.W. CEO Compensation and corporate social responsibility. J. Multinatl. Financ. Manag. 2015, 29, 46–65. [Google Scholar] [CrossRef]
  45. Huang, Q.H.; Huagang, P.; Ghongwu, Z. Blue Book of Corporate Social Responsibility: Research Report on Corporate Social Responsibility of China (2015); Social Sciences Academic Press (China): Beijing, China, 2015; Available online: https://www.pishu.com.cn/skwx_ps/bookdetail?SiteID=14&ID=9131325 (accessed on 10 May 2018).
  46. Liu, X.; Zhang, C. Corporate governance, social responsibility information disclosure, and enterprise value in China. J. Clean. Prod. 2017, 142, 1075–1084. [Google Scholar] [CrossRef]
  47. Chen, W.; Li, S.; Crystal Chen, X. How much control causes tunneling? Evidence from China. China J. Account. Res. 2017, 10, 231–245. [Google Scholar] [CrossRef]
  48. Chiou, J.R.; Hsiung, T.C.; Kao, L.A. A study on the relationship between financial distress and collateralized shares. Taiwan Account. Rev. 2002, 3, 79–111. [Google Scholar]
  49. Jiraporn, P.; Chintrakarn, P. Corporate social responsibility (CSR) and CEO luck: Are lucky CEOs socially responsible? Appl. Econ. Lett. 2013, 20, 1036–1039. [Google Scholar] [CrossRef]
  50. Jo, H.; Songa, M.H.; Tsang, A. Corporate social responsibility and stakeholder governance around the world. Glob. Financ. J. 2016, 29, 42–69. [Google Scholar] [CrossRef]
  51. Graafland, J.; Smid, H. Does corporate social responsibility really make a difference? An explorative analysis for Chinese companies. China World Econ. 2014, 22, 102–124. [Google Scholar] [CrossRef]
  52. Kim, Y.S.; Kim, Y.; Kim, H.D. Corporate social responsibility and internal control effectiveness. Asia-Pac. J. Financ. Stud. 2017, 46, 341–372. [Google Scholar] [CrossRef]
  53. Cheng, C.H.; Chen, T.L.; Wei, L.Y. A hybrid model based on rough sets theory and genetic algorithms for stock price forecasting. Inf. Sci. 2010, 180, 1610–1629. [Google Scholar] [CrossRef]
  54. Jia, X.; Shang, L.; Zhou, B.; Yao, Y. Generalized attribute reduction rough set theory. Knowl.-Based Syst. 2016, 9, 1204–1218. [Google Scholar]
  55. Li, R.; Wang, Z.O. Mining classification rules using rough sets and neural networks. Eur. J. Oper. Res. 2004, 157, 439–448. [Google Scholar] [CrossRef]
  56. Shyng, J.Y.; Shieh, H.M.; Tzeng, G.H. Compactness rate as a rule selection index based on Rough Set Theory to improve data analysis for personal investment portfolios. Appl. Soft Comput. 2011, 11, 3671–3679. [Google Scholar] [CrossRef]
  57. Pawlak, Z.; Slowinski, R. Rough set approach to multiattribute decision analysis. Eur. J. Oper. Res. 1994, 72, 443–459. [Google Scholar] [CrossRef]
  58. Quinlan, J.R. Induction of decision trees. Mach. Learn. 1986, 1, 81–106. [Google Scholar] [CrossRef]
  59. Quinlan, J.R. Simplifying decision trees. Int. J. Man-Mach. Stud. 1987, 27, 221–234. [Google Scholar] [CrossRef]
  60. Quinlan, J.R. C4.5: Programs for Machine Learning; Morgan Kaufmann: Burlington, MA, USA, 1993. [Google Scholar]
  61. Breiman, L.; Friedman, J.; Olshen, R.; Stone, C. Classification and Regression Trees; Chapman & Hall: Belmont, CA, USA, 1984. [Google Scholar]
  62. Kao, L.J.; Chiu, C.C.; Chiu, F.Y. A Bayesian latent variable model with classification and regression tree approach for behavior and credit scoring. Knowl.-Based Syst. 2012, 36, 245–252. [Google Scholar] [CrossRef]
  63. Karabadji, N.E.I.; Seridi, H.; Bousetouane, F.; Dhifli, W.; Aridhi, S. An evolutionary scheme for decision tree construction. Knowl.-Based Syst. 2017, 117, 166–177. [Google Scholar] [CrossRef]
  64. Chang, C.L.; Chen, C.H. Applying decision tree and neural network to increase quality of dermatologic diagnosis. Expert Syst. Appl. 2009, 36, 4035–4041. [Google Scholar] [CrossRef]
  65. Chan, C.C. A rough set approach to attribute generalization in data mining. Inf. Sci. 1998, 107, 169–176. [Google Scholar] [CrossRef]
  66. Chang, T.M.; Hsu, M.F.; Lin, S.J. Integrated news mining technique and AI-based mechanism for corporate performance forecasting. Inf. Sci. 2018, 424, 273–286. [Google Scholar] [CrossRef]
  67. Kao, L.; Chiou, J.; Chen, A. The agency problems, firm performance and monitoring mechanisms: The evidence from collateralised shares in Taiwan. Corp. Gov. 2004, 12, 389–402. [Google Scholar] [CrossRef]
  68. Stanwick, P.A.; Stanwick, S.D. The relationship between corporate social performance, and organizational size, financial performance, and environmental performance: An empirical examination. J. Bus. Ethics 1998, 17, 195–204. [Google Scholar] [CrossRef]
  69. Tang, Z.; Tang, J. Stakeholder–firm power difference, stakeholders’ CSR orientation, and SMEs’ environmental performance in China. J. Bus. Ventur. 2012, 27, 436–455. [Google Scholar] [CrossRef]
  70. Molloy, L.; Erekson, H.; Gorman, R. Exploring the Relationship between Environmental and Financial Performance. Paper Presented at Workshop on Capital Markets and Environmental Performance, Sponsored by: U.S. Environmental Protection Agency, Laguna Beach, CA, USA, 25–27 October 2002. [Google Scholar] [CrossRef]
  71. Rahim, M.M.; Alam, S. Convergence of corporate social responsibility and corporate governance in weak economies: The case of Bangladesh. J. Bus. Ethics 2014, 121, 607–620. [Google Scholar] [CrossRef]
  72. Rokach, L. Ensemble-based classifiers. Artif. Intell. Rev. 2010, 33, 1–39. [Google Scholar] [CrossRef]
  73. Lin, S.J.; Chang, C.; Hsu, M.F. Multiple extreme learning machines for a two-class imbalance corporate life cycle prediction. Knowl.-Based Syst. 2013, 39, 214–223. [Google Scholar] [CrossRef]
  74. Wu, T.C.; Hsu, M.F. Credit risk assessment and decision making by a fusion approach. Knowl.-Based Syst. 2012, 35, 102–110. [Google Scholar] [CrossRef]
  75. Jahanshahloo, G.R.; Hosseinzadeh, L.F.; Izadikhah, M.V. An algorithmic method to extend TOPSIS for decision-making problems with interval data. Appl. Math. Comput. 2006, 175, 1375–1384. [Google Scholar] [CrossRef]
  76. Wang, Y.M.; Elhag, T.M.S. Fuzzy TOPSIS method based on alpha level sets with an application to bridge risk assessment. Expert Syst. Appl. 2006, 31, 309–319. [Google Scholar] [CrossRef]
  77. Hu, K.H.; Chen, F.H.; Tzeng, G.H.; Lee, J.D. Improving Corporate Governance Effects on an Enterprise Crisis Based on a New Hybrid DEMATEL with the MADM Model. J. Test. Eval. 2015, 43, 1395–1412. [Google Scholar] [CrossRef]
  78. Kumar, P.R.; Ravi, V. Bankruptcy prediction in banks and firms via statistical and intelligent techniques—A review. Eur. J. Oper. Res. 2007, 180, 1–28. [Google Scholar] [CrossRef]
  79. Lin, S.J. Integrated artificial intelligence-based resizing strategy and multiple criteria decision making technique to form a management decision in an imbalanced environment. Int. J. Mach. Learn. Cybern. 2017, 8, 1981–1992. [Google Scholar] [CrossRef]
  80. Lin, S.J.; Hsu, M.F. Incorporated risk metrics and hybrid AI techniques for risk management. Neural Comput. Appl. 2017, 28, 3477–3489. [Google Scholar] [CrossRef]
  81. Hu, S.K.; Tzeng, G.H. Strategizing for Better Life Development Using OECD Well-being Indicators in a Hybrid Fuzzy MCDM Model. Int. J. Fuzzy Syst. 2017, 19, 1683–1702. [Google Scholar] [CrossRef]
  82. Westphal, J.D.; Zajac, E.J. A behavioral theory of corporate governance: Explicating the mechanisms of socially situated and socially constituted agency. Acad. Manag. Ann. 2013, 7, 607–661. [Google Scholar] [CrossRef]
  83. Hwang, C.L.; Yoon, K. Multiple Attribute Decision Making: Methods and Applications; Springer: Heidelberg, Germany, 1981. [Google Scholar]
  84. Zhang, X.Y.; Wang, J.Q.; Hu, J.H. On novel operational laws and aggregation operators of picture 2-tuple linguistic information for MCDM problems. Int. J. Fuzzy Syst. 2018, 20, 958–969. [Google Scholar] [CrossRef]
Figure 1. The relationship (conceptual framework) between corporate governance and corporate social responsibility.
Sustainability 10 01582 g001
Figure 2. Research flow chart.
Sustainability 10 01582 g002
Figure 3. The performance rank.
Sustainability 10 01582 g003
Table 1. Definition and source of major independent and control variables.
Variable NameDescription and Calculate MethodSource
Independent variables
Board size (X1)Number of directors Hung [31]; Liu & Zhang [46]
Supervisor size (X2)Number of supervisorsForker [17]
Proportion of independent directors (X3)Number of outside directors/the number of total directorsMuttakin & Subramaniam [37]; Esa & Zahari [41]; Liu & Zhang [46]; Chen et al. [47]
Board pledge rate (X4)Number of collateralized shares by directors and supervisors/shareholders held by directors and supervisorsChiou et al. [48]
CEO duality (X5)A dummy variable that equals one if the CEO served as a board chairman and 0 otherwise.Gul & Leung [36];
Block & Wagner [29];
Muttakin & Subramaniam [37]
Ownership concentration (X6)Number of share held of the top 10 major shareholders/the number of shares outstandingDarus [43]; Cho et al. [35]
Share proportion of senior administrators (X7)Number of shares by senior executives/the number of shares outstandingChen et al. [47]
Share proportion of managers (X8)Number of shares by managers/the number of shares outstandingPaek [38]
State-owned enterprise (X9)1 for State-owned enterprise; 0 for others. Esa & Zahari [41];
Liu & Zhang [46]
Directors’ compensation (X10)Total annual compensation of top three directorsEsa & Zahari [41]
Executives’ compensation (X11)Total annual compensation of top three senior executivesRekker et al. [3]; Jian & Lee [44]; Liu & Zhang [46]
Control variables
Enterprise size (X12)Natural logarithm of total assets Jiraporn & Chintratarn [49];
Darus [43]; Esa & Zahari [41];
Liu & Zhang [46]; Jo et al. [50]
Debt ratio (X13)Total liabilities/total assetsJian & Lee [44]; Esa & Zahari [411]; Jo et al. [50]
R & D intensity (X14)Natural logarithm of (Research and development expenditure/Net sales)McWilliams & Siegel [10];
Block & Wagner [29];
Jian & Lee [44]; Graafland & Smid. [51]; Jo et al. [50]
Return on asset (X15)Net income/total assetsPrado-Lorenzo et al. [33];
Block & Wagner [29]; Jo et al. [50]
PB ratio (X16)Share price/Book value per shareKim et al. [52]
Firm value (Tobin Q) (X17)(Common and preferred stock market value + Long-term liabilities market value + Short-term liabilities market value)/(Equity book value + Liabilities book value)Paek [38]
Revenue growth rate (X18)(Revenue this year/Revenue last year) − 1McWilliams & Siegel [10].
Table 2. Sample description.
VariablesMaximum ValueMinimum ValueAverage ValueStandard Deviation
Y1: Responsibility management100037.4333.56
Y2: Market responsibility100042.8527.85
Y3: Social responsibility96039.2327.41
Y4: Environmental responsibility91032.4327.76
Y5: CSR87038.5027.25
X1: Board size 1559.442.22
X2: Supervisor size 1224.221.66
X3: Proportion of independent directors (%)66.6733.3338.987.99
X4: Board pledge rate (%)92.8807.7916.85
X5: CEO duality (dummies)----
X6: Ownership concentration (%)98.452.8959.0924.58
X7: Share proportion of senior administrators (%)53.5701.606.15
X8: Share proportion of managers (%)83.9903.6511.59
X9: State-owned enterprise (dummies)----
X10: Directors’ compensation27,137,00092,3003,199,2114,209,330
X11: Executives’ compensation34,361,840235,0003,838,0064,815,822
X12: Enterprise size21.614.2317.691.66
X13: Debt ratio (%)90.879.1459.7617.25
X14: R & D intensity (%)13.3501.912.52
X15: Return on asset (%)19.05−13.334.284.49
X16: PB ratio (X16) (%)1750.8420.07168.22173.77
X17: Firm value (Tobin Q)11,119.2970.18769.291093.55
X18: Revenue growth rate (%)4.28−0.410.070.37
Table 3. Ranking of relatively important variables of the models.
Responsibility ManagementMarket ResponsibilitySocial ResponsibilityEnvironmental ResponsibilityCSR
C4.5X12,X4,X6,X9,X1X4,X12,X3X12,X4,X7,X9,X5X12,X14,X4X4,X12,X9,X2
REPTreeX4,X12,X16X12,X4,X6X12,X4,X14X12,X4,X13X12,X14,X6,X4
CARTX12,X14,X6X7X12X12X12,X14,X4X12,X7
Rough Set theoryX4,X12,X13X4,X12,X14,X18X4,X12,X15X4,X13,X14X4,X12,X13
Table 4. The forecasting results of DT-based classifiers (i.e., C4.5, REPTree, and CART) and RST.
ModelDependent Variable/DimensionOverall AccuracyType I ErrorType II Error
C4.5Responsibility management84.3083.4085.20
Market responsibility82.7080.2085.20
Social responsibility84.1083.0085.20
Environmental responsibility83.1082.4083.80
Corporate Social Responsibility (CSR)82.9080.6085.20
REPTreeResponsibility management72.9075.2070.60
Market responsibility73.1075.6070.60
Social responsibility78.5082.6074.40
Environmental responsibility77.5080.6074.40
Corporate Social Responsibility (CSR)72.8075.0070.60
CARTResponsibility management81.6082.8080.40
Market responsibility81.6082.2081.00
Social responsibility82.9083.2082.60
Environmental responsibility83.0083.6082.40
Corporate Social Responsibility (CSR)81.3082.4080.20
RSTResponsibility management84.7084.8084.60
Market responsibility83.9083.2084.60
Social responsibility86.5086.0087.00
Environmental responsibility85.7086.0085.40
Corporate Social Responsibility (CSR)84.2083.8084.60
Table 5. The forecasting results of DT-based classifiers and RST.
ModelDependent Variable/DimensionOverall AccuracyType I ErrorType II Error
C4.5Responsibility management2−12
REPTree−3−3−3
CART−1−1−1
RST202
C4.5Market responsibility0−2−2
REPTree−3−3−3
CART10−1
RST121
C4.5Social responsibility2−1−1
REPTree−3−2−3
CART0−1−1
RST222
C4.5Environmental responsibility−100
REPTree−3−3−3
CART001
RST122
C4.5Corporate Social Responsibility (CSR)102
REPTree−3−3−3
CART11−1
RST211

