Re-Examining Embodied SO2 and CO2 Emissions in China


Abstract
1. Introduction
2. Background
3. Method and Data
3.1. Multi-Regional Input-Output Analysis
3.2. Backward and Forward Linkage Analysis
3.3. Data Sources
4. Results and Discussions
4.1. China’s Total SO2 Emissions and CO2 Emissions
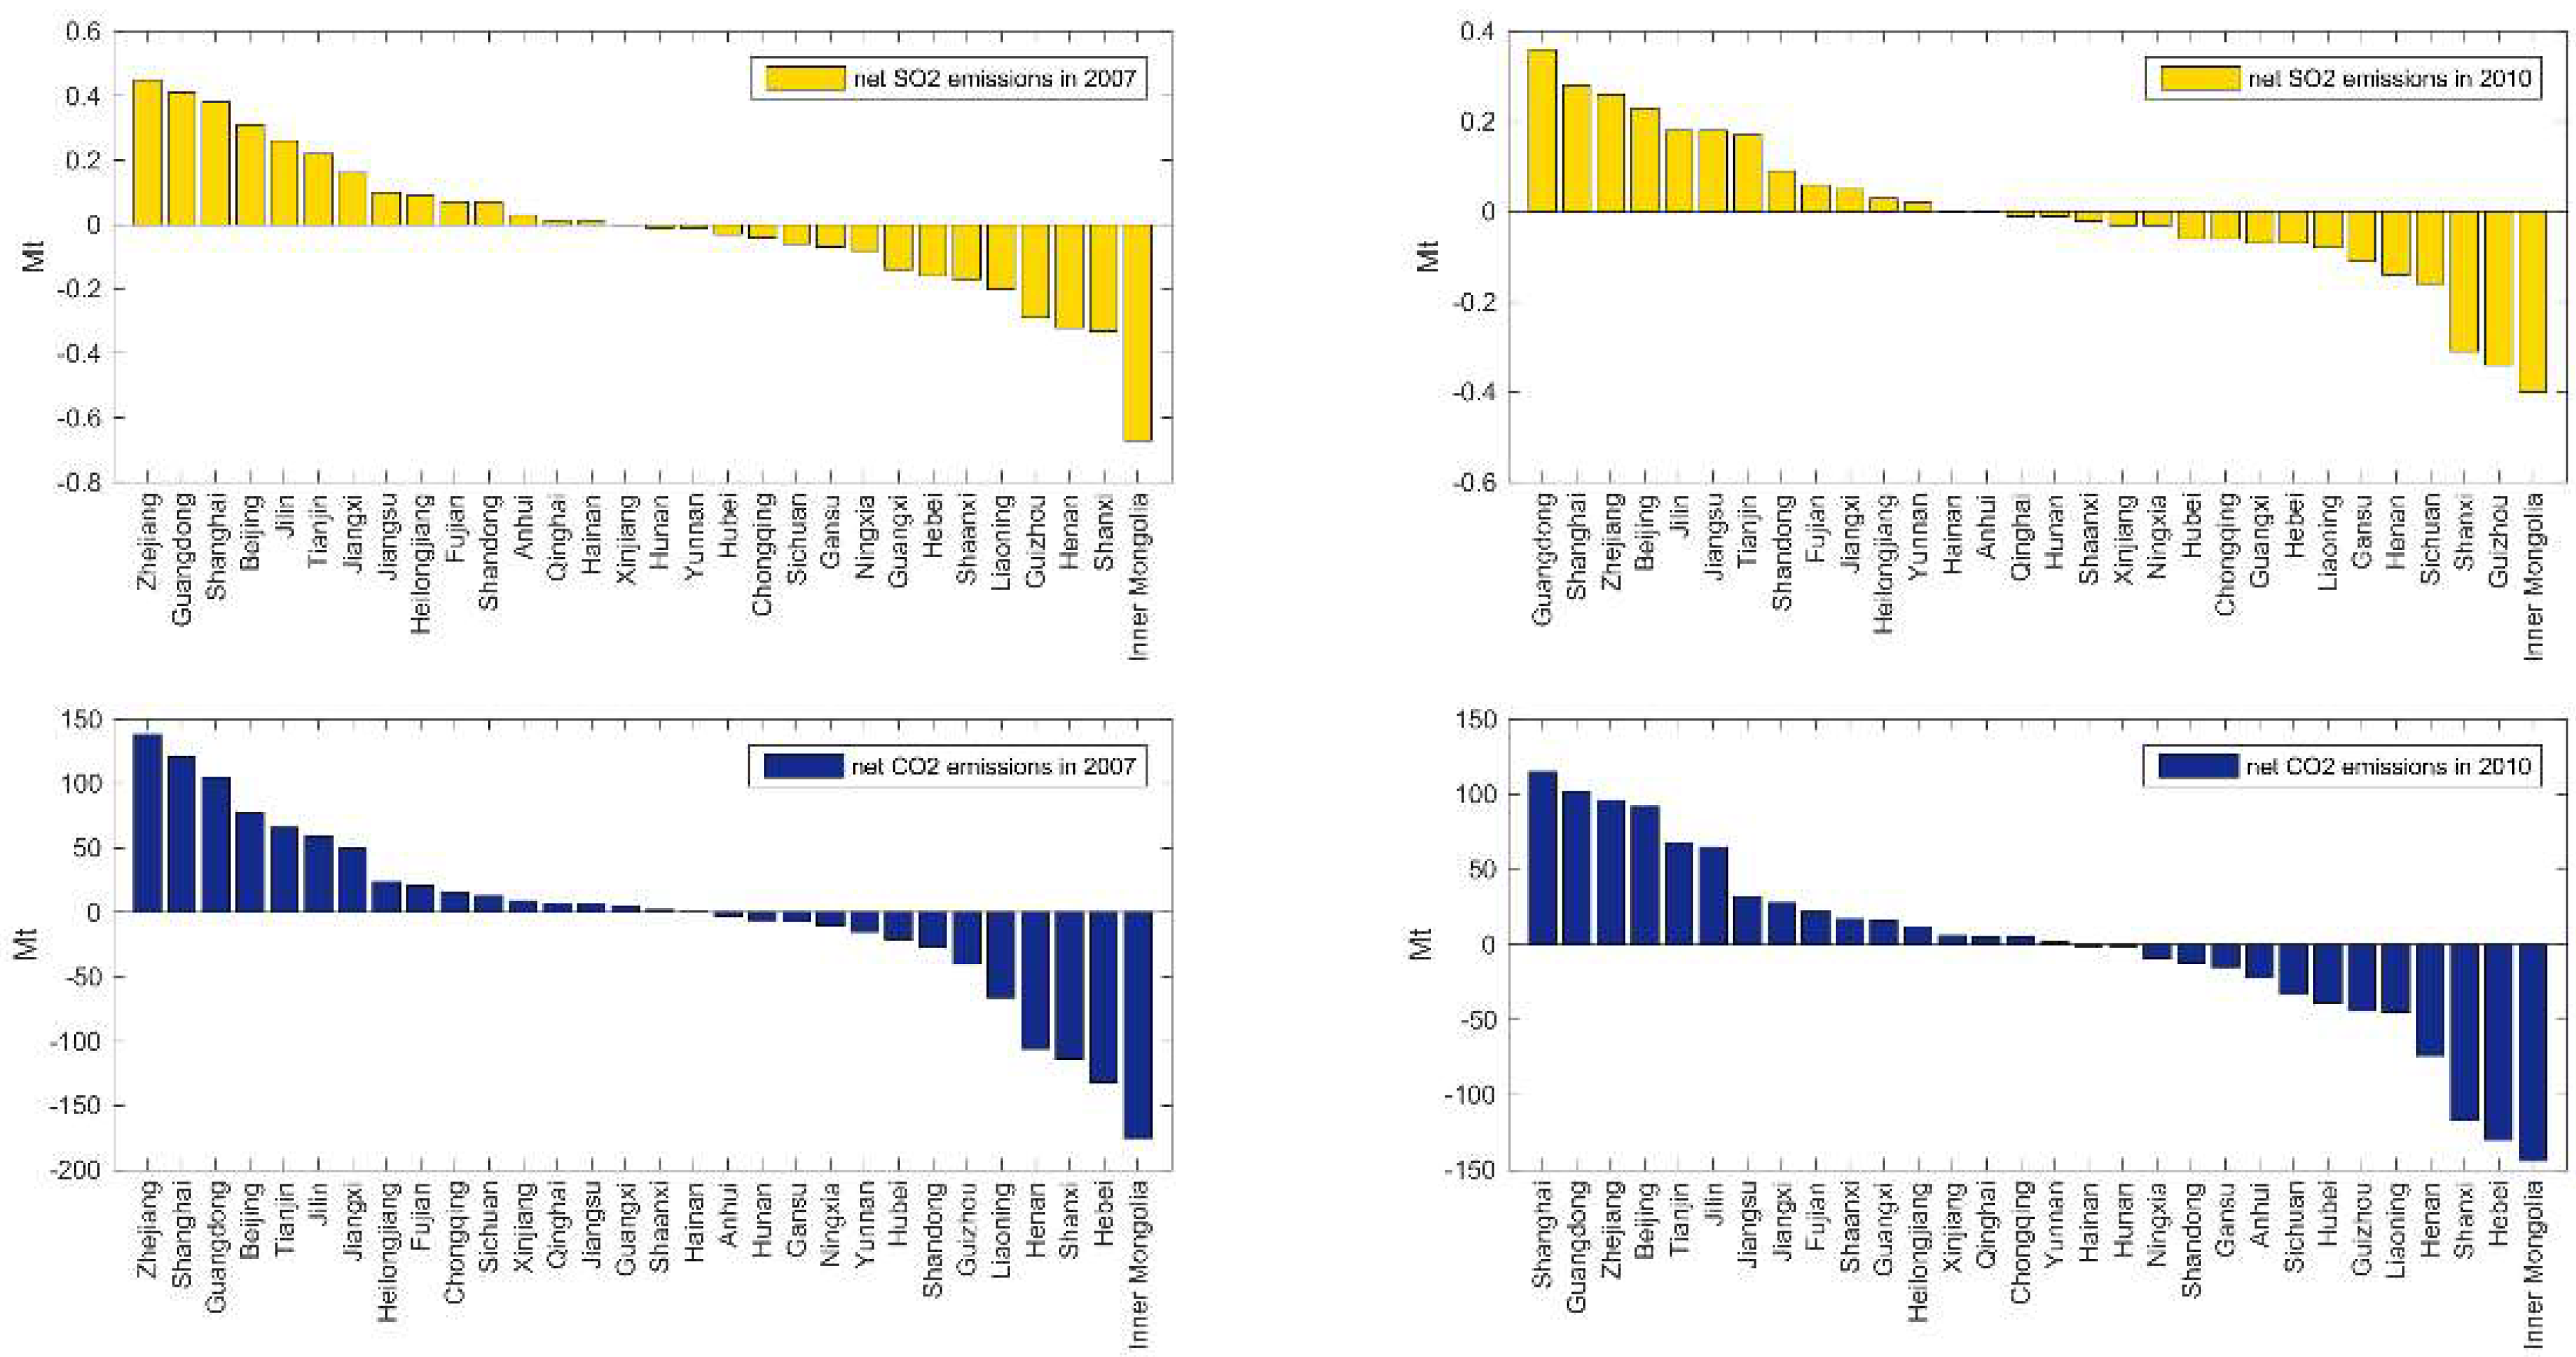
4.2. Net SO2 Emissions and Net CO2 Emissions of Each Province
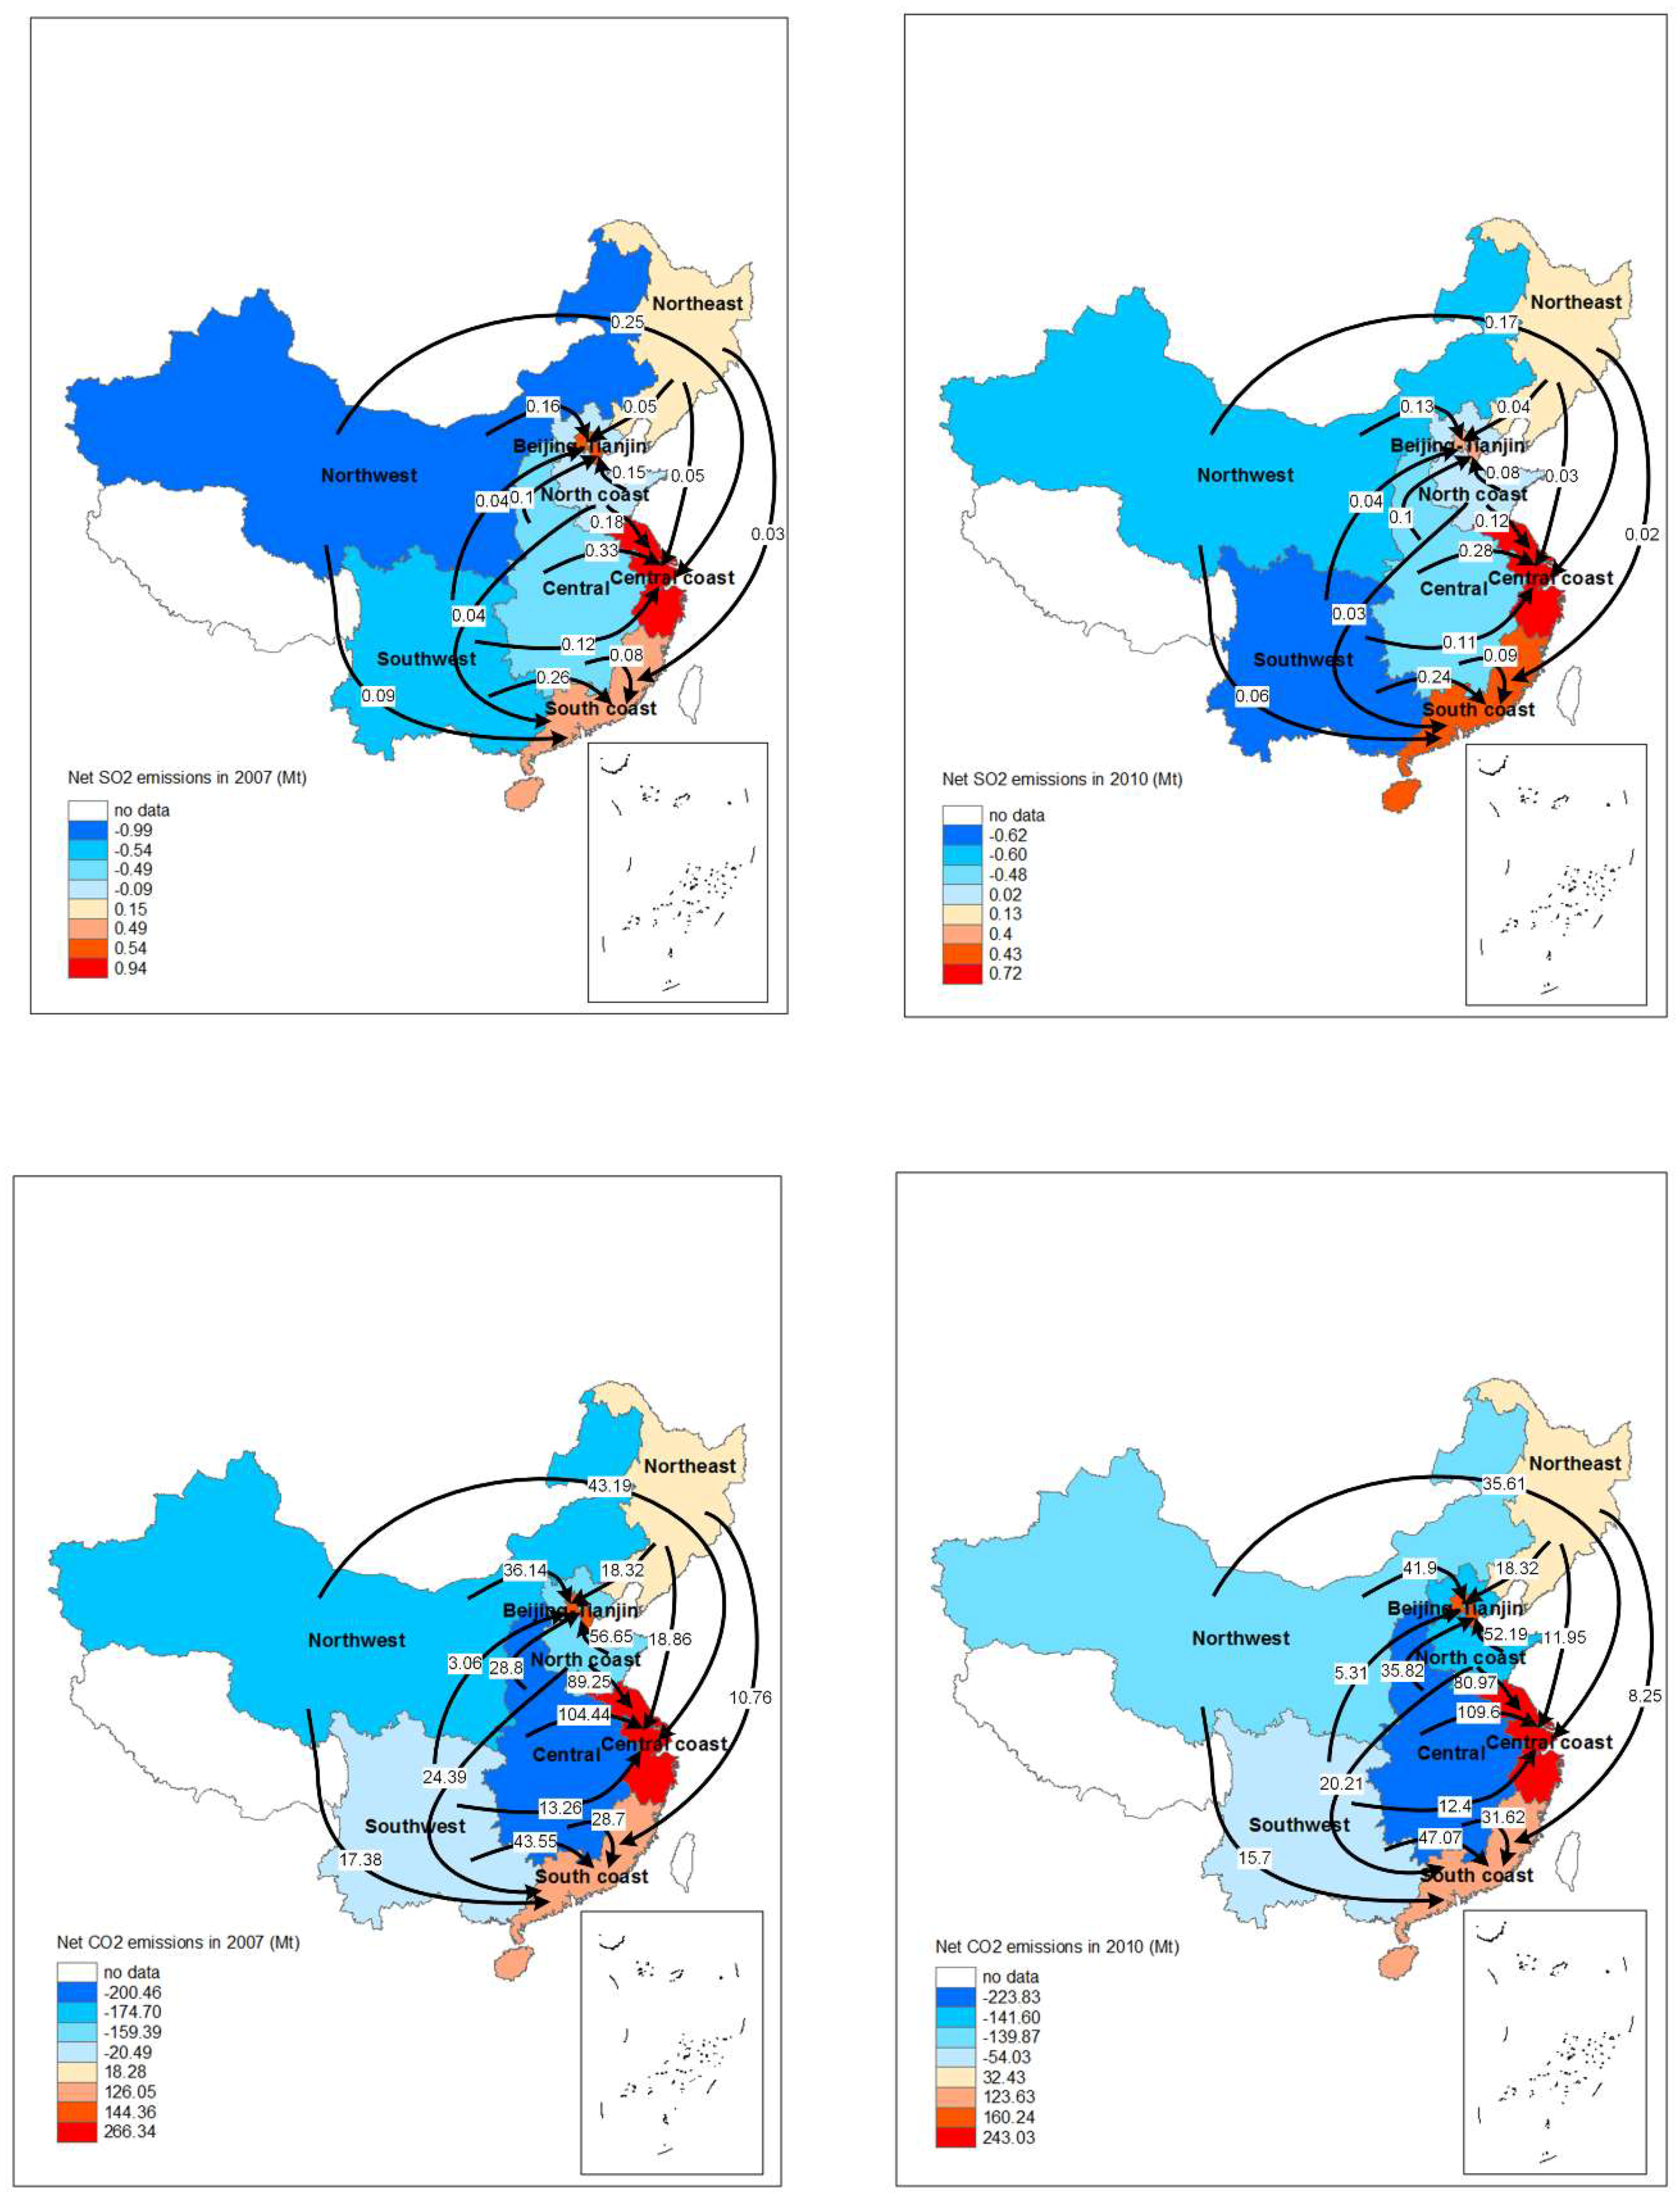
4.3. Interregional SO2 Emissions and CO2 Emissions Flows
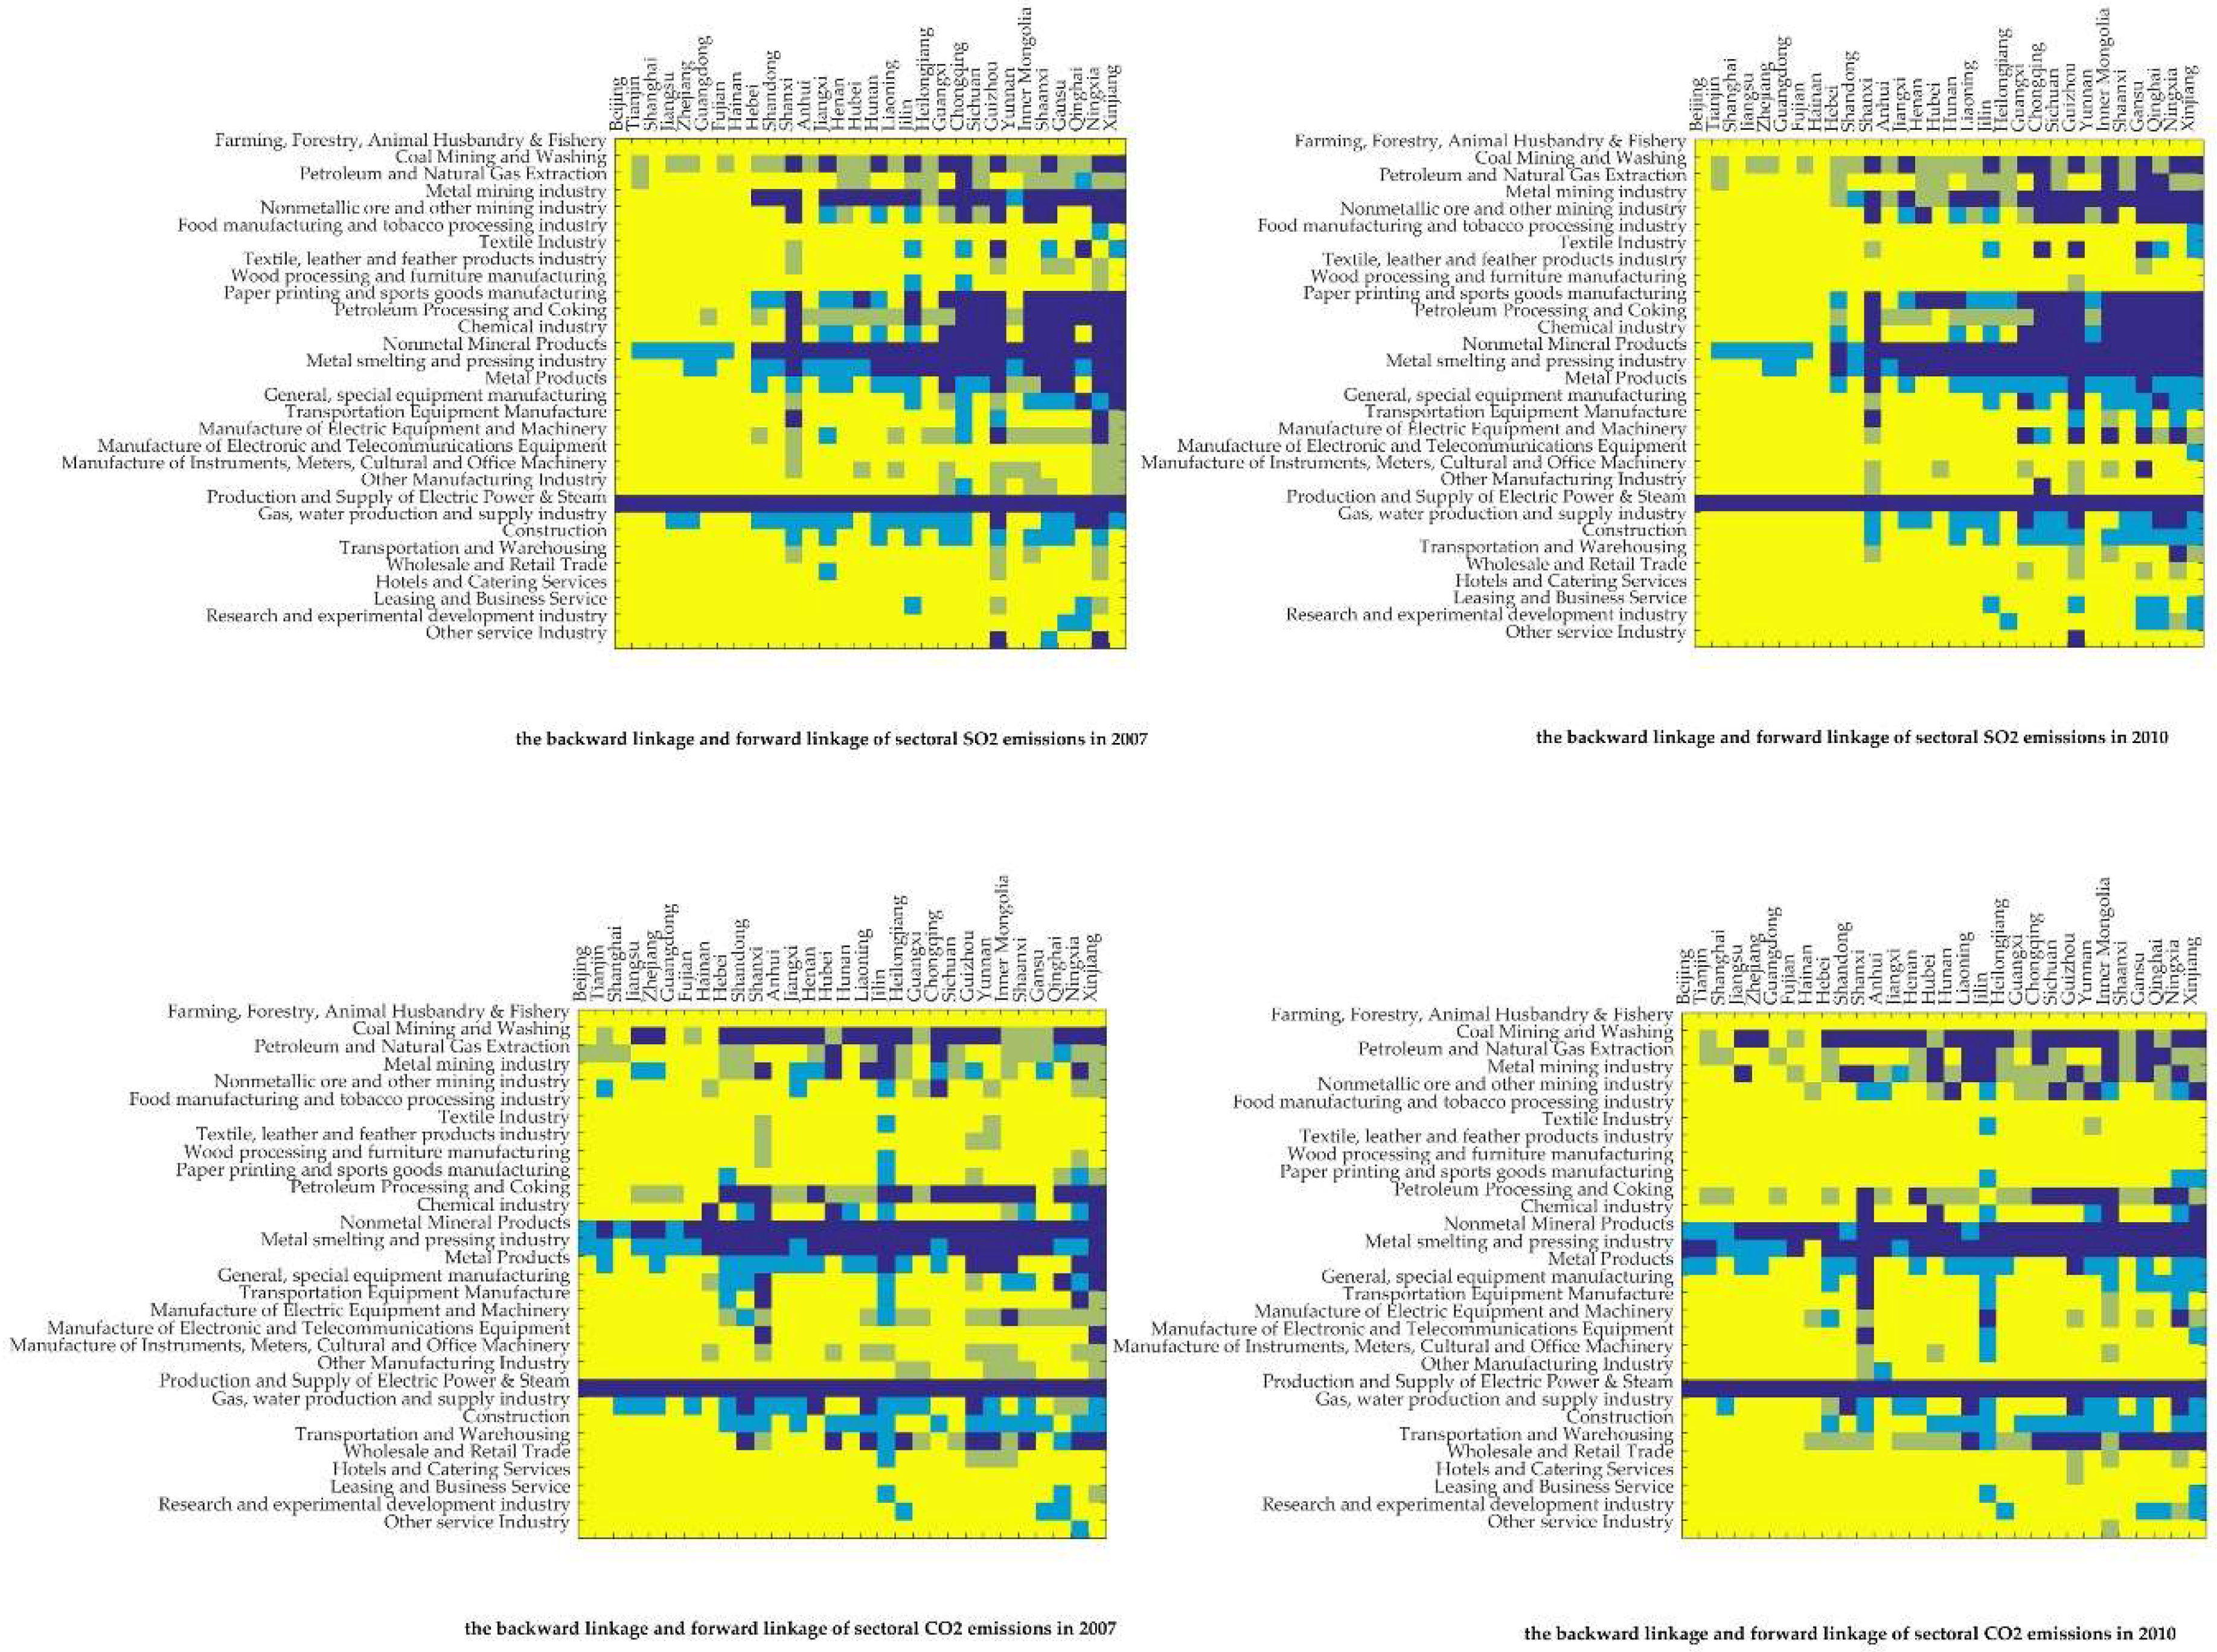
4.4. Backward Linkage and Forward Linkage Analysis
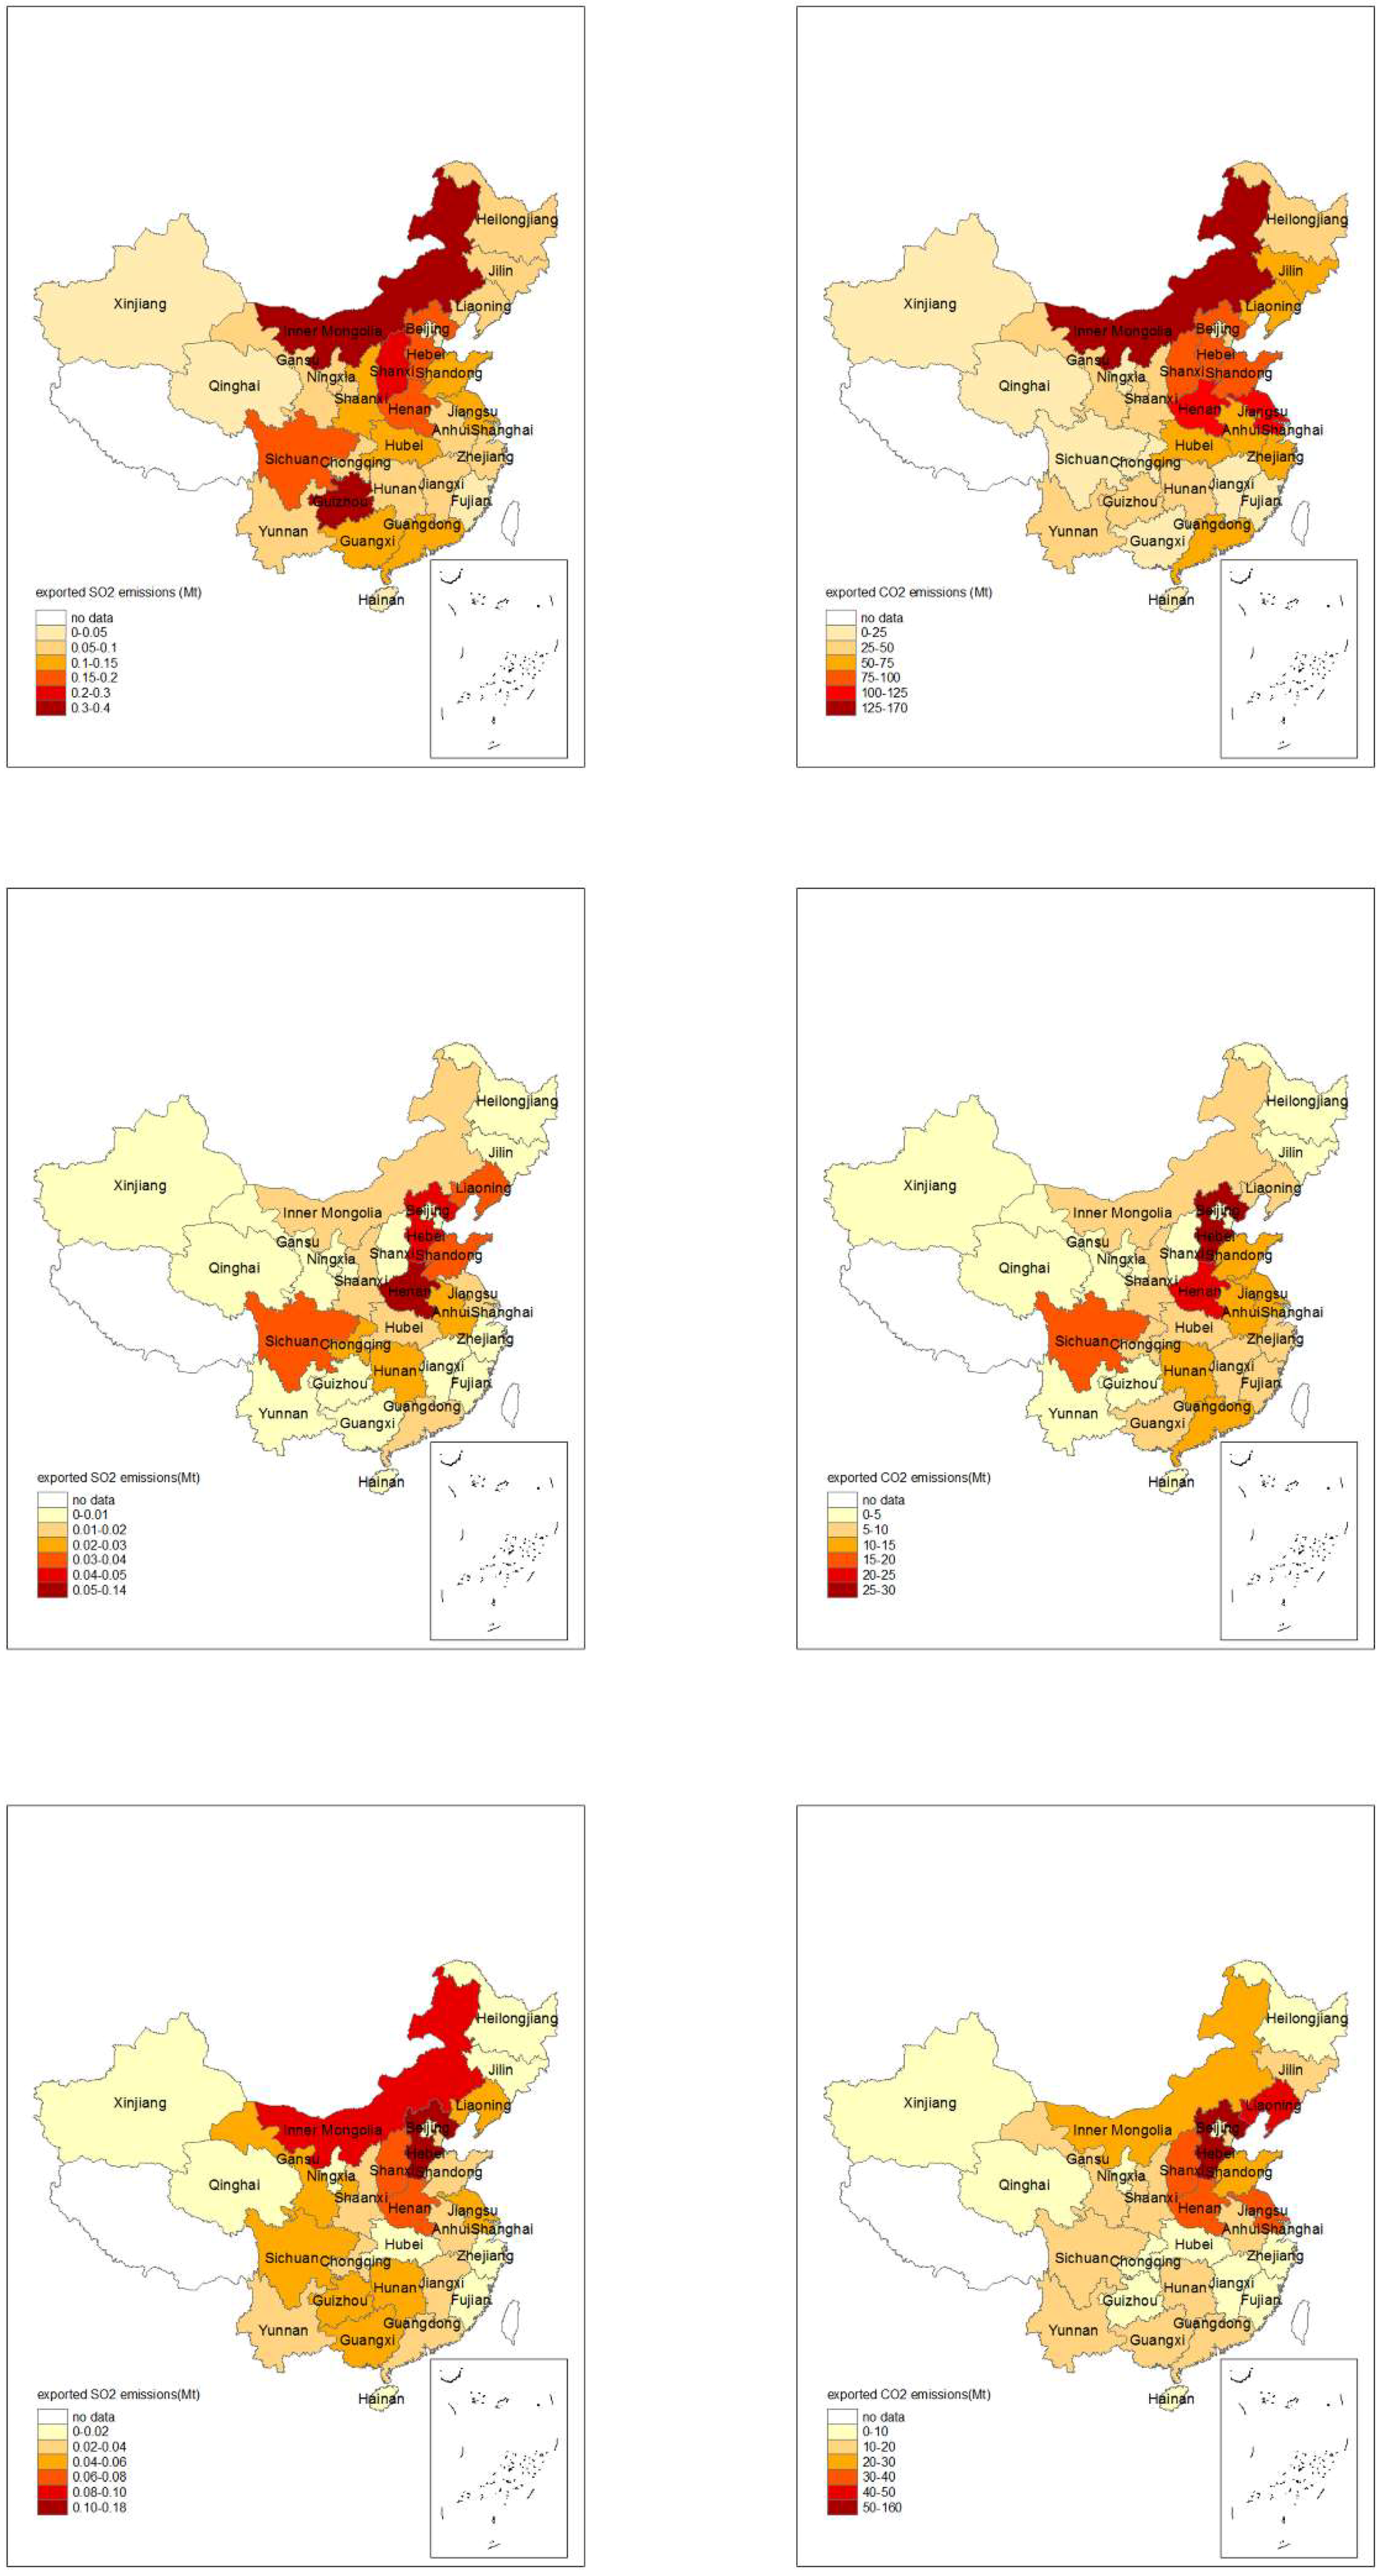
4.5. Export-Related SO2 Emissions and CO2 Emissions of the Top Three Polluting Sectors
5. Conclusions
Author Contributions
Acknowledgments
Conflicts of Interest
Appendix A

| Sectors in IO Tables | Sectors In Energy Balance Tables |
|---|---|
| Metal mining industry | Mining and processing of Ferrous Metal Ores Mining and Processing of Non-Ferrous Metal Ores |
| Non-metallic ore and other mining industry | Mining and Processing of Non-metal Ores Mining of Other Ores |
| Food manufacturing and tobacco-processing industry | Processing of Food from Agricultural Products Manufacture of Foods Manufacture of Beverages Manufacture of Tobacco |
| Textile, leather and feather products industry | Manufacture of Textile Wearing Apparel, Footware, and Caps Manufacture of Leather, Fur, Feather and Related Products |
| Wood processing and furniture manufacturing | Processing of Timber, Manufacture of Wood, Bamboo, Rattan, Palm, and Straw Products Manufacture of Furniture |
| Paper printing and sports goods manufacturing | Manufacture of Paper and Paper Products Printing, Reproduction of Recording Media Manufacture of Articles For Culture, Education and Sport Activity |
| Chemical industry | Manufacture of Raw Chemical Materials and Chemical Products |
| Manufacture of Medicines | |
| Manufacture of Chemical Fibers | |
| Manufacture of Rubber | |
| Manufacture of Plastics | |
| Manufacture of Raw Chemical Materials and Chemical Products | |
| Metal smelting and pressing industry | Smelting and Pressing of Ferrous Metals |
| Smelting and Pressing of Non-ferrous Metals | |
| General, special equipment manufacturing | Manufacture of General Purpose Machinery |
| Manufacture of Special Purpose Machinery | |
| Gas, water production and supply industry | Production and Supply of Gas |
| Production and Supply of Water | |
| Wholesale, and retail trade industry | Wholesale, Retail Trade and Catering Services |
| Lodging and catering industry | |
| Leasing and business services | Others |
| Research and development industry | |
| Other services |
| Provinces | Production-Based SO2 Emissions (Mt) | Consumption-Based SO2 Emissions (Mt) | Production-Based CO2 Emissions (Mt) | Consumption-Based CO2 Emissions (Mt) | ||||
|---|---|---|---|---|---|---|---|---|
| 2007 | 2010 | 2007 | 2010 | 2007 | 2010 | 2007 | 2010 | |
| Beijing | 0.06 | 0.07 | 0.37 | 0.30 | 69.20 | 70.76 | 147.26 | 162.95 |
| Tianjin | 0.18 | 0.14 | 0.39 | 0.31 | 86.87 | 105.17 | 153.17 | 173.23 |
| Hebei | 1.09 | 0.80 | 0.93 | 0.73 | 495.48 | 515.07 | 363.06 | 385.55 |
| Shanxi | 0.84 | 0.83 | 0.51 | 0.52 | 273.02 | 333.96 | 159.17 | 217.19 |
| Inner Mongolia | 1.06 | 0.93 | 0.38 | 0.53 | 294.99 | 390.44 | 120.15 | 246.21 |
| Liaoning | 0.89 | 0.66 | 0.69 | 0.58 | 319.73 | 354.73 | 254.15 | 309.46 |
| Jilin | 0.37 | 0.24 | 0.63 | 0.42 | 196.61 | 169.71 | 256.03 | 235.16 |
| Heilongjiang | 0.41 | 0.34 | 0.50 | 0.36 | 187.86 | 179.31 | 212.30 | 191.55 |
| Shanghai | 0.22 | 0.19 | 0.60 | 0.47 | 105.18 | 128.61 | 226.55 | 243.45 |
| Jiangsu | 0.72 | 0.54 | 0.82 | 0.72 | 323.78 | 390.35 | 330.66 | 422.16 |
| Zhejiang | 0.49 | 0.34 | 0.94 | 0.59 | 225.90 | 235.98 | 363.99 | 332.36 |
| Anhui | 0.40 | 0.35 | 0.43 | 0.35 | 164.04 | 215.24 | 161.19 | 193.71 |
| Fujian | 0.26 | 0.23 | 0.33 | 0.29 | 105.87 | 144.87 | 127.20 | 167.02 |
| Jiangxi | 0.43 | 0.34 | 0.60 | 0.40 | 107.46 | 113.73 | 157.10 | 141.90 |
| Shandong | 1.09 | 0.90 | 1.16 | 0.99 | 495.90 | 559.91 | 468.93 | 547.82 |
| Henan | 1.10 | 0.91 | 0.79 | 0.77 | 347.11 | 418.14 | 240.87 | 344.24 |
| Hubei | 0.46 | 0.41 | 0.43 | 0.35 | 200.05 | 261.03 | 178.61 | 222.14 |
| Hunan | 0.62 | 0.54 | 0.61 | 0.52 | 198.48 | 214.30 | 192.78 | 213.38 |
| Guangdong | 0.72 | 0.56 | 1.13 | 0.92 | 254.70 | 311.53 | 359.35 | 413.51 |
| Guangxi | 0.77 | 0.59 | 0.63 | 0.52 | 112.16 | 142.48 | 117.09 | 158.13 |
| Hainan | 0.02 | 0.02 | 0.02 | 0.02 | 17.15 | 24.28 | 17.21 | 23.77 |
| Chongqing | 0.57 | 0.50 | 0.53 | 0.44 | 87.87 | 122.47 | 104.15 | 127.35 |
| Sichuan | 0.88 | 0.79 | 0.82 | 0.63 | 183.73 | 254.92 | 196.56 | 222.06 |
| Guizhou | 0.68 | 0.75 | 0.39 | 0.41 | 135.03 | 154.29 | 95.48 | 110.14 |
| Yunnan | 0.32 | 0.31 | 0.32 | 0.33 | 126.99 | 151.84 | 112.01 | 154.29 |
| Shaanxi | 0.75 | 0.52 | 0.58 | 0.49 | 139.90 | 176.91 | 141.84 | 194.26 |
| Gansu | 0.34 | 0.37 | 0.27 | 0.26 | 76.27 | 103.16 | 68.97 | 88.44 |
| Qinghai | 0.10 | 0.09 | 0.11 | 0.08 | 25.50 | 24.87 | 32.63 | 29.76 |
| Ningxia | 0.27 | 0.20 | 0.19 | 0.17 | 56.22 | 77.52 | 45.86 | 68.54 |
| Xinjiang | 0.41 | 0.39 | 0.41 | 0.36 | 114.26 | 137.43 | 123.01 | 143.26 |
| Regions | Provinces/Cities Included |
|---|---|
| Beijing–Tianjin | Beijing, Tianjin |
| North coast | Hebei, Shandong |
| Central coast | Shanghai, Jiangsu, Zhejiang |
| South coast | Fujian, Guangdong, Hainan |
| Central | Shanxi, Anhui, Henan, Hubei, Hunan, Jiangxi |
| South-west | Inner Mongolia, Xinjiang, Shaanxi, Gansu, Qinghai, Ningxia |
| North-west | Chongqing, Sichuan, Guizhou, Yunnan, Guangxi |
| North-east | Heilongjiang, Jilin, Liaoning |
| Year | Region | Beijing-Tianjin | North Coast | Central Coast | South Coast | Central | South-West | North-West | North-East |
|---|---|---|---|---|---|---|---|---|---|
| 2007 | Beijing–Tianjin | - | 0.01 | 0.03 | 0.01 | 0.02 | 0.01 | 0.01 | 0.02 |
| North coast | 0.16 | - | 0.26 | 0.06 | 0.15 | 0.08 | 0.11 | 0.14 | |
| Central coast | 0.04 | 0.08 | - | 0.07 | 0.12 | 0.05 | 0.06 | 0.05 | |
| South coast | 0.02 | 0.02 | 0.08 | - | 0.10 | 0.07 | 0.02 | 0.01 | |
| Central | 0.12 | 0.30 | 0.46 | 0.18 | - | 0.15 | 0.17 | 0.11 | |
| Southwest | 0.06 | 0.08 | 0.18 | 0.33 | 0.32 | - | 0.08 | 0.04 | |
| Northwest | 0.18 | 0.24 | 0.32 | 0.12 | 0.21 | 0.14 | - | 0.32 | |
| Northeast | 0.07 | 0.13 | 0.10 | 0.04 | 0.08 | 0.04 | 0.06 | - | |
| 2010 | Beijing-Tianjin | - | 0.01 | 0.02 | 0.01 | 0.02 | 0.01 | 0.01 | 0.01 |
| North coast | 0.10 | - | 0.18 | 0.04 | 0.13 | 0.05 | 0.10 | 0.10 | |
| Central coast | 0.03 | 0.05 | - | 0.05 | 0.10 | 0.04 | 0.06 | 0.04 | |
| South coast | 0.01 | 0.01 | 0.06 | - | 0.08 | 0.05 | 0.02 | 0.01 | |
| Central | 0.11 | 0.27 | 0.39 | 0.17 | - | 0.13 | 0.18 | 0.09 | |
| South-west | 0.05 | 0.08 | 0.16 | 0.29 | 0.30 | - | 0.10 | 0.04 | |
| North-west | 0.14 | 0.19 | 0.23 | 0.09 | 0.18 | 0.09 | - | 0.21 | |
| North-east | 0.05 | 0.09 | 0.07 | 0.03 | 0.06 | 0.03 | 0.05 | - |
| Year | Region | Beijing–Tianjin | North Coast | Central Coast | South Coast | Central | South-West | North-West | North-East |
|---|---|---|---|---|---|---|---|---|---|
| 2007 | Beijing–Tianjin | - | 9.10 | 16.90 | 6.54 | 11.42 | 8.70 | 8.47 | 9.99 |
| North coast | 65.75 | - | 125.17 | 31.11 | 67.85 | 33.07 | 46.96 | 64.32 | |
| Central coast | 18.78 | 35.92 | - | 27.52 | 53.83 | 23.67 | 28.17 | 21.19 | |
| South coast | 6.04 | 6.73 | 26.75 | - | 33.85 | 22.67 | 8.81 | 5.04 | |
| Central | 40.22 | 99.25 | 158.27 | 62.55 | - | 49.09 | 56.53 | 34.08 | |
| South-west | 11.76 | 15.05 | 36.92 | 66.22 | 51.68 | - | 14.48 | 7.43 | |
| North-west | 44.60 | 58.08 | 71.36 | 26.19 | 46.56 | 30.01 | - | 82.66 | |
| North-east | 28.32 | 50.71 | 40.05 | 15.80 | 34.35 | 15.86 | 21.34 | - | |
| 2010 | Beijing–Tianjin | - | 8.68 | 17.26 | 6.79 | 12.59 | 9.45 | 10.64 | 8.60 |
| North coast | 60.87 | - | 118.78 | 28.14 | 83.50 | 31.91 | 60.83 | 66.32 | |
| Central coast | 23.47 | 37.82 | - | 30.94 | 67.41 | 27.85 | 40.75 | 22.70 | |
| South coast | 7.28 | 7.93 | 29.67 | - | 41.99 | 25.16 | 14.28 | 6.08 | |
| Central | 48.41 | 114.46 | 177.00 | 73.61 | - | 56.73 | 80.59 | 38.71 | |
| South-west | 14.77 | 21.08 | 40.25 | 72.23 | 63.40 | - | 27.81 | 10.39 | |
| North-west | 52.53 | 70.67 | 76.35 | 29.98 | 60.49 | 31.41 | - | 81.15 | |
| North-east | 26.93 | 48.13 | 34.65 | 14.33 | 36.30 | 13.38 | 27.82 | - |
| Provinces | Production and Supply of Electric Power and Steam | Nonmetal Mineral Products | Metal Smelting and Pressing Industry | |||
|---|---|---|---|---|---|---|
| SO2 Emissions (Mt) | CO2 Emissions (Mt) | SO2 Emissions (Mt) | CO2 Emissions (Mt) | SO2 Emissions (Mt) | CO2 Emissions (Mt) | |
| Beijing | 0.06 | 30.52 | 0.00 | 3.57 | 0.00 | 5.36 |
| Tianjin | 0.07 | 53.98 | 0.01 | 3.18 | 0.04 | 25.92 |
| Hebei | 0.38 | 190.58 | 0.07 | 39.64 | 0.22 | 208.81 |
| Shanxi | 0.52 | 171.60 | 0.04 | 11.74 | 0.16 | 63.24 |
| Inner Mongolia | 0.59 | 251.44 | 0.06 | 18.09 | 0.16 | 42.87 |
| Liaoning | 0.28 | 156.88 | 0.10 | 23.45 | 0.12 | 92.18 |
| Jilin | 0.12 | 97.16 | 0.02 | 14.19 | 0.03 | 20.43 |
| Heilongjiang | 0.23 | 104.37 | 0.01 | 9.54 | 0.01 | 8.72 |
| Shanghai | 0.12 | 59.87 | 0.01 | 2.50 | 0.02 | 15.38 |
| Jiangsu | 0.26 | 220.35 | 0.06 | 48.36 | 0.11 | 69.55 |
| Zhejiang | 0.19 | 149.57 | 0.03 | 32.18 | 0.03 | 10.68 |
| Anhui | 0.19 | 121.30 | 0.05 | 31.39 | 0.04 | 26.96 |
| Fujian | 0.14 | 80.21 | 0.03 | 19.80 | 0.02 | 16.84 |
| Jiangxi | 0.17 | 49.74 | 0.02 | 20.50 | 0.08 | 21.79 |
| Shandong | 0.34 | 279.49 | 0.15 | 48.81 | 0.12 | 76.30 |
| Henan | 0.36 | 203.37 | 0.25 | 45.79 | 0.13 | 61.82 |
| Hubei | 0.23 | 97.09 | 0.05 | 45.15 | 0.05 | 37.44 |
| Hunan | 0.25 | 81.57 | 0.07 | 38.10 | 0.10 | 32.76 |
| Guangdong | 0.37 | 185.67 | 0.05 | 37.46 | 0.04 | 18.29 |
| Guangxi | 0.36 | 54.50 | 0.04 | 33.74 | 0.12 | 28.52 |
| Hainan | 0.01 | 11.31 | 0.00 | 4.10 | 0.00 | 0.01 |
| Chongqing | 0.26 | 40.18 | 0.08 | 22.76 | 0.08 | 14.57 |
| Sichuan | 0.41 | 64.31 | 0.12 | 58.73 | 0.11 | 42.71 |
| Guizhou | 0.58 | 88.58 | 0.03 | 13.07 | 0.07 | 11.56 |
| Yunnan | 0.19 | 60.76 | 0.01 | 20.19 | 0.06 | 27.47 |
| Shaanxi | 0.32 | 95.47 | 0.03 | 19.03 | 0.05 | 14.34 |
| Gansu | 0.21 | 58.76 | 0.02 | 9.15 | 0.07 | 19.99 |
| Qinghai | 0.06 | 8.77 | 0.00 | 2.82 | 0.02 | 4.62 |
| Ningxia | 0.15 | 51.79 | 0.01 | 5.70 | 0.02 | 6.20 |
| Xinjiang | 0.22 | 70.66 | 0.02 | 8.73 | 0.01 | 14.89 |
References
- Arantegui, R.L.; Jäger-Waldau, A. Photovoltaics and wind status in the European Union after the Paris Agreement. Renew. Sustain. Energy Rev. 2018, 81, 2460–2471. [Google Scholar] [CrossRef]
- Shigetomi, Y.; Nansai, K.; Kagawa, S.; Tohno, S. Fertility-rate recovery and double-income policies require solving the carbon gap under the Paris Agreement. Resour. Conserv. Recycl. 2018, 133, 385–394. [Google Scholar] [CrossRef]
- Rückerl, R.; Schneider, A.; Breitner, S.; Cyrys, J.; Peters, A. Health effects of particulate air pollution: A review of epidemiological evidence. Inhal. Toxicol. 2011, 23, 555–592. [Google Scholar] [CrossRef] [PubMed]
- Breitner, S.; Liu, L.; Cyrys, J.; Brüske, I.; Franck, U.; Schlink, U.; Leitte, A.M.; Herbarth, O.; Wiedensohler, A.; Wehner, B.; et al. Sub-micrometer particulate air pollution and cardiovascular mortality in Beijing, China. Sci. Total Environ. 2011, 409, 5196–5204. [Google Scholar] [CrossRef] [PubMed]
- Guo, Y.; Barnett, A.G.; Pan, X.; Yu, W.; Tong, S. The impact of temperature on mortality in Tianjin, China: A case-crossover design with a distributed lag nonlinear model. Environ. Health Perspect. 2011, 119, 1719–1725. [Google Scholar] [CrossRef] [PubMed]
- Xu, M.; Guo, Y.; Zhang, Y.; Westerdahl, D.; Mo, Y.; Liang, F.; Pan, X. Spatiotemporal analysis of particulate air pollution and ischemic heart disease mortality in Beijing, China. Environ. Health 2014, 13, 1–12. [Google Scholar] [CrossRef] [PubMed]
- Lu, F.; Zhou, L.; Xu, Y.; Zheng, T.; Guo, Y.; Wellenius, G.A.; Bassig, B.A.; Chen, X.; Wang, H.; Zheng, X. Short-term effects of air pollution on daily mortality and years of life lost in Nanjing, China. Sci. Total Environ. 2015, 536, 123–129. [Google Scholar] [CrossRef] [PubMed]
- Yang, J.; Ou, C.Q.; Song, Y.F.; Li, L.; Chen, P.Y.; Liu, Q.Y. Estimating years of life lost from cardiovascular mortality related to air pollution in Guangzhou, China. Sci. Total Environ. 2016, 573, 1566. [Google Scholar] [CrossRef] [PubMed]
- Puppim de Oliveira, J.A.; Doll, C.N.H.; Kurniawan, T.A.; Geng, Y.; Kapshed, M.; Huisingh, D. Promoting win–win situations in climate change mitigation, local environmental quality and development in Asian cities through co-benefits. J. Clean. Prod. 2013, 58, 1–6. [Google Scholar] [CrossRef]
- Hubacek, K.; Feng, K.S. Efficiency targets fall short of achieving a low-carbon future in China. Carbon Manag. 2014, 5, 247–249. [Google Scholar] [CrossRef]
- Deng, H.M.; Liang, Q.M.; Liu, L.J.; Anadon, L.D. Co-benefits of greenhouse gas mitigation: A review and classification by type, mitigation sector, and geography. Environ. Res. Lett. 2017, 12, 123001. [Google Scholar] [CrossRef]
- Bollen, J.; van der Zwaan, B.; Brink, C.; Eerens, H. Local air pollution and global climate change: A combined cost-benefit analysis. Resour. Energy Econ. 2009, 31, 161–181. [Google Scholar] [CrossRef]
- Williams, M.L. UK air quality in 2050-synergies with climate change policies. Environ. Sci. Policy 2007, 10, 169–175. [Google Scholar] [CrossRef]
- Liu, F.; Klimont, Z.; Zhang, Q.; Cofala, J.; Zhao, L.; Huo, H.; Nguyen, B.; Schöpp, W.; Sander, R.; Zheng, B.; et al. Integrating mitigation of air pollutants and greenhouse gases in Chinese cities: Development of GAINS-City model for Beijing. J. Clean. Prod. 2013, 58, 25–33. [Google Scholar] [CrossRef]
- Hasanbeigi, A.; Lobscheid, A.; Lu, H.; Price, L.; Dai, Y. Quantifying the co-benefits of energy-efficiency policies: A case study of the cement industry in Shandong Province, China. Sci. Total Environ. 2013, 458, 624–636. [Google Scholar] [CrossRef] [PubMed]
- Xu, Y.; Masui, T. Local air pollutant emission reduction and ancillary carbon benefits of SO2 control policies: Application of AIM/CGE model to China. Eur. J. Oper. Res. 2009, 198, 315–325. [Google Scholar] [CrossRef]
- Yang, X.; Teng, F.; Wang, G. Incorporating environmental co-benefits into climate policies: A regional study of the cement industry in China. Appl. Energy 2013, 112, 1446–1453. [Google Scholar] [CrossRef]
- Chae, Y.; Park, J. Quantifying costs and benefits of integrated environmental strategies of air quality management and greenhouse gas reduction in the Seoul Metropolitan Area. Energy Policy 2011, 11, 5296–5308. [Google Scholar] [CrossRef]
- Peters, G.P. From production-based to consumption-based national emission inventories. Ecol. Econ. 2008, 65, 13–23. [Google Scholar] [CrossRef]
- Weber, C.L.; Matthews, H.S. Quantifying the global and distributional aspects of American household carbon footprint. Ecol. Econ. 2008, 66, 379–391. [Google Scholar] [CrossRef]
- Wiedmann, T. A review of recent multi-region input–output models used for consumption-based emission and resource accounting. Ecol. Econ. 2009, 69, 211–222. [Google Scholar] [CrossRef]
- Wiedmann, T.; Wilting, H.C.; Lenzen, M.; Lutter, S.; Palm, V. Quo Vadis MRIO? Methodological, data and institutional requirements for multi-region input–output analysis. Ecol. Econ. 2011, 70, 1937–1945. [Google Scholar] [CrossRef]
- Peters, G.P.; Hertwich, E.G. Pollution embodied in trade: The Norwegian case. Glob. Environ. Chang. 2006, 16, 379–387. [Google Scholar] [CrossRef]
- Peters, G.P.; Hertwich, E.G. Post-Kyoto greenhouse gas inventories: Production versus consumption. Clim. Chang. 2008, 86, 51–66. [Google Scholar] [CrossRef]
- Su, B.; Ang, B.W. Input-output analysis of CO2 emissions embodied in trade: A multi-region model for China. Appl. Energy 2014, 114, 377–384. [Google Scholar] [CrossRef]
- Davis, S.J.; Caldeira, K. Consumption-based accounting of CO2 emissions. Proc. Natl. Acad. Sci. USA 2010, 107, 5687–5692. [Google Scholar] [CrossRef] [PubMed]
- Zhang, W.C.; Peng, S.J.; Sun, C.W. CO2 emissions in the global supply chains of services: An analysis based on a multi-regional input-output model. Energy Policy 2015, 86, 93–103. [Google Scholar] [CrossRef]
- Liu, H.; Liu, W.; Fan, X.; Zou, W. Carbon emissions embodied in demand–supply chains in China. Energy Econ. 2015, 50, 294–305. [Google Scholar] [CrossRef]
- Fan, J.L.; Hou, Y.B.; Wang, Q.; Wang, C.; Wei, Y.M. Exploring the characteristics of production-based and consumption-based carbon emissions of major economies: A multiple-dimension comparison. Appl. Energy 2016, 184, 790–799. [Google Scholar] [CrossRef]
- Acquaye, A.; Feng, K.S.; Oppon, E.; Salhi, S.; Ibn-Mohammed, T.; Genovese, A.; Hubacek, K. Measuring the environmental sustainability performance of global supply chains: A multi-regional input-output analysis for carbon, sulphur oxide and water footprints. J. Environ. Manag. 2016, 187, 571–585. [Google Scholar] [CrossRef] [PubMed]
- Liang, S.; Qu, S.; Zhu, Z.; Guan, D.; Xu, M. Income-Based Greenhouse Gas Emissions of Nations. Environ. Sci. Technol. 2017, 51, 346. [Google Scholar] [CrossRef] [PubMed]
- Mongelli, I.; Tassielli, G.; Notarnicola, B. Global warming agreements, international trade and energy/carbon embodiments: An input–output approach to the Italian case. Energy Policy 2006, 34, 88–100. [Google Scholar] [CrossRef]
- Zhang, Y.; Zheng, H.; Yang, Z.; Su, M.; Liu, G.; Li, Y. Multi-regional input–output model and ecological network analysis for regional embodied energy accounting in China. Energy Policy 2015, 86, 651–663. [Google Scholar] [CrossRef]
- Zhang, B.; Qiao, H.; Chen, Z.M.; Chen, B. Growth in embodied energy transfers via China’s domestic trade: Evidence from multi-regional input–output analysis. Appl. Energy 2016, 184, 1093–1105. [Google Scholar] [CrossRef]
- Llop, M. Economic impact of alternative water policy scenarios in the Spanish production system: An input–output analysis. Ecol. Econ. 2006, 68, 288–294. [Google Scholar] [CrossRef]
- Zhang, C.; Anadon, L.D. A multi-regional input–output analysis of domestic virtual water trade and provincial water footprint in China. Ecol. Econ. 2014, 100, 159–172. [Google Scholar] [CrossRef]
- Zhao, H.Y.; Zhang, Q.; Davis, S.J.; Davis, S.J.; Liu, Z.; Huo, H.; Lin, J.T.; Liu, W.D.; He, K.B. Assessment of China’s virtual air pollution transport embodied in trade by a consumption-based emission inventory. Atmos. Chem. Phys. 2015, 15, 6815. [Google Scholar] [CrossRef]
- Xu, M.; Allenby, B.; Chen, W. Energy and Air Emissions Embodied in China−U.S. Trade: Eastbound Assessment Using Adjusted Bilateral Trade Data. Environ. Sci. Technol. 2009, 43, 3378–3384. [Google Scholar] [CrossRef] [PubMed]
- Liu, Q.L.; Wang, Q. Reexamine SO2 emissions embodied in China’s exports using multiregional input-output analysis. Ecol. Econ. 2015, 113, 39–50. [Google Scholar] [CrossRef]
- Zhang, B.; Yang, T.R.; Chen, B.; Sun, X.D. China’s regional CH4, emissions: Characteristics, interregional transfer and mitigation policies. Appl. Energy 2016, 184, 1184–1195. [Google Scholar] [CrossRef]
- Liu, Q.L.; Wang, Q. Sources and flows of China’s virtual SO2 emissions transfers embodied in interprovincial trade: A multiregional input-output analysis. J. Clean. Prod. 2017, 161, 735–747. [Google Scholar] [CrossRef]
- Liu, Z.; Guan, D.B.; Crawford-Brown, D.; Zhang, Q.; He, K.B.; Liu, J.G. A low-carbon road map for China. Nature 2013, 500, 143–145. [Google Scholar] [CrossRef] [PubMed]
- Feng, K.S.; Davis, S.J.; Sun, L.X.; Li, X.; Guan, D.B.; Liu, W.D.; Liu, Z.; Hubacek, K. Outsourcing CO2 within China. Proc. Natl. Acad. Sci. USA 2013, 110, 11654–11659. [Google Scholar] [CrossRef] [PubMed]
- Zhao, H.Y.; Zhang, Q.; Huo, H.; Lin, J.T.; Liu, Z.; Wang, H.K.; Guan, D.B.; He, K.B. Environment-economy tradeoff for Beijing–Tianjin–Hebei’s exports. Appl. Energy 2016, 184, 926–935. [Google Scholar] [CrossRef]
- Wang, Y.; Lai, N.; Mao, G.; Zuo, J.; Crittenden, J.; Jin, Y.; Moreno-Cruz, J. Air pollutant emissions from economic sectors in China: A linkage analysis. Ecol. Indic. 2017, 77, 250–260. [Google Scholar] [CrossRef]
- Zhang, B.; Qiao, H.; Chen, B. Embodied energy uses by China’s four municipalities: A study based on multi-regional input–output model. Ecol. Model. 2014, 318, 138–149. [Google Scholar] [CrossRef]
- Zhang, B.; Chen, Z.M.; Xia, X.H.; Xu, X.Y.; Chen, Y.B. The impact of domestic trade on China’s regional energy uses: A multi-regional input–output modeling. Energy Policy 2013, 63, 1169–1181. [Google Scholar] [CrossRef]
- Mi, Z.F.; Zhang, Y.K.; Guan, D.B.; Shan, Y.L.; Liu, Z.; Cong, R.G.; Yuan, X.C.; Wei, Y.M. Consumption-based emission accounting for Chinese cities. Appl. Energy 2016, 184, 1073–1081. [Google Scholar] [CrossRef]
- Zhang, Y.G. Provincial responsibility for carbon emissions in China under different principles. Energy Policy 2015, 86, 142–153. [Google Scholar] [CrossRef]
- Hewings, G.; Sonis, M.; Guilhoto, J.; Fonseca, M. Key sectors and change in the Brazilian economy: A comparison of alternative approaches their policy implications. J. Policy Model. 1989, 11, 67–90. [Google Scholar] [CrossRef]
- Guo, D.; Hewings, G. Comparative Analysis of China’s Economic Structures between 1987 and 1997: An Input-Output Prospective; Regional Economics Applications Laboratory (Discussion Paper): Urbana, IL, USA, 2001. [Google Scholar]
- Hewings, G.; Sonis, M. New development in input-output analysis: Fields influence of changes, the temporal Leontief inverse and the reconsideration classical key sector analysis. In Tool Kits in Regional Sciences, Theory, Models and Estimations; Springer: Berlin/Heidelberg, Germany, 2009. [Google Scholar]
- Ali, Y. Measuring CO2 emission linkages with the hypothetical extraction method (HEM). Ecol. Indic. 2015, 54, 171–183. [Google Scholar] [CrossRef]
- Ali, Y.; Ciaschini, M.; Cocci, C.; Pretaroli, R.; Severini, F. An analysis of CO2 emissions in Italy through the Macro Multiplier (MM) approach. J. Clean. Prod. 2017, 149, 238–250. [Google Scholar] [CrossRef]
- Yu, Y.; Hubacek, K.; Feng, K.S.; Guan, D.B. Assessing regional and global water footprints for the UK. Ecol. Econ. 2010, 69, 1140–1147. [Google Scholar] [CrossRef]
- Miller, R.; Blair, P. Input-Output Analysis. Foundations and Extensions; Cambridge University Press: Cambridge, UK, 2009. [Google Scholar]
- Zhong, Z.Q.; Huang, R.; Tang, Q.N.; Cong, X.N.; Wang, Z. China’s provincial CO2 emissions embodied in trade with implications for regional climate policy. Front. Earth Sci. 2015, 9, 77–90. [Google Scholar] [CrossRef]
- Wang, F.; Liu, B.; Zhang, B. Embodied environmental damage in interregional trade: A MRIO-based assessment within China. J. Clean. Prod. 2017, 140, 1236–1246. [Google Scholar] [CrossRef]
- Liu, Z.; Guan, D.B.; Wei, W.; Davis, S.J.; Ciais, P.; Bai, J.; Peng, S.S.; Zhang, Q.; Hubacek, K.; Marland, G.; et al. Reduced carbon emission estimates from fossil fuel combustion and cement production in China. Nature 2015, 524, 335–338. [Google Scholar] [CrossRef] [PubMed]
- Guan, D.B.; Liu, Z.; Geng, Y.; Lindner, S.; Hubacek, K. The gigatonne gap in China’s carbon dioxide inventories. Nat. Clim. Chang. 2012, 2, 672–675. [Google Scholar] [CrossRef]
- Sinton, J.E. Accuracy and reliability of china’s energy statistics. China Econ. Rev. 2001, 12, 373–383. [Google Scholar] [CrossRef]
- Akimoto, H.; Ohara, T.; Kurokawa, J.I.; Horii, N. Verification of energy consumption in china during 1996–2003 by using satellite observational data. Atmos. Environ. 2006, 40, 7663–7667. [Google Scholar] [CrossRef]
- Wang, S.; Jia, X.; Chatani, S.; Hao, J.; Klimont, Z.; Cofala, J.; Amann, M. Verification of anthropogenic emissions of china by satellite and ground observations. Atmos. Environ. 2011, 45, 6347–6358. [Google Scholar] [CrossRef]
- Li, C.; Mclinden, C.; Fioletov, V. India is overtaking China as the world’s largest emitter of anthropogenic sulfur dioxide. Sci. Rep. 2017, 7, 14304. [Google Scholar] [CrossRef] [PubMed]
- Chen, Y.; Lee, H.F.; Wang, K.; Pei, Q.; Zou, J. Synergy between virtual local air pollutants and greenhouse gases emissions embodied in China’s international trade. J. Resour. Ecol. 2017, 8, 571–583. [Google Scholar]
- Mi, Z.F.; Meng, J.; Guan, D.B.; Shan, Y.; Song, M.; Wei, Y.M.; Liu, Z.; Hubacek, K. Chinese CO2 emission flows have reversed since the global financial crisis. Nat. Commun. 2017, 8, 1712. [Google Scholar] [CrossRef] [PubMed]
- Zhang, Y.; Qi, S. 2002 and 2007 China Multi-Regional Input-Output Models; China Statistics Press: Beijing, China, 2012. [Google Scholar]
- Shi, W.X.; Lin, C.; Chen, W.; Hong, J.L.; Chang, J.C.; Dong, Y.; Zhang, Y.L. Environmental effect of current desulfurization technology on fly dust emission in China. Renew. Sustain. Energy Rev. 2017, 72, 1–9. [Google Scholar] [CrossRef]
- Rao, N.D.; Riahi, K.; Grubler, A. Climate impacts of poverty eradication. Nat. Cliam. Chang. 2014, 4, 749–751. [Google Scholar] [CrossRef]
- Lamb, W.F.; Rao, N.D. Human development in a climate-constrained world: What the past says about the future. Glob. Environ. Chang. 2015, 33, 14–22. [Google Scholar] [CrossRef]
- Wei, C.; Ni, J.; Du, L. Regional allocation of carbon dioxide abatement in china. China Econ. Rev. 2012, 23, 552–565. [Google Scholar] [CrossRef]


| Citation | Methods | Type of Emissions | Regions | Economic Sectors | Study Period |
|---|---|---|---|---|---|
| Liu et al. [28] | Multi-region input–output (MRIO) analysis | Carbon emissions | 8 regions | 17 sectors | 1997, 2007 |
| Zhang et al. [46] | MRIO | Energy use | 4 municipalities | 30 sectors | 2007 |
| Zhang et al. [47] | MRIO | Energy use | 30 provinces | 30 sectors | 2007 |
| Zhang et al. [34] | MRIO | Energy transfers | 8 regions | 17 sectors | 2002, 2007 |
| Feng et al. [43] | MRIO | CO2 emissions | 30 provinces | 21 sectors | 2007 |
| Mi et al. [48] | Single-region input–output (SRIO) model | CO2 emissions | 13 cities | 47 sectors | 2007 |
| Liu and Wang [39] | MRIO | SO2 emissions | 30 provinces | export | 2002, 2007 |
| Liu and Wang [41] | Emissions embodied in bilateral trade (EEBT) and MRIO | SO2 emissions | 30 provinces | 27 sectors | 2002, 2007 |
| Liu et al. [1] | MRIO | Carbon emissions | 8 regions | 4 sectors | 2002, 2007 |
| Zhang [49] | MRIO | Carbon emissions | 30 provinces | 30 sectors | 2007, 2010 |
| Wang et al. [45] | MRIO | COD,NH3-N,SO2,NOX | 30 provinces/8 regions | 30 sectors | 2007 |
| Zhao et al. [37] | MRIO | PM2.5,SO2,NOX,NMVOC | 30 provinces/8 regions | / | 2015 |
| Su and Ang [25] | Hybrid emissions embodied in trade (HEET) approach | CO2 emissions | 8 regions | / | 1997 |
| Zhang et al. [40] | MRIO | CH4 | 30 provinces | 12 sectors | 2010 |
| Zhang et al. [33] | MRIO | Energy use | 7 regions | / | 2002, 2007 |
© 2018 by the authors. Licensee MDPI, Basel, Switzerland. This article is an open access article distributed under the terms and conditions of the Creative Commons Attribution (CC BY) license (http://creativecommons.org/licenses/by/4.0/).
Share and Cite
Huang, R.; Hubacek, K.; Feng, K.; Li, X.; Zhang, C. Re-Examining Embodied SO2 and CO2 Emissions in China. Sustainability 2018, 10, 1505. https://doi.org/10.3390/su10051505
Huang R, Hubacek K, Feng K, Li X, Zhang C. Re-Examining Embodied SO2 and CO2 Emissions in China. Sustainability. 2018; 10(5):1505. https://doi.org/10.3390/su10051505
Chicago/Turabian StyleHuang, Rui, Klaus Hubacek, Kuishuang Feng, Xiaojie Li, and Chao Zhang. 2018. "Re-Examining Embodied SO2 and CO2 Emissions in China" Sustainability 10, no. 5: 1505. https://doi.org/10.3390/su10051505
APA StyleHuang, R., Hubacek, K., Feng, K., Li, X., & Zhang, C. (2018). Re-Examining Embodied SO2 and CO2 Emissions in China. Sustainability, 10(5), 1505. https://doi.org/10.3390/su10051505