1. Introduction
Eco-labeling schemes are always launched by governments and other organizations to differentiate between enterprises that apply green processes and those that do not. Nowadays, with the public becoming more concerned about the influences of their daily activities on the environment, eco-labeling has become an effective tool for individual customers verifying the environmental friendliness claimed by enterprises [
1,
2].
More eco-friendly consumption patterns could be promoted through eco-labeling. Consumers are informed about the environmental effects of the products, and are encouraged to reduce the environmental damages by changing their purchasing choices [
3]. In addition, products with eco-labels are required to implement higher standards in general. Therefore, eco-labeled products tend to have a higher quality compared with parallel products, which is an important factor motivating customers to pay a premium. This situation is particularly obvious in the food and textile industries [
4,
5].
To cater to customer demand and improve product competitiveness, more and more producers choose to join eco-labeling schemes and invest in more sustainable practices. However, on the other hand, we should notice that the deficiencies regarding supervision and an imperfect regulation system have also created opportunities for the misuse of the eco-label in the market [
6,
7,
8], which have damaged the credibility of eco-labeling schemes to a large extent [
2,
9,
10]. For instance, over half of final United States (US) consumers have expressed a level of distrust about a product’s green degree as conveyed by its eco-label [
11]. Similarly, consumers also doubt the credibility of eco-labels in some developing countries, such as China and Malaysia [
2,
8].
From a theoretical viewpoint, the misuse of eco-label is greenwashing, which is a long-term research question, and a prevalent problem worldwide. However, as far as we know, most of the corresponding research studies in this field focus on issues such as fake or over-advertising problems [
12,
13,
14,
15], the influences of multiple certification systems and diverse standards [
16,
17,
18,
19], and supervision costs [
20,
21,
22]. Few studies have considered how to regulate and supervise the eco-labeled enterprises after certification. An enterprise may have been granted that its product meets the environmental standards, but it may not follow the environmental standards after getting certified.
This pervasive problem does not only exist in developing countries, it is also reported frequently in developed countries [
2,
8,
21]. It is clear that this kind of behavior is harmful to both the environment and eco-labeling schemes [
13,
23]. Not only would customer confidence in the eco-label decrease with the dishonest behaviors of involved enterprises, but incentives for other prospective enterprises to participate would also go down due to the less valuable scheme. From this point of view, measures should be adopted by governments to deal with it.
However, more supervision from the government side alone would be insufficient. For the complexity and dynamics of production, it is hard for the government to implement effective supervision [
3,
24]. Fundamentally speaking, conflicting interests among stakeholders are the primary cause for this unfavorable situation [
9,
18]. From the perspective of policymakers, they hope for more green actions from enterprises. However, without considering spontaneous social responsibility, which is extremely scarce among enterprises [
25,
26], there is little incentive for an enterprise to take costly environmental measures on its own. To eliminate the double marginalization effects between policymakers and enterprises, the strategic interactions between them should be analyzed. Motivated by this, we built a game model to reflect their interaction relationships, and study how to coordinate their behaviors.
Game theory has frequently been employed to study the strategic interactions among stakeholders in similar areas. However, in most studies, there is an important hypothesis on the players: they are considered intelligent and rational, which is inconsistent with the actual situation. On the other hand, the dynamic process of the game is often neglected. In fact, eco-labeled enterprises and policymakers are bounded by rationality and change their strategies dynamically by observing and comparing payoffs with others.
To overcome the disadvantages as mentioned earlier of traditional game theory, evolutionary game theory (EGT) was developed. Inspired by the biological evolutionary process, EGT combines game theory with dynamic evolution process analysis, and focuses more on the dynamics of strategy change as influenced by the strategy frequency in the population [
27,
28]. Replicator dynamics are used to represent the learning and evolution mechanism of individuals in the process [
29]. Using the replicator equation, EGT can guarantee that the players are using the evolutionarily stable strategy in the equilibrium point [
30]. Given this, the evolutionary game model is utilized in this paper to reflect the bounded rationality of players and their dynamic process of strategy choosing.
In addition, we should notice that the existing eco-labeling schemes in different countries are very different, and different certification systems and standards would result in different interaction relationships among stakeholders [
3,
8,
17,
31,
32]. Regarding this point, we focus on Chinese Environmental Labeling (CEL) which is an eco-labeling scheme sponsored by the Chinese government. It is also one of the most influential and authoritative eco-labeling schemes in China. Based on the modeling analyses, some policy suggestions are proposed, which would benefit a better development of eco-labeling scheme as well as government environmental policy-making.
Although our research is mainly motivated by the issues that exist in China, the analyses and proposed policy suggestions are also suitable for many countries, especially some large developing countries. A series of government-sponsored eco-labeling schemes have been established in these countries recently, and similar problems have also been encountered by their governments [
8,
33,
34].
The remainder of this paper is organized as follows:
Section 2 presents a brief presentation of the CEL scheme.
Section 3 introduces its notions, assumptions, and parameters.
Section 4 provides the mathematical model and corresponding analyses of the studied problems. In
Section 5, a numerical analysis is conducted to supplement the analyses in
Section 4 and demonstrate the influences of the game’s parameters.
Section 6 summarizes the paper and proposes several policy suggestions, and
Appendix A,
Appendix B and
Appendix C provide the proofs to the propositions.
2. A Description to CEL
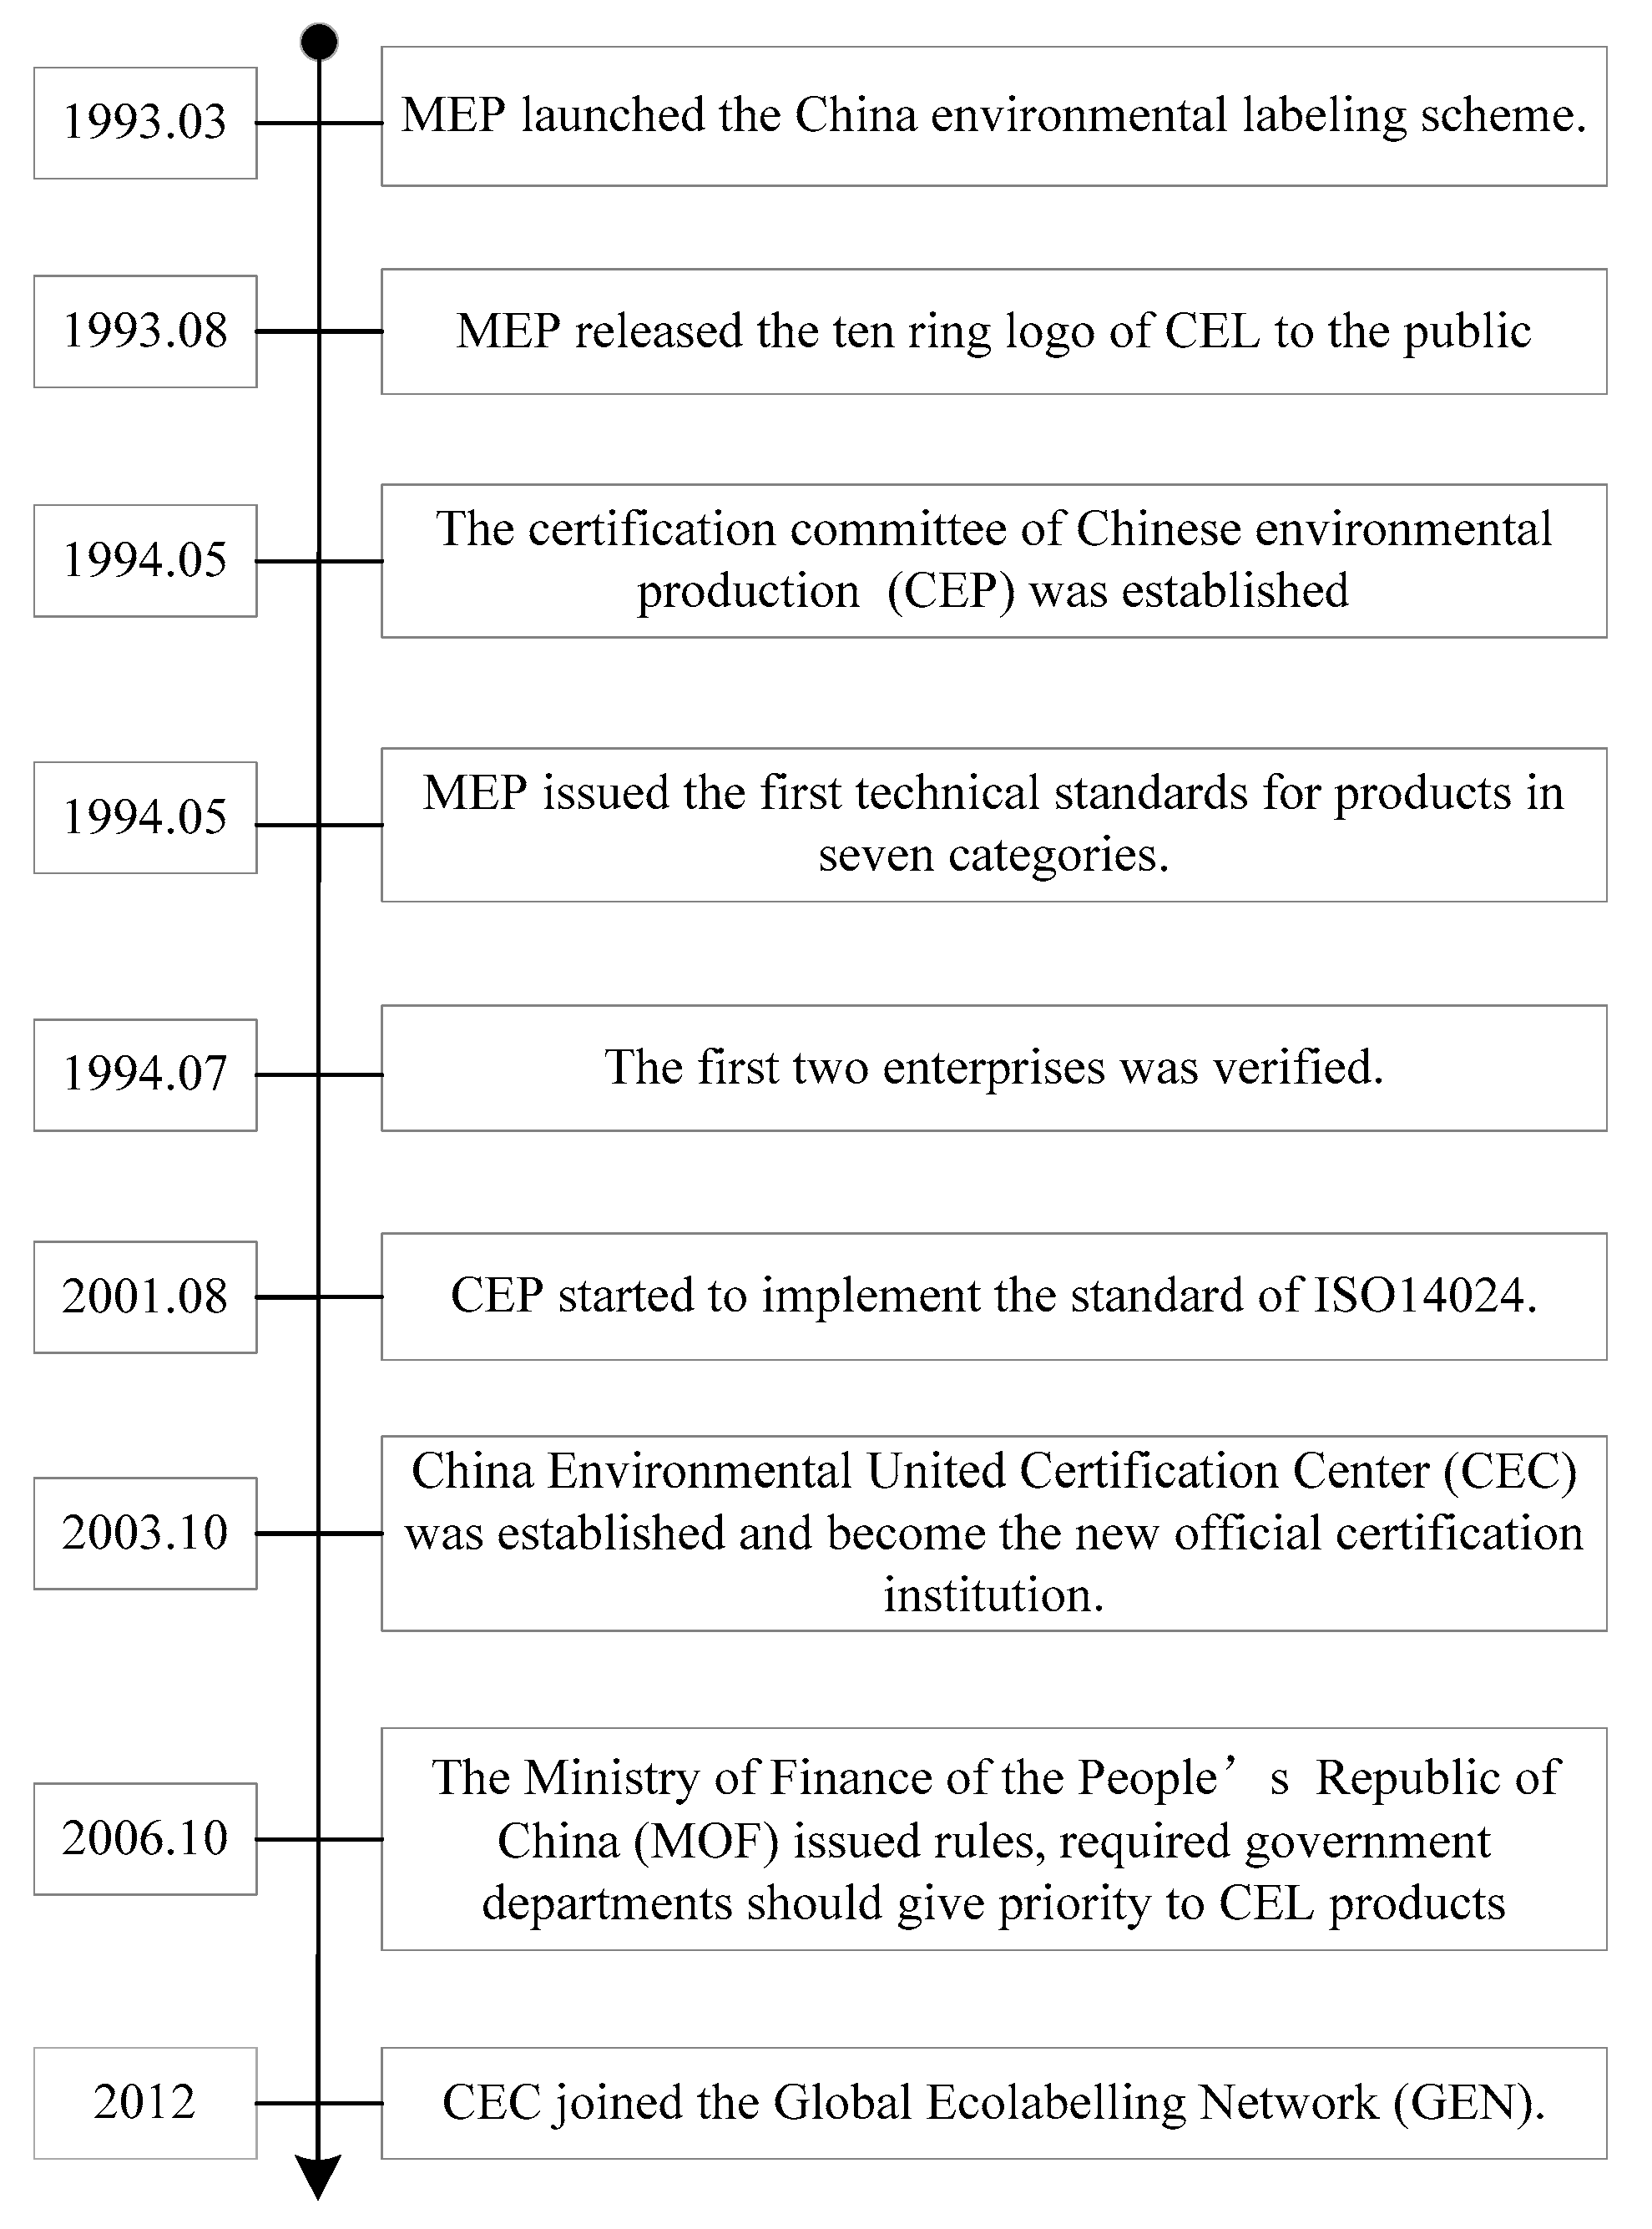
The Chinese Environmental Labeling (CEL) scheme was launched by the Ministry of Environmental Protection of the People’s Republic of China (MEP) in 1993. As shown in
Figure 1, the label consists of the sun, a green hill, and water in the center encircled by 10 rings, which represent the public. The moral of the label is that we should act together to protect our planet.
At present, about 4000 enterprises and 200,000 products have been verified. From August 2001, CEL started to follow the regulations of ISO 14024. Compared with other eco-labeling schemes in China, CEL requires that labeled products are not only qualified but also have fewer environmental impacts than parallel products. It is a full life-cycle activity from product design, production, packaging, and transportation to consumption and recirculation [
35]. Remarkable results have been acquired in the printing and ceramic industries. The development process of CEL is presented in
Figure 2.
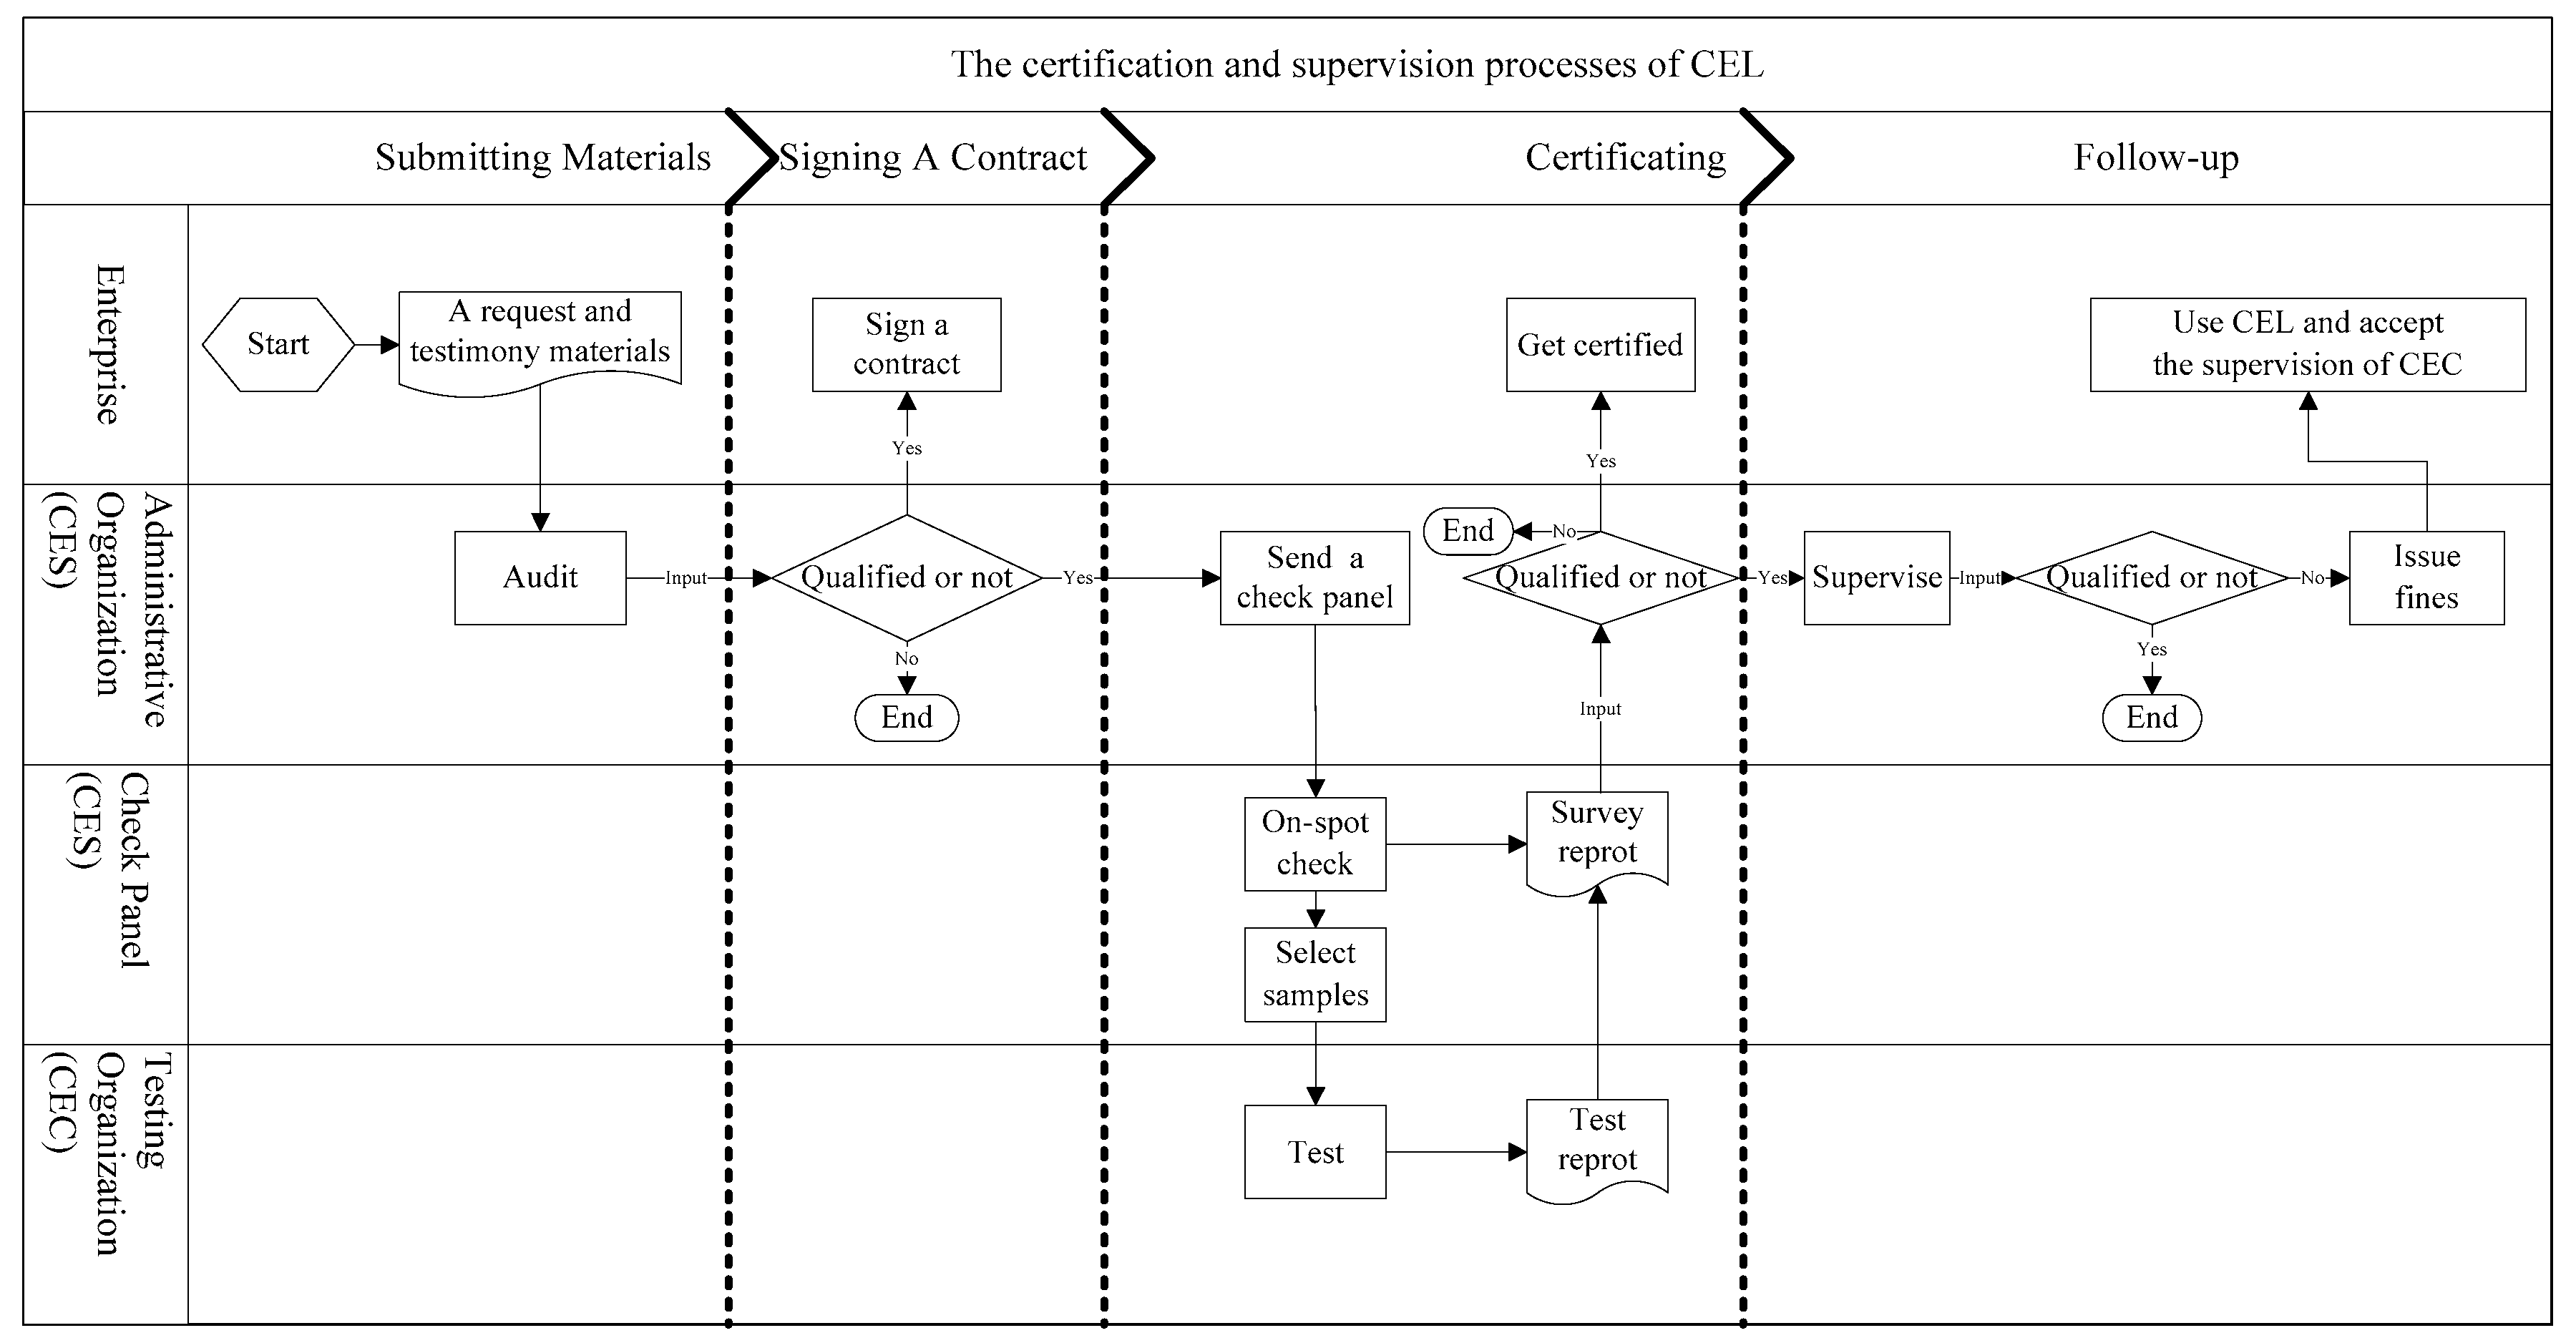
The general certification process of CEL is: a prospective enterprise submits a request as well as the required corresponding testimonial materials to the China Environmental United Certification Center (CEC). If qualified, the enterprise needs to pay the certification fees and sign a contract with the CEC. Then, a check panel would be sent by the CEC to the enterprise’s actual production field. The panel conducts on-site investigations to the enterprise, and sends selected samples to a CEC-affiliated testing organization for further testing. Based on the materials submitted by the enterprise, results of the field investigation and sample test results from the testing organization, the check panel makes a report and submits it to the technical committee of the CEC. The technical committee summarizes the results of the investigation and decides.
If approved, the enterprise would be authorized to use CEL for three years. The enterprise can print the label on the packaging of its products. At the same time, labeled products have priority for government procurement (in 2006, the Ministry of Finance of the People’ s Republic of China (MOF) issued rules requiring government agencies to give priority to CEL products). In general, the CEC would inspect the enterprise annually, and the local administrations for industry and commerce (AIC) also have supervision duties. The supervision results of the AIC would be reported to the CEC. If an enterprise were found to not implement the standards, the CEC would issue fines to it. After three years, the enterprise needs to resubmit materials and accepts recertification. The specific processes are presented in
Figure 3.
From
Figure 3, we can see that the certification and supervision process design of CEL seems to be rigorous. However, given that the CEC and AIC need to supervise thousands of scattered enterprises and hundreds of thousands of different products, workforce and material resources are limited for it to implement effective supervisions. Regarding this, the motivations for authorized enterprises to implement standards continuously should be analyzed, and the strategic interactions between the enterprises and government agencies should be coordinated, so that a more efficient supervision system could be formulated by the government.
3. Notions, Assumptions, and Parameters
Regarding the contents of
Section 2, the stylized modeling scenario in this paper is: after the certification process, the enterprises are authorized to use the CEL. Government agencies such as the CEC and the AIC act as supervisors. We consider an evolutionary game model including the government agencies and enterprises. Based on the theory of the evolutionary game, government agencies and enterprises are treated as separate players. They choose their strategies simultaneously, and neither of them can observe the other player’s choice when they make their decision. Their strategic interactions can be viewed as an asymmetric repeated game.
The pure strategy set of the government agency consists of two alternative strategies: supervise () and do not supervise (). The government agency adopts strategy with the probability of (), and the opposite strategy with . Similarly, the pure strategy set of the enterprise also consists of two alternative strategies: implement () and do not implement (). The probability of the enterprise choosing the strategy is (), and the probability of non-implementation is .
The government agency sets a series of standards for the enterprise, and supervises its implementation. The environmental benefits that the government department could obtain from the cleaner production of the enterprise are defined as . The more actions that the government agency takes, the more trusts from the public would develop towards the CEL scheme, and more prospective enterprises would be willing to join the scheme. We use to denote the benefits that the government agency could obtain from the public side if it chose strategy .
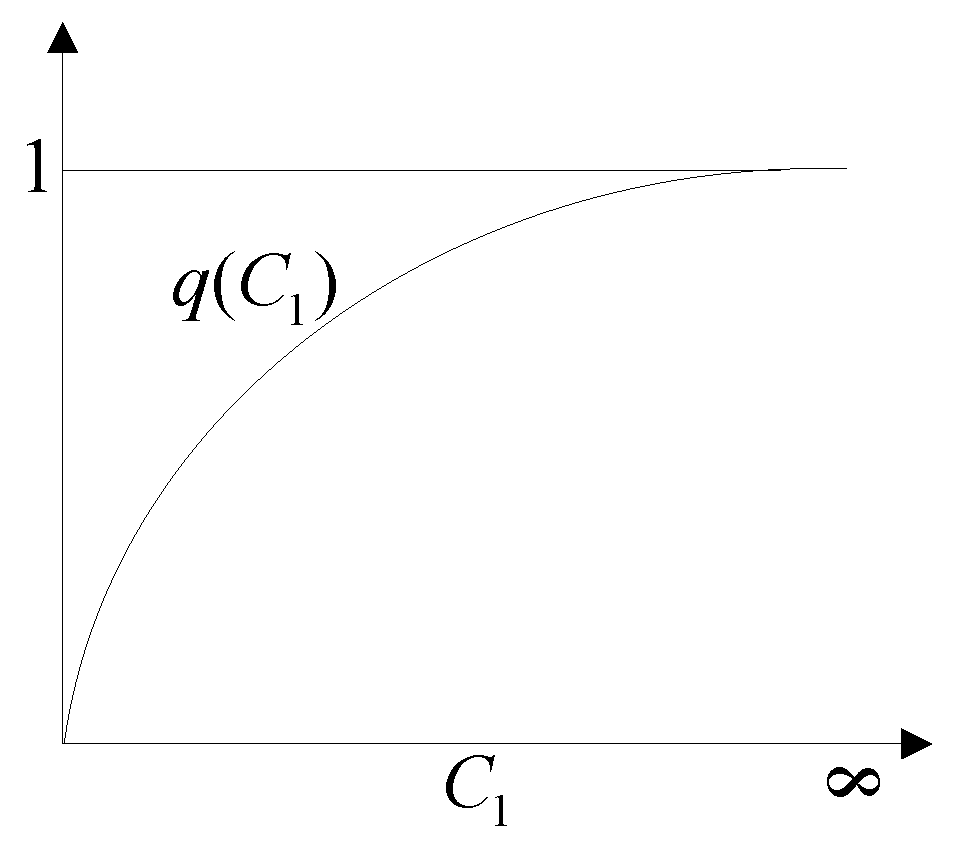
The supervision costs of the government agency are defined as . If the enterprise chose not to implement the standards, the probability of its behaviors being detected by the government agency was . is monotonically increasing with . If the government department found out that the authorized enterprise did not implement the standards, the government department would issue fines () to it.
Based on some popular understandings, the following assumptions are proposed.
Assumption 1. is a continuous function and. We assume thatand, which means that the detection probability increases with the supervision costs of the government agency.
The sketch diagram of
is depicted as
Figure 4. To facilitate the analysis, we assume that
and
is a constant that reflects the supervision effectiveness of the government agency [
36].
For the enterprises, there is a basic hypothesis:
Assumption 2. Enterprises’ production has a negative impact on the state of the environment, and a cleaner production is more expensive than the normal production [37]. It means that a higher cost () is needed for implementing the standards strictly.
The benefits from the customer side for the enterprise choosing to participate in the eco-labeling scheme are denoted as
, which comes from the premium for labeled products and the environmental considerations of consumers [
38]. As mentioned in
Section 2, CEL-labeled products have the priority for government procurement; so, we use
to denote the benefits from the government side. The enterprise could always obtain the benefits of
and
unless it did not implement the standards, and its behavior was detected by the government agency.
As depicted in
Table 1, the decision variables and parameters are explained as follows.
6. Conclusions and Policy Implications
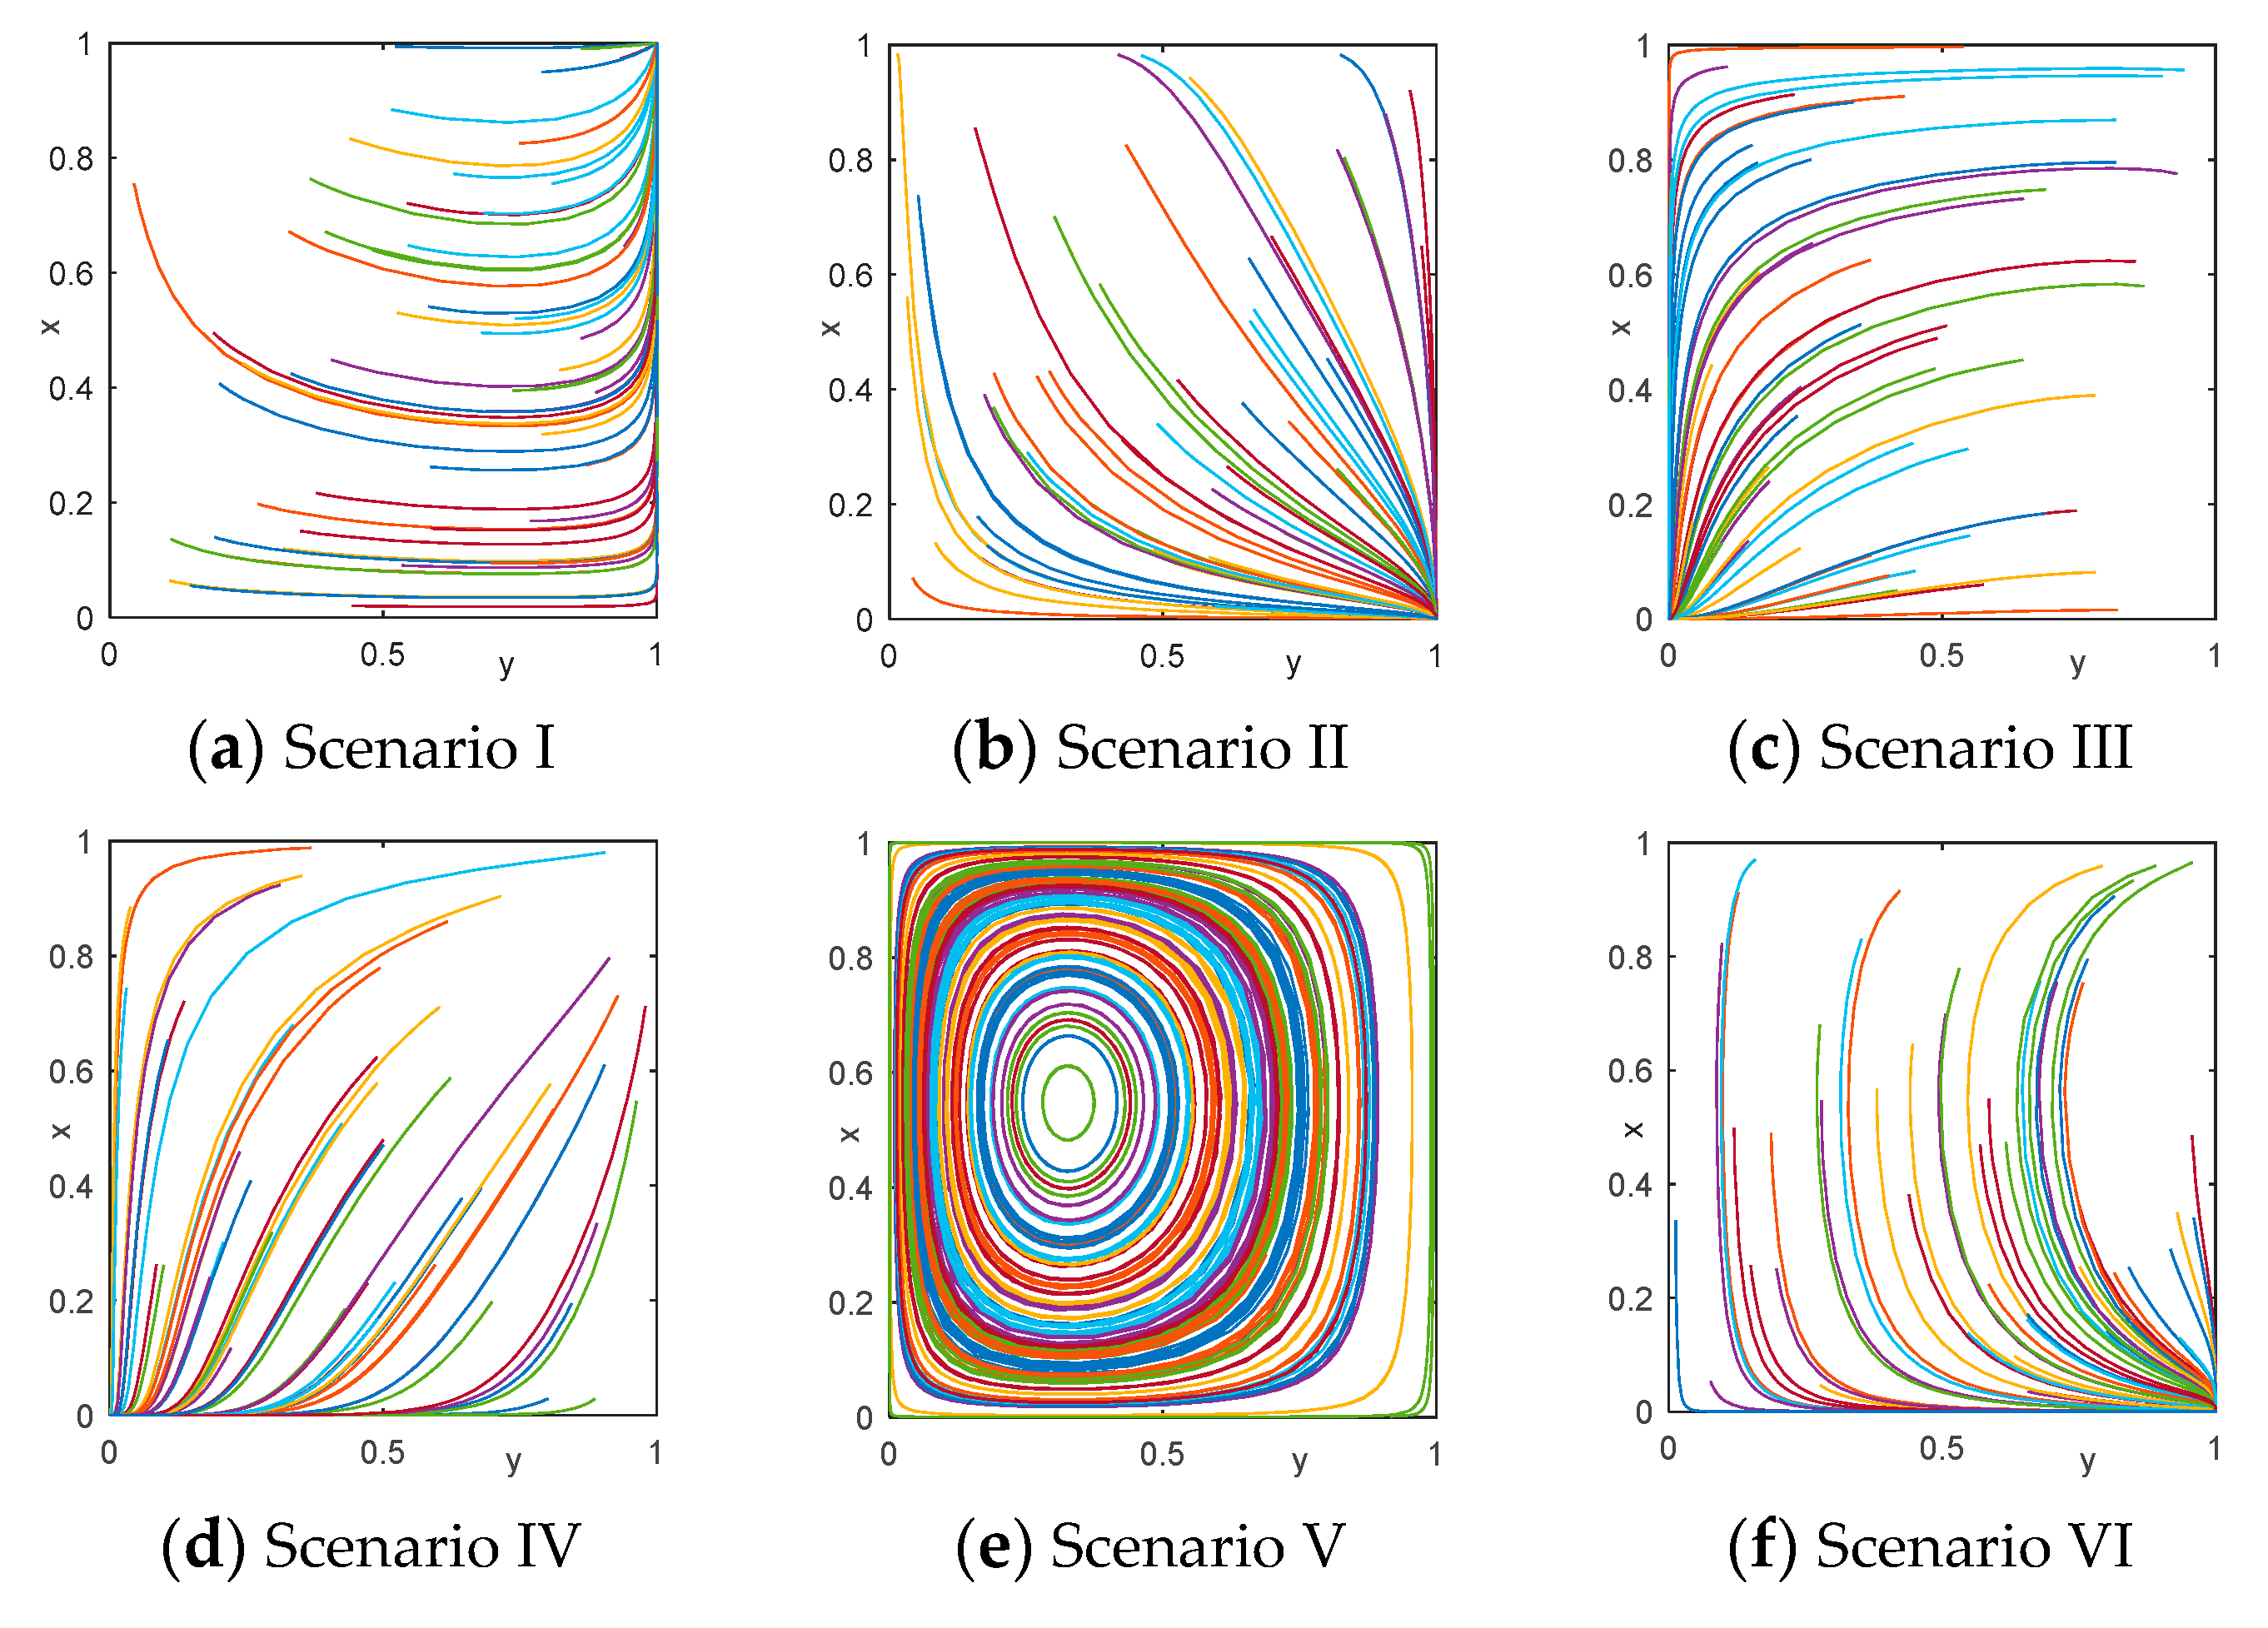
This paper has focused on the problem in the eco-labeling scheme of how to regulate and supervise the enterprises after they are certified, while also taking into consideration that the existing eco-labeling schemes in different countries are very different, and different certification systems and standards would result in different interaction relationships among stakeholders. We especially focus on the CEL scheme and study the strategic interactions between the government agency and enterprise by utilizing the approach of evolutionary game theory. With the supplement of numerical analyses, five propositions are proposed. Our results indicate that:
Combined with the analyses in Proposition 1, we can see that in any case, the strategy combination (, ) could not be a stable equilibrium solution. Namely, without effective supervision, a for-profit enterprise would not fulfill its duty spontaneously.
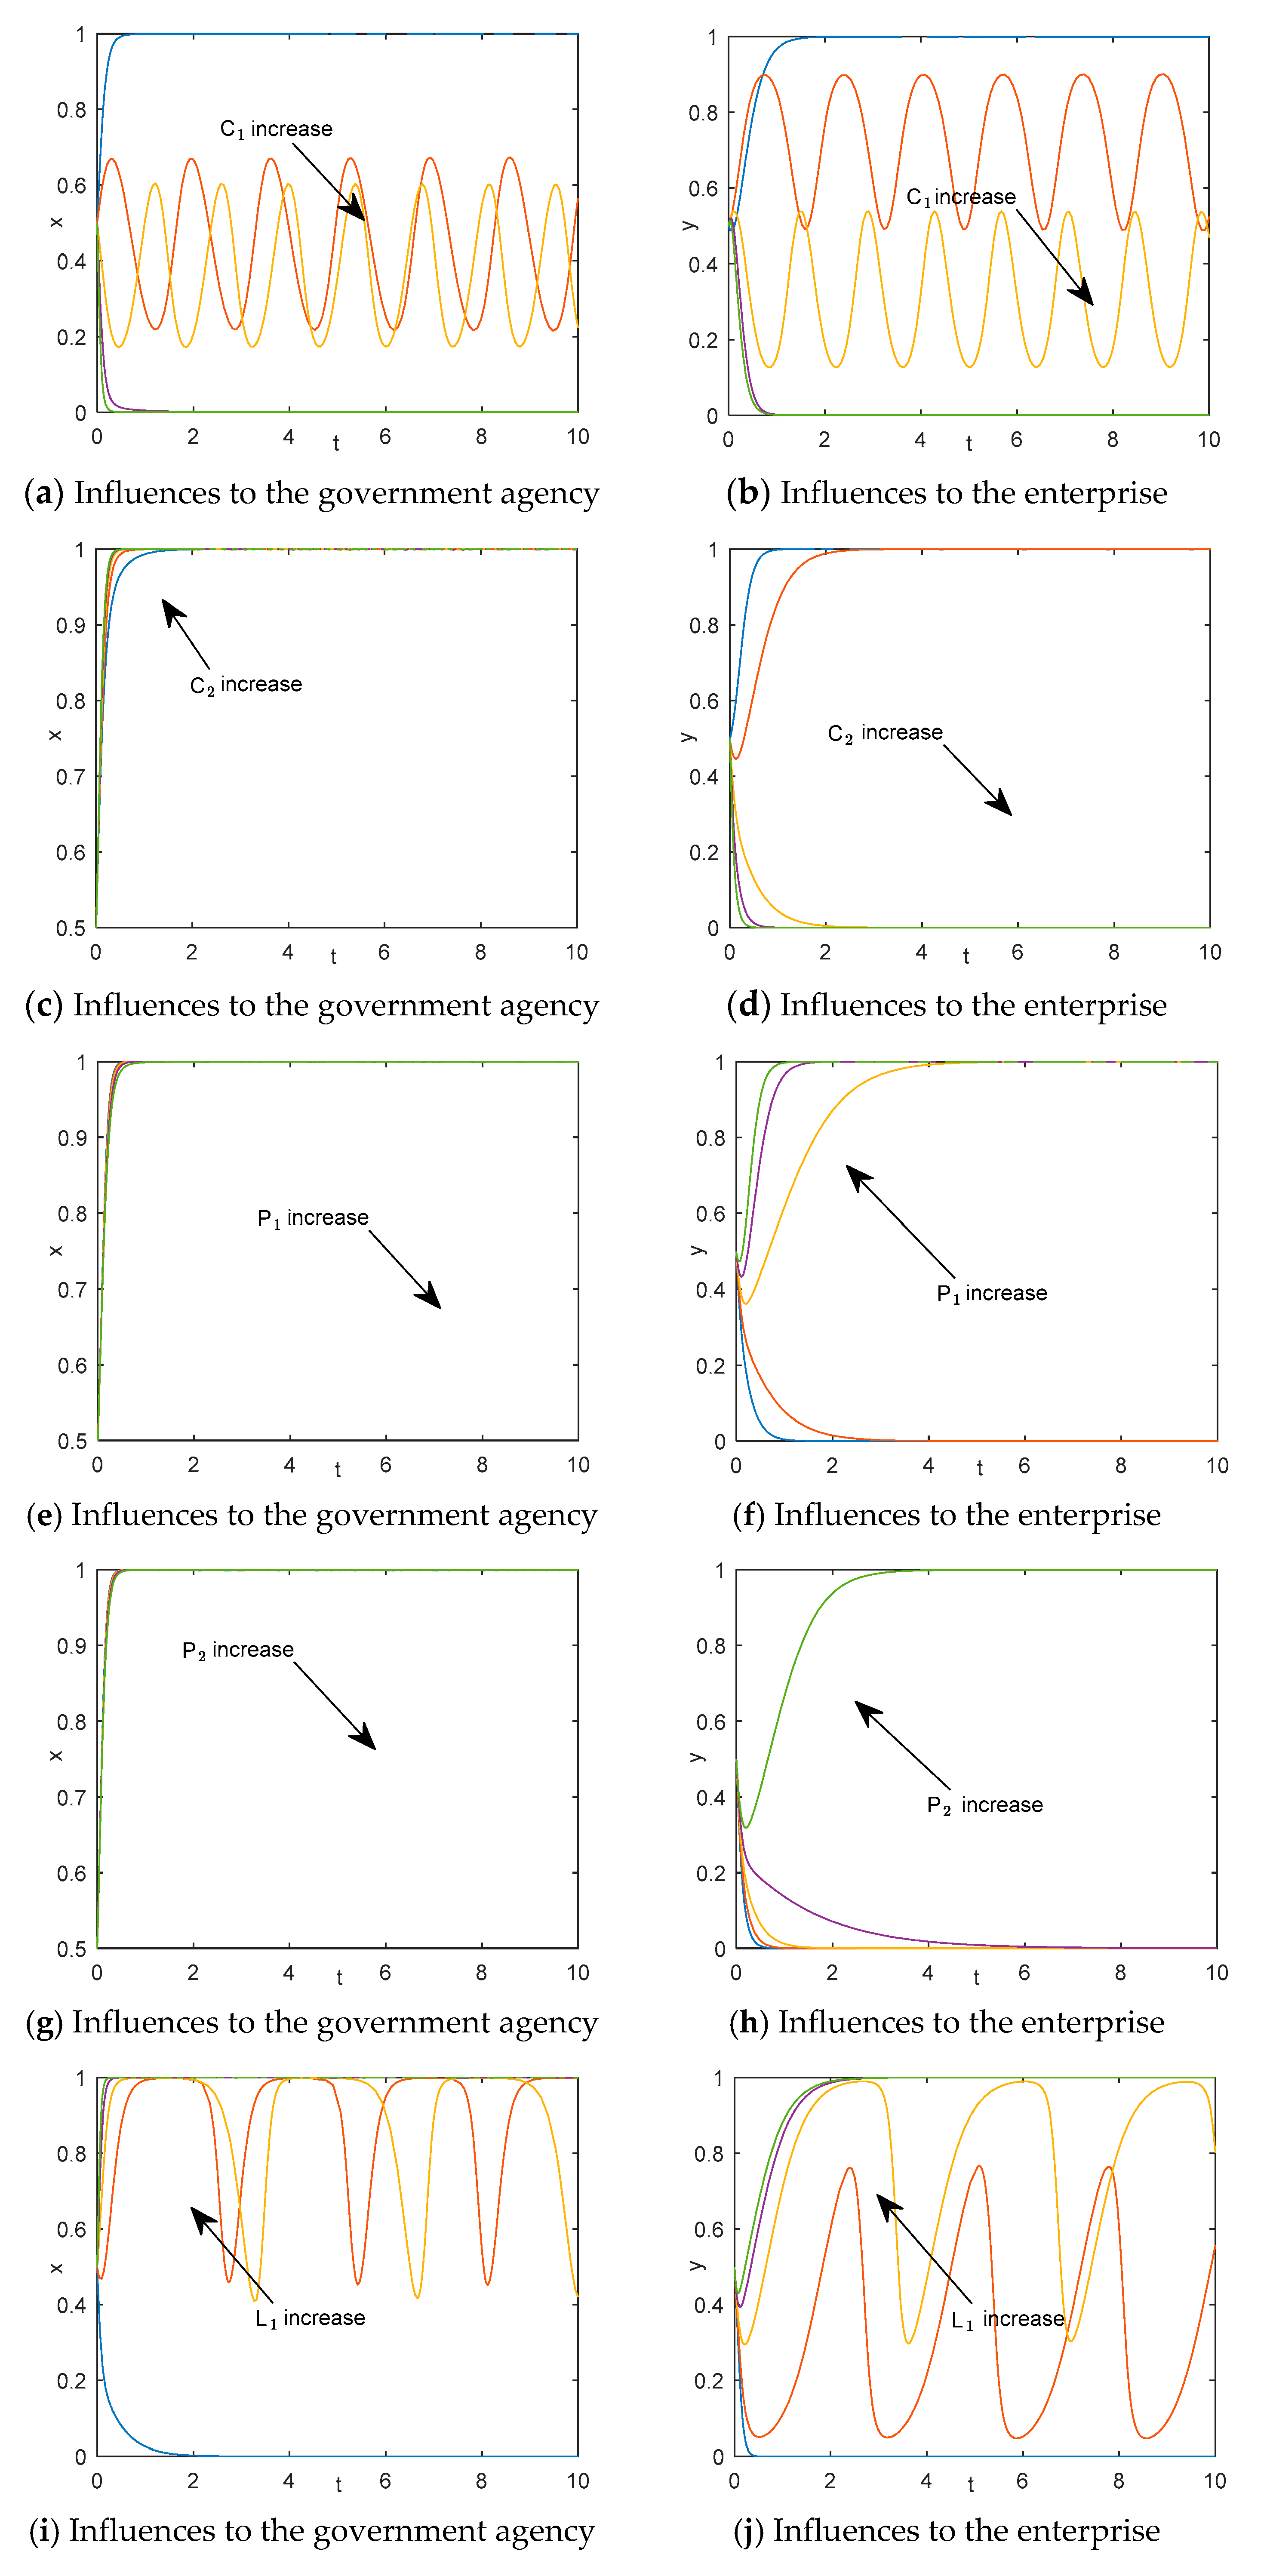
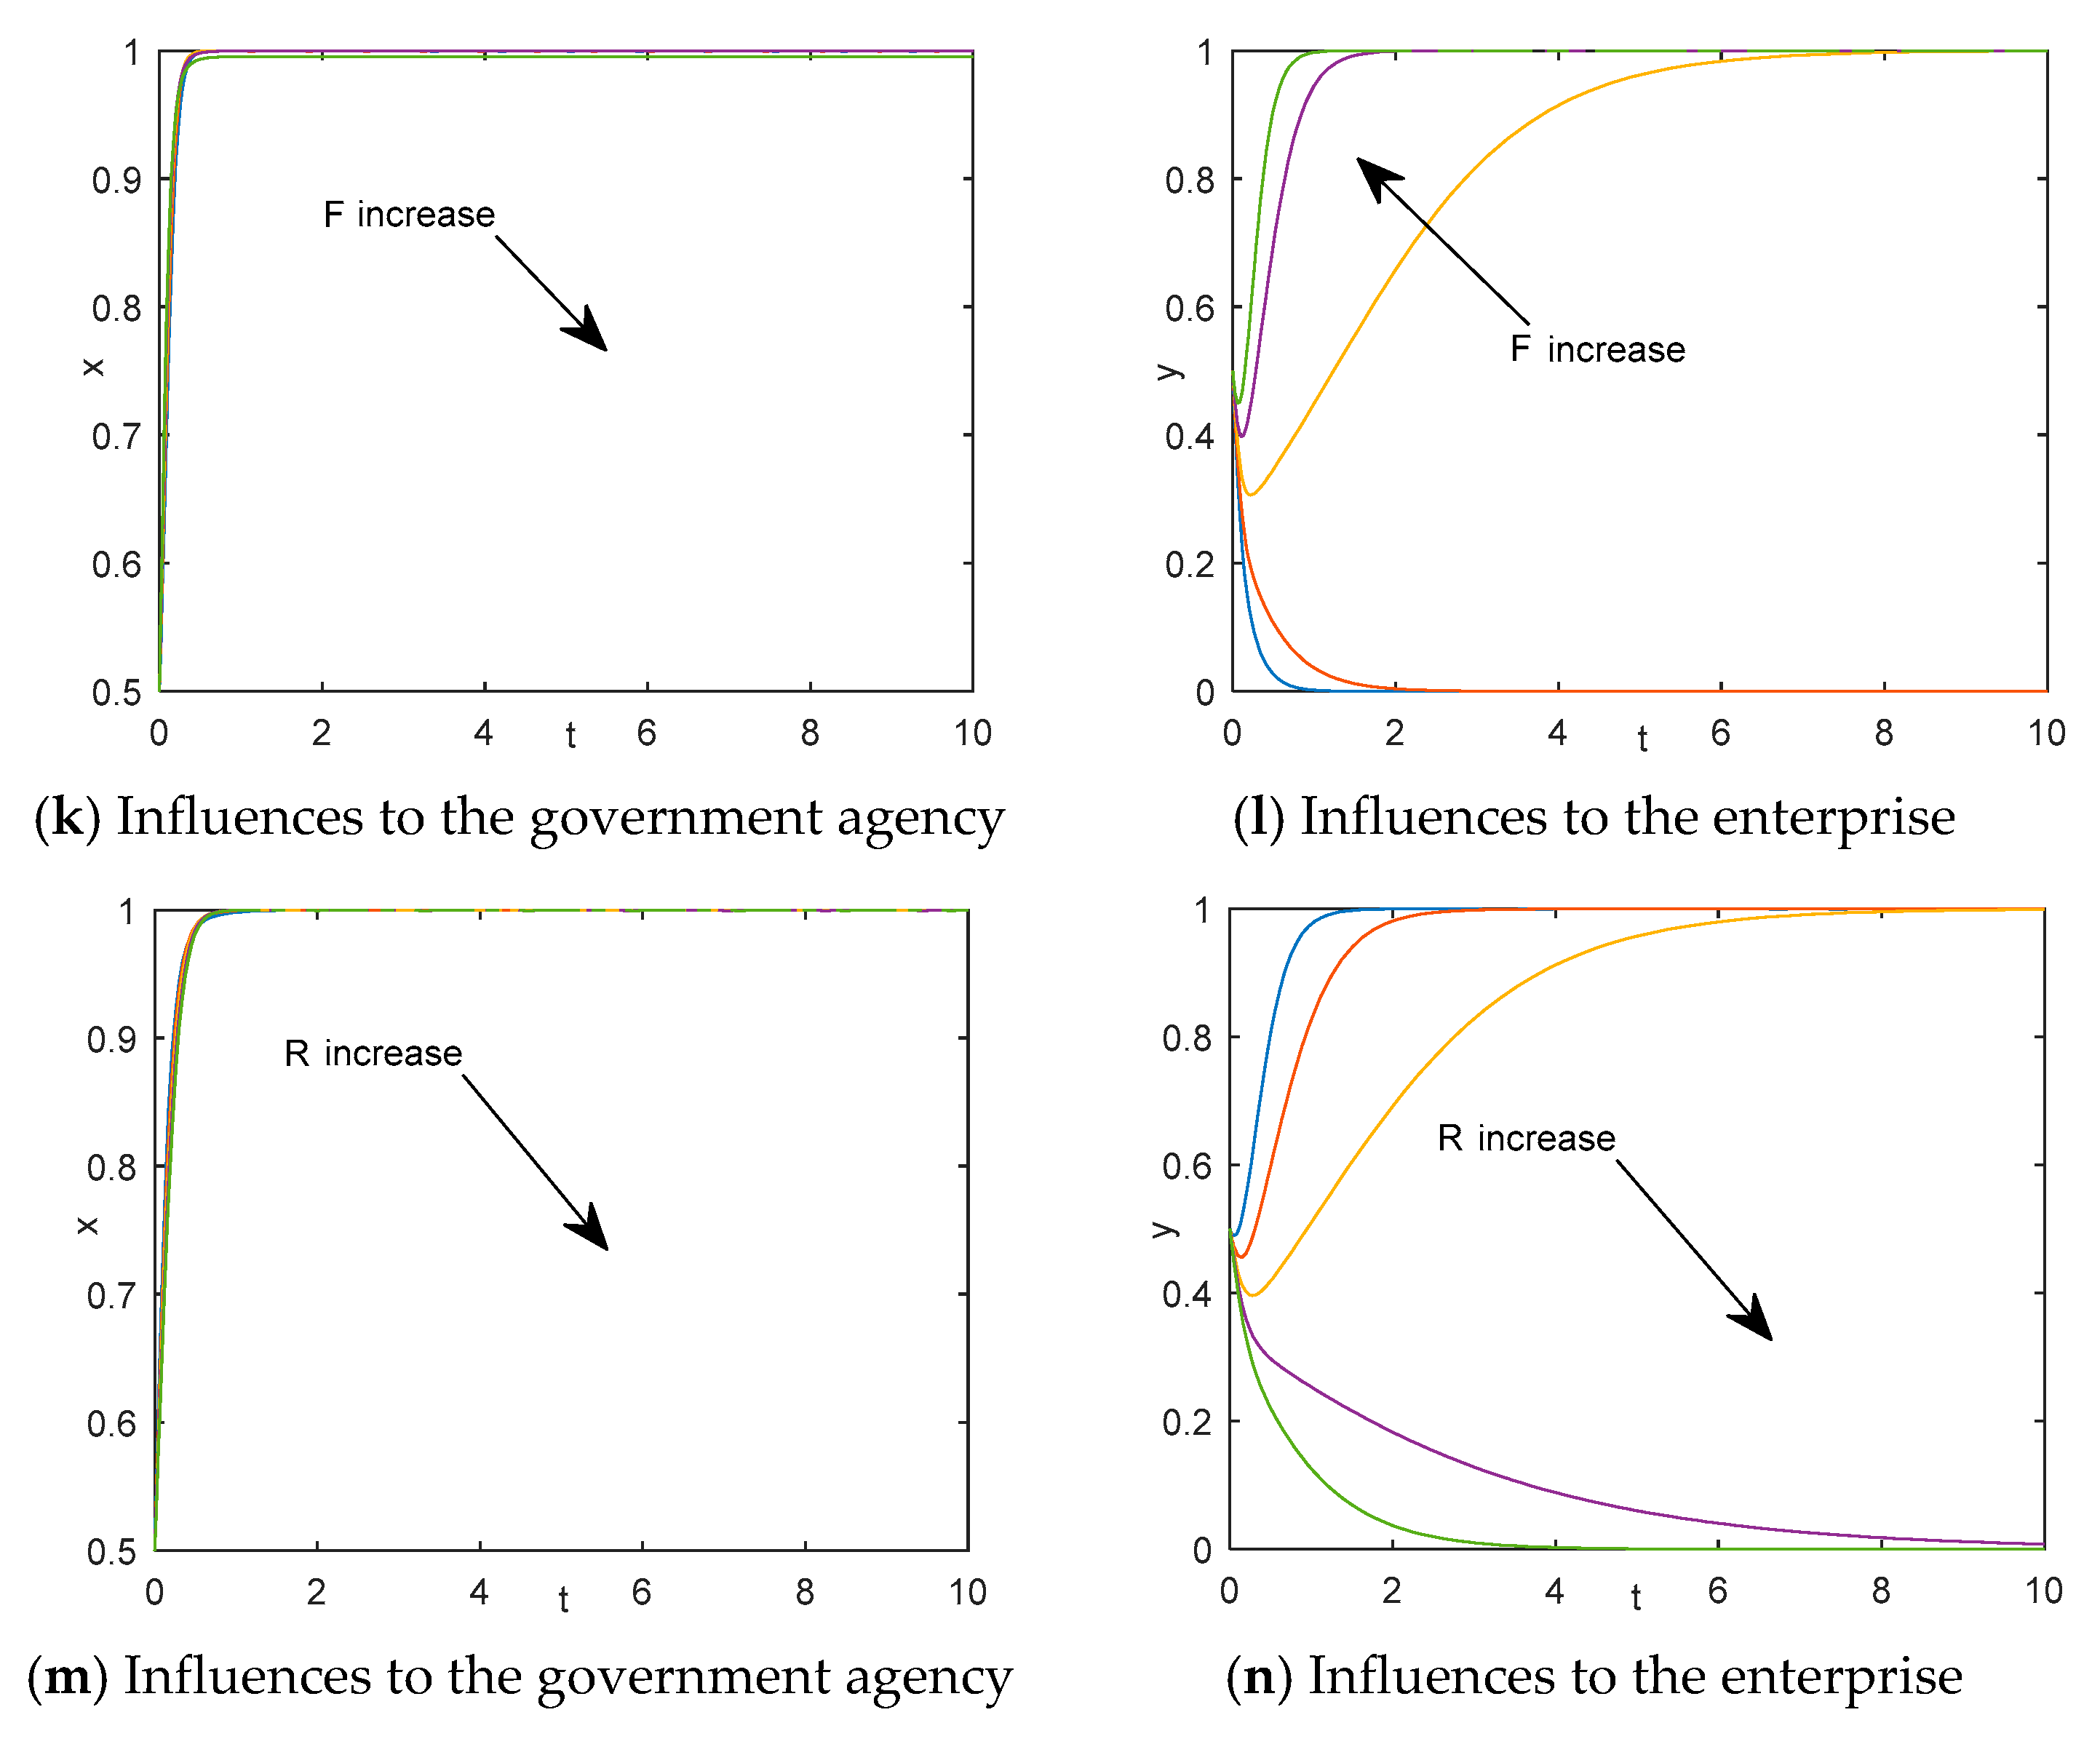
According to panel (a) in
Figure 7, when the supervision costs of the government agency increase, the government agency would choose not to supervise. In terms of panel (m), if the supervision efficiency of the government agency was low, the enterprise would tend to not implement the standards.
In terms of panel (d) in
Figure 7, when the implementation costs of the enterprise increase, the enterprise would not like to implement the standards.
Combined with the panel (l) in
Figure 7, we can see that when the fines for the non-execution acts of an enterprise increase, it would like to choose to implement the standards.
As presented by panels (f) and (h) in
Figure 7, when the influences from the government and customer side increase, the enterprises tend to choose to implement the standards.
Under the assumptions and parameter settings in this paper, the strategy combination (not supervise, implement) could not be a stable equilibrium. In line with the current situation, supervision from the government side is necessary in order for the enterprise to implement the standards.
For the government agency, high supervision costs and low efficiency are the two main obstructive factors. In this case, on the one hand, regarding
Figure 3, in the following stage, the government could consider bringing public scrutiny into the supervision system, which would be helpful for reducing informational asymmetries between the government agency and the enterprise. On the other hand, the participation of a third-party agency and company would not only benefit through reducing supervision costs, it would also be helpful through contributing to improving the effects of supervision [
5,
19].
For the enterprise, high implementation cost is an important factor that impedes it from getting more involved. Reducing the execution costs of enterprises is helpful in making them participate more. In this case, government agencies can offer some subsidies or tax reductions to the enterprises [
21]. Except for imposing a fine, a government agency such as the CEC needs to integrate the supervision information. A public information platform is necessary to disclose these dishonest enterprises and pipe them off from government procurement.
In addition, to encourage the enterprises to implement the standards spontaneously, on the one hand, the government should provide more priorities to labeled products. On the other hand, more publicity about the eco-label should be visible to the public, which would help to raise the green consumption awareness of consumers. All of those measures are helpful for moving the equilibrium point toward the strategy combination (not supervise, implement) [
43].
Although our research is mainly motivated by the issues that exist in China, the analyses and proposed policy suggestions are also suitable for many countries, especially some large developing countries. Given the limited space available, an evaluation of the effectiveness of these proposals above cannot be discussed in detail in this paper, which can be modeled by incorporating additional factors such as tax, publicity costs, and so on.
In this paper, we specially focus on the eco-labeling scheme launched by the government. We treat government agencies such as the CEC and AIC as a whole, and do not consider their personal incentives. That is one drawback of this paper. In the following study, we would take these factors into account, as well as the influences from other certification organizations such as businesses and non-governmental organizations (NGOs). Studying the conflicting interests among them would make the study more comprehensive and practical. On the other hand, we also do not consider how many rounds are required to achieve equilibrium. In fact, if the interaction between the enterprise and the government agency was finite, evolutionary game theory would not be suitable for this issue. In that case, a supergame between the enterprise and the government agency should be modeled, and then the folk theorem would kick in.
The value of this paper is limited in that the data used in the numerical analysis is not real. In the following research, we would conduct an empirical analysis to verify the results and supplement the contents of this paper. Also, our paper analyzes the interaction relationships between the government agencies and enterprises. In future research, the consumer would be added to the game as a third player, which would make the study more valuable. Recently, a series of new information technologies have been adopted by the Chinese government to regulate the labeled enterprises, such as the Internet of Things and data mining. The influences of these factors should also be modeled in future research.


