Article

Seasonal Variations of Dissolved Organic Matter in the East China Sea Using EEM-PARAFAC and Implications for Carbon and Nutrient Cycling

1
Institute of Marine Chemistry and Environment, Ocean College, Zhejiang University, Zhoushan 316021, China
2
Key Lab of Marine Ecosystem and Biogeochemistry, Second Institute of Oceanography of SOA, Hangzhou 310012, China
3
Department of Oceanography, National Sun Yat-Sen University, Kaohsiung 804, Taiwan
*
Authors to whom correspondence should be addressed.
Sustainability 2018, 10(5), 1444; https://doi.org/10.3390/su10051444
Submission received: 2 February 2018 / Revised: 4 April 2018 / Accepted: 14 April 2018 / Published: 5 May 2018
(This article belongs to the Special Issue Marine Carbon Cycles)

Abstract

:
Dissolved organic matter (DOM) plays a very important role in the dynamics of different biogeochemical processes in the global marine carbon cycle. Seasonal variations of DOM were investigated using dissolved organic carbon (DOC), absorption spectroscopy, and fluorescence excitation emission matrix–parallel factor analysis (EEM-PARAFAC) in Niushan Island in the East China Sea, off southeast Zhejiang, in winter, spring, and summer 2017. A strong positive correlation between temperature and salinity was observed in winter, whereas negative correlations were obtained in spring and summer. The results suggest that the water in the study area originates from the Changjiang River water coinciding with the direction of winds in winter. On the other hand, the Taiwan Strait water flows northward on the eastern part of the study area in summer and spring. The DOC concentration showed significant seasonal variations and was much lower in summer than in winter, but largely independent of the temperature, degree of absorption and intensity of the fluorescence component. Three tryptophan-like components (C1, C2 and C4) and one humic-like component were identified by the PARAFAC model in winter, while two tryptophan-like components (C1 and C2) and two humic-like components were illustrated in summer. The seasonal variations of DOC concentrations and intensities of the fluorescence components in the study area from winter to summer suggest that the waters in this area were influenced mainly by mixing water of the Changjiang River and the Taiwan Strait. A strongly linear relationship was found between the nutrient and the fluorescence intensities of different components in winter, reflecting the profound impacts of the dynamics of DOM on nutrient cycling.

1. Introduction

DOM is a huge organic reservoir on the earth and plays many important roles in the dynamics of different biogeochemical processes in the global carbon cycle [1]. It has been extensively investigated regarding its composition, structure, source, sink and the migration process in the aquatic environments [2,3]. DOM can directly affect nutrient cycling [4], the toxicity of organic pollutants [5], the solubility of heavy metals [6] and the aquatic ecosystem [5,7], and also indirectly influence the atmospheric CO2 level and global climate change [8,9]. It is well known that DOM is a complex mixture of natural organic compounds found in various kinds of water bodies including rivers, lakes, glaciers, and oceans [10,11,12]. It consists of protein-like, humic-like, pigment-like, amino acid-like and unknown molecules and is generally believed to be the decay products and metabolites of zooplankton and phytoplankton [13]. Unfortunately, it is a challenge to accurately identify and extract subtle chemical compositional changes from the large DOM chemical background for tracking mixing behaviors of different water masses in a complex coastal area. However, these disturbed variable compositions and structures of DOM are the keys to understanding their source, migration, transformation and dynamics process in the global carbon cycle [14]. Therefore, suitable analytical methods had to be developed [15,16].
Recently, excitation emission matrix spectroscopy (EEMs) with its simple, sensitive and relatively inexpensive advantages was employed to determine the composition, structure and sources of DOM by peak picking method, and was regarded as the most effective technique due to the florescence properties of DOM [17]. So far, eight general types of fluorescence peaks have been identified in natural waters [18]. This provides a wealth of information on changes in DOM resulting from the mixing, biological processes, and photobleaching that occur in the aquatic environment [19,20,21]. EEMs has been extensively used to identify fluorescent components in seas, rivers and lakes because of the specific spectrum obtained from each known fluorophore [22,23,24]. Nevertheless, not all of the fluorescence peaks can be identified visually, such as the spectra of the underlying fluorophores owing to peaks stacking with each other in EEM and the complexity of DOM, leading to some inaccurate results or data waste [25]. To solve this problem, Stedmon et al. firstly used parallel factor analysis (PARAFAC) by decomposing the EEMs of complex mixtures into independent fluorescent components to obtain more accurate results [26]. The combination of EEMs and PARAFAC analysis could provide detailed fingerprint information from EEM and has been attracting attention as a reliable method which is better than the traditional peaking method. Now, the method of EEM-PARAFAC has been widely applied in the identification of DOM, and its applications have been reported by a large number of studies [4,22,27,28].
The East China Sea (ECS, China) is located in the northwestern Pacific Ocean and is within the continental shelf. The ECS is considered to be a typical continental shelf region with an average depth of 370 m and area of 770 × 103 km2 [29]. It receives a large volume of freshwater from the Changjiang River [30] and seawaters from the Kuroshio. This relatively shallow sea is strongly influenced by the Taiwan Strait water, mixing processes, monsoons and tides. Therefore, the ECS is a highly dynamic and active region [31,32]. The major source and seasonal variations of DOM in this area are relatively complex and not well known.
Recently, a few studies have used absorption and fluorescence spectroscopy to investigate components and source of DOM in the ECS [33,34,35]. However, to date, few studies have focused on seasonal variations of DOM concentrations and the impact of seasonal variability on DOM dynamics using EEM-PARAFAC in this region [36]. To our knowledge, there are no available published studies reflecting the variability patterns of nutrients based on the relationships between DOM optical properties and nutrient concentrations. This study is based on three cruises in winter (January), spring (May), and summer (August) 2017, and seawater samples were collected from the offshore area of Niushan Island (121° E–122.4° E, 27.8° N–28.9° N) (Figure 1). The specific objectives of this study were (1) to elucidate the changes and the mixing behaviors of seawater masses in three seasons; (2) to identify the components and sources of chromophoric dissolved organic matter (CDOM) with seasonal variations, using DOC, absorption spectroscopy, and the fluorescence EEM-PARAFAC; and (3) to reveal the effects of DOM dynamics on the nutrient cycling.

2. Materials and Methods

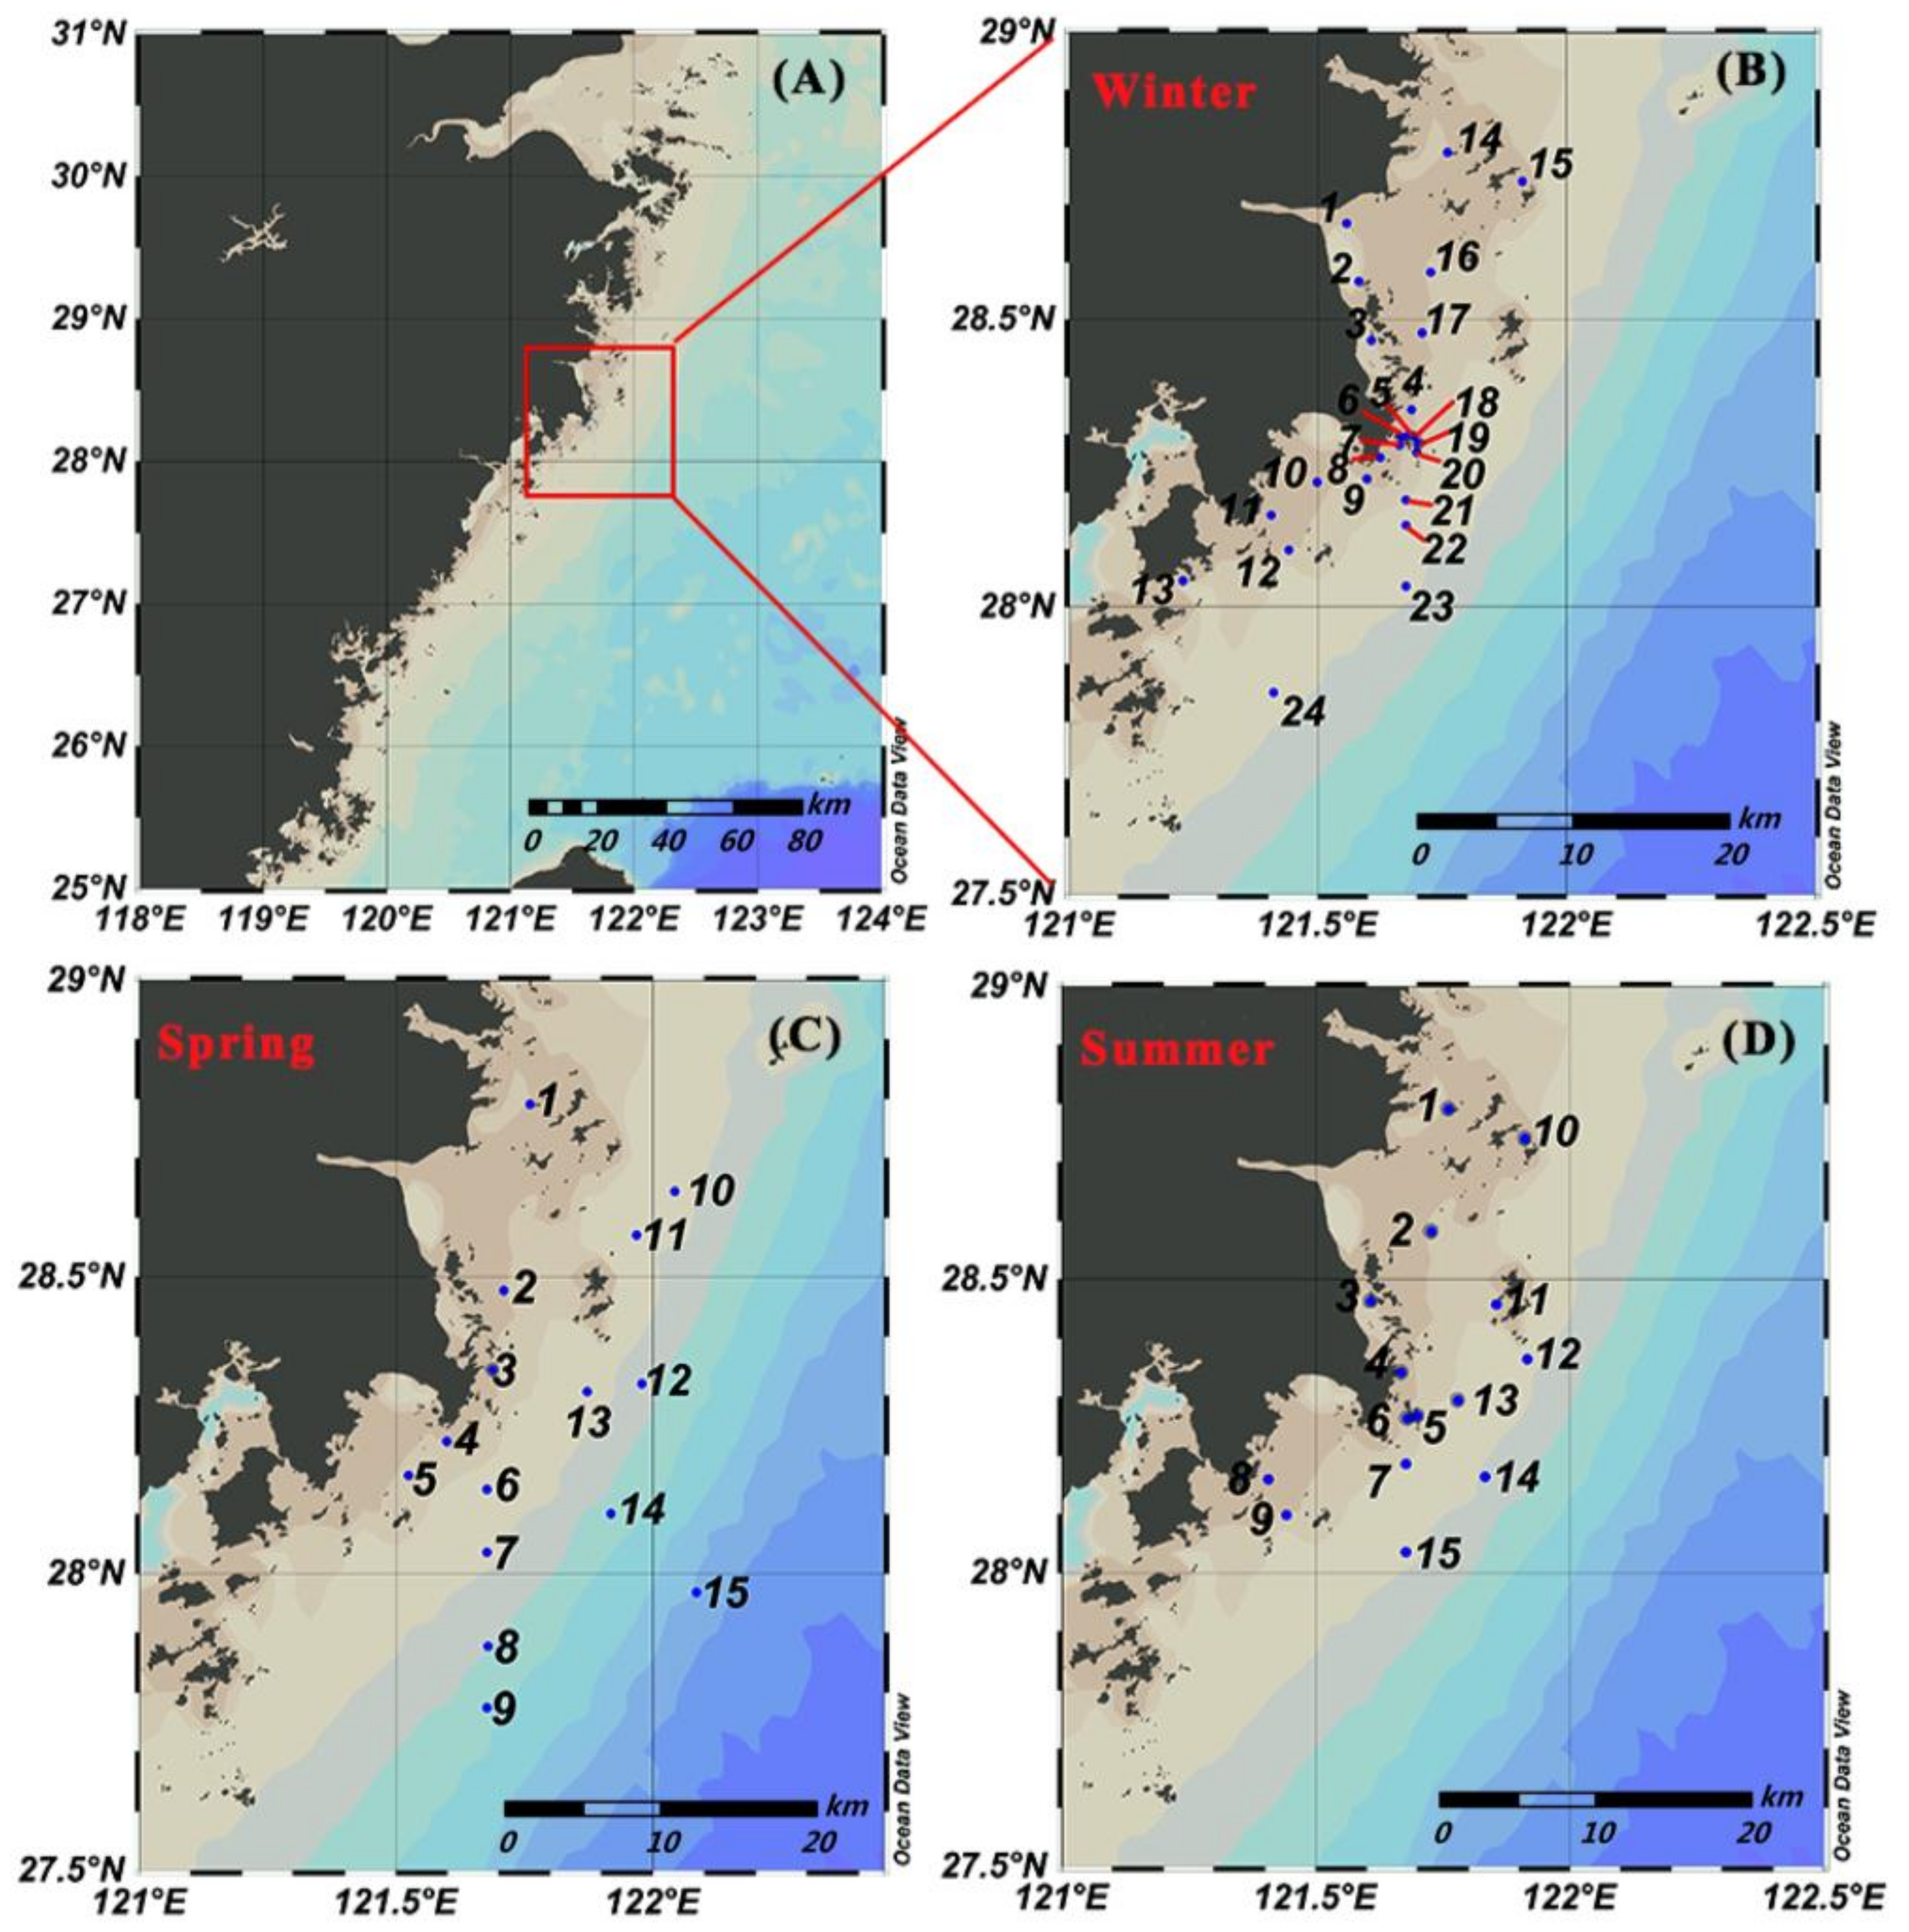
2.1. Sample Collection and Pretreatment

Water samples were taken during three cruises. Due to the strong winter wind, it is difficult to collect the samples from the bottom (3 m above the sea bed). Therefore, only the surface water samples of 24 stations were collected on 13–15 January 2017 (2 m beneath the sea surface) (Figure 1B), and both surface and bottom seawater samples of 15 stations were collected on 11–13 May and 9–11 August 2017 (Figure 1C,D), aboard the research vessel Zheluyuyun No. 88009.
For the analysis of CDOM and DOC, the first group of parallel samples were filtered through Whatman glass fiber filters (GF/F 0.7 μm, precombusted at 450 °C for 6 h with Muffle furnace to remove all organic matters) and then kept in 60 mL brown glass bottles under a low temperature (<0 °C) before use. Brown glass bottles were soaked in HCl (1:5) and washed with Milli-Q water, and also precombusted at 450 °C for 6 h by Muffle furnace before use. In order to analyze the concentrations of nutrients, the other group of duplicate seawater samples were filtered through 0.45 μm cellulose acetate membranes and refrigerated in Nalgene bottles until they were tested. The temperature and salinity were obtained in situ using a CTD profiler (XR-620, RBR Ltd., Kanata, ON, Canada).

2.2. DOC and Nutrient Measurements

The total organic carbon analyzer (Shimadzu TOC-L CPH/CPN) was used to measure the concentrations of DOC by means of high-temperature catalytic oxidation (~680 °C). In order to remove the inorganic carbon from the sample, excess hydrochloric acid was added. Five different concentrations of potassium hydrogen phthalate were prepared for standard curve and every sample was measured at least twice with a coefficient of variation <2%.
The concentrations of nutrients were analyzed using AutoAnalyzer3 (SEAL) based on the procedure described by Strickland and Parsons [37] for NO3 and NO2 by the standard pink azo dye spectrophotometric method [38], for PO43− and SiO32− using the standard phospho-molybdenum blue and silicon molybdenum blue spectrophotometric procedures [39]. Standard references were provided by Second Institute of Oceanography of SOA, China.

2.3. UV-vis Measurements and Fluorescence Analysis

Absorption spectra of CDOM at 200–800 nm was obtained from Thermo Evolution 300 UV-VIS in 5-cm quartz cells with Milli-Q water as a reference. The absorbance of each sample was corrected by subtracting the mean absorbance from 700 to 800 nm. The absorption coefficient (aλ) was obtained from the equation
a λ = 2.303 A λ / L
where λ was the wavelength and L was the cell length in meter. The values of a280 was used to represent the CDOM level.
The EEM spectra was measured by an F-7000 fluorescence spectrometer (Hitachi High Technologies, Tokyo, Japan) with excitation wavelengths of 200–450 nm (5 nm intervals) and emission wavelengths of 250–550 nm (2 nm intervals). The scanning rate was set to 12,000 min−1. Meanwhile, Milli-Q water was used as a blank control to remove Water Raman scatter peaks.
Three fluorescence-derived indices (fluorescence index (FI), biological index (BIX) and humification index (HIX)) were calculated using the EEMs obtained from the fluorescence analysis [40,41,42]. The equations were
FI = F E x = 370   nm , E m = 450   nm F E x = 370   nm , E m = 500   nm
BIX = F E x = 310   nm , E m = 380   nm F E x = 310   nm , E m = 430   nm
HIX = S E x = 255   nm , E m = 434 480   nm S E x = 255   nm , E m = 300 346   nm
where Ex represents the excitation and Em represents the emission; F is the abbreviation for fluorescence intensity.

3. Results

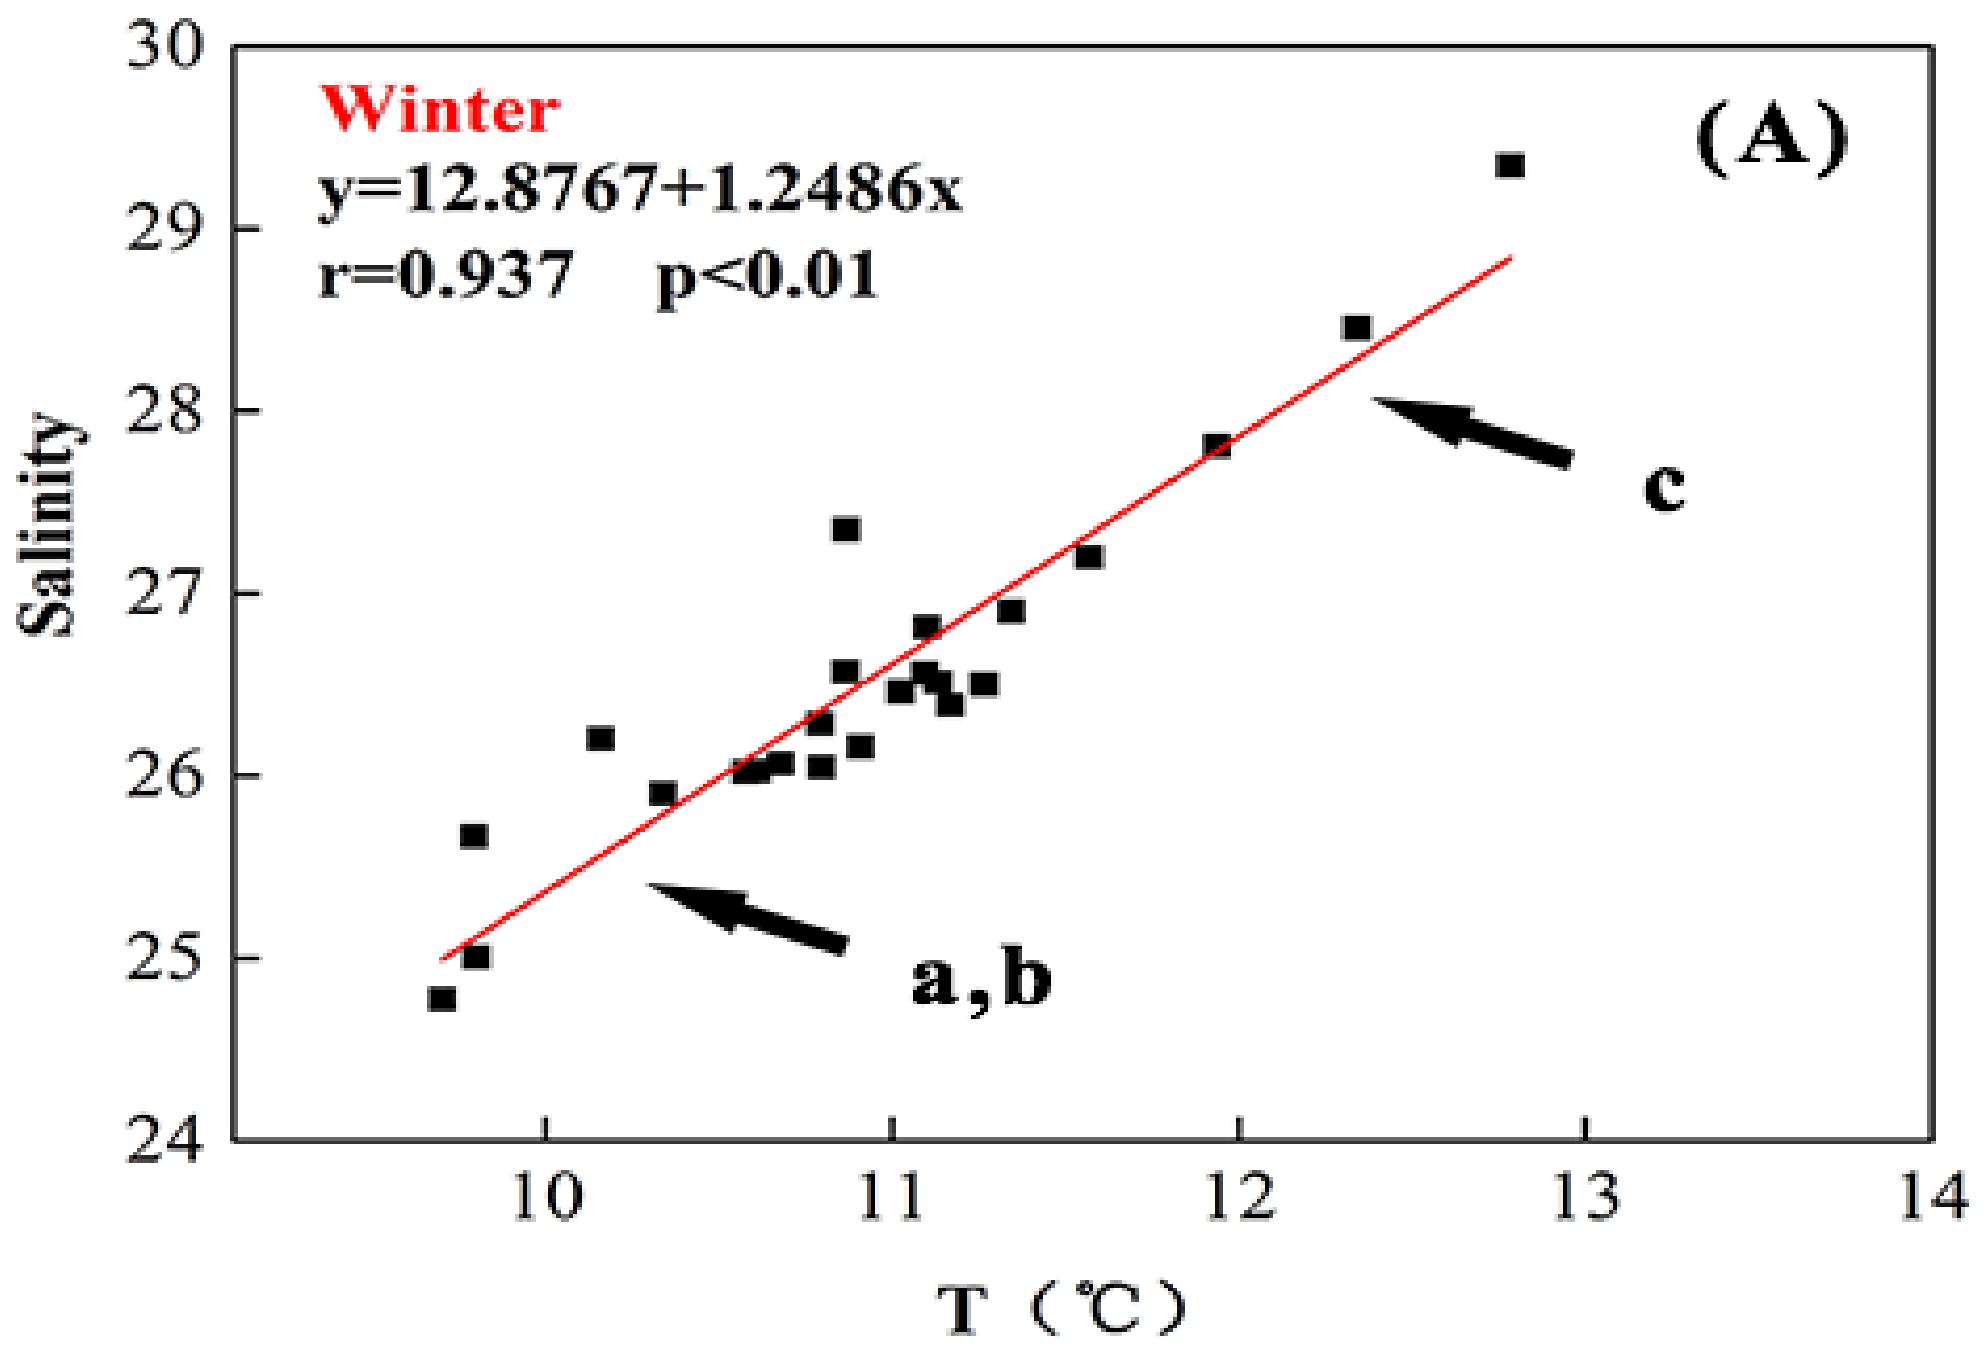
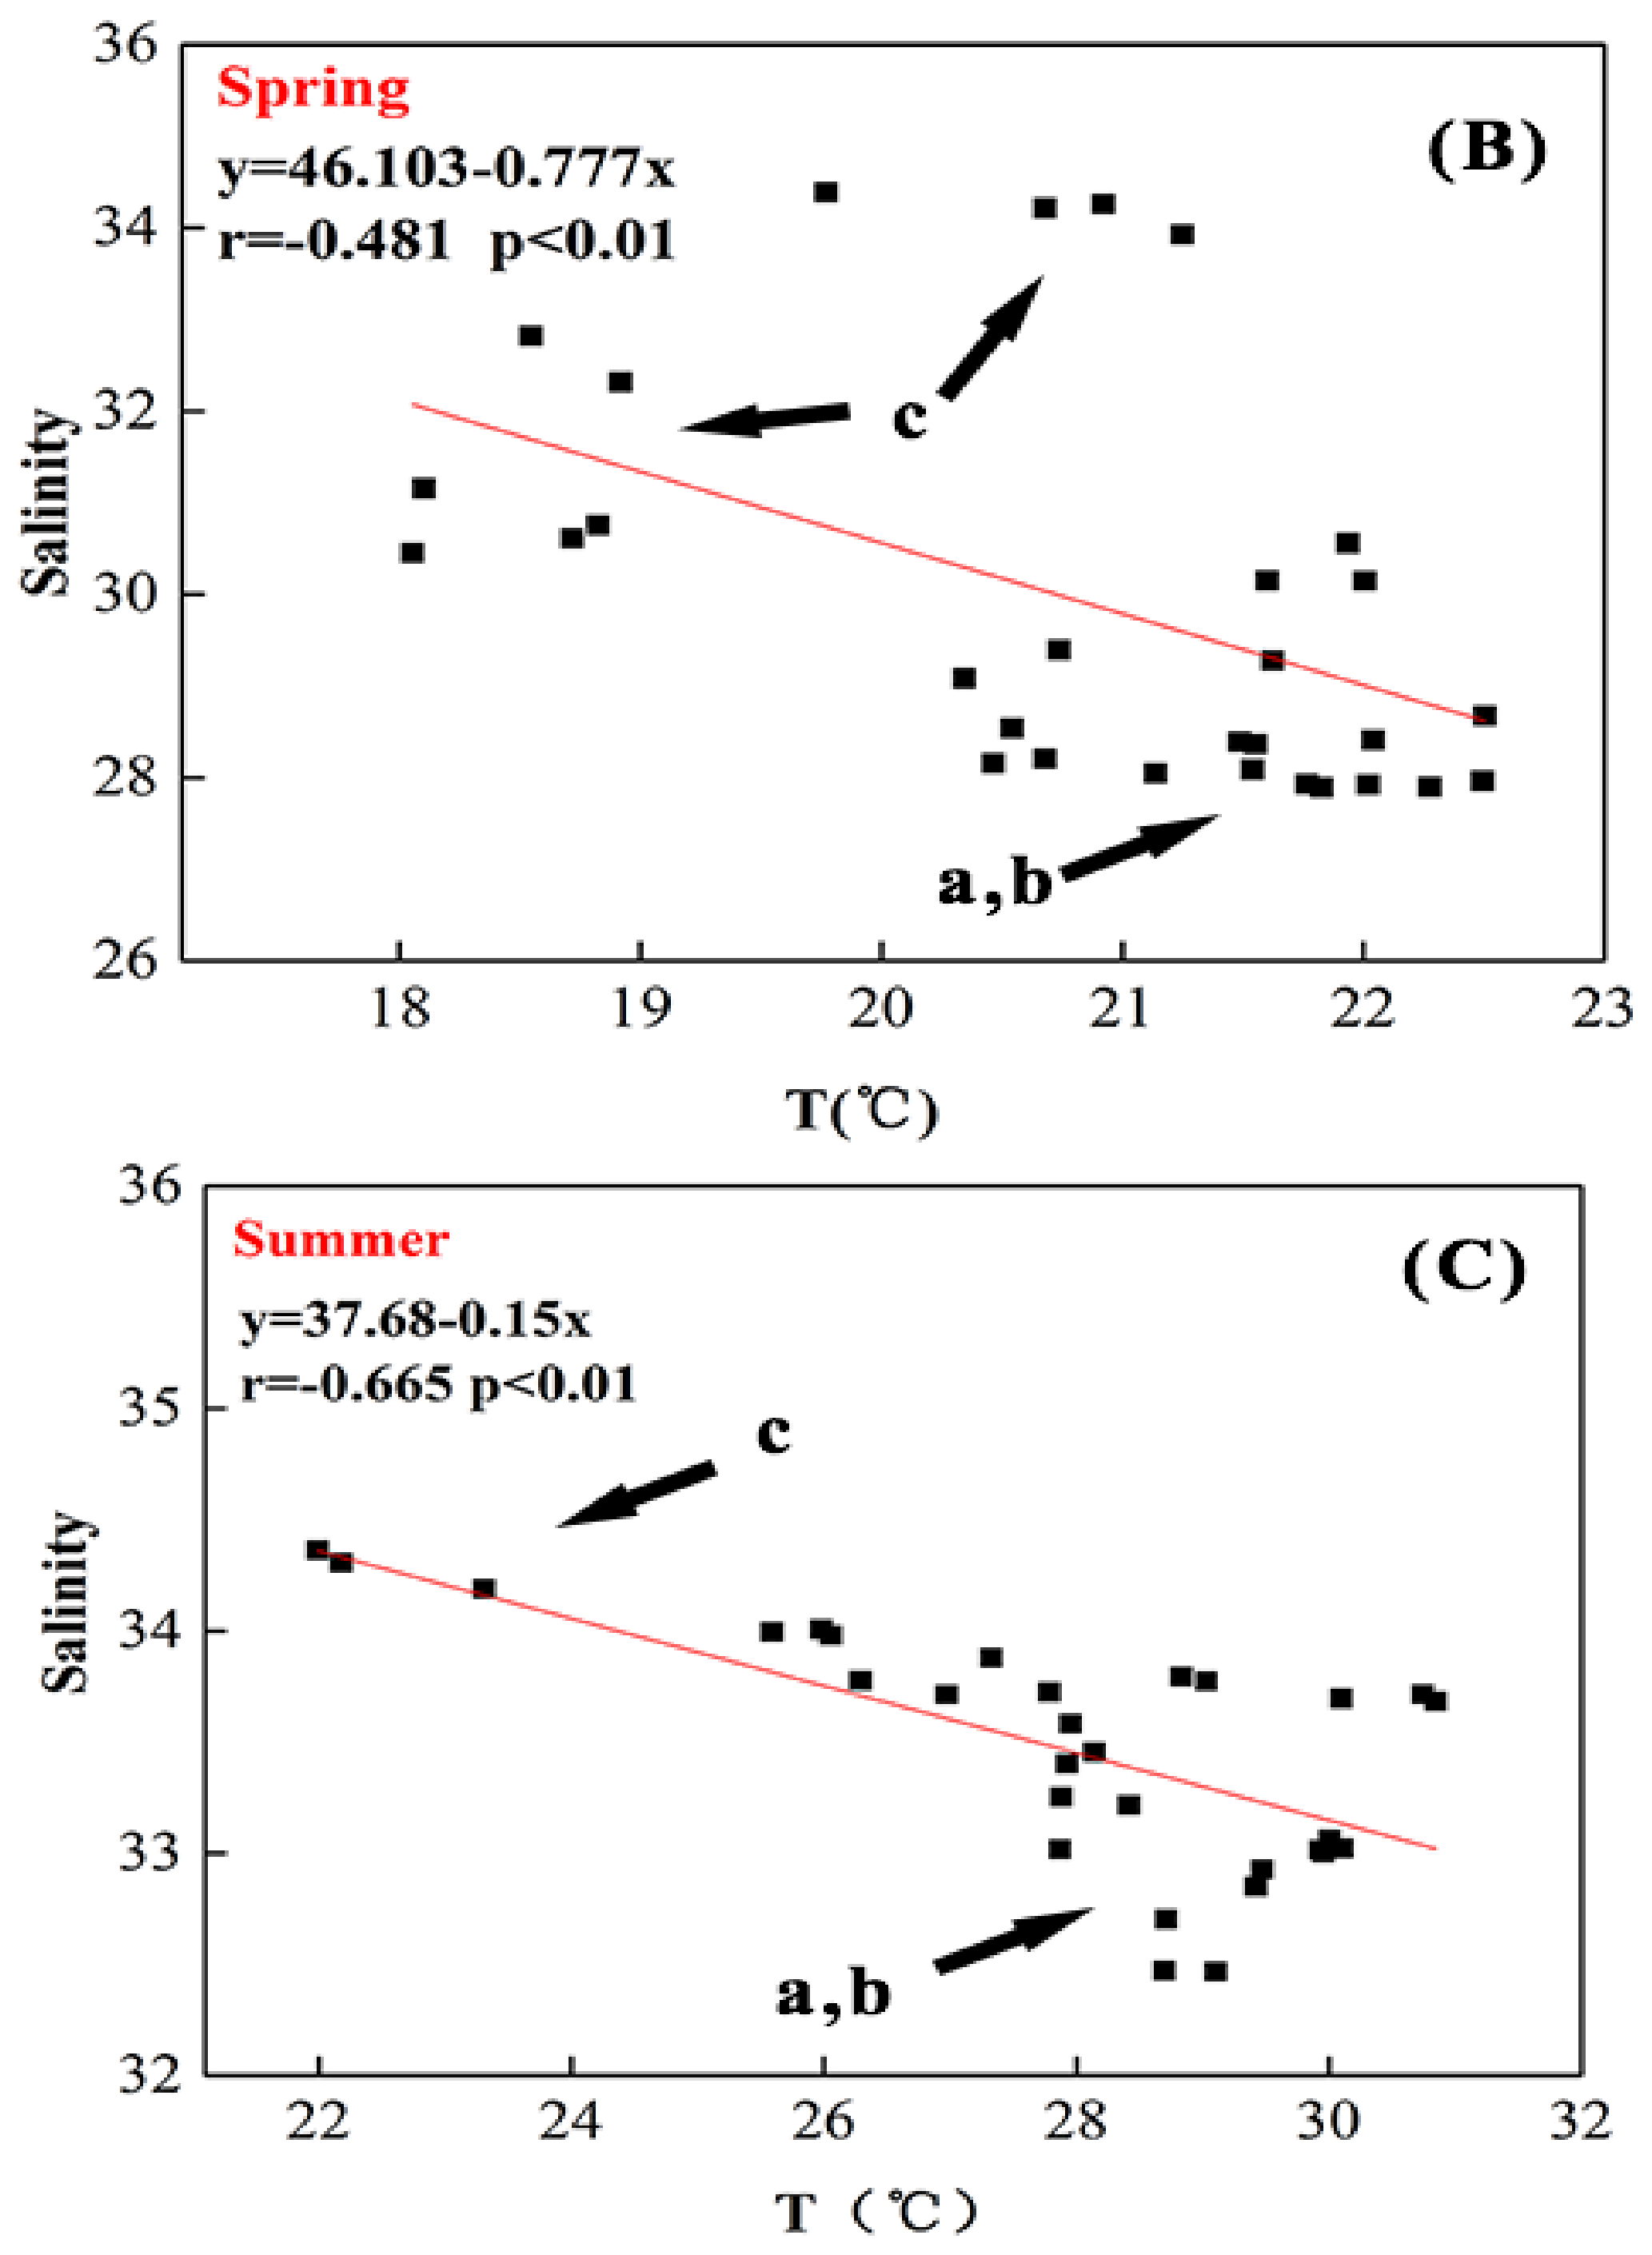
3.1. Temperature and Salinity

The lowest temperature appeared at surface in winter (9.70–12.78 °C), as with salinity (24.78–29.34) (Figure 2A). In spring, the temperature and salinity at the surface were 20.35–22.51 °C and 27.89–30.56, whereas those at the bottom were 18.06–22.02 °C and 27.92–34.39, respectively (Figure 2B). In summer, the seawater became warmer (surface: 27.32–30.84 °C; bottom: 21.99–30.74 °C), while the salinity is obviously lower at the surface (32.47–33.88) compared with bottom (32.47–34.36) (Figure 2C).

3.2. Concentrations of Nutrients

The concentrations of nutrients varied widely in different seasons, which were summarized in Table 1. It was not difficult to find that the highest and lowest concentrations of nutrients appeared in spring, and the concentrations of nutrients in the surface layer varied much more than that in the bottom layer.

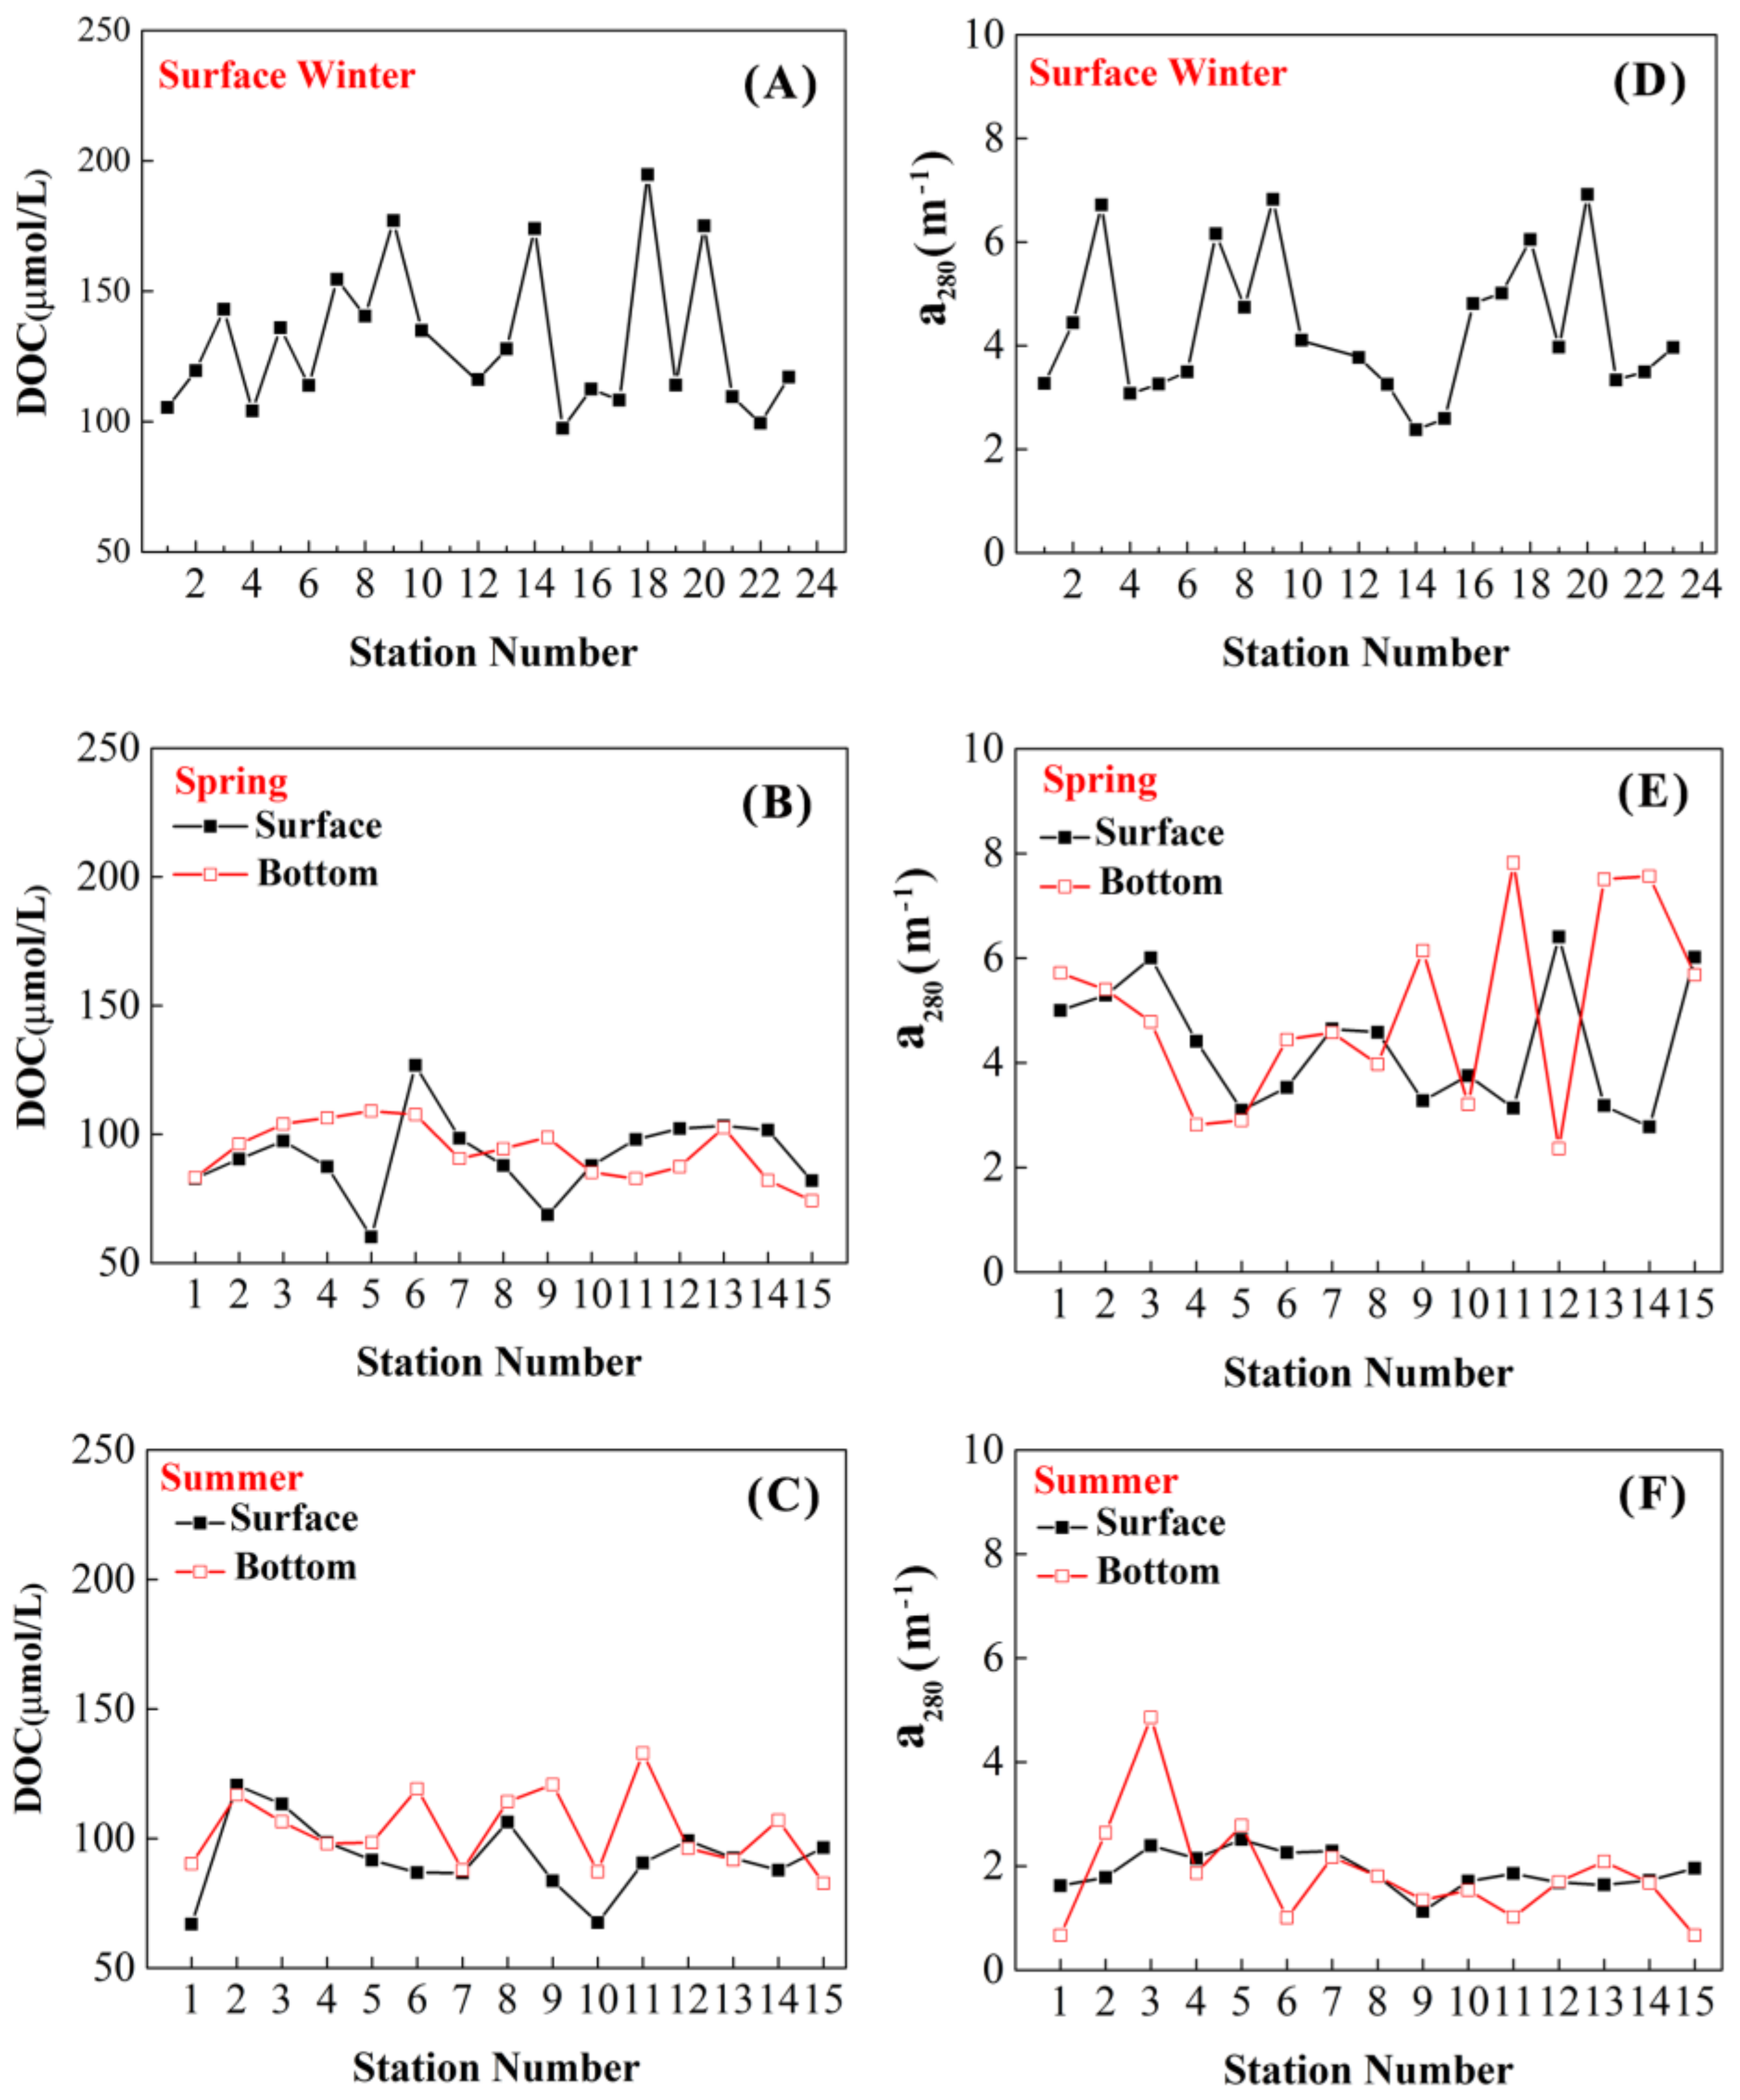
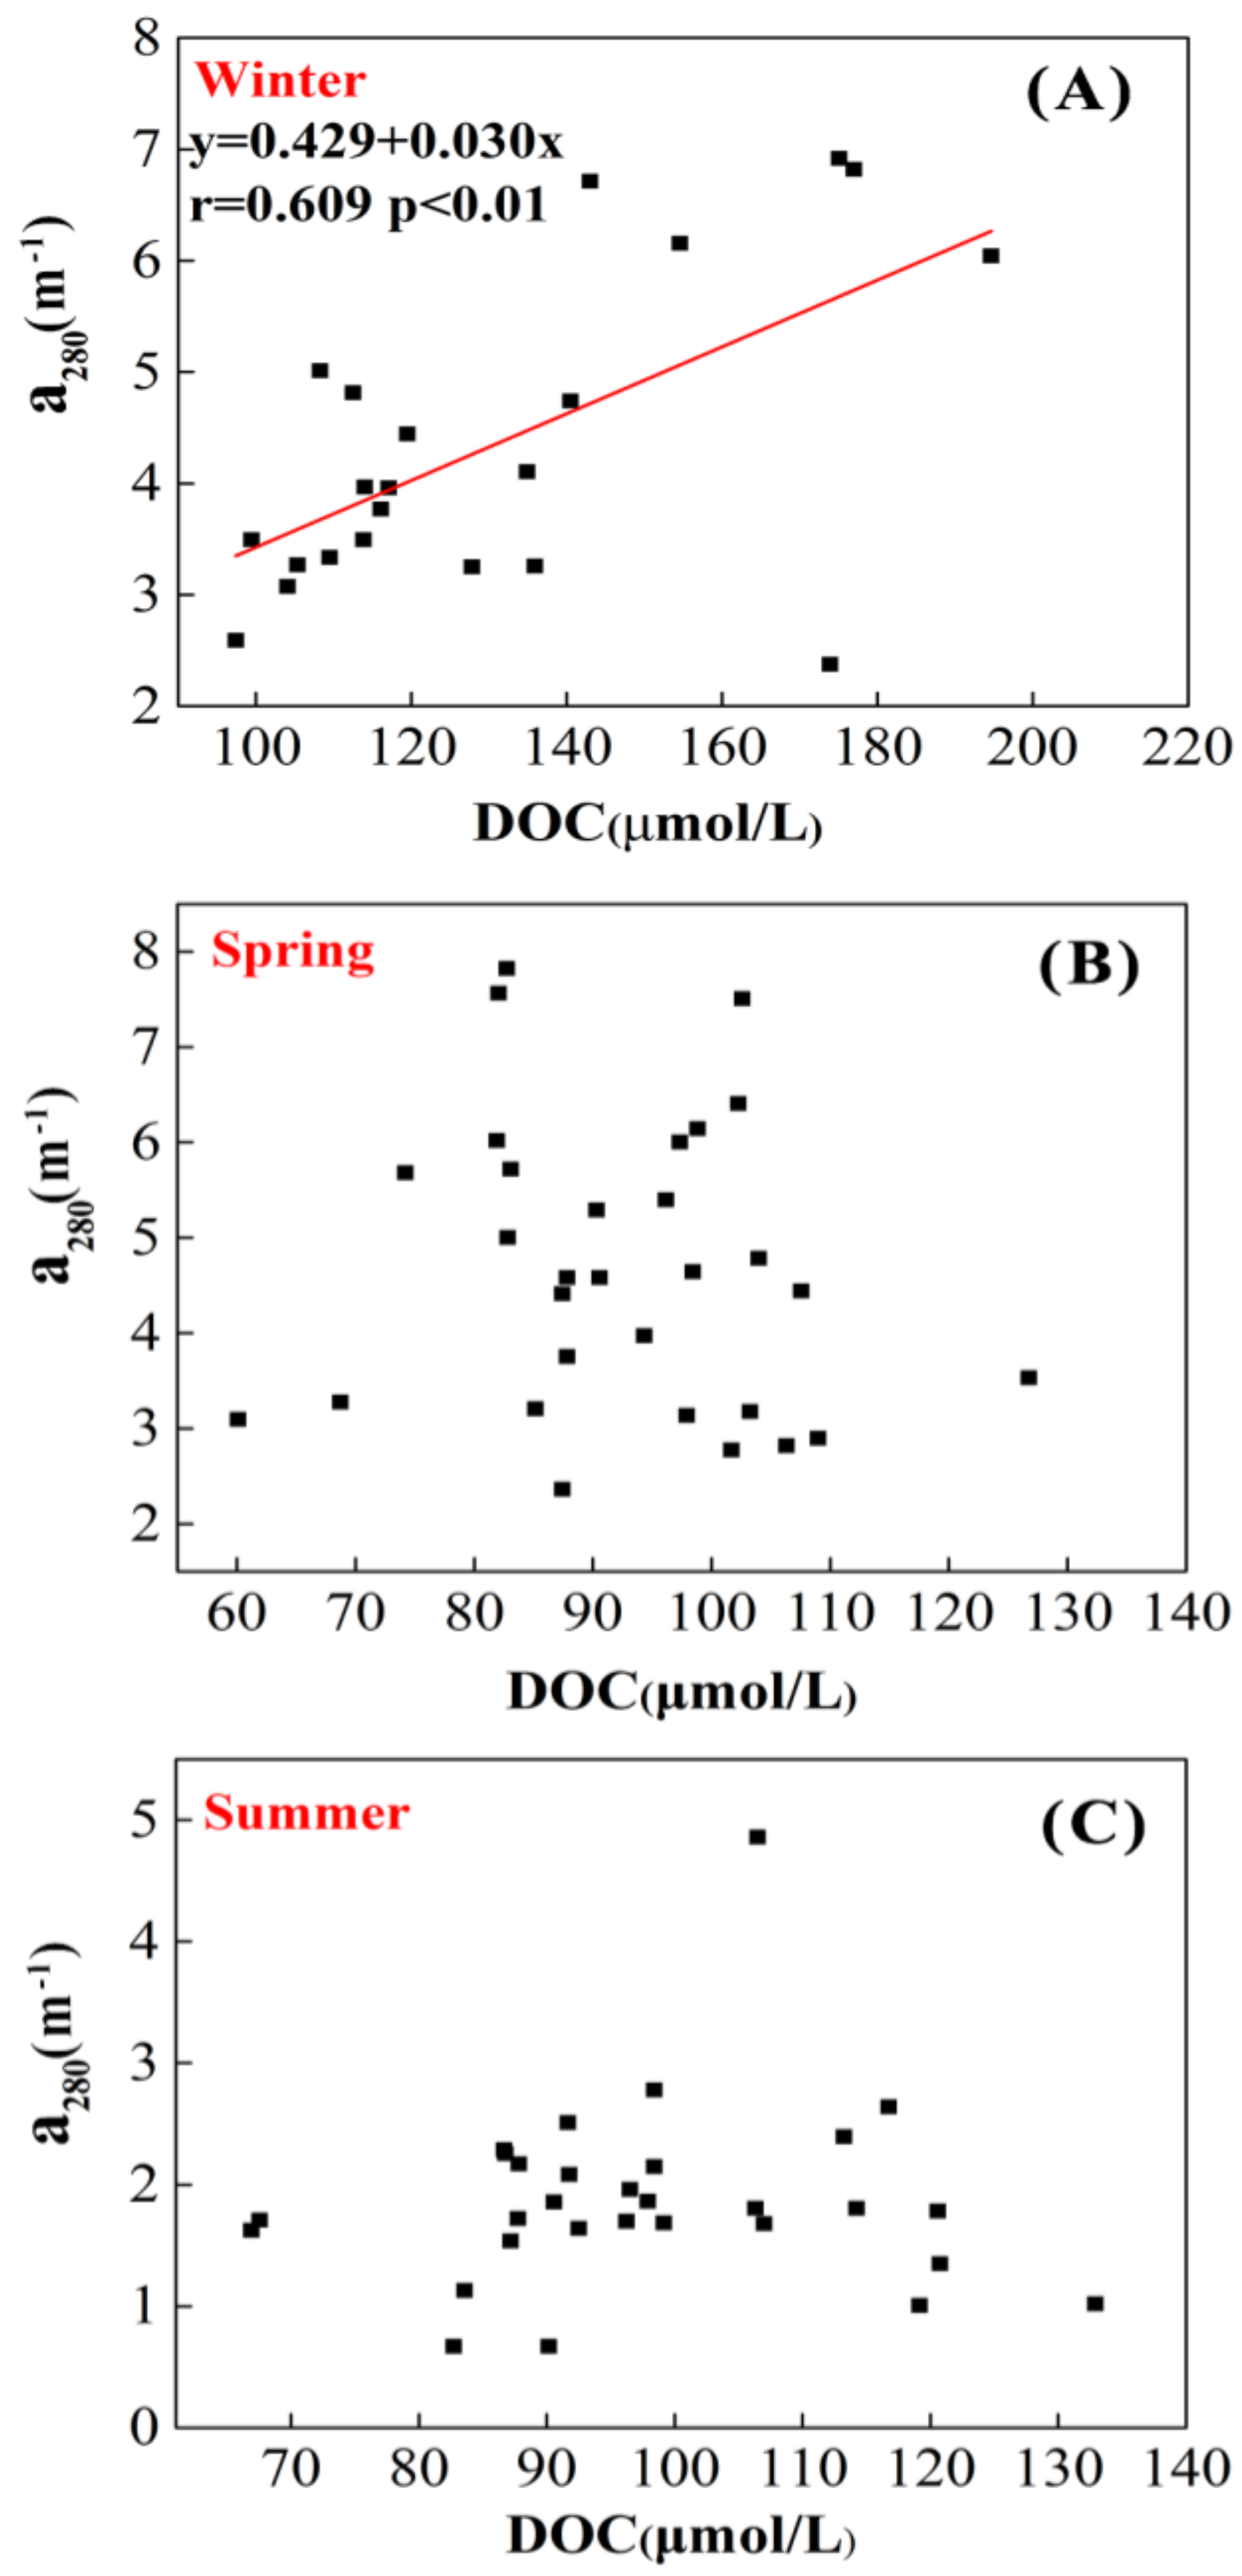
3.3. DOC and Absorption Coefficient

The highest concentration of DOC was found at surface in winter, ranging from 97.42 to 194.67 μmol/L (Figure 3A). In spring (Figure 3B), the concentrations of DOC decreased significantly at surface (60.11–126.75 μmol/L) with little fluctuation at bottom (74.20–109.00 μmol/L); whereas there were no obvious changes between surface (66.91–120.58 μmol/L) and bottom (80.73–132.92 μmol/L) in summer (Figure 3C). On the other hand, the values of a280 showed a significant reduction in summer (surface: 1.13–2.51 m−1, bottom: 0.67–4.86 m−1) relative to the calculated results of a280 in spring (surface: 2.77–6.41 m−1, bottom: 2.36–7.82 m−1) (Figure 3E, F). Besides this, the values of a280 at surface varied from 2.37 to 7.68 m−1 in winter (Figure 3D).

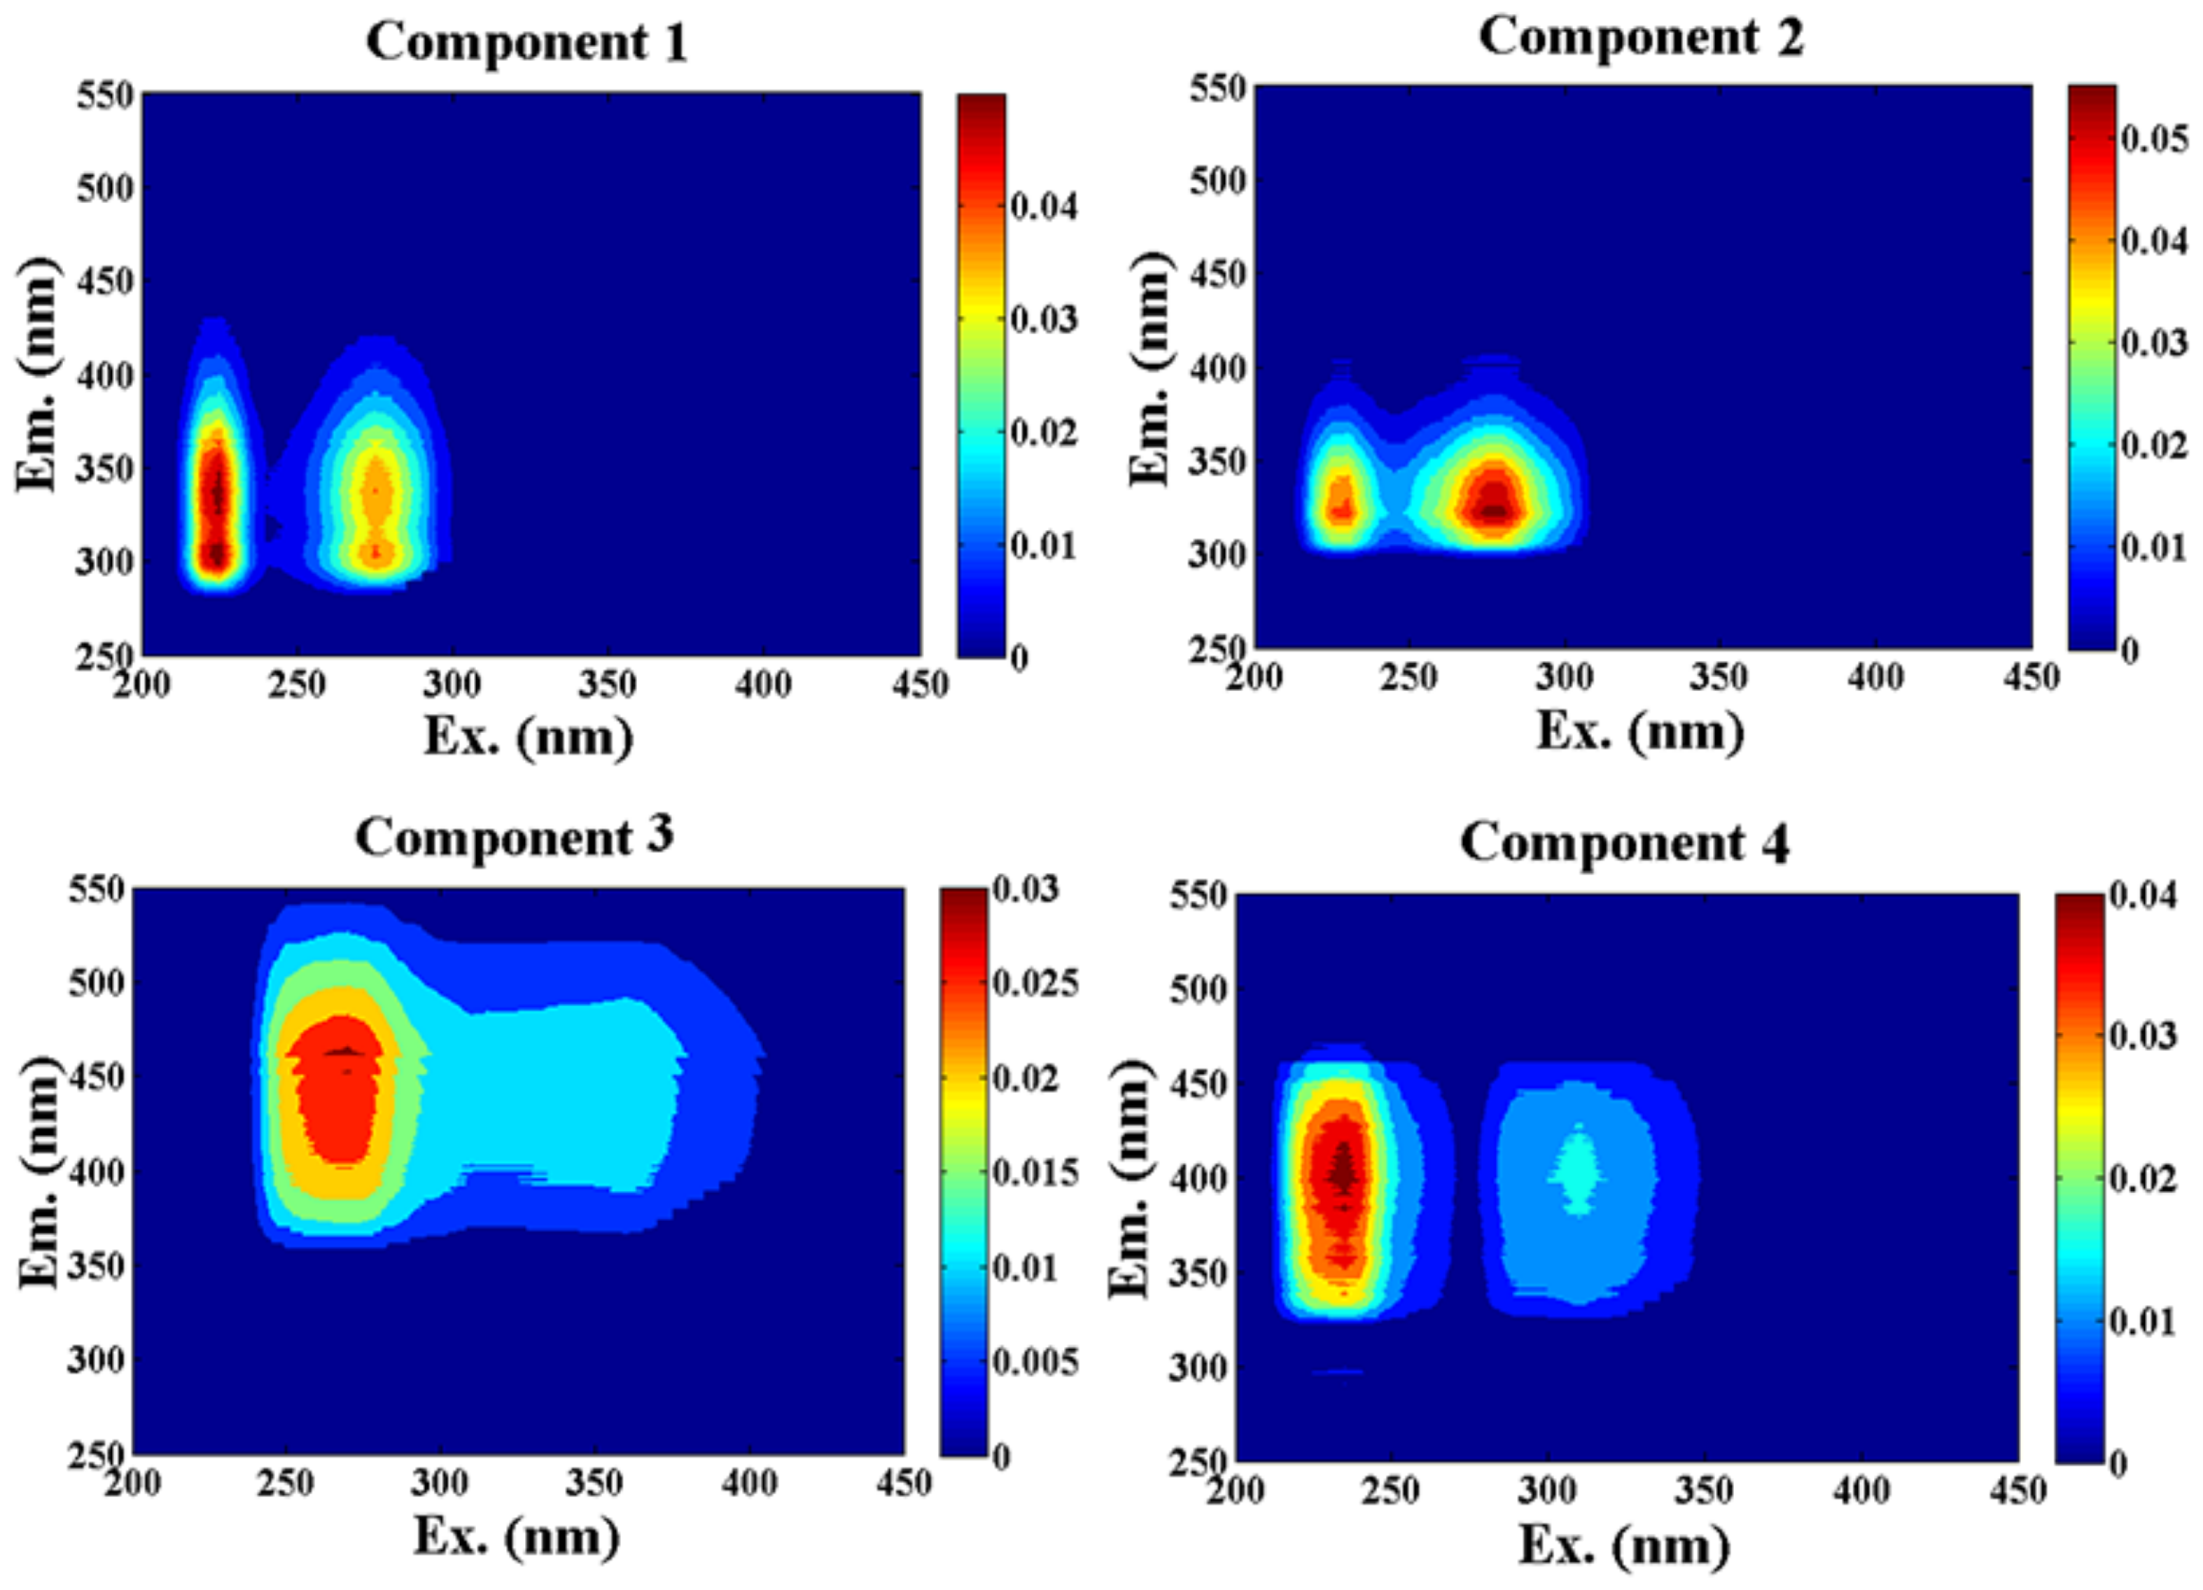
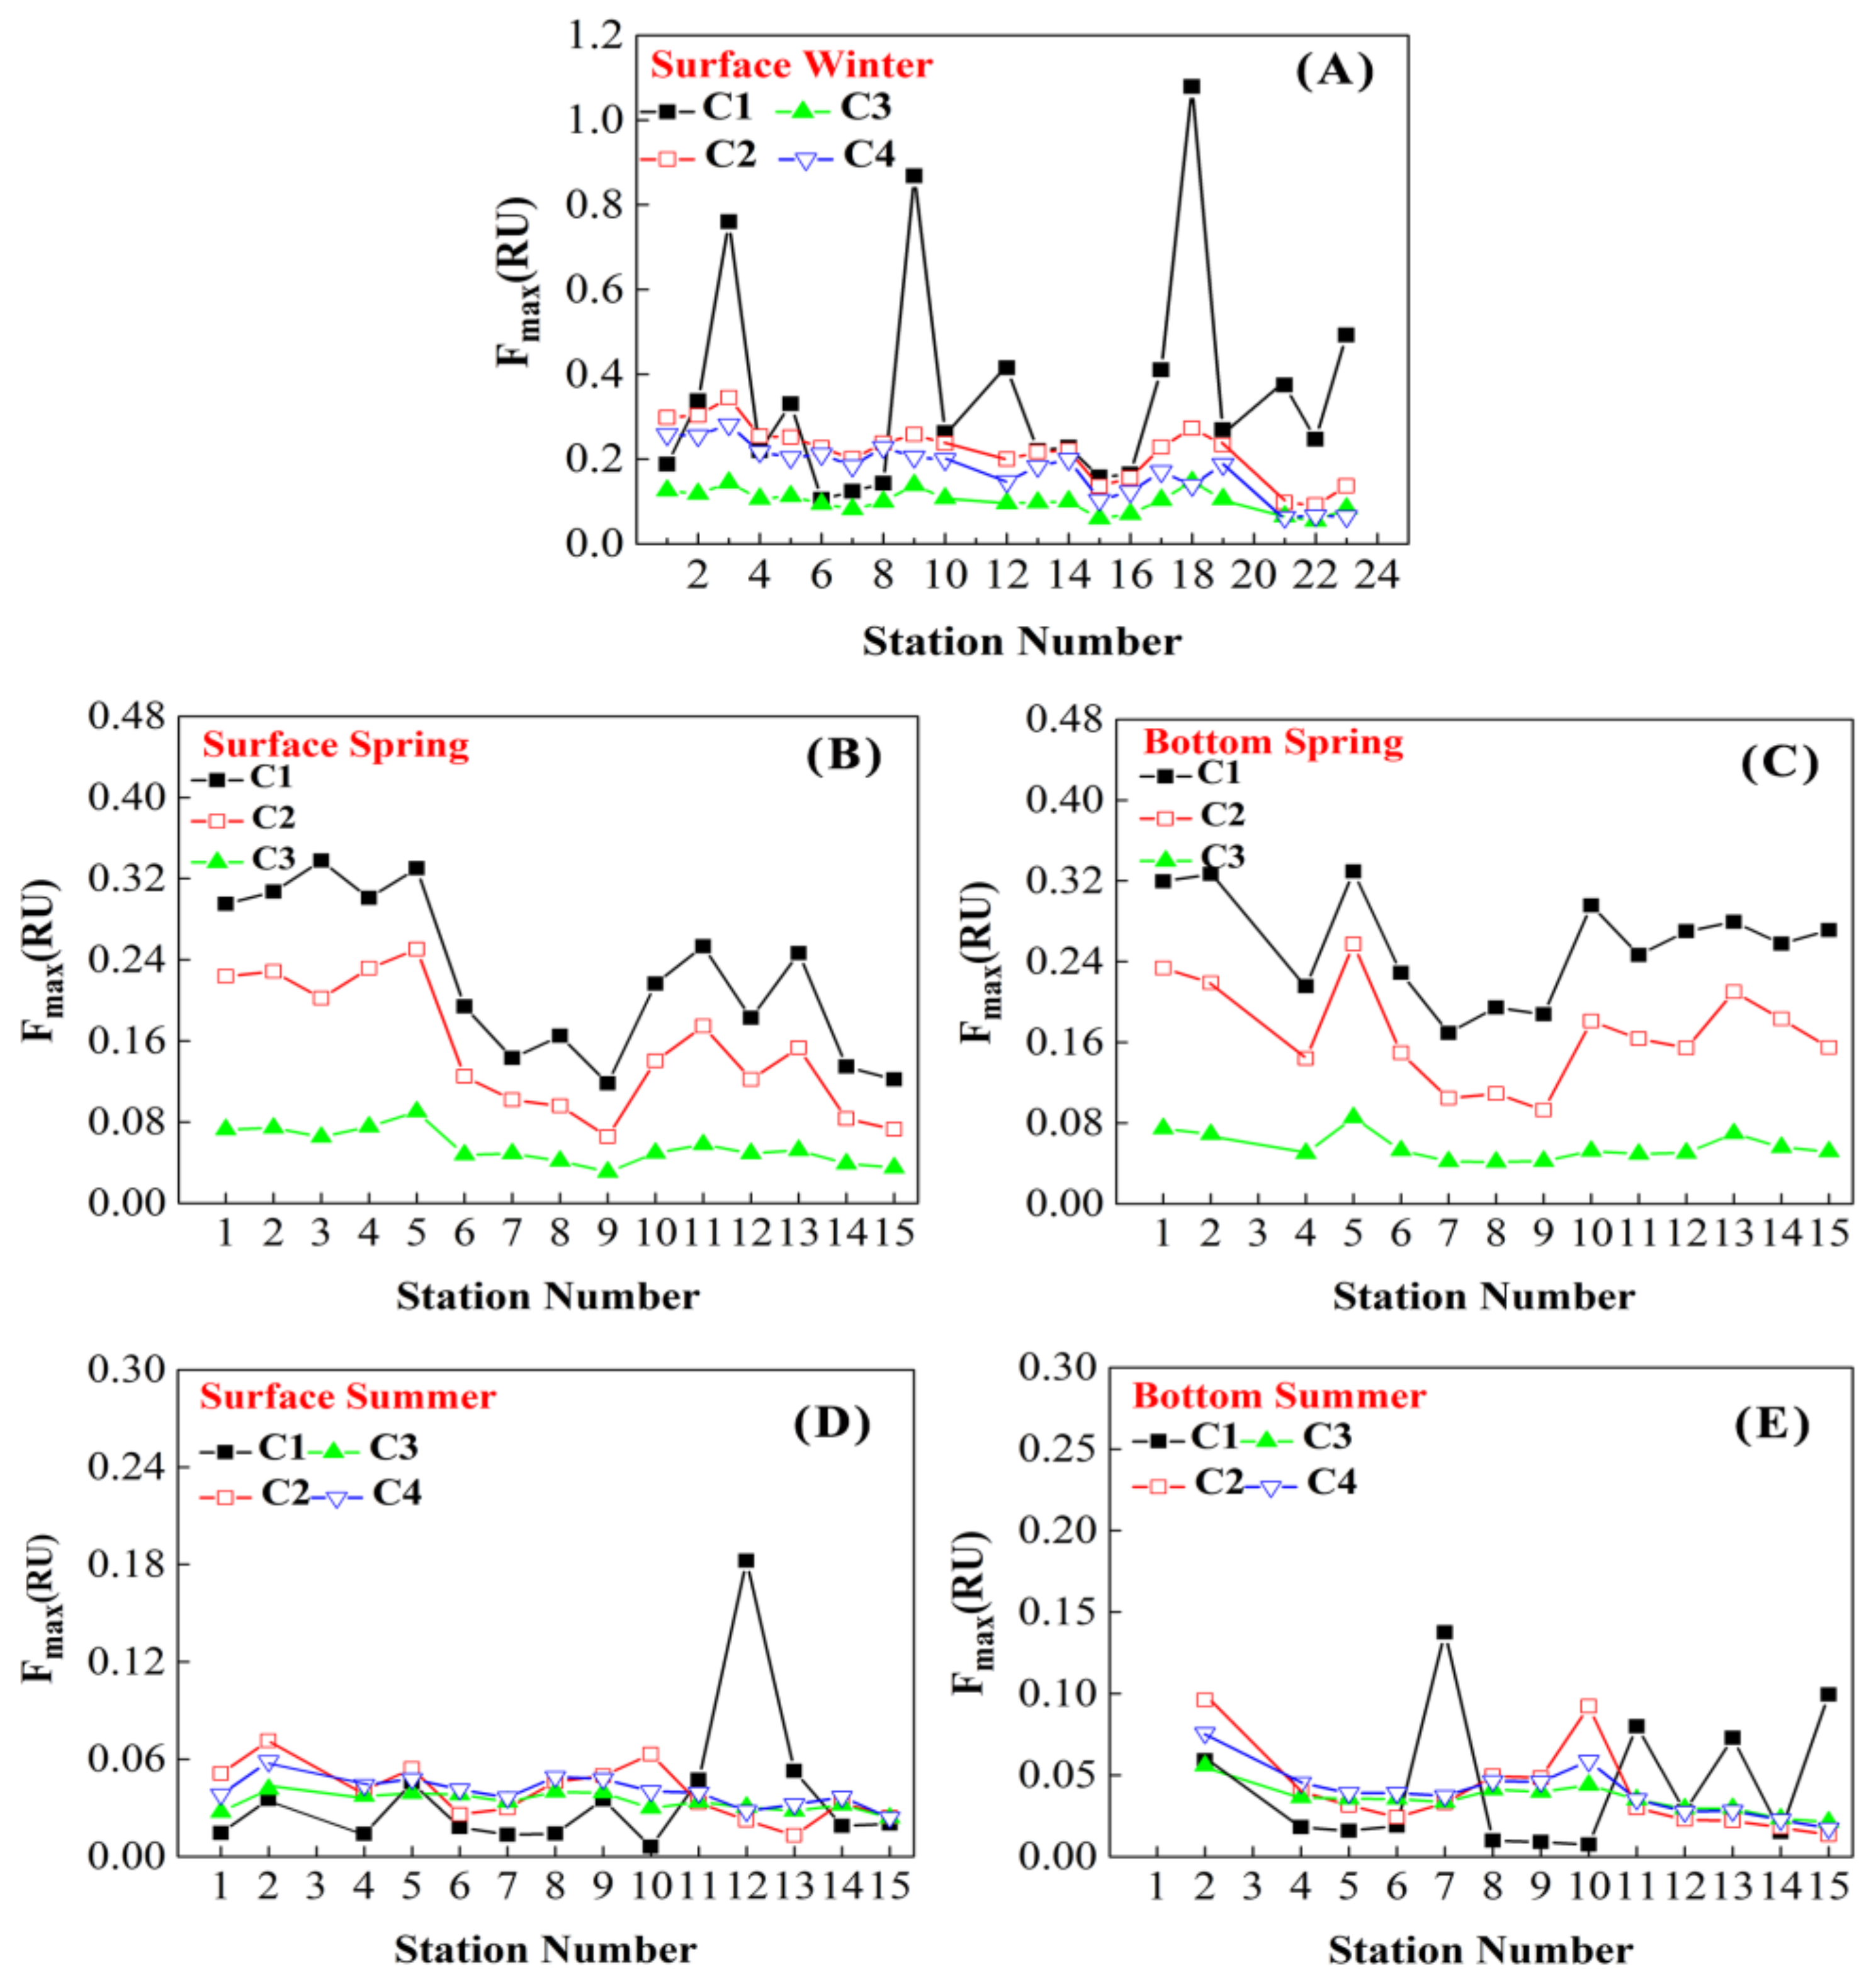
3.4. PARAFAC Components

All of the fluorescent components were identified by the PARAFAC model. As was shown in Table 2, there were three tryptophan-like components (C1, C2 and C4) which corresponded to peak T [18] and one humic-like component (C3) nearing peak A [17] in winter. In summer, two tryptophan-like components (C1 and C2, peak T), a humic-like component (C3, peak A), and one complex component C4 with two humic-like components (peak A and M [18]) were detected. Compared to winter, only three fluorescent components were found in spring. C1, C2 and C3 in spring were similar to those in winter. It is worth noting that the C2 in spring also consisted of one humic-like component (peak M).

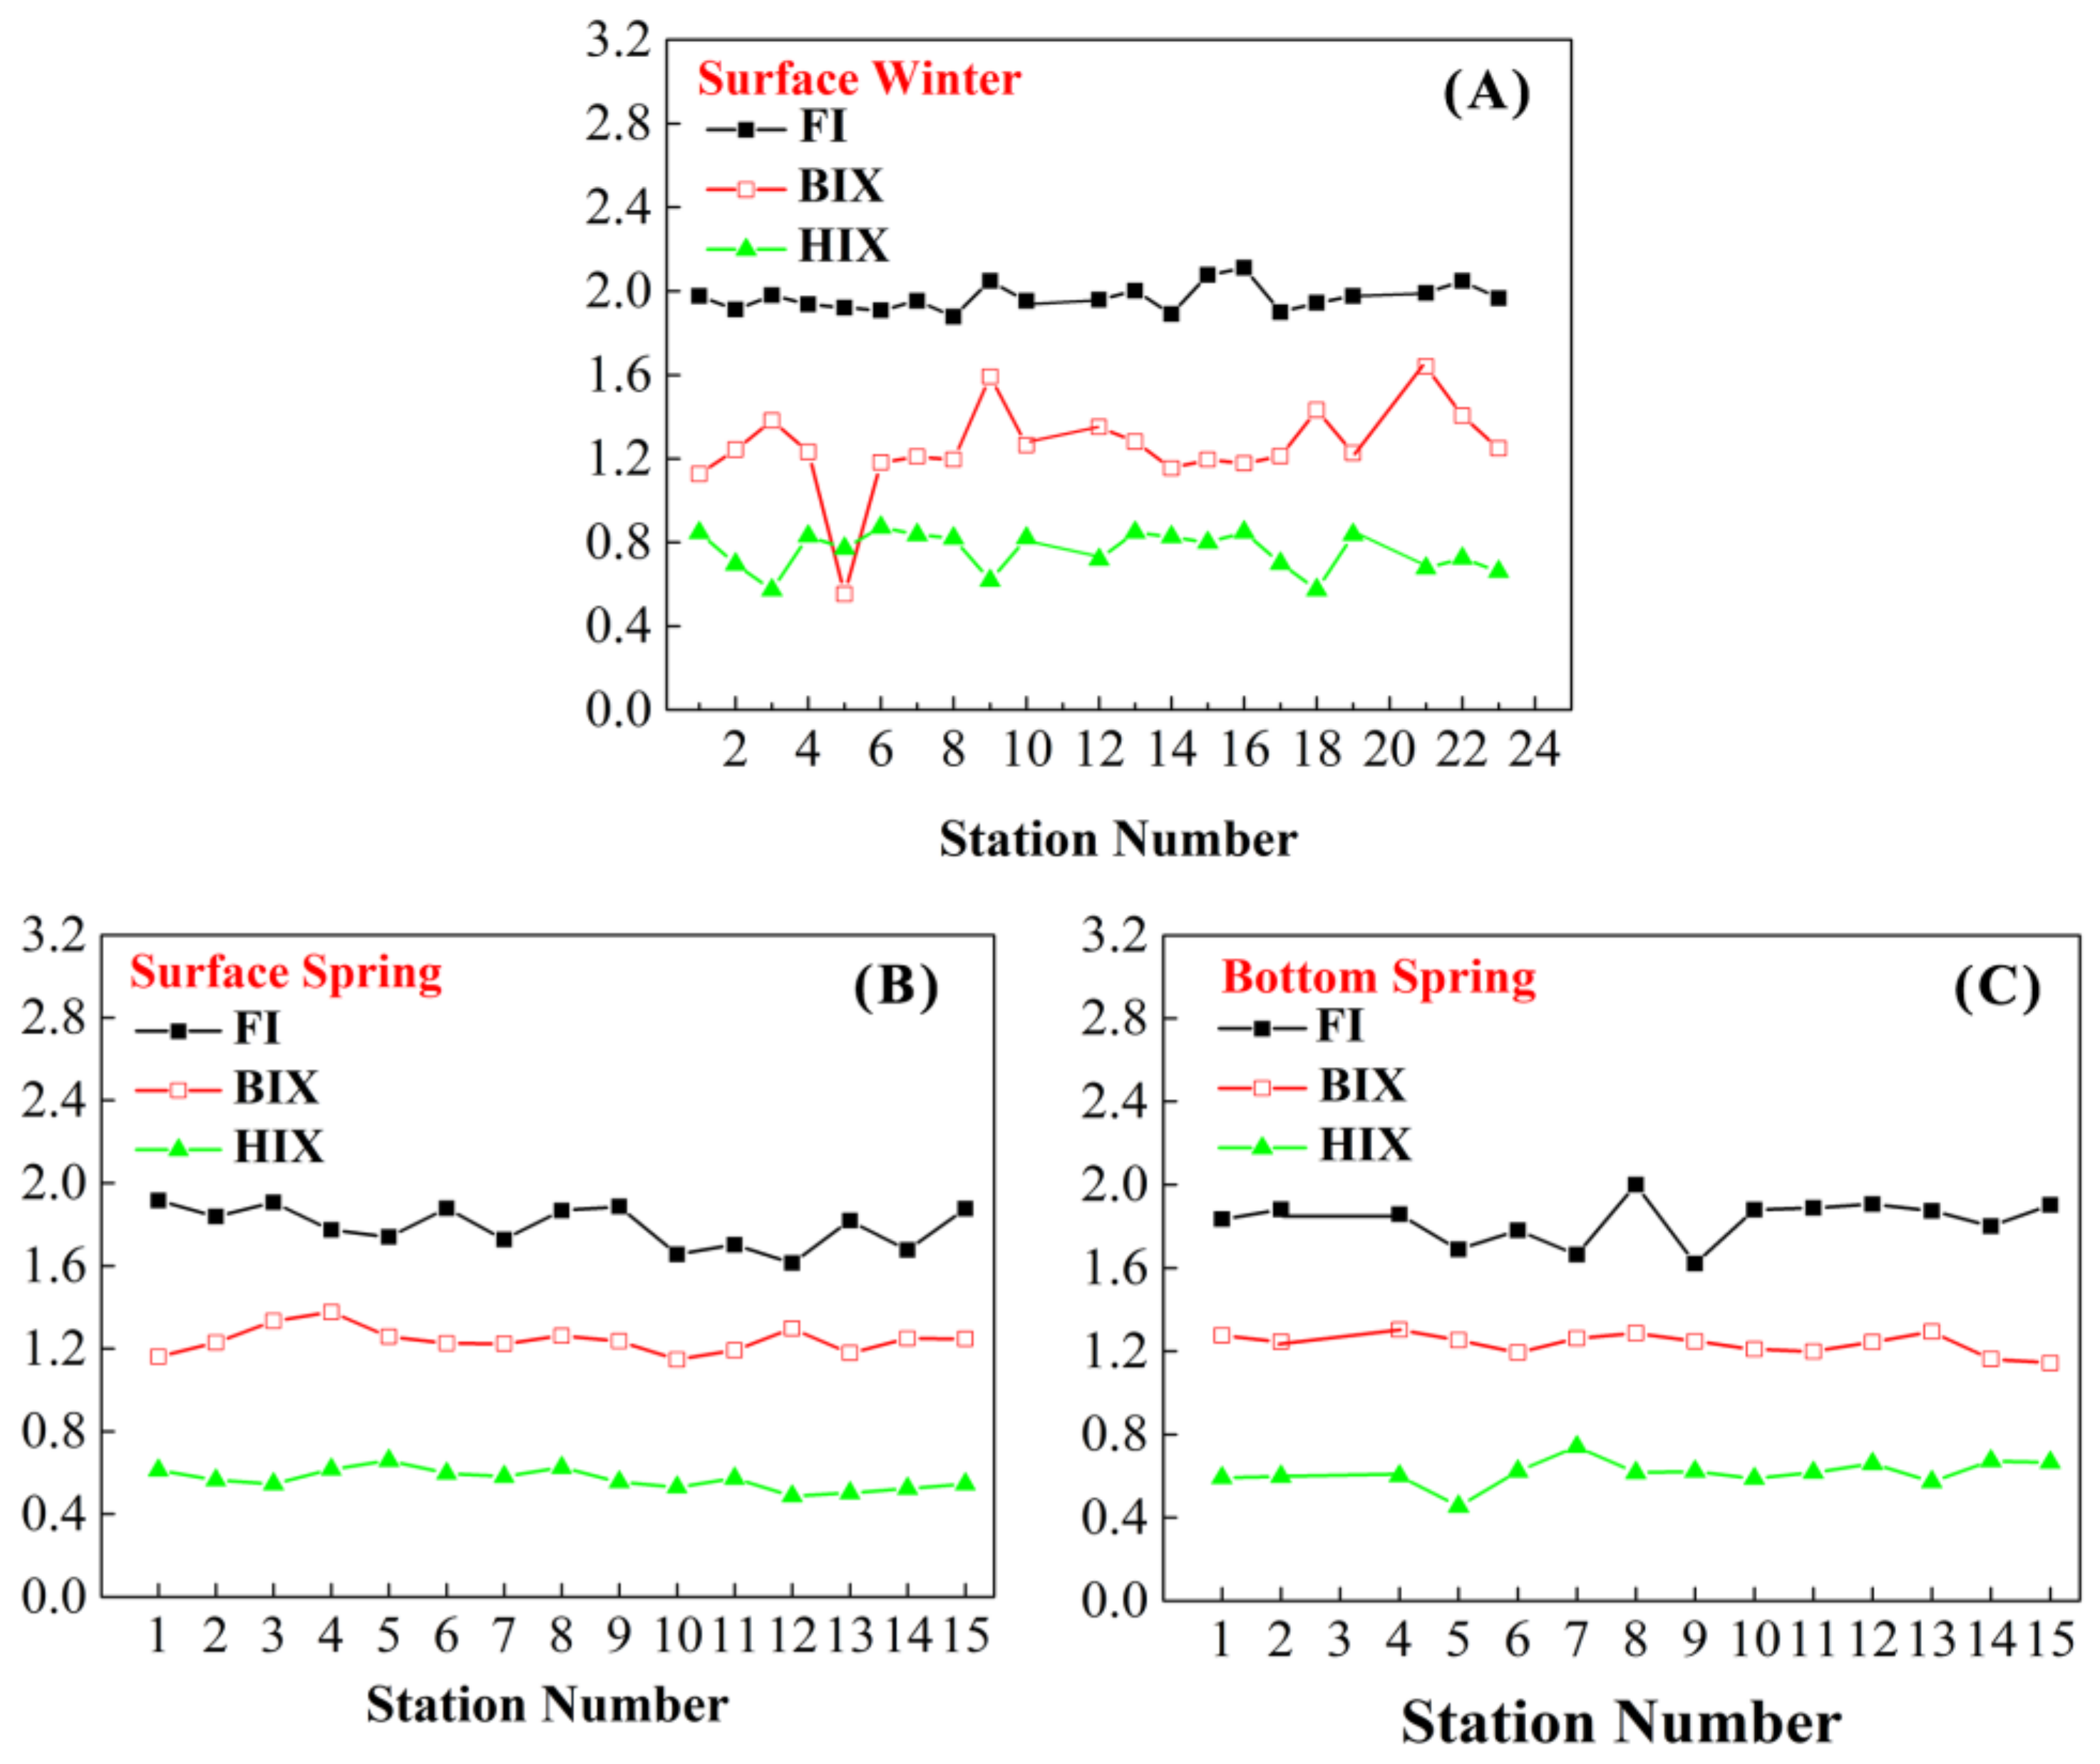
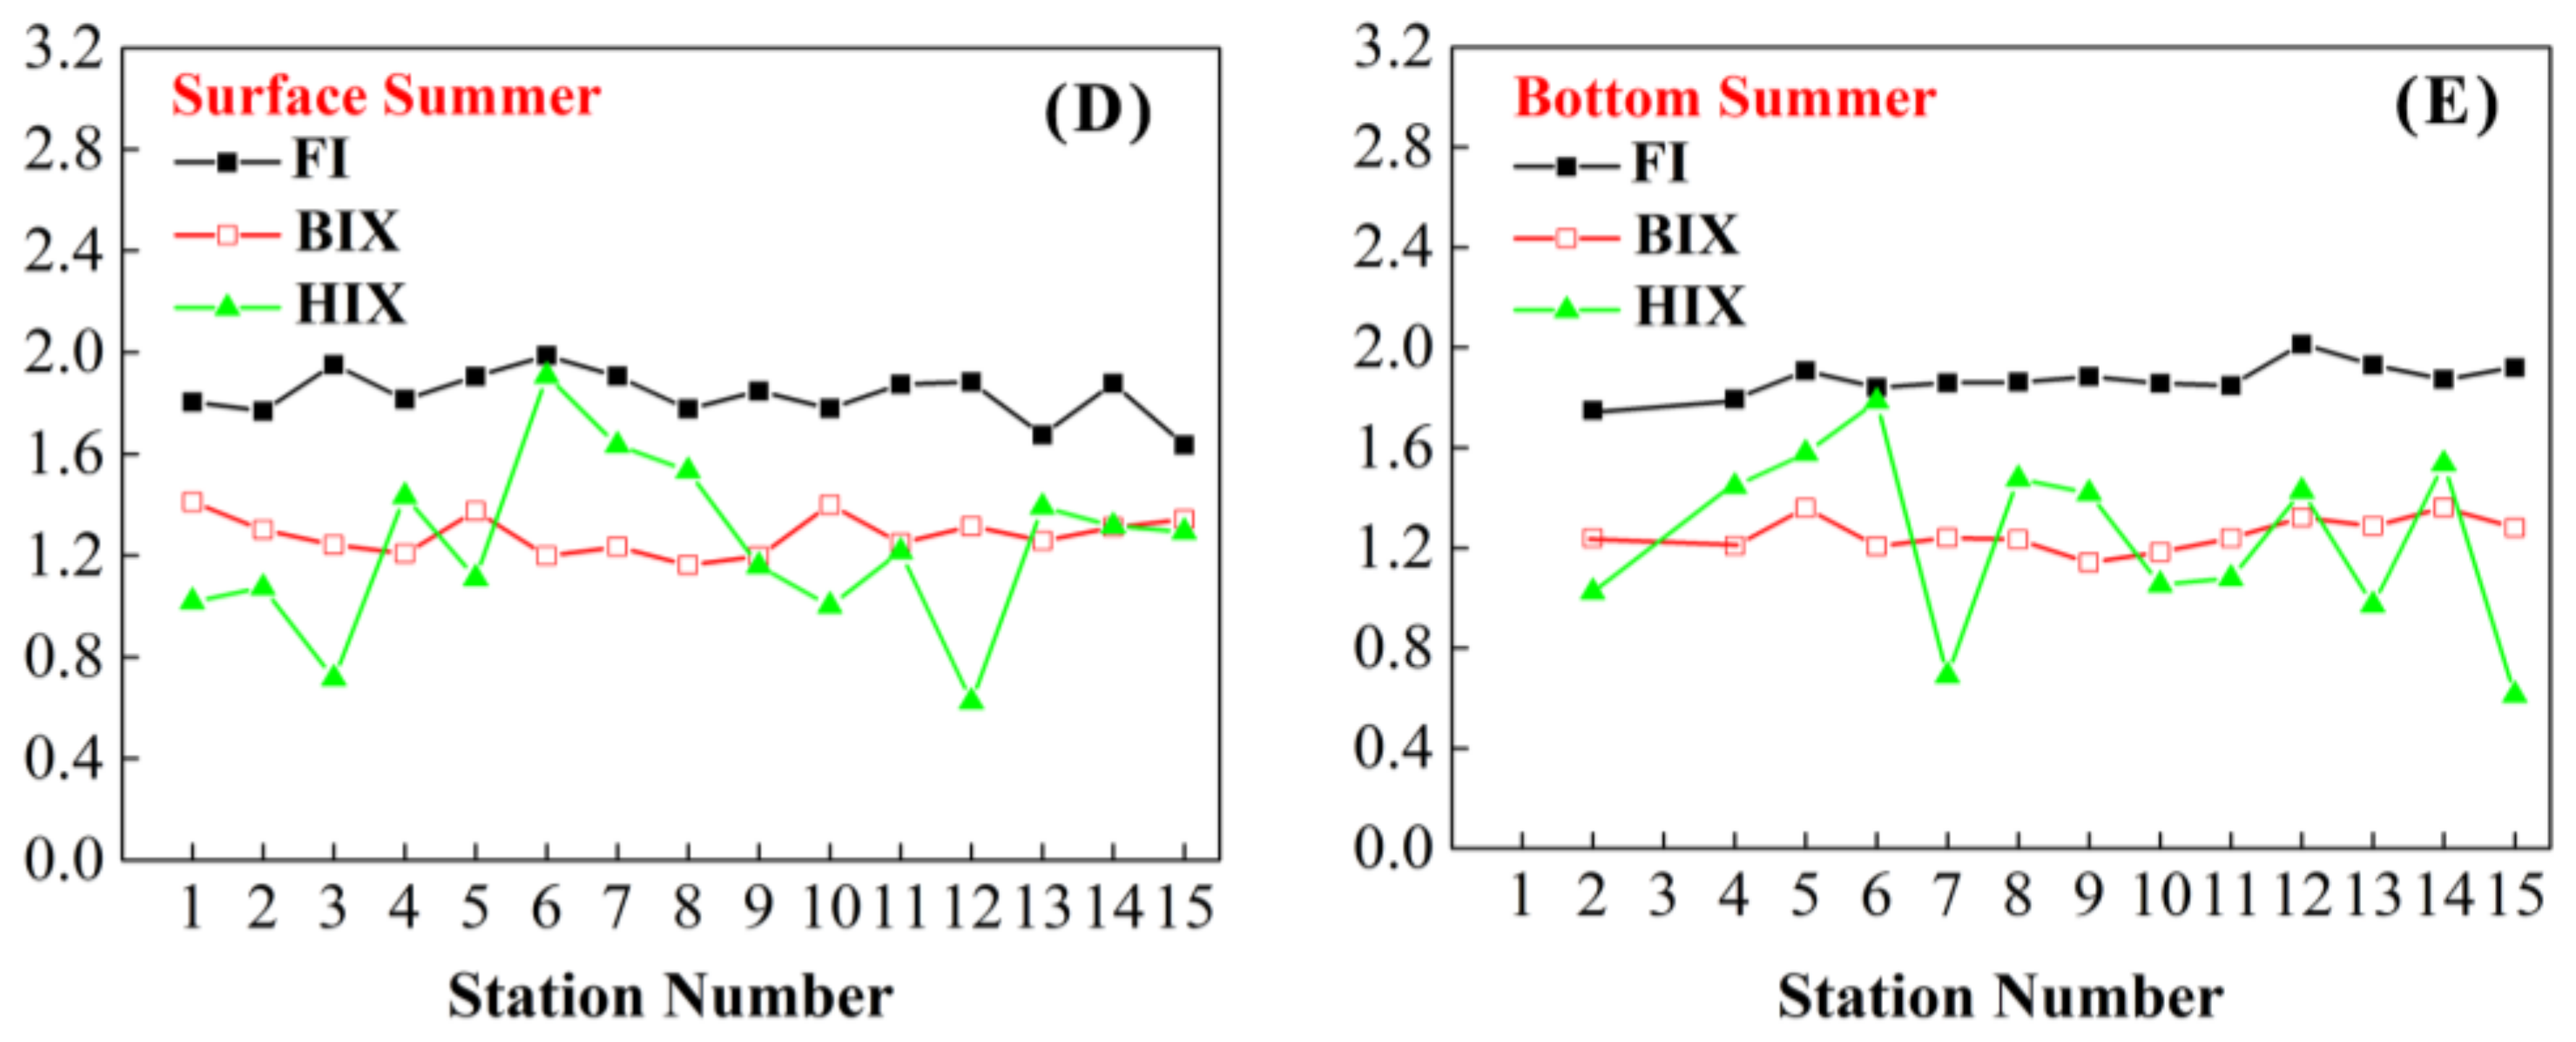
3.5. FI, BIX and HIX

The values of FI were calculated in winter (surface: 1.88–2.11), spring (surface: 1.61–1.92; bottom: 1.62–2.00) and summer (surface: 1.64–1.99; bottom: 1.75–2.01), respectively (Figure 4). All of the values of BIX were above 1.00 except for one abnormal point (winter: station 5). The values of HIX, which showed obvious fluctuations at surface (0.62–1.91) and bottom (0.61–1.79) in summer, were less than 1.00 in winter (surface: 0.57–0.87) and spring (surface: 0.49–0.66; bottom: 0.45–0.74).

4. Discussion

4.1. Seasonal Variations of Temperature and Salinity

Temperature–salinity diagrams in different seasons were used to identify the source of seawater. As was shown in Figure 5A, there was a strong positive correlation between temperature and salinity in winter. However, the measured results in spring and summer were negatively correlated (Figure 5B,C). The results implied that three end members including coastal-current water from the Changjiang River (low temperature and low salinity), mixed water in the shelf area (low temperature and low salinity) and the Taiwan Strait water (high temperature and high salinity) might be mixed. Furthermore, coastal-current water in the three sections was dominant because of the prevailing northeast monsoon in winter [49,50]. In spring and summer, the temperature of coastal-current water, which probably was affected by the warming of the mainland, was higher than that of mixed water in the shelf area, and the temperature of the Taiwan Strait water was relatively low. The correlation was stronger in summer and the vital factor might be the Taiwan Strait water under the influence of strong southwest monsoon [51]. The above hypothesis was consistent with the the previous reported results at this area [49,50]. The seasonal variations of the correlation between temperature and salinity were similar to that of the Taiwan strait [52].

4.2. Seasonal Variations of DOC and Absorption Coefficient

The concentrations of DOC (97.42–194.67 μmol/L) in the study area were comparable with those measured in the winter for the ECS (96.17–129.50 μmol/L, [35]) while DOC concentrations was 66.91–120.58 μmol/L in summer (54.8–176 μmol/L, [34]; 54.4–143.7 μmol/L [53]) and DOC concentrations was 60.11–126.75 μmol/L in spring (41.7–126.2 μmol/L, [33]; 95 μmol/L, [36]). Overall, the DOC concentrations based on our observations in the surface water were higher at the nearshore stations than at the offshore stations. However, additional statistical data are required before this can be confirmed. The various sources with different DOC concentrations were mixed in the study area, and there is a suggestion of invasion of the Changjiang River water masses with high DOC concentrations (average value: 130.66 μmol/L) under the strong northeast monsoon [50,54]. Besides, the existence of fish farms near the area, DOM desorption [55] could also result in the increase of DOC concentrations. In summer low DOC concentrations (average value: 97.93 μmol/L) might be due to the input of the Taiwan Strait water under the southwest monsoon. The results indicated that DOC in the present study area exhibited a conservative trend, which was consistent with the seasonal variations of temperature and salinity. The distribution of DOC in the ECS was variable with seasons, and the water masses mixing played an important role in controlling DOC distribution.
There was variable seasonal relationship between DOC and CDOM during winter, spring, and summer. In winter, it was not difficult to find that a280 was correlated positively with the concentrations of DOC (Figure 6A), which also could be found at the Changjiang River estuary [43] and some other areas [53], indicating that CDOM was an important component of the DOC, and they probably had some common mechanisms for controlling their distributions. However, the lack of relationship between DOC and a280 in the spring and summer implied that the CDOM is not a constant component of DOC and could not be the only dominating factor for the variation of DOC (Figure 6B,C). The primary factor contributing to the fluctuating correlation may be the various sources of DOC. In other words, non-colored dissolved organic matter was a part of the labile DOC and had a vital influence on the distribution of CDOM [56]. The relationship between DOC and a280 is susceptible to the change of environmental factors. In the summer, the mixing of water masses is obviously different from that in the winter. CDOM might be degraded by photochemical processes and microbial activities resulting in some non-absorbing CDOM under intense light [57]. It can be seen from comparing the a280 and DOC of different seasons that the Changjiang River waters may be responsible for the increased a280 and DOC in the winter.

4.3. Analysis of Seasonal Changes in CDOM

EEMs was applied to identify the components and source of DOM. In winter, four individual fluorescent components had been identified in our study area using EEMs combined with PARAFAC (Figure 7 and Figure 8). C1, C2 and C4 are three tryptophan-like components and were probably of terrestrial origin, and similar components had been found in the Changjiang River estuary [34,44,57,58,59]. Besides, one humic-like component, C3, was also identified during winter. Obviously, the humic-like component C4, named as peak M according to Coble [18], existed in summer, and three other components, C1, C2, and C3, were similar to those in winter. The humic-like component C4 (peak M) was related to high biological activity [18] and might represent an increase of seawater input in summer. In spring, besides a tryptophan-like component (C1) and one humic-like component (C3), the component C2 covering the peaks T and peak M was also found at this area. The results suggested that the components of water masses in the study area varied with the changes of seasons, and was consistent with the above idea.
Obviously, the intensities of protein-like components (C1, C2 and C4) were higher in the winter than in the summer in this study area (Figure 9). Terrigenous input might explain the results, since the Changjiang River has a significant influence on the distribution of CDOM in the ECS [59]. In addition, probably due to the heavy wind and the synergistic effects by wind and tide in winter, sediment resuspension and desorption of DOM in this study area are also noteworthy factors. However, photochemical degradation in summer is easy to occur under intense light condition owing to the special photochemical properties of CDOM, and the active organic matter could be utilized by microorganisms [58]. Furthermore, an increase in salinity in this study area could account for the invasion of the Taiwan Strait water with low CDOM in summer. Meanwhile, the strengthening of DOM flocculation and sorption could raise the transparency of seawater. All of these factors probably resulted in the decrease of fluorescence intensity. A similar situation appeared in the North Aegean Sea due to photodegradation and sedimentary processes [60]. Compared to the winter, fluorescence intensity of spring showed a little reduction (Figure 9B,C), that may be due to the weak invasion of fresh seawater.
Besides this, in winter, most of the values of FI were over 1.9, which showed that the process of microbial metabolism probably was a vital source of CDOM production [42]. However, it had some decreases in the spring and summer, indicating the changes of microbial activities. The BIX values, which were more than 1.0 in these three seasons, corresponded to the source of microbial metabolism [40]. Although the values of HIX had obvious changes in summer, all of them were less than 4.0, which indicated the CDOM might had close association with autochthonous DOM [41]. All of these projections were consistent with the distribution of CDOM fluorescence.

4.4. Correlations between Concentration of Nutrients and DOM Parameters

Correlations between nutrient concentrations and fluorescence intensities of DOM components in three seasons were presented in Table 3. The concentrations of N-(NO2 + NO3) and P-(PO43−) in the study area were correlated positively with fluorescence intensities of C2, C3 and C4 in all seasons, but correlation between the concentrations of Si-(SiO32−) and fluorescence intensities only appeared in summer and spring. These results indicated that both nutrients and DOM were covariant spatially and temporally. It is possible that nutrient concentrations could be affected by growth and metabolism of the plankton, and CDOM could be produced and degraded by phytoplankton. The decrease of CDOM fluorescence intensity might be partly due to decreasing the concentrations of nutrients [18,24]. Therefore, the fluorescence intensity of CDOM could reflect the trend of nutrients to some extent. DOM played important roles in carbon and nutrient cycling.

5. Conclusions

EEM spectroscopy was combined with PARAFAC to monitor the characteristics of fluorescent components and source and seasonal variations of CDOM in the study area of East China Sea, off southeast Zhejiang, in winter, spring and summer in 2017. The seawater in this study area probably had three sources: the Changjiang River water, mixed water in the shelf area and the Taiwan Strait water. The seasonal variations of CDOM were greatly influenced by the input of the three end members’ mixed water. Besides this, the sediment resuspension and desorption of CDOM in the winter and the photochemical degradation of CDOM in the summer could not be ignored. The highest concentration of DOC appeared in winter and a prominent reduction occurred in spring. The a280 and intensities of CDOM fluorescence components with the change of seasons were consistent with the variation trend of DOC, but there was no obvious linear relationship among them in spring and summer. The main reason might be that seasonal variations of DOC, a280 and fluorescent intensities of CDOM were subject to mixing of water, but any factor that influences the three parameters could also weaken their correlation. The relationships between intensities of CDOM fluorescence component and of nutrients concentrations determined during different seasons in the study area could be used to reflect changes of nutrients by using rapid and sensitive fluorescence measurements.
Overall, physical and biochemical factors have an important influence on the carbon cycle at coastal area. The mixture of different water masses could lead to migration of DOM, while microbial activity and intense light could result in the degradation of DOM. All of them could promote carbon cycle. Meanwhile, our results demonstrated that absorption and EEMs might be a useful tool for understanding the dynamics process and biogeochemical cycle of DOM. It is of great significance for maintaining the stability of the regional ecosystem for sustainable development.

Author Contributions

Hao Zheng, Jianfang Chen and Chen-Tung Arthur Chen conceived and designed research projects and the experimental contents; Hao Zheng, Jianfang Chen, Haiyan Jin and Zhongqiang Ji contributed sample collection, reagents, materials, and analysis tools; Maokun Liu and Zupeng Yan performed all calculations; Zhishen Yan collected data and literature; and Hao Zheng and Zhishen Yan wrote the paper.

Acknowledgments

This work was financially supported by the National Natural Science Foundation of China (NSFC No. U1709201, 91128212). It was also supported by the National Key Research and Development Program of China (Grant No. 2016YFC0304905).

Conflicts of Interest

The authors declare no conflict of interest.

References

  1. Zhang, Y.; Yang, K.; Du, J.; Zhang, F.; Dong, Y.; Li, W. Chemical characterization of fractions of dissolved humic substances from a marginal sea—A case from the Southern Yellow Sea. Chin. J. Oceanol. Limnol. 2017, 13, 1–11. [Google Scholar] [CrossRef]
  2. Maizel, A.C.; Remucal, C.K. The effect of advanced secondary municipal wastewater treatment on the molecular composition of dissolved organic matter. Water Res. 2017, 122, 42–52. [Google Scholar] [CrossRef] [PubMed]
  3. Nebbioso, A.; Piccolo, A. Molecular characterization of dissolved organic matter (DOM): A critical review. Anal. Bioanal. Chem. 2013, 405, 109–124. [Google Scholar] [CrossRef] [PubMed]
  4. Yang, L.; Chen, C.T.A.; Lui, H.-K.; Zhuang, W.-E.; Wang, B.-J. Effects of microbial transformation on dissolved organic matter in the east Taiwan Strait and implications for carbon and nutrient cycling. Estuar. Coast. Shelf Sci. 2016, 180, 59–68. [Google Scholar] [CrossRef]
  5. Lou, T.; Xie, H.; Chen, G.; Gagné, J.P. Effects of photodegradation of dissolved organic matter on the binding of benzo(a)pyrene. Chemosphere 2006, 64, 1204–1211. [Google Scholar] [CrossRef] [PubMed]
  6. Xiao, X.; He, X.; Xi, B.; Gao, R.; Li, D.; Zhang, H.; Cui, D.; Yuan, Z. Composition, Evolution, and Complexation of Dissolved Organic Matter with Heavy Metals in Landfills. Environ. Sci. 2017, 9, 3705–3712. [Google Scholar]
  7. Porcal, P.; Dillon, P.J.; Molot, L.A. Interaction of extrinsic chemical factors affecting photodegradation of dissolved organic matter in aquatic ecosystems. Photochem. Photobiol. Sci. 2014, 13, 799–812. [Google Scholar] [CrossRef] [PubMed]
  8. Jiao, N.; Herndl, G.J.; Hansell, D.A.; Benner, R.; Kattner, G.; Wilhelm, S.W.; Kirchman, D.L.; Weinbauer, M.G.; Luo, T.; Chen, F. Microbial production of recalcitrant dissolved organic matter: Long-term carbon storage in the global ocean. Nat. Rev. Microbiol. 2010, 8, 593. [Google Scholar] [CrossRef] [PubMed]
  9. Hedges, J.I. Global biogeochemical cycles: Progress and problems. Mar. Chem. 1992, 39, 67–93. [Google Scholar] [CrossRef]
  10. Xu, H.; Guo, L. Molecular size-dependent abundance and composition of dissolved organic matter in river, lake and sea waters. Water Res. 2017, 117, 115–126. [Google Scholar] [CrossRef] [PubMed]
  11. Rix, L.; De Goeij, J.M.; Van Oevelen, D.; Struck, U.; Al-Horani, F.A.; Wild, C.; Naumann, M.S. Differential recycling of coral and algal dissolved organic matter via the sponge loop. Funct. Ecol. 2017, 31, 778–789. [Google Scholar] [CrossRef]
  12. Casas-Ruiz, J.P.; Catalán, N.; Von Schiller, D.; Obrador, B.; Kothawala, D.N.; López, P.; Sabater, S.; Marcé, R. A tale of pipes and reactors: Controls on the in-stream dynamics of dissolved organic matter in rivers. Limnol. Oceanogr. 2017, 62, 85–94. [Google Scholar] [CrossRef]
  13. Su, R.; Bai, Y.; Zhang, C.; Shi, X. The assessment of the spatial and seasonal variability of chromophoric dissolved organic matter in the Southern Yellow Sea and the East China Sea. Mar. Pollut. Bull. 2015, 100, 523–533. [Google Scholar] [CrossRef] [PubMed]
  14. Yang, L.; Guo, W.; Hong, H.; Wang, G. Non-conservative behaviors of chromophoric dissolved organic matter in a turbid estuary: Roles of multiple biogeochemical processes. Estuar. Coast. Shelf Sci. 2013, 133, 285–292. [Google Scholar] [CrossRef]
  15. Remucal, C.K.; Cory, R.M.; Sander, M.; McNeill, K. Low molecular weight components in an aquatic humic substance as characterized by membrane dialysis and Orbitrap mass spectrometry. Environ. Sci. Technol. 2012, 46, 9350–9359. [Google Scholar] [CrossRef] [PubMed]
  16. Reemtsma, T. Determination of molecular formulas of natural organic matter molecules by (ultra-) high-resolution mass spectrometry. Status and needs. J. Chromatogr. A 2009, 1216, 3687–3701. [Google Scholar] [CrossRef] [PubMed]
  17. Hudson, N.; Reynolds, D. Fluorescence analysis of dissolved organic matter in natural, waste and polluted waters—A review. River Res. Appl. 2007, 649, 631–649. [Google Scholar] [CrossRef]
  18. Coble, P.G. Marine optical biogeochemistry: The chemistry of ocean color. Chem. Rev. 2007, 107, 402–418. [Google Scholar] [CrossRef] [PubMed]
  19. Barzegar, M.; Mousavi, M.F.; Nemati, A. Kinetic spectrophotometric determination of trace amounts of nitrite by its reaction with molybdosilicic acid blue. Microchem. J. 2000, 65, 159–163. [Google Scholar] [CrossRef]
  20. Boyd, T.J.; Osburn, C.L. Changes in CDOM fluorescence from allochthonous and autochthonous sources during tidal mixing and bacterial degradation in two coastal estuaries. Mar. Chem. 2004, 89, 189–210. [Google Scholar] [CrossRef]
  21. Baghoth, S.A.; Sharma, S.K.; Amy, G.L. Tracking natural organic matter (NOM) in a drinking water treatment plant using fluorescence excitation–emission matrices and PARAFAC. Water Res. 2011, 45, 797–809. [Google Scholar] [CrossRef] [PubMed]
  22. Yang, L.; Zhuang, W.E.; Chen, C.T.A.; Wang, B.J.; Kuo, F.W. Unveiling the transformation and bioavailability of dissolved organic matter in contrasting hydrothermal vents using fluorescence EEM-PARAFAC. Water Res. 2017, 111, 195–203. [Google Scholar] [CrossRef] [PubMed]
  23. Zhou, Y.; Zhang, Y.; Jeppesen, E.; Murphy, K.R.; Shi, K.; Liu, M.; Liu, X.; Zhu, G. Inflow rate-driven changes in the composition and dynamics of chromophoric dissolved organic matter in a large drinking water lake. Water Res. 2016, 100, 211–221. [Google Scholar] [CrossRef] [PubMed]
  24. Yang, L.; Hong, H.; Chen, C.T.A.; Guo, W.; Huang, T. Chromophoric dissolved organic matter in the estuaries of populated and mountainous Taiwan. Mar. Chem. 2013, 157, 12–23. [Google Scholar] [CrossRef]
  25. Guo, W.; Huang, J.P.; Hong, H.; Xu, J.; Deng, X. Resolving excitation emission matrix spectroscopy of estuarine CDOM with parallel factor analysis and its application in organic pollution monitoring. Huanjing Kexue/Environ. Sci. 2010, 31, 1419–1427. [Google Scholar]
  26. Stedmon, C.A.; Markager, S.; Bro, R. Tracing dissolved organic matter in aquatic environments using a new approach to fluorescence spectroscopy. Mar. Chem. 2003, 82, 239–254. [Google Scholar] [CrossRef]
  27. Murphy, K.R.; Stedmon, C.A.; Waite, T.D.; Ruiz, G.M. Distinguishing between terrestrial and autochthonous organic matter sources in marine environments using fluorescence spectroscopy. Mar. Chem. 2008, 108, 40–58. [Google Scholar] [CrossRef]
  28. Stedmon, C.A.; Markager, S.; Tranvik, L.; Kronberg, L.; Slätis, T.; Martinsen, W. Photochemical production of ammonium and transformation of dissolved organic matter in the Baltic Sea. Mar. Chem. 2007, 104, 227–240. [Google Scholar] [CrossRef]
  29. Qiao, S.; Yang, Z.; Liu, J.; Sun, X.; Xiang, R.; Shi, X.; Fan, D.; Saito, Y. Records of late-Holocene East Asian winter monsoon in the East China Sea: Key grain-size component of quartz versus bulk sediments. Quat. Int. 2011, 230, 106–114. [Google Scholar] [CrossRef]
  30. Zhang, G.L.; Zhang, J.; Kang, Y.B.; Liu, S.M. Distributions and fluxes of methane in the East China Sea and the Yellow Sea in spring. J. Geophys. Res. Oceans 2004, 109, 1–10. [Google Scholar] [CrossRef]
  31. Gao, X.; Song, J. Main Geochemical Characteristics and Key Biogeochemical Carbon Processes in the East China Sea. J. Coast. Res. 2006, 22, 1330–1339. [Google Scholar] [CrossRef]
  32. Chen, C.T.A. Distributions of Nutrients in the East China Sea and the South China Sea Connection. J. Oceanogr. 2008, 64, 737–751. [Google Scholar] [CrossRef]
  33. Sun, Q.; Wang, C.; Wang, P.; Hou, J.; Ao, Y. Absorption and fluorescence characteristics of chromophoric dissolved organic matter in the Yangtze Estuary. Environ. Sci. Pollut. Res. 2014, 21, 3460–3473. [Google Scholar] [CrossRef] [PubMed]
  34. Gao, L.; Fan, D.; Li, D.; Cai, J. Fluorescence characteristics of chromophoric dissolved organic matter in shallow water along the Zhejiang coasts, southeast China. Mar. Environ. Res. 2010, 69, 187–197. [Google Scholar] [CrossRef] [PubMed]
  35. Zhang, X.; Chen, X.; Deng, H.; Du, Y.; Jin, H.Y. Absorption features of chromophoric dissolved organic matter (CDOM) and tracing implication for dissolved organic carbon (DOC) in Changjiang Estuary, China. Biogeosci. Discuss. 2013, 10, 12217–12250. [Google Scholar] [CrossRef]
  36. Gan, S.; Wu, Y.; Zhang, J. Bioavailability of dissolved organic carbon linked with the regional carbon cycle in the East China Sea. Deep Res. Part II Top. Stud. Oceanogr. 2016, 124, 19–28. [Google Scholar] [CrossRef]
  37. Strickland, J.D.H.; Parsons, T.R. A Practical Handbook of Seawater Analysis; Fisheries Research Board of Canada: Ottawa, ON, Canada, 1972; Volume 167, p. 185.
  38. Dai, M.; Wang, L.; Guo, X.; Zhai, W.; Li, Q.; He, B.; Kao, S.J. Nitrification and inorganic nitrogen distribution in a large perturbed river/estuarine system: The Pearl River Estuary, China. Biogeosciences 2008, 5, 1227–1244. [Google Scholar] [CrossRef]
  39. Arthur Chen, C.T.; Wang, S.L. A salinity front in the southern East China Sea separating the Chinese coastal and Taiwan Strait waters from Kuroshio waters. Cont. Shelf Res. 2006, 26, 1636–1653. [Google Scholar] [CrossRef]
  40. Huguet, A.; Vacher, L.; Relexans, S.; Saubusse, S.; Froidefond, J.M.; Parlanti, E. Properties of fluorescent dissolved organic matter in the Gironde Estuary. Org. Geochem. 2009, 40, 706–719. [Google Scholar] [CrossRef]
  41. Bai, Y.; Su, R.; Han, X.; Zhang, C.; Shi, X. Investigation of seasonal variability of CDOM fluorescence in the southern changjiang river estuary by EEM-PARAFAC. Acta Oceanol. Sin. 2015, 34, 1–12. [Google Scholar] [CrossRef]
  42. Mcknight, D.M.; Boyer, E.W.; Westerhoff, P.K.; Doran, P.T.; Kulbe, T.; Andersen, D.T. Spectrofluorometric characterization of dissolved organic matter for indication of precursor organic material and aromaticity. Limnol. Oceanogr. 2001, 46, 38–48. [Google Scholar] [CrossRef]
  43. Wang, Y.; Zhang, D.; Shen, Z.; Chen, J.; Feng, C. Characterization and spacial distribution variability of chromophoric dissolved organic matter (CDOM) in the Yangtze Estuary. Chemosphere 2014, 95, 353–362. [Google Scholar] [CrossRef] [PubMed]
  44. Zhou, Y.; Jeppesen, E.; Zhang, Y.; Shi, K.; Liu, X.; Zhu, G. Dissolved organic matter fluorescence at wavelength 275/342 nm as a key indicator for detection of point-source contamination in a large Chinese drinking water lake. Chemosphere 2016, 144, 503–509. [Google Scholar] [CrossRef] [PubMed]
  45. Zheng, H.; Xu, C.; Yang, L.; Chen, J.; Chen, C.T.A.; Wang, B.J. Diurnal variations of dissolved organic matter in the hydrothermal system of Green Island, Taiwan. Mar. Chem. 2017, 195, 61–69. [Google Scholar] [CrossRef]
  46. Yang, L.; Guo, W.; Chen, N.; Hong, H.; Huang, J.; Xu, J.; Huang, S. Influence of a summer storm event on the flux and composition of dissolved organic matter in a subtropical river, China. Appl. Geochem. 2013, 28, 164–171. [Google Scholar] [CrossRef]
  47. Kowalczuk, P.; Durako, M.J.; Young, H.; Kahn, A.E.; Cooper, W.J.; Gonsior, M. Characterization of dissolved organic matter fluorescence in the South Atlantic Bight with use of PARAFAC model: Interannual variability. Mar. Chem. 2009, 113, 182–196. [Google Scholar] [CrossRef]
  48. Yi, Y.; Zheng, A.; Guo, W.; Yang, L.; Chen, D. Optical properties of estuarine dissolved organic matter isolated using cross-flow ultrafiltration. Acta Oceanol. Sin. 2014, 33, 22–29. [Google Scholar] [CrossRef]
  49. Chen, C.T.A. Chemical and physical fronts in the Bohai, Yellow and East China seas. J. Mar. Syst. 2009, 78, 394–410. [Google Scholar] [CrossRef]
  50. Liu, Q.; Pan, D.L.; Bai, Y. Estimating dissolved organic carbon inventories in the East China Sea using remote-sensing data. J. Geophys. Res. Oceans 2014, 119, 6557–6574. [Google Scholar] [CrossRef]
  51. Chen, C.T.A. Rare northward flow in the Taiwan Strait in winter: A note. Cont. Shelf Res. 2003, 23, 387–391. [Google Scholar] [CrossRef]
  52. Lin, H.; Guo, W.; Hu, M.; Cai, L.; Ji, W. Spatial and temporal variability of colored dissolved organic matter absorption properties in the Taiwan Strait. ACTA Ocean. 2012, 31, 98–106. [Google Scholar] [CrossRef]
  53. Yamashita, Y.; Maie, N.; Briceño, H.; Jaffé, R. Optical characterization of dissolved organic matter in tropical rivers of the Guayana Shield, Venezuela. J. Geophys. Res. Biogeosci. 2010, 115, 1–15. [Google Scholar] [CrossRef]
  54. Hung, J.J.; Chen, C.H.; Gong, G.C.; Sheu, D.D.; Shiah, F.K. Distributions, stoichiometric patterns and cross-shelf exports of dissolved organic matter in the East China Sea. Deep Res. Part II 2003, 50, 1127–1145. [Google Scholar] [CrossRef]
  55. Chen, Y.; Yang, G.; Liu, L.; Zhang, P.; Leng, W. Sources, behaviors and degradation of dissolved organic matter in the East China Sea. J. Mar. Syst. 2016, 155, 84–97. [Google Scholar] [CrossRef]
  56. Chen, Z.; Li, Y.; Pan, J. Distributions of colored dissolved organic matter and dissolved organic carbon in the Pearl River Estuary, China. Cont. Shelf Res. 2004, 24, 1845–1856. [Google Scholar] [CrossRef]
  57. Vodacek, A.; Blough, N.V.; DeGrandpre, M.D.; DeGrandpre, M.D.; Nelson, R.K. Seasonal variation of CDOM and DOC in the Middle Atlantic Bight: Terrestrial inputs and photooxidation. Limnol. Oceanogr. 1997, 42, 674–686. [Google Scholar] [CrossRef]
  58. Cao, F.; Medeiros, P.M.; Miller, W.L. Optical characterization of dissolved organic matter in the Amazon River plume and the Adjacent Ocean: Examining the relative role of mixing, photochemistry, and microbial alterations. Mar. Chem. 2016, 186, 178–188. [Google Scholar] [CrossRef]
  59. Yu, X.; Shen, F.; Liu, Y. Light absorption properties of CDOM in the Changjiang (Yangtze) estuarine and coastal waters: An alternative approach for DOC estimation. Estuar. Coast. Shelf Sci. 2016, 181, 302–311. [Google Scholar] [CrossRef]
  60. Pitta, E.; Zeri, C.; Tzortziou, M.; Mousdis, G.; Scoullos, M. Seasonal variations in dissolved organic matter composition using absorbance and fluorescence spectroscopy in the Dardanelles Straits—North Aegean Sea mixing zone. Cont. Shelf Res. 2017, 149, 82–95. [Google Scholar] [CrossRef]
Figure 1. The sampling stations in different seasons.
Sustainability 10 01444 g001
Figure 2. Seasonal changes of temperature and salinity with stations.
Sustainability 10 01444 g002
Figure 3. Seasonal variations of dissolved organic carbon (DOC) and a280 with stations.
Sustainability 10 01444 g003
Figure 4. Seasonal variations of fluorescence index (FI), humification index (HIX) and biological index (BIX) with stations.
Sustainability 10 01444 g004aSustainability 10 01444 g004b
Figure 5. The correlation between temperature and salinity in different seasons. (A, B, and C represent coastal-current water, mixed water in the shelf area, and the Taiwan Strait water respectively).
Sustainability 10 01444 g005aSustainability 10 01444 g005b
Figure 6. The relationship between the a280 and the concentrations of DOC.
Sustainability 10 01444 g006
Figure 7. Different fluorescent components in the winter. Fluorescence intensity was given in r.u.
Sustainability 10 01444 g007
Figure 8. Different fluorescent components in the summer. Fluorescence intensity was given in r.u.
Sustainability 10 01444 g008
Figure 9. Seasonal variations of fluorescence intensity with stations.
Sustainability 10 01444 g009
Table 1. Concentrations of nutrients in different seasons.
Season N-(NO2 + NO3) (μmol/L)P-(PO43−) (μmol/L)Si-(SiO32−) (μmol/L)
WinterSurface26.83–59.000.98–2.0421.40–39.87
SpringSurface4.67–80.040.04–3.127.10–53.76
Bottom3.77–41.350.05–1.206.68–29.42
SummerSurface6.33–16.110.55–1.0810.90–24.42
Bottom5.28–16.150.43–1.066.24–24.19
Table 2. Composition and probable source of CDOM. (PARAFAC: parallel factor analysis.)
SeasonComponentsEx/Em Maxima (nm)Traditional
Peak [17,18]
Comparison with Other Studies Using PARAFACProbable Source
WinterC1225(275)/330T C2, 230(280)/340 [43]Tryptophan-like
C2235/350TC2, 275(230)/342 [44]Tryptophan-like
C3265/441AC2, 255/440 [45]Humic-like
C4280/320TC6, 280/324 [23]Tryptophan-like
SummerC1225(275)/337TC2, 230(280)/340 [43]Tryptophan-like
C2275(230)/322TC2, 275(230)/342 [44]Tryptophan-like
C3270/461AC3, 260(395)/458 [46]Humic-like
C4235(310)/399A and MC5, 315/412 [22]Humic-like
C5, 235(305)/394 [23]
SpringC1275/320TC6, 280/324 [23]Tyrosine-like
C2240(310)/350T and MC6, 250(290)/356 [47]Tryptophan-like and humic-like
C3265/430AC2, 265(360)/458 [48]Humic-like
Table 3. Correlations between DOM components and concentrations of nutrients.
SeasonNutrientC1C2C3C4
WinterN-(NO3 + NO2)0.1350.679 **0.560 **0.631 **
P-(PO43−)0.0620.841 **0.643 **0.845 **
Si-(SiO32−)0.0300.3130.2560.303
SummerN-(NO3 + NO2)−0.3350.817 **0.661 **0.792 **
P-(PO43−)−0.2270.488 **0.620 **0.652 **
Si-(SiO32−)−0.340.786 **0.638 **0.779 **
SpringN-(NO3 + NO2)0.673 **0.757 **0.731 **
P-(PO43−)0.554 **0.627 **0.611 **
Si-(SiO32−)0.669 **0.729 **0.668 **
** p < 0.01.

