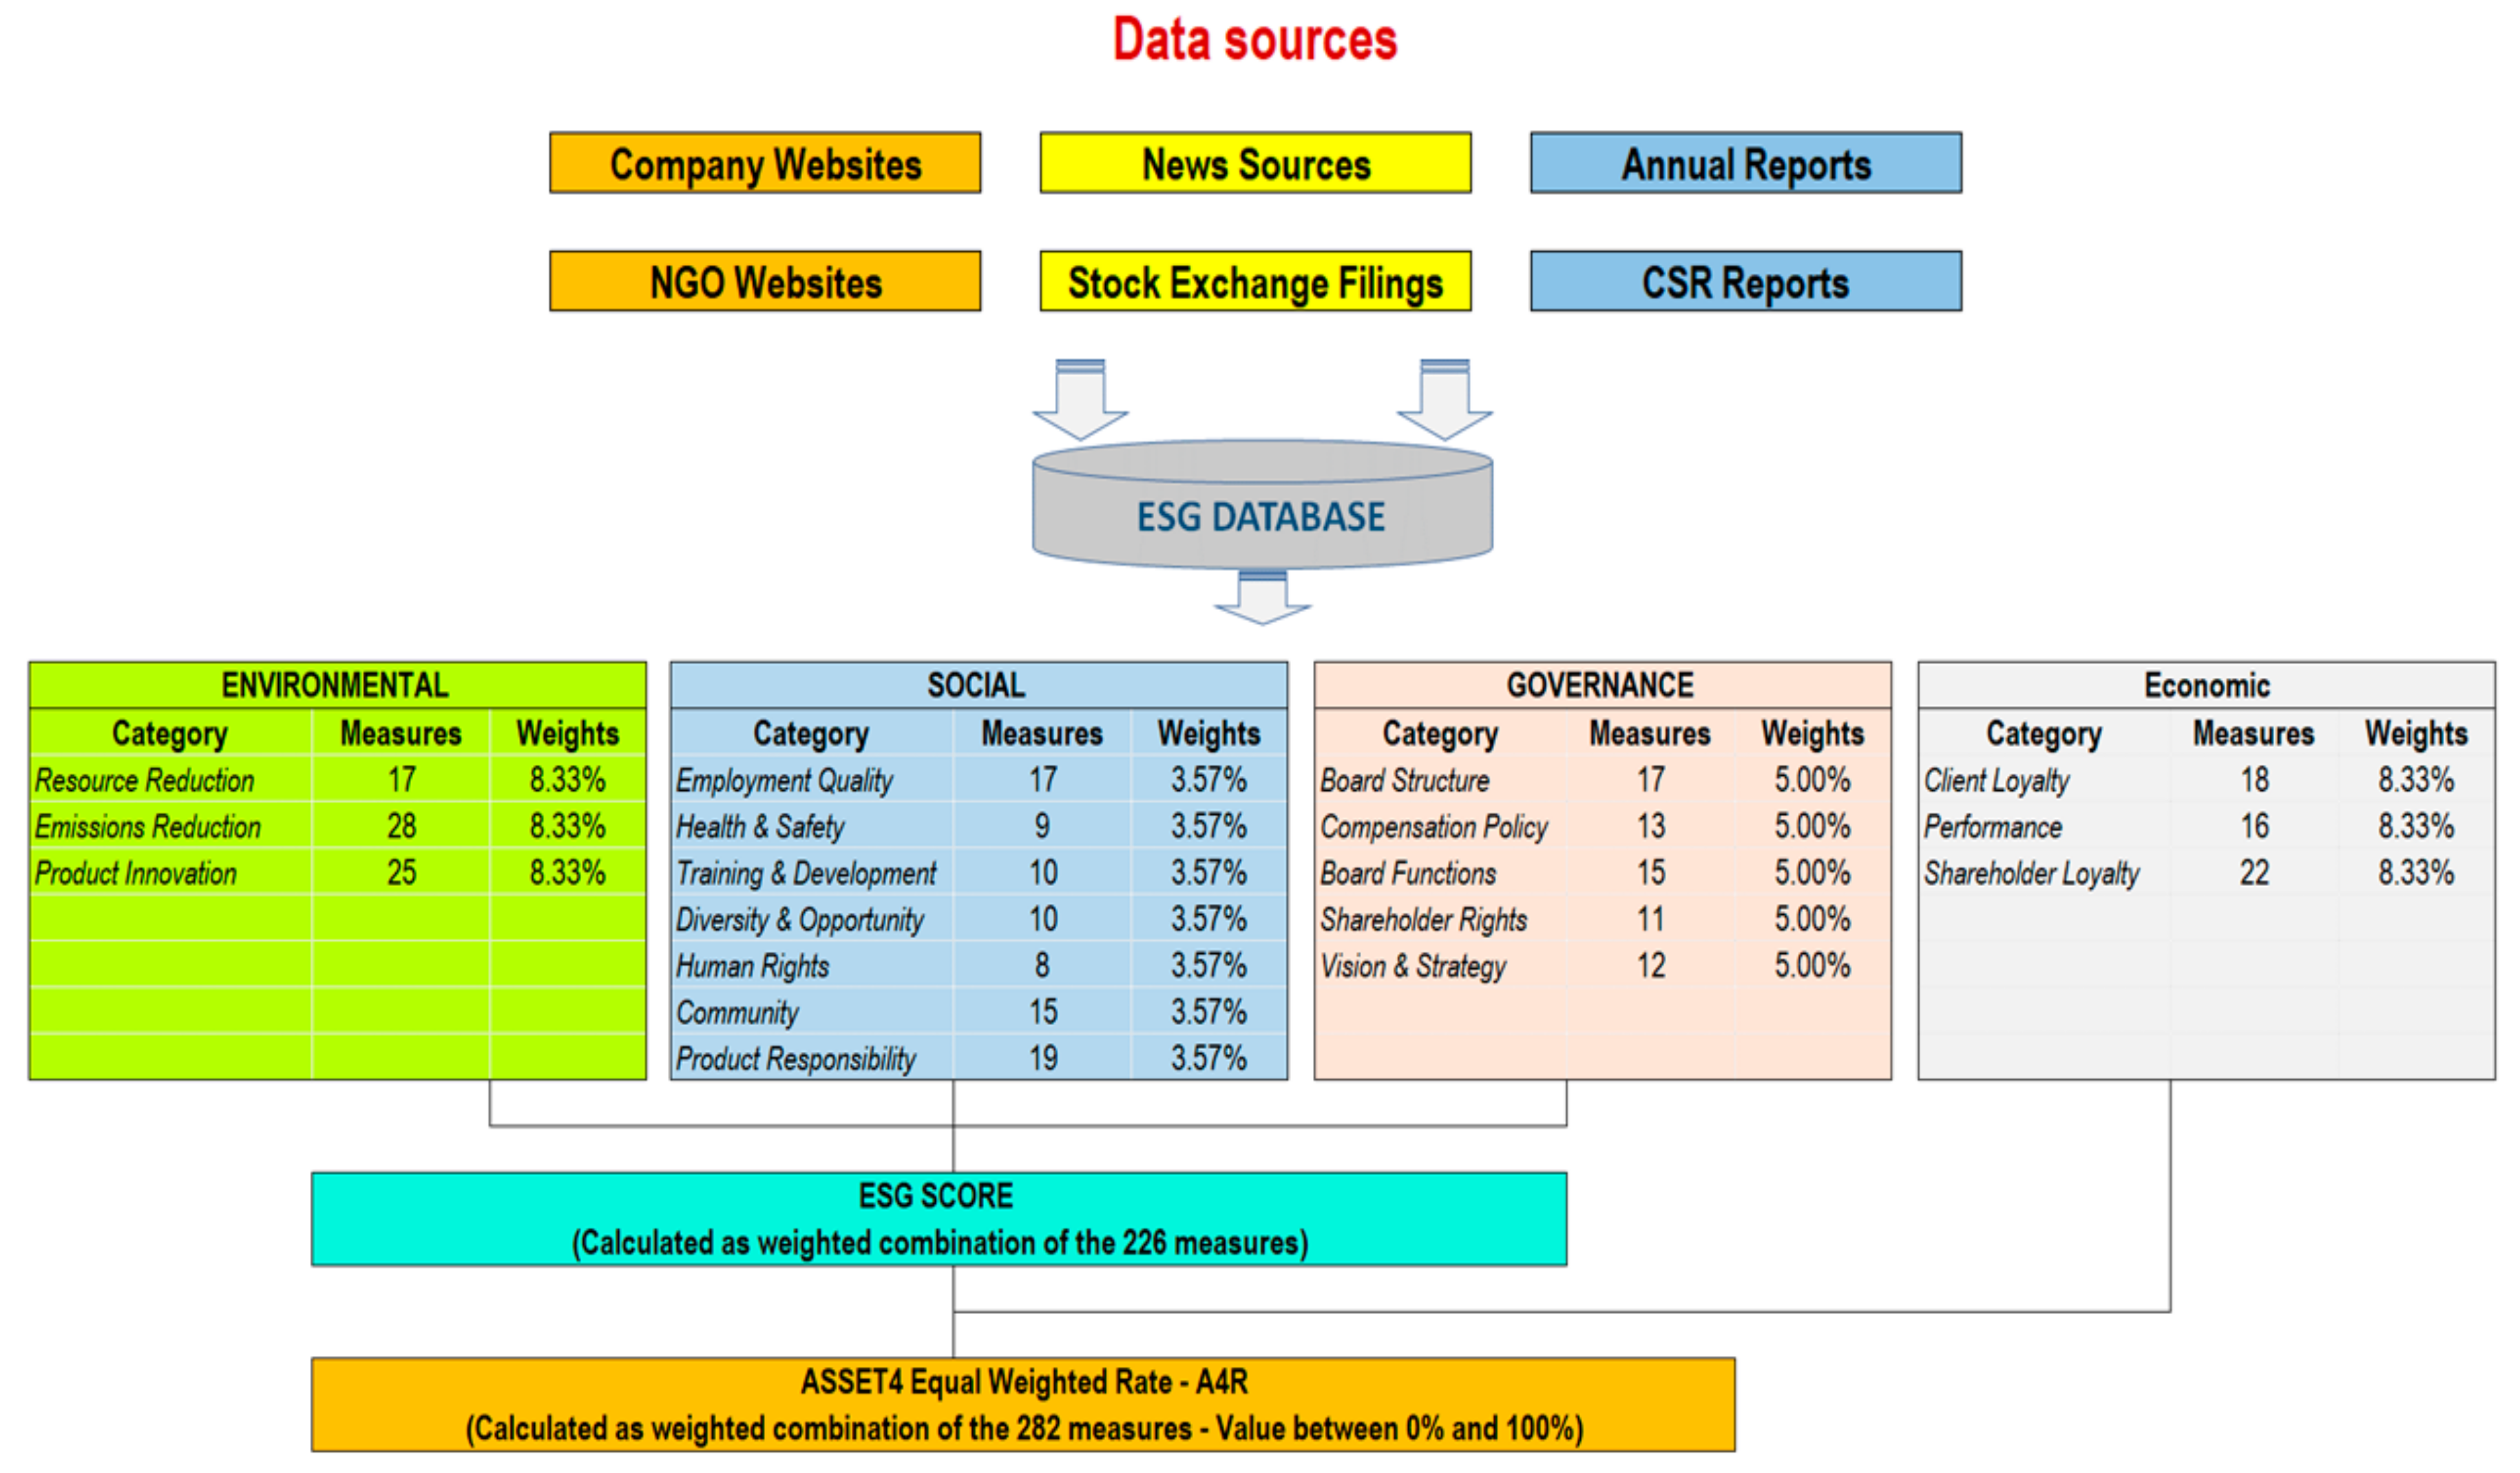
3.1. Research Questions 1 and 2
Firstly, it is necessary to evaluate the distribution of the A4R indicator from a temporal viewpoint.
Distinguishing the two zones of reference (EU = Europe; SA = South Africa) we will have the summary statistics that are represented in
Table 3 (Europe) and
Table 4 (South Africa) (The original data are shown in
Tables S1–S4):
Normally, observation of the mean value of both distributions (EU; SA) would lead to the conclusion that the average trend of integrated performance measured by the A4R indicator over the five years studied highlights a better performance by European companies. It is important to specify, however, that, in order to carry out evaluations on the mean or on the variance of the data, it is necessary to consider that the companies chosen for this analysis are a sample. Therefore, it is better to refer to the confidence intervals. As could be expected, observing the differences characterising the standard deviations over the years examined, the confidence intervals of the mean (95%) have different widths, which narrow over the period observed in both geographical contexts.
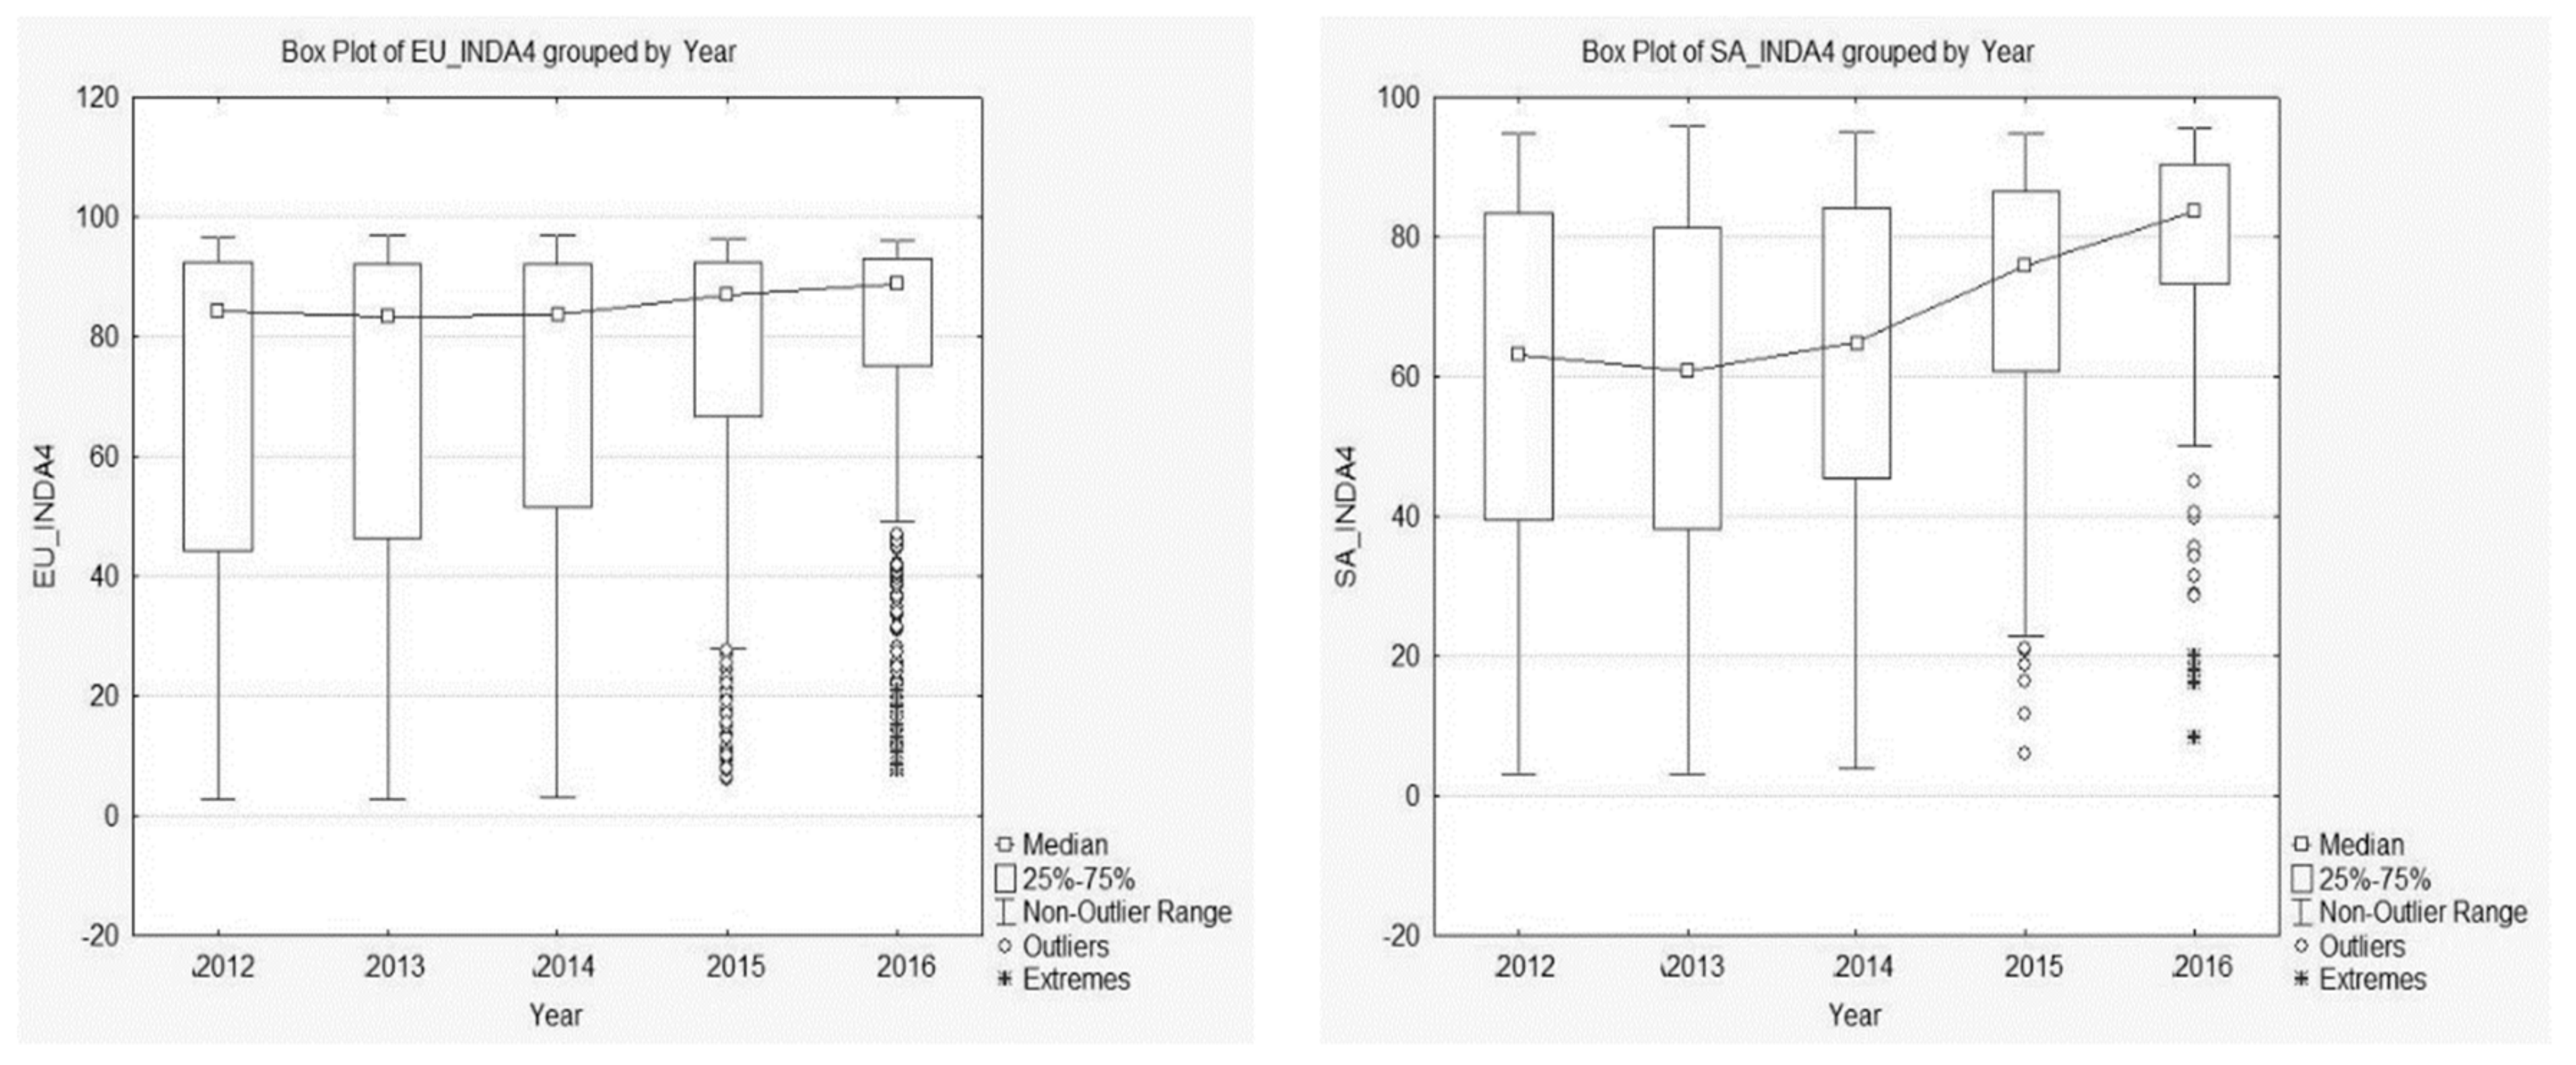
If, however, the shape of the distributions of the A4R index in the various years in the two areas examined is evaluated using box-plots (
Figure 2) of the summary statistics (median-quartiles-index of asymmetry) (
Table 3 and
Table 4) a left asymmetry (greater concentration of higher A4R index values), which increases over the years. Thus, in these cases, the mean is not a “robust” summary measurement and it is better to refer to the median.
Observing the values of the median (
Table 5), it can be seen that, unlike the mean, in the case of Europe the value decreases in 2013 and 2014 (for South Africa, only in 2013) compared with 2012. Moreover, analyzing the values of the medians and quartiles together, it is interesting to note that, without prejudice to the general improvement of the A4R performance indicator over time in both geographical zones, in 2012 50% of companies in Europe and South Africa showed an A4R value greater than 84.23 for the former and only 63.1 for the latter. In 2016, while the median value of A4R in South Africa remained lower, the situation seems to be normalizing. Indeed, the value of the median that divides the distribution in half is 87.1 for Europe and 83.5 for South Africa. Moreover, the integrated performance of companies that had an A4R index in 2012 grows considerably; indeed, 25% of companies that had an A4R value lower than 44.31 in 2012 in Europe have values below 75.0 in 2016, and in South Africa the change is from 39.7 to 73.1.
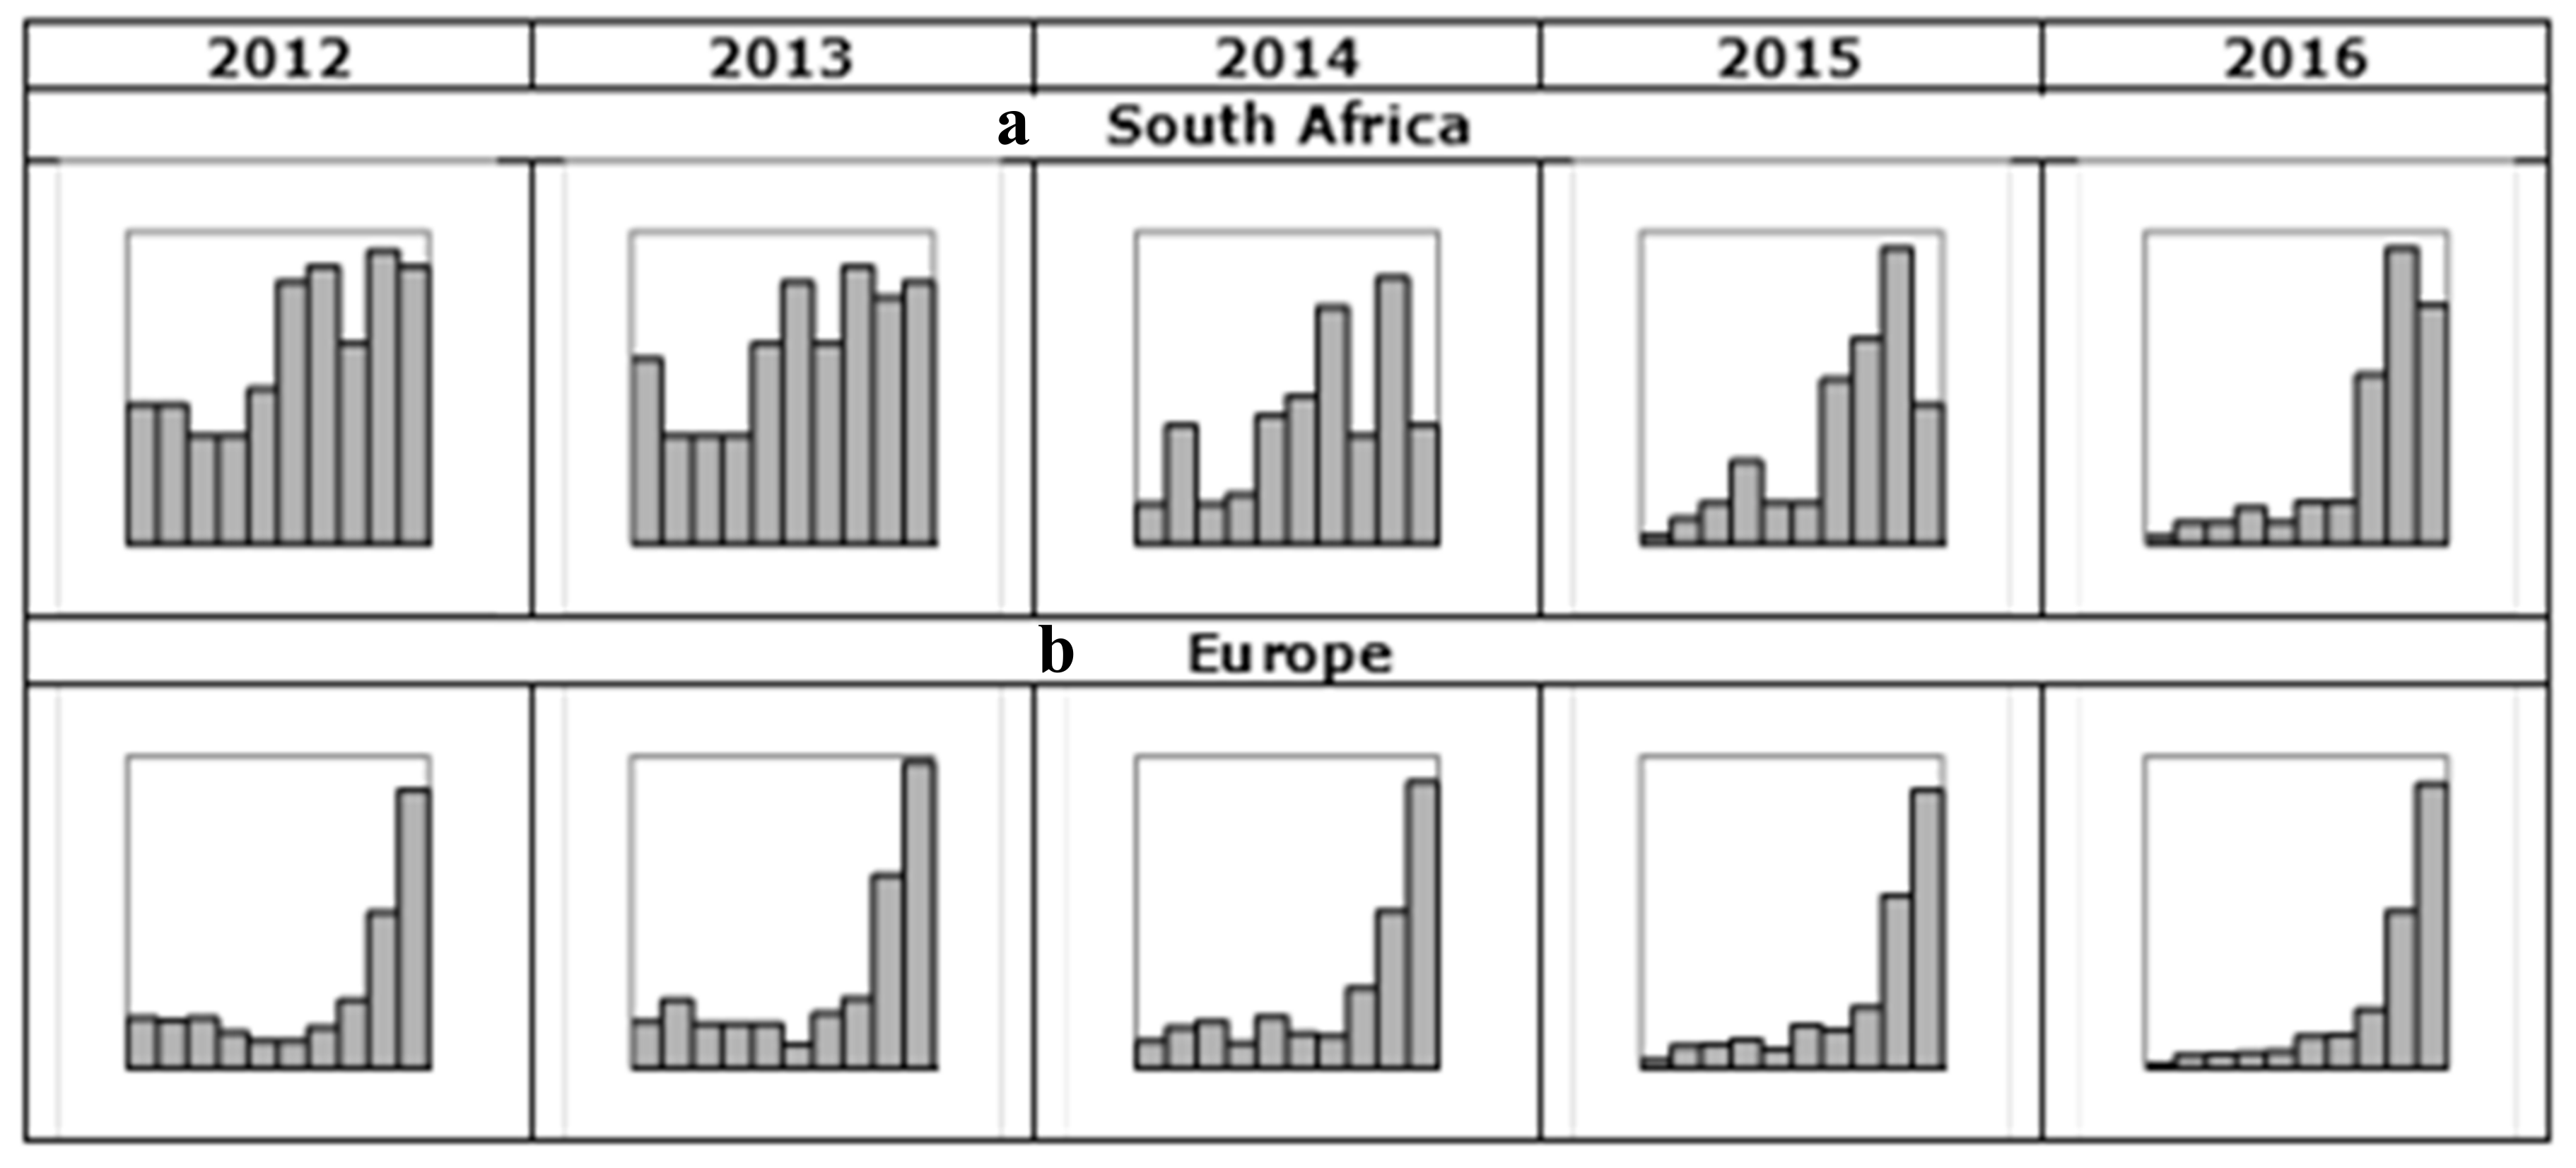
The above observations regarding the shape of the distributions of the A4R indicator in the years in question for each geographical zone can easily be seen in the histograms shown in
Figure 3. The frequencies relating to the distributions of the A4R indicator (min = 0; max = 100) were subdivided into 10 classes of width 10 for South Africa (
Figure 3a) and Europe (
Figure 3b).
From the above graphs, it can be clearly seen that, from 2012 onwards, the distributions of the A4R indicator in Europe are heavily left-asymmetric. This means that in Europe from 2012 onwards there has been a large group of companies that have a high integrated performance index. The situation in South Africa is different, however; in 2012 and 2013 the situation is fairly flat and an increased concentration of companies in the upper area of the A4R indicator range can be noted only from 2015 onwards.
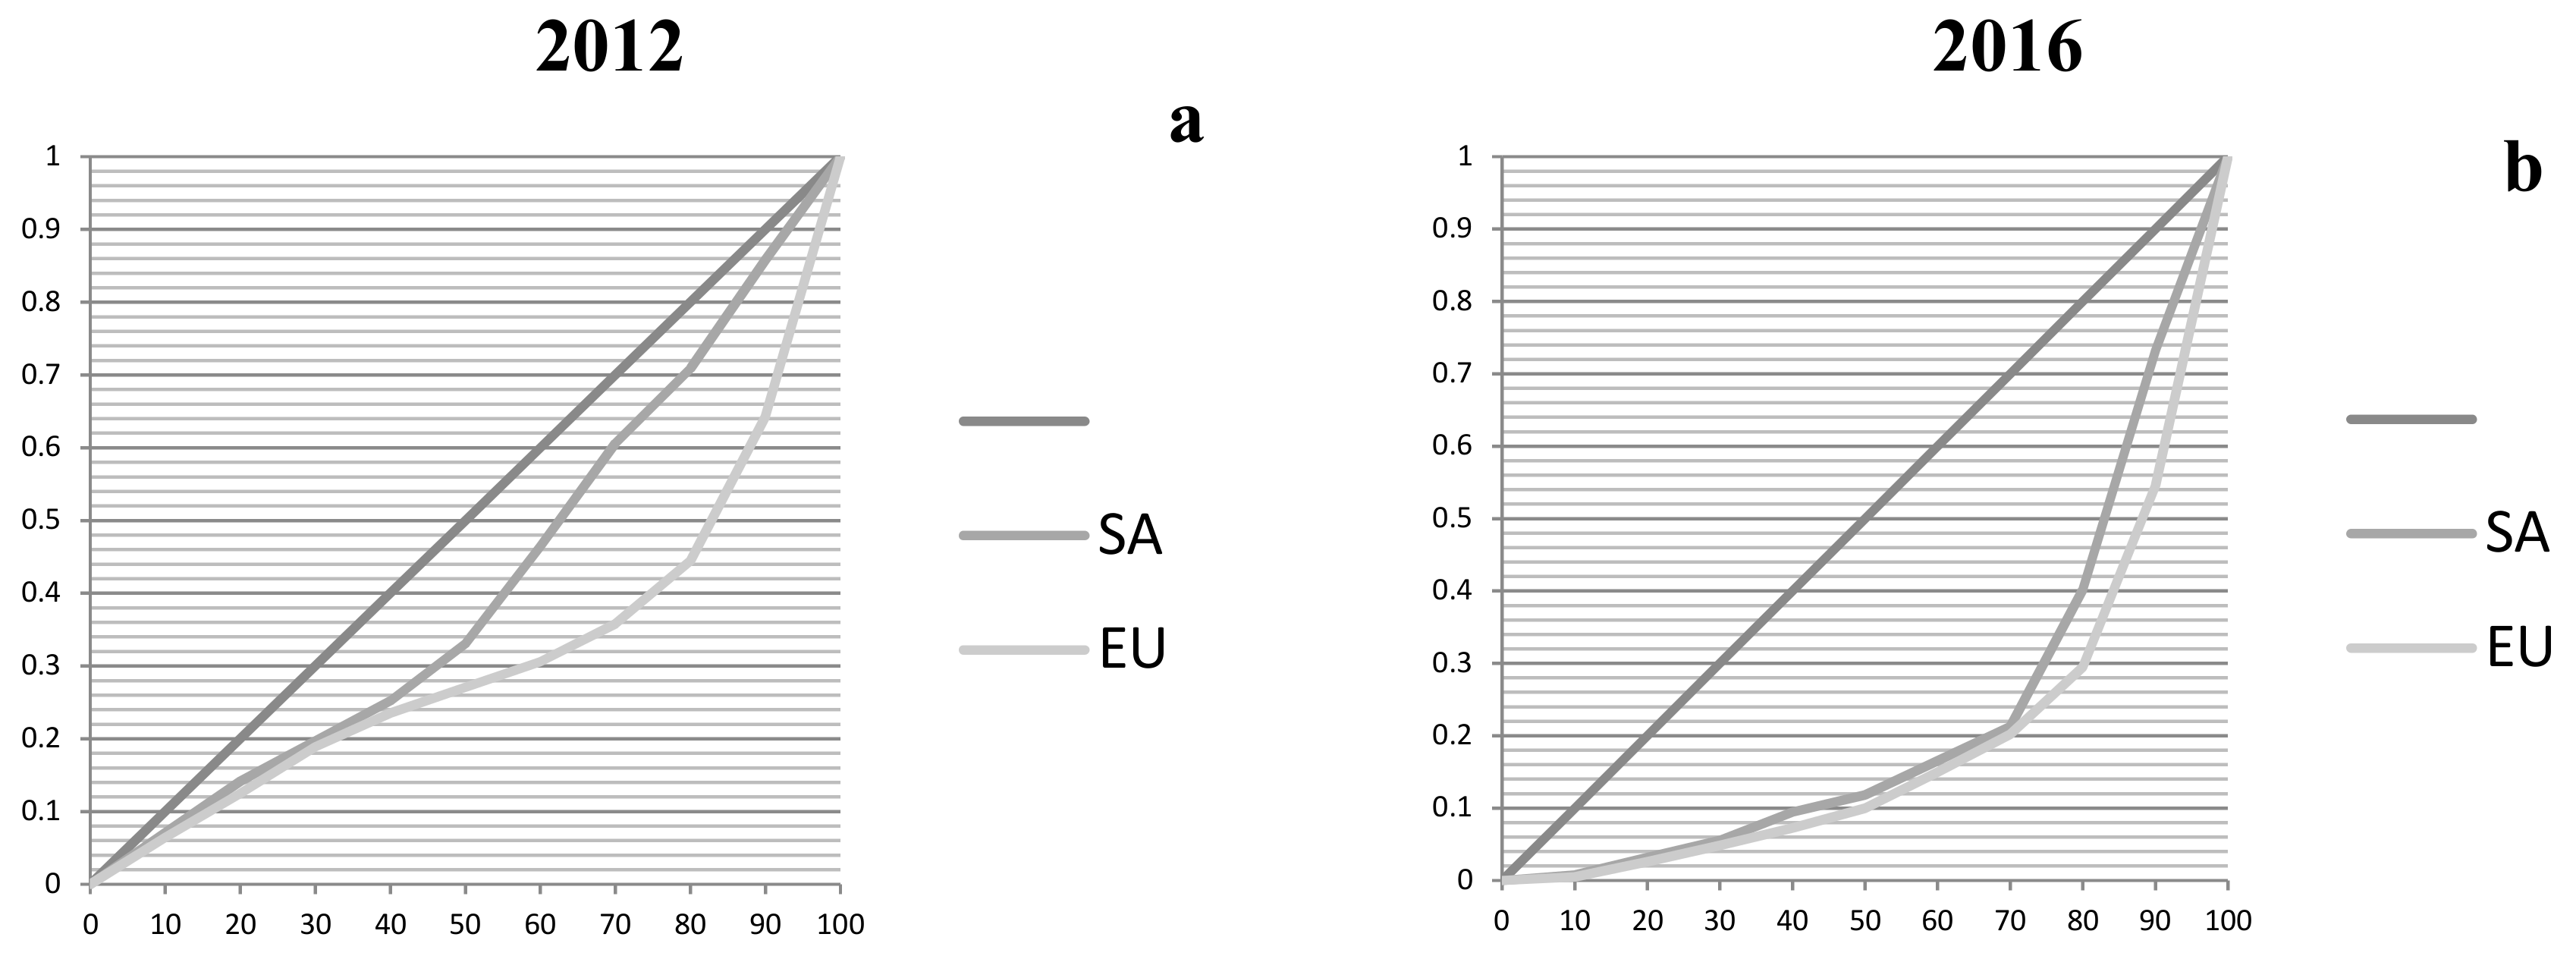
Further confirmation of these observations can be found in the concentration curves (
Figure 4) relating to the years 2012 (
Figure 4a) and 2016 (
Figure 4b), which clearly show that in 2012 the percentage of companies with A4R below 80 is 44.5% in Europe compared with 70.9% in South Africa. As mentioned above, in 2016 the situation was still better in Europe but South Africa (40.1%) narrowed the gap compared with Europe (29.4%), which continued to improve.
The statistical tools used so far clearly indicate that there are differences between the annual mean values of the A4R indicator, both for Europe and for South Africa. In order to analyze more deeply, however, it is necessary to verify whether any differences observed are significant or not. To this end, it would be necessary to carry out a variance analysis, so as to clarify whether the mean improvement in integrated performance linked to the A4R indicator is due to time, or whether the differences found are the effect of random oscillations caused by the fact that we are considering samples. It should be remembered, however, that analysis of the ANOVA variance allows non-distorted results to be obtained if, and only if, the basic assumptions are respected (the distribution must be normal and the variances must be homogenous). In order to verify these assumptions, two statistical tests are suitable: Levene’s test and the Kolmogorov–Smirnov test. In this case, Levene’s test showed that the variances are not homogenous (
Table 6), and the Kolmogorov–Smirnov test (
Table 7) demonstrated a violation of the normality hypothesis:
It is, therefore, appropriate to use the non-parametric ANOVA, as its results do not depend on the hypothesis of normality, using the Kruskal-Wallis test (
Table 8) and the median test (
Table 9), which is a nonparametric (distribution free) test that is used when the assumptions of one-way ANOVA are not met.
In order to discover which years are significantly different from one another the non-parametric Mann–Whitney test was used, under the hypothesis of non-homogeneity of variances, obtaining the results set out in
Table 10:
The test clearly shows that in both regimes the mean distribution of the A4R integrated performance indicator follows two different trends: one in reference to the period 2012–2014 and the other to the period 2015–2016.
The analyses carried out have highlighted significant differences in the A4R indicator over the period under consideration, thus in the mean levels of integrated performance in the two contexts examined.
South Africa is characterised by a lower initial mean value of the A4R indicator, which increases—as happens in Europe—over the period examined. In both contexts, moreover, variability around the mean value constantly declines over the years (see
Table 4).
In general, the higher levels of integrated performance recorded by European companies can be explained by considering that these companies are part of a European population characterised by greater awareness of the process of value creation and a better capacity to manage it: in other words, they are companies with high level profiles compared with others operating in the territorial context. It was, therefore, to some extent logical to expect this result.
The study we carried out, however, brought to light that levels of integrated performance significantly improved in the years following the adoption of a mandatory integrated reporting approach, with effects that grow stronger over the medium term (see
Figure 3). South African companies, therefore, after an initial phase, seem to have effectively taken on board and exploited the advantages deriving from integrated thinking. In fact, South African companies considerably reduced the gap that separated them from high level European companies that voluntarily adopted integrated reporting practices.
Research questions 1 and 2 are, thus, both verified.
3.2. Research Question 3
For data processing purposes, we used the following model:
where:
βi are the standardized regression coefficients;
λi represents the mean corporate effect
εi,t represents the error, that is the mean quota of market value per share not explained by the model because of missing variables.
The other models tested with the further control variables SIZE and LEV were rejected because these variables proved to be statistically non-significant.
As concerns what was mentioned above in
Section 2.2, verification of Research Question 3 was carried out using a linear price-level model with a “cross sectional time series” data formulation, better known as panel data. Considering, however, that the aim is to study the difference, in the two geographical areas studied (Europe and South Africa), of value relevance of traditional accounting values on the balance sheet, to which the A4R integrated performance indicator is added, we used a fixed effects regression model, which hypothesizes the existence of individual effects of each company constant over time.
In advance, the fixed effect panel regressions [
38,
39] were compared with the simple pooling models [
40]. From test F it can be seen that use of fixed effects models is justified by rejection of the null hypothesis (H
0 = the groups have a common intercept) of test F (
Table 11):
Moreover, the Hausman test confirms that the fixed effects model is preferable to the random effects model.
In the fixed effects model, λ
i and ω
t are considered determinant; in the random effects model, on the other hand, they are stochastic. The Hausman test allows verification of whether the fixed effects model (H
1) or random effects model (H
0) is more appropriate [
36].
The results obtained by panel regressions are the following.
Examination of the parameters of the two fixed effect equations shows that for both geographical contexts in question the A4R integrated performance indicator is value relevant in statistically significant terms (see
Table 12), and with a greater impact on investors’ choices in the European context, in which the companies in the sample studied are also characterized by a lower value relevance of the BVS and of the EPS compared with South Africa.


