Abstract
The logistics industry is one of the major fossil energy consumers and CO2 emitters in China, which plays an important role in achieving sustainable development as well as China’s emission reduction targets. To identify the key influencing factors regarding the logistics of CO2 reductions and ensure that the development of China’s logistics industry becomes less dependent on CO2 emissions, this paper built an extended log-mean Divisia index model (LMDI) to decompose the logistics of CO2 changes between 1985 and 2015. Then, we introduced a decoupling model that combined the decomposition results to analyze the decoupling state and identify the main factors that influenced the decoupling relationship. The results show the following. (1) The urbanization effect was the decisive factor in CO2 emissions increases, followed by structural adjustment effects, while technological progress effects played a major role in inhibiting CO2 emissions. Particularly, the energy structure showed great potential for CO2 emissions reduction in China. (2) Highways appeared to have dominant promoting roles in increasing CO2 emissions regarding transportation structure effects; highways and aviation proved to have the largest impact on CO2 emission reduction. (3) There has been an increase in the number of expansive negative decoupling states between 2005 and 2015, which implies that the development of the logistics industry has become more dependent on CO2 emissions. Finally, this paper puts forward some policy implications for CO2 emission reductions in China’s logistics industry.
1. Introduction
Climate change has posed a severe threat to the sustainable development of human society, the economy, and the environment [1]. The greenhouse gases (GHG) produced by burning fossil fuels has been proven to be one of the leading cause of global warming [2]. In particular, energy-related CO2 emissions, which are an essential environmental pollutant, has greatly contributed to global climate change [3]. CO2 emissions may have triggered a chain reaction for some natural disasters, such as certain glacier melting, sea level rise, and extreme climate. Since its reform and opening up, China’s economy has experienced spectacular growth, which has been accompanied by a substantial increase in energy consumption as well as CO2 emissions. In 2006, China’s carbon dioxide emissions exceeded the United States’, and it became the largest carbon dioxide emitter in the world. Moreover, its external dependence on net imports of oil increased from 7.5% in 1993 to 64.4% in 2016, which seriously endangered China’s energy security. In order to cope with the challenges posed by the rising greenhouse gas emissions, the Chinese government promised a target to the world in 2015 at the Paris Climate Change Conference that by 2030, China’s CO2 emission per unit of gross domestic product (GDP) would drop by 60–65% compared with 2005, and that total CO2 emissions have reached their peak.
Logistics is a primary industry that supports the development of China’s economy, and should be given priority to develop. However, alongside the process of industrialization and urbanization in China, the demand for logistics services has continuously increased, which has made the logistics industry the second largest oil consumption sector, with the highest CO2 emissions growth rate. In 2014, the consumption of gasoline, diesel, and fuel oil in the logistics industry respectively accounted for 47.72%, 94.89%, and 64.33% of the total gasoline, diesel, and fuel oil consumption in China, which would undoubtedly pose a more significant threat to the sustainable development of China’s society, economy, and environment.
In order to achieve nationally determined contribution targets and sustainable development in China, the logistics industry should assume a critical responsibility for energy saving and emission reduction [4]. Identifying the determinants of CO2 emissions and coordinating the contradiction between the logistics industry development and CO2 emission reduction are essential ways to achieve the emission reduction targets and sustainable development. The growth of logistics output is often accompanied by a series of dynamic adjustments, such as the improvement of energy utilization efficiency, the advancement of equipment technology levels, and the maturity of the carbon market. It indicates that the relationship between the logistics development and CO2 emissions has space to adjust, and the contradiction between the two is not irreconcilable. Therefore, in order to ensure the development of China’s logistics industry while achieving the mitigation of logistics CO2 emissions, the purposes of this paper are to solve the following questions: (1) What are the key factors affecting CO2 emissions in the logistics industry? (2) Does the increasing output of the logistics industry become less dependent on energy consumption and CO2 emissions? If not, what is the dynamic relationship between the development of the logistics industry and its CO2 emissions? (3) How can policy be used to make logistics development less dependent on CO2 emissions?
Since the reform and opening up of China, urbanization has developed rapidly. The urbanization rate increased from 17.9% in 1978 to 57.35% in 2016, which in turn has had a meaningful impact on CO2 emissions in the logistics industry [5,6]. On the one hand, urbanization leads to the concentration of the population in urban areas and industrial agglomeration, which promotes the achievement of scale effects in logistics operation and the reduction of logistics CO2 emissions. Meanwhile, the scale development of the logistics enterprises (e.g., the alliance of small and medium logistics enterprises, and the construction of logistics parks) caused by the urbanization are beneficial for accelerating the unification of the standards of logistics equipment and exerting knowledge spillover effects, which improves fuel efficiency. On the other hand, urbanization brings about the expansion of urban areas and the spatial separation of the residence and workplaces, which increases transportation distance and leads to traffic congestion. Moreover, the expansion results in an increase in the distance between production and marketing, which consequently promotes CO2 emissions in the logistics industry. Therefore, urbanization has influenced CO2 emissions complexity in both positive and negative ways. Simultaneously, the decomposition of the impacts of urbanization on logistics CO2 emissions is conducive to clarifying the influencing mechanism and identifying the dominant influencing factors for CO2 emissions.
Domestic and overseas scholars mainly utilized an econometric approach and decomposition model to reveal CO2 changes and investigate the underlying factors of logistics CO2 emissions. The econometric approach mainly includes multiple regression analysis (e.g., Stochastic Impacts by Regression on Population, Affluence, and Technology model (STIRPAT), ridge regression), spatial panel data models (e.g., spatial Durbin model, spatial error model, and geographical weighted regression). For example, Du et al. [7] investigated spatial clustering characteristics and the influencing factors of carbon emission intensity in China’s province-level construction industry by utilizing Moran’s I and geographical weighted regression. Wang et al. [8] proposed an extended STIRPAT model to examine the determinants of energy-related CO2 emissions in Xinjiang by analyzing the effect of population scale, urbanization, technical progress, and industrial structure. The paper mainly focused on three periods, namely, before China’s reform and opening up (1954–1977), after China’s reform and opening up (1978–2000), and the western development period (2001–2014).
The decomposition model is also a conventional method to analyze the dominating factors of carbon emissions. There are two major categories of the primary decomposition models: the structural decomposition analysis (SDA) and the index decomposition analysis (IDA). The SDA model is based on the input–output table, and has a higher requirement for data compared with index decomposition analysis (IDA) [1,9,10,11]. Mi et al. [9] employed the SDA model to analyze the major contributors to China’s carbon emission growth, and argued that the global financial crisis has influenced the driving forces of carbon emission in China. Malik et al. [11] decomposed the change in CO2 emissions into six determinants based on a global input–output database, and indicated that affluence and population growth were significant determinants. The IDA approach includes the Laspeyres decomposition method and the Divisia index decomposition method; the Divisia index decomposition method contains the log-mean Divisia index (LMDI) and the arithmetic mean Divisia index (AMDI). The LMDI is simple to operate, and fully quantifies the contribution of potential influencing factors to carbon emission change over time. Compared to the traditional Laspeyres index decomposition method, the LMDI can realize complete decomposition of no residuals. Compared to the arithmetic mean Divisia index (AMDI), it can handle zero-value problems that may occur in eight cases [12,13,14]. Therefore, the LMDI is widely used and considered to be the preferred method [13]. Ang et al. [13] compared diverse index decomposition analysis approaches, and pointed out that the LMDI method is the “best” decomposition method. Zhang et al. [15] adopted the LMDI to analyze the influencing factors of carbon emissions and carbon emission intensity in China from the perspective of energy and industrial structures. The results showed that the economic growth and production activities of the secondary industry are the main driving factors for the growth of carbon emissions. Akbostancı et al. [16] decomposed the CO2 emissions of the manufacturing industry covering 57 sub-industries in Turkey into five parts, e.g., industrial activity, activity structure, sectoral energy intensity, and sectoral energy mix. It was found that industrial activity and energy intensity are the main factors determining the changes in CO2 emissions. Moreover, some scholars have decomposed the energy and carbon emissions in the transportation industry. Mraihi et al. [17] used the LMDI decomposition method to analyze the impacts of the fuel efficiency of road vehicles, vehicle intensity, economic growth, and urbanization on road transport-related energy consumption in Tunisia. The results indicated that the fuel efficiency of road vehicles and vehicle intensity are the main inhibiting factors of energy consumption growth. Zhu et al. [18] decomposed the carbon emissions from the transport sector in the Beijing–Tianjin–Hebei region by employing the modified LMDI approach, and pointed out that energy structure and energy intensity played negative roles regarding increases in CO2 emissions. A few studies focused on an analysis of the influencing factors of the CO2 emissions of the logistics industry. For example, Dai and Gao [19] analyzed the critical factors of energy consumption from China’s logistics industry, and found that logistics activities and freight transport intensity have promoted the increase of the logistics industry’ energy consumption. As for the transportation links of the logistics industry, Bauer et al. [20] introduced an integer program model for transportation planning to minimize the carbon emissions from freight transportation activities.
The relationship between economic growth and CO2 emissions is an essential issue that we face in the 21st century, and it is of wide concern to scholars worldwide. Research on the relationship between energy consumption/CO2 emissions and economic growth is usually carried out from the following four aspects. The first is generally applying Kuznets curve theory to study the fluctuation of energy consumption in relation to economic growth [21,22]. The second involves adopting Granger causality analysis and a cointegration test to investigate the causality of energy consumption and economic growth [23,24,25]. Bloch et al. [24] examined the relationship between coal consumption and economic growth in China from the perspective of both the supply and demand sides, and argued that there is a unidirectional causality between coal consumption and income both in the short and long run. The third aspect involves employing the OECD decoupling index and elastic decoupling model to analyze the dependence of economic growth on energy consumption [18,26,27]. Tapio [27] put forward a new theoretical framework for decoupling, and further broke the decoupling index down into eight kinds of decoupling states in order to investigate the decoupling relationship between GDP, traffic volumes, and CO2 emissions of the transport sector in the EU15 countries between 1970 and 2001. Finally, the vector autoregressive model can be used to analyze the long-term dynamic relationship between the output and carbon emissions [28]. Among these methods, the elastic decoupling model can quantitatively analyze the dependence of economic growth on energy year by year, and has an important advantage in measuring the relationship [27].
Existing research has made some achievements in studying the determinants of CO2 emissions and the relationship between economic growth and carbon emissions, but there are still some deficiencies. Firstly, there has been little research on CO2 emissions in the logistics industry [19,29]. The existing research about the sector level mainly focuses on the low-carbon development of the secondary industry and the construction industry. Although some scholars have been devoted to investigating the carbon emission reductions of an individual link of the logistics process [16], achieving carbon emission reduction in a single link does not mean achieving the minimization of carbon emissions in the whole logistics industry, because there is a “trade-off” phenomenon in the logistics sector [19,29,30,31]. Secondly, the traditional LMDI model based on Kaya identities was adopted to analyze the dominating factors of CO2 emissions through examining the factors of economic growth, technical progress, and population size [16,17,19,32]. There are still few observations at present taking into account urbanization effects as influencing factors when analyzing the impacts on logistics CO2 emissions. However, with the rapid progress of urbanization in China, urbanization is bound to have a significant and complicated effect on carbon emission changes in the logistics industry. Thirdly, previous studies that examined the determinants of logistics CO2 emissions were mostly from the macroscopic perspective, which lacks analysis regarding the impacts of freight transportation modes (i.e., highways, railways, waterways, and aviation) on CO2 emissions. It is not conducive to analyzing the emission reduction potential and formulating emission reduction policies from the perspectives of different freight modes.
Therefore, as for a research objective, we focus on China’s logistics industry. This paper analyzes the influencing mechanism and decomposes energy-related CO2 emissions between 1985 and 2015 (from the early stage of the reform and opening up to the end of the 12th five-year plan, which is the Chinese government’s plan for the national economy and social development of China) that witnessed the rapid development of the urbanization and the logistics industry in China. It is conducive for the government to formulate scientific energy-saving policies in the logistics industry. This is the first contribution of this paper. Simultaneously, as for methodology, this paper extends the traditional LMDI model to quantify the impact of influencing factors on logistics CO2 emissions from the perspective of freight transportation modes and energy types through examining the effect of technological progress, structural adjustment, and urbanization. The decomposition index is more comprehensive and more in-depth, and this is the second contribution of this paper. In order to coordinate the relationship between the logistics development and carbon emissions and realize logistics activities that can have less dependence on carbon emissions, in addition to decomposing CO2 emissions change, we also put forward a decoupling approach based on LMDI decomposition results to study what decoupling status has occurred and what factors have affected the decoupling relationship. To date, few studies have combined the decoupling approach with decomposition results to identify and explore the primary factors that have influenced the decoupling relationship in the logistics industry. This is another contribution of this paper.
2. Materials and Methods
2.1. Estimation Approach of CO2 Emissions from the Logistics Industry
The two methods that are widely used to estimate CO2 emissions in the logistics industry are the top–down and the bottom–up approach. Applying the bottom–up approach, we need to collect data relating to the mileage, energy consumption, and CO2 emissions coefficients of various types of vehicles at different speeds, as well as the number of each vehicle. These statistical data on logistics activities are difficult to obtain, while the top–down approach is only based on terminal energy consumption. Therefore, the top–down approach is more accurate for estimating the CO2 emissions of the logistics industry in China. In this paper, we utilized the top–down approach to calculate CO2 emissions based on energy consumption such as raw coal, crude oil, natural gas, and electricity [33,34,35]. The CO2 emissions can be calculated as follows:
where means total CO2 emissions from the logistics industry in the year t, which are quoted in 10,000 tons; represents freight transportation mode; denotes highways, railways, waterways, and aviation, respectively; and represents the energy type. denotes energy consumption of the th transport mode of energy type in year t; means the average low calorific value of energy type ; implies carbon content per unit calorific value of energy type ; denotes carbon oxidation rate; and is the CO2 emissions coefficient of energy type . The calculation equation of is shown as follows:
where denotes the molecular weight ratio of carbon dioxide to carbon.
2.2. Extended CO2 Emissions Decomposition Model
The traditional Kaya identity is used to decompose CO2 emissions into technological progress, affluence, and population scale through examining the effect of energy intensity per capita GDP and population [36]. However, the Kaya identity does not analyze the impacts of structural adjustment and technological progress from the perspective of freight transportation modes, and does not comprehensively consider urbanization effects. The impact of urbanization on CO2 emissions in the logistics industry has many channels, and the influencing mechanisms are very complex [6,37]. In brief, urbanization affects the logistics industry’s CO2 emissions through economic growth, population, and urban spatial expansion effects. The specific influencing mechanisms are as follows. (1) The development of urbanization often leads to the rapid development of the economy and the improvement of people’s living standards, and this directly results in the change of the lifestyle of the residents (e.g., the rapid popularization of e-commerce and intracity logistics distribution), accordingly influencing the CO2 emissions in the logistics industry. (2) As for the influencing mechanism of the population urbanization effect, on the one hand, there is a large number of people who move into urban areas from rural areas, which leads to an increase in logistics demands (such as cold chain logistics, commodity logistics, and trade logistics) and an increase in logistics energy consumption. On the other hand, the concentration of the population results in the scale effect of logistics operation and the reduction of CO2 emissions. Meanwhile, with extensive publicity and advocacy of low-carbon logistics and the notion of a green lifestyle, residents’ awareness of energy-saving and emission reductions has improved, which leads to a reduction in per capita logistics CO2 emissions. (3) The other significant characteristic of the development of urbanization is the rapid expansion of urban areas. The rapid expansion increases the transportation distance and the complexity of the logistics network, which consequently has increased logistics CO2 emissions. Moreover, the development of urbanization in China brings about a spatial separation between residences and workplaces, and consequently a substantial increasing demand for cars. Accordingly, this phenomenon leads to commuter traffic and traffic congestion, which leads to an increase in CO2 emissions. Ultimately, taking into account the characteristics of the logistics industry (such as the improvement of energy utilization efficiency and the advancement of equipment technology levels accompanied by logistics development) and the urbanization effect, we decompose logistics CO2 emissions change through examining the impacts of structural adjustment, technological progress, and urbanization. The extended Kaya identity is shown in Equation (3):
where denotes energy consumption of the transport mode i in year t; denotes the freight turnover of the th transport mode in year ; denotes the total freight turnover of the logistics industry; represents the gross domestic product in year ; represents the total urban population in year ; and represents the urban built-up area in year .
In order to measure the contribution of the above factors to CO2 emissions, Equation (3) can be rewritten as follows:
where:
is energy mix of the th energy type in the th transport mode, which implies an energy structure change effect; is the freight transportation turnover share of th transport mode in year t, which reflects the impacts of mode shift in freights transportation on CO2 emissions; is the energy intensity of the th transport mode, which implies the efficiency of energy utilization and technology application effects in the logistics industry; is the freight transportation intensity measured by the freight transportation turnover per unit of gross domestic product, which indicates the transportation efficiency effect on logistics CO2 emissions; is the per capita gross domestic product, which reflects the urbanization effect of economic growth; is the urban population per unit of urban built-up area, which implies the urbanization effect of population density; , which represents the urbanization effect of space expansion; and both indicate the structural adjustment effect; and both indicate the impacts of logistics technology development on CO2 emissions; and , , and reflect the urbanization effect. Meanwhile, and are constant, and thus their contribution to CO2 change is zero.
According to the additive decomposition proposed by Ang et al. [12,13,14,38] and Zhang et al. [32], we can rewrite Equation (4) to decompose the contribution of the above factors to logistics CO2 emissions change from the base year 0 to the year t, as shown in the Equations (5)–(13):
where , and represent the energy structure effect, freight transportation structure effect, energy intensity effect, and transportation intensity effect on variations of logistics CO2 emissions, respectively. Meanwhile, , and represent the economic growth effect, population density effect, and urban built-up area expansion effect on the logistics CO2 emissions, and they are all used to measure the contribution of urbanization to CO2 emissions. It is worth noting that the freight transportation structure effect () and energy intensity effect () can be further decomposed according to the transport mode, i.e., highways, railways, waterways, and aviation.
2.3. Decoupling Model
In order to realize China’s emission reduction targets and low-carbon development in the logistics industry, it is necessary to explore the decoupling relationship between logistics development and CO2 emissions. In this paper, we build a decoupling model, which combines the Tapio decoupling model with the LMDI decomposition results. The total decoupling index of the logistics development and CO2 emissions can be expressed in Equation (14):
where represents the total decoupling index; means the growth rate of ; implies the growth rate of ; and means the in the logistics industry. According to the definition of decoupling state put forward by Tapio [27], the decoupling degrees can be divided into eight types (see Table 1). However, China’s logistics industry has experienced rapid development since the reform and opening up. Thus , and only four decoupling degrees may occur.

Table 1.
Evaluation criteria for decoupling degree of the total decoupling index.
Equation (14) can be further expressed as Equation (15):
where . The total decoupling index () can be further decomposed into seven sub-decoupling indices to explore what factors affected the decoupling relationship between the logistics development and CO2 emissions. represents the energy structure decoupling index; represents the freight transportation structure decoupling index; means the energy intensity decoupling index; implies the transportation intensity decoupling index. Meanwhile, , , and respectively indicate the influence of economic growth, population density, and urban built-up area expansion on the decoupling relationship. The evaluation of criteria for the influencing effect of the sub-decoupling index on the total decoupling relationship is displayed in Table 2, where represents the sub-decoupling index.
Table 2.
The evaluation of the impacts of the sub-decoupling index on the total decoupling relationship.
2.4. Data Sources
The research period in this paper ranged from 1985 to 2015, which is from the early stage of reform and opening up to the end of the 12th five-year plan, and has witnessed the rapid development of the logistics industry in China. As for energy data, energy statistics in the logistics industry are limited in the China Statistical Yearbook. From previous literature, some studies argued that transport, storage, and communications are important parts of the logistics industry, and used data from transport, storage, and communications to estimate logistics CO2 emissions. Moreover, other studies indicated that transport, storage, and communications accounted for about 90% of the output of logistics in China [19,39,40,41,42]. Therefore, in this paper, we use data from transport, storage, and communications to estimate and analyze the influencing factors of logistics CO2 emissions. Energy includes eight kinds of terminal energy, such as raw coal, crude oil, gasoline, kerosene, diesel oil, and fuel oil, which can be collected from the energy balance sheet in the China Energy Statistics Yearbook 1986–2016 and are measured in 10,000 tons.
To make the estimation more in line with the actual situation of China’s CO2 emissions in the logistics industry, we utilized data that has the local characteristics of China instead of IPCC data [35,43,44]. The average low calorific value (), carbon content per unit calorific value (), carbon oxidation rate (), and the CO2 emissions coefficient of electricity have been obtained from the Guidelines for the Compilation of China Provincial Greenhouse Gas Inventories published by the National Bureau of Statistics [45]. Except for electricity, the CO2 emissions coefficient is calculated by the multiplication of the , the , the , and the molecular weight ratio of carbon dioxide to carbon in this paper; the results of the coefficient calculations are shown in Table 3.
Table 3.
The CO2 emissions coefficient results of main energy.
The unit of freight turnover of each transport mode is 100 million ton-km, which can be obtained from the Yearbook of China Transportation and Communications 1986–2016. The unit of GDP and the value added of the logistics industry is 100 million yuan in 1978 (constant price), which can be collected from the China Statistical Yearbook 1986–2016. The urban population and urban built-up area are measured in 104 persons and km2, which are obtained from the China Statistical Yearbook 1986–2016.
3. Empirical Results and Discussion Analysis
3.1. Decomposition Analysis of CO2 from China’s Logistics Industry
The decomposition results of the logistics CO2 emissions changes from 1985 to 2015 are listed in Table 4. The total CO2 change is attributed to the effect of technological progress, structural adjustment, and urbanization, and some findings are as follows.
Table 4.
The decomposition of energy-related CO2 emissions from China’s logistics industry.
First, CO2 emissions in the logistics industry increased by a factor of 8.4 (737.55 million tons), with an annual rate of 7.86%. Specifically, the urbanization effect is the dominating contributor to the increase of CO2 emissions; it accounted for 828.41 million tons of total logistics CO2 change, which is consistent with the results of Zhang et al. [6]. The structural adjustment effect comes next, which explains about 205.58 million tons, or 27.87% of the increase of CO2 emissions. However, the technological progress effect appears to be the primary inhibiting contributor to CO2 emissions, which can explain 40.19% of the changes in CO2 emissions.
Second, as for the urbanization effect, economic growth () played the most significant role in the total increase of CO2 emissions in the logistics industry. The effect of increased by 506.17 million tons, which contributed approximately 68.63% to CO2 change; this result is in line with Zhang et al. [15]. This is ascribed to the rapid development of China’s economy, which in turn promoted the increase of logistics demand and brought about changes in the lifestyles of the residents, such as the popularization of e-commerce and an increase in demand for express delivery. The urban built-up area expansion factor (), which had a promoting effect during the research period, appeared to be the second contributor to CO2 emissions increase behind . During 1985–2015, the urban built-up area in China rose from 9.39 thousand km2 to 52.10 thousand km2, which caused 492.82 million tons (66.82%) of CO2 changes. In fact, the urban built-up area expansion factor produced the spatial separation of residence and workplaces and the improvement of the complexity of the logistics network, which caused transportation distance increases between the place of production and consumption and the circuitous transportation problems. Moreover, population density () played the second dominating role in the reduction of logistics CO2, which is only next to energy intensity effects (). The cumulative effect of was −170.58 million tons, which contributed −23.13% to the total CO2 change. It should be noted that population density, which is the ratio of urban population and urban built-up area, almost kept declining over the research period; it dropped from 2.67 (10,000 persons per km2) to 1.48 (10,000 persons per km2). Alongside the fast development of urbanization in China, a large number of people moved into urban areas. However, at the same time, the rate of urban area expansion was higher than the growth rate of the population, which in turn resulted in a population density decline. In addition, as mentioned previously, the marked curbing effect of is closely related to the logistics operation scale effect caused by population concentration and the improvement of residents’ awareness regarding energy-saving and emission reductions.
Third, as for the structural adjustment effect, freight transportation structure () presented the third contributor to logistics CO2 increase; this finding is also consistent with previous studies [18,19,28]. From 1985 to 2015, contributed 220.64 million tons, which accounted for 29.92% of the CO2 change. The reason is due to the shift of freight structure during the past decades, and the share of transportation turnover among the four transport modes as detailed in Figure 1. Specifically, the percentage of highways with a higher energy consumption per freight turnover increased remarkably from 9.64% in 1985 to 32.98% in 2015. At the same time, the share of aviation also appeared to have an upward trend, which increased from 0.02% in 1985 to 0.12% in 2015 due to the growing aviation logistics demand for the transportation of fresh products (e.g., flowers, seafood), precision machinery (e.g., the medical machine), business documents, and communication products. However, the proportion of railways decreased between the seventh and the 12th five-year plan periods. Energy structure () played a weak role in inhibiting the increase of CO2 emissions, which can explain about 15.06 million tons or 2.04% of the CO2 changes in the logistics industry. This happened mainly due to the use of clean energy and new energy, as well as changes within the energy structure over the past decades. The energy consumption structure of the logistics industry is shown in Figure 2. During the 1985–2015 periods, the proportion of coal rapidly decreased from 30.38% to 0.97%, a decrease of 29.41%. However, the share of oil has presented an upward trend, which contributed to the increase of CO2 and offset the reduction caused by the coal effect.
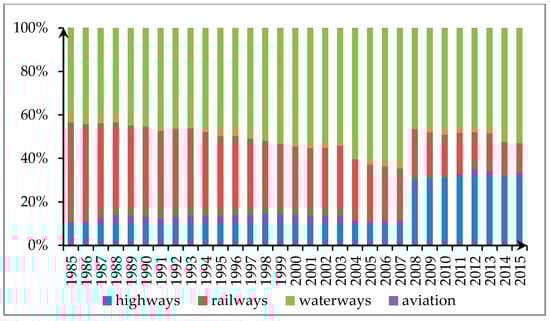
Figure 1.
The share of transportation turnover in the logistics industry.
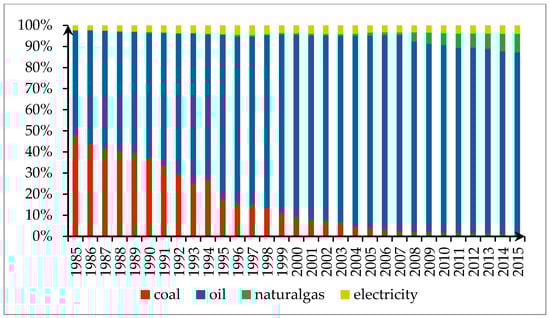
Figure 2.
Energy consumption structure of the logistics industry in China.
Finally, as for the technological progress effect, energy intensity () and freight transportation intensity () were both significant contributors to the reduction of logistics CO2. Specifically, energy intensity, which is the ratio of energy consumption and freight turnover and implies energy efficiency and the application of critical technologies in energy saving [46], was the most dominating factor for the decline in logistics CO2. During the research period, some techniques, such as the application of fuel-saving technologies, were utilized in China, which effectively improved energy efficiency in the logistics industry. Freight transportation intensity (), which means the freight turnover required per unit of economic output, and indicates the application of technologies that improve transport efficiency, was also the primary curbing factor of logistics CO2 decrease. As shown in Figure 3, the curve of the growth rates of GDP had the same trend as the added value of the logistics industry, and they trace each other tightly, which indicates that the logistics industry has played a significant role in economic development from 1985 to 2015. This result is in line with the results of previous literature [17,19]. However, freight transportation intensity declined from 2.5 ton-km·yuan−1 in 1985 to 1.56 ton-km·yuan−1 in 2015, which indicates that the freight turnover required per unit of economic output has decreased, and that transport efficiency has improved. This may be attributed to measures and policies that have been taken in China, such as enhancing route optimization abilities and the standardization level of transportation equipment.
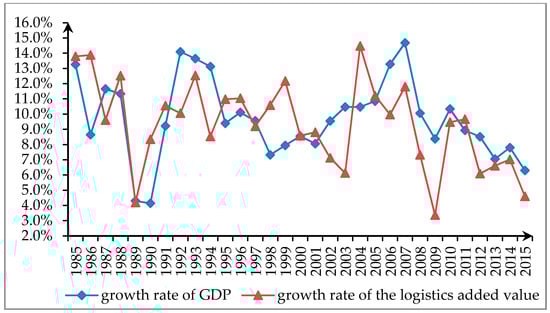
Figure 3.
The growth rates of gross domestic product (GDP) and the logistics added value from 1985 to 2015.
In brief, as shown in Figure 4, economic growth and urban built-up area expansion proved to be the dominating factors for increasing CO2 emissions. Freight transportation structure comes next, which is mainly due to a transport mode shift in China. It should be noted that technological progress effects (i.e., energy intensity and transportation intensity) played a dominant role in inhibiting CO2 increase. Moreover, highway transportation has been proven to be a key objective for reducing CO2 emissions in the logistics industry, and it is a significant contributor to CO2 increase from transport structure. In addition, energy structure, which has great reduction potentials, has so far played only a small role in reducing CO2 emissions.
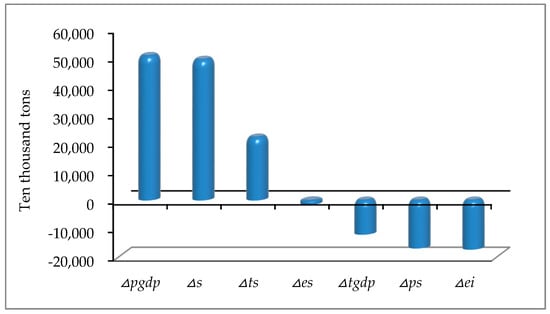
Figure 4.
The energy-related CO2 emission decomposition between 1985 and 2015.
Moreover, this paper further analyzes the decomposition results by five-year plan periods, as displayed in Table 5 and Figure 5. The five-year plan is the plan for the national economy and social development of China launched by the Chinese government. Taking five-year plan periods as intervals can better explain the impacts of the driving factors on logistics CO2 changes over time. Some points were obtained as follows.
Table 5.
The decomposition results of energy-related CO2 emission by time periods.
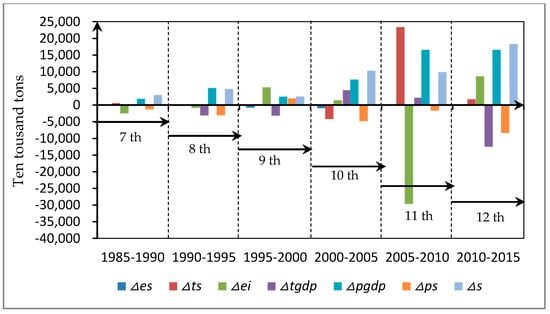
Figure 5.
The decomposition results of CO2 emission in each five-year plan Period.
- From the seventh to the end of the 12th five-year plan period, has kept increasing over the study periods. In particular, the increment of in the 12th five-year period increased slowly compared to the 11th five-year period. During the 12th five-year period, China’s economy entered a new normal state, which means that economic development came into an efficient, low-cost, sustainable, and steady growth stage instead of the traditional extensive growth mode. Therefore, it slowed down energy consumption. Between the 10th and 12th five-year periods, had a significant contribution to the CO2 increase. This may be attributed to the rapid progress of urbanization and expansion of urban areas in China during this period. Besides, by the 2010–2015 period (the 12th five-year plan), had already contributed 48.85% of the total reduction of logistics CO2 caused by the population density factor from 1985 to 2015, which may be attributed to measures in China such as improving the consciousness and ability of residents and employees of logistics enterprises to save energy.
- As for , it only played a curbing role during the eighth, ninth, and 10th five-year periods, which explained 1.35 million tons, 7.06 million tons, and 8.74 million tons, respectively, of the CO2 reduction. The reason is mainly due to the decline in the proportion of coal. During this period, the electric locomotive gradually superseded the steam locomotive, which uses coal as fuel. It also can be observed that during the 12th five-year period, the contribution of to CO2 increase has also been increasing. In this period, the share of oil increased rapidly. At the same time, the proportion of clean energy use, such as compressed natural gas and electricity, was still very low. Besides, during the 11th five-year period, it should be noted that contributed 234.35 million tons to the increase of CO2, which is higher than other periods. This happened mainly due to the fast increase in the proportion of highway freight due to flexibility, which increased from 10.98% in 2005 to 30.59% in 2010. From 2005–2010, a large amount of highway infrastructure was developed in China, which in turn promoted energy consumption.
- During 2005–2010, had a significant contribution to the decline in logistics CO2, which can explain 296.31 million tons of the decrease. It can be seen that during this period, the energy intensity of highways, railways, and waterways almost all showed a downward trend, which indicates that the measures and policies launched by the government, such as encouraging multimodal transportation and the subsidy policy for new energy vehicles, played a promoting role in CO2 reduction. Nevertheless, it should be noted that from 2010–2015, played a negative role in the reduction of CO2. In addition, during the 12th five-year period, had a significant contribution to the reduction of CO2 compared to 2000–2010. During this period, the Ministry of Transport of China focused on the implementation of the standardization of transportation equipment and the construction of a logistics information platform, which to some extent boosted the application of the internet of things, big data technology, and the improvement of the logistics service efficiency of each link.
In addition, this paper further decomposes the energy intensity () and transportation structure factor () according to freight mode, as shown in Table 6, and some findings are as follows.
Table 6.
The impact of energy intensity and freight transportation structure on CO2 emissions.
- When considering energy intensity, highways, railways, and waterways all have a promoting role in the reduction of logistics CO2, which accounted for 99.84% of the CO2 change influenced by energy intensity. Besides, the reduction effects of railways and waterways were greater than those of highways and aviation. In particular, with a series of policies launched for the construction of low-carbon integrated transportation systems, the energy utilization efficiency of highways—that is, with higher energy consumption per freight turnover—was improved for most periods. Since the share of freight turnover by highways is relatively high, a small increase in the energy intensity of highways can result in a noticeable change in the total changes of logistics CO2.
- As for the freight transportation structure, railways played an important role in reducing CO2 emissions. However, highways and aviation played promoting roles during 1985–2015, which contributed 278.71 million tons and 8.98 million tons to CO2 increases, respectively. As analyzed previously, the main reason is attributed to the freight transport modes shift from more energy-efficient modes (i.e., railways, waterways) to less energy-efficient modes (i.e., highways, aviation) due to flexibility and increasing requirements for the timeliness of transportation, particularly during 2005–2010. Notably, the transportation structure effect of waterways has played an apparent promoting role in CO2 reduction during 2005–2010. In 2008, the global financial crisis broke out, and international trade was reduced, which resulted in ocean transportation reduction.
3.2. Decoupling Analysis Based on Decomposition Results
The decoupling relationship between CO2 emissions in the logistics industry and logistics output during 1985–2015 is shown in Table 7 and Figure 6. The logistics industry in China has developed rapidly, and ; thus, only three kinds of decoupling states occurred, as can be seen in Table 7.
Table 7.
The decoupling index of the logistics industry in China.
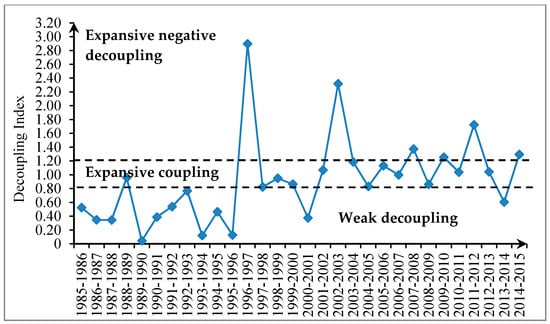
Figure 6.
The decoupling state of the logistics industry for the 1985–2015 period.
During the past three decades, a weak decoupling state and expansive coupling state occurred in 12 years, respectively, and an expansive negative decoupling state appeared in the other six years, which implies that the development of the logistics industry has had a relatively strong dependence on carbon dioxide emissions. As displayed in Figure 6, the variation of decoupling index from 1985 to 2015 can be divided into three stages.
- Before 1997, the relationship between the logistics output and CO2 emissions remained in a weak decoupling state except for 1989; in particular, in 1990, 1994, and 1996, the development of the logistics industry became less dependent on CO2 emissions.
- The second stage is from 1998 to 2003, in addition to 2001 and 2003; expansive coupling appeared in the rest of the years. It can be observed that the relationship between logistics development and CO2 emissions changed from a weak decoupling state that had dominated in the first stage to an expansive coupling state that dominated in the second stage, which implies that the development of the logistics industry had become more dependent on energy consumption.
- The third stage is from 2004 to 2015. Seven years showed an expansive coupling state, and four years showed an expansive negative decoupling state. It can be seen that there was an increase in the number of years within the expansive negative decoupling state in the third stage, which indicates that the growth rate of CO2 is higher than the logistics outputs in recent years. Therefore, in order to achieve the emission reduction target of reducing CO2 emission intensity by 60–65% by 2030 compared to 2005, it is urgent for China to take measures to reduce CO2 emissions and improve the efficiency of energy utilization in the logistics sector.
This paper further decomposes the total decoupling index into seven sub-decoupling indices to analyze what factors have influenced the total decoupling state. The decomposition results for the 1985–2015 period are listed in Table 8, and several results are explained as follows.
Table 8.
The decomposition of the total decoupling index for the 1985–2015 period.
- First, the economic growth effect on the decoupling progress () and the urban built-up area expansion effect on the decoupling progress () are both greater than zero, and they both contributed to the main inhibiting effect on the decoupling relationship. It is suggested that in order to achieve the decoupling between logistics development and CO2 emissions, China has to reasonably plan its urban spatial structure. The spatial separation of residences and workplaces and the increase of transportation distance have played an important role in the increase of logistics CO2 emissions. Therefore, it is urgent for China to rationally plan and develop the new industrial city, constructing a new city with highly concentrated industries and perfect urban function. Second, the value of the energy intensity decoupling effect (), transportation intensity decoupling effect (), and population density decoupling effect () are almost negative, except for a few years, which indicate that , , and played a promoting role in the decoupling relationship, except for several years. It should be noted that played an inhibiting effect on the decoupling progress in the 2000–2005 and 2005–2010 periods, which may be attributed to the low transportation efficiency caused by traffic congestion and the lack of a logistics information platform construction. Finally, played a small inhibiting role in the decoupling relationship, and played a promoting role in the decoupling relationship except for the 1985–1990, 2005–2010, and 2010–2015 periods.
- A more obvious expansive negative decoupling occurred in 1997, as displayed in Table 7, which can be explained by the energy intensity effect on decoupling relationships. In the 1995–2000 period, the energy intensity effect played a dominant role in the CO2 increase. At the same time, it curbed the occurrence of the decoupling relationship. Moreover, obvious expansive negative decoupling also occurred in 2003, 2007, and 2012, and the total decoupling indices were 2.319, 1.373, and 1.723, respectively. In 2003 and 2012, the occurrences of expansive negative decoupling were both attributed to economic growth effects and urban built-up area expansion effects. However, in 2007, the freight structure decoupling index () was a dominating factor for inhibiting the decoupling relationship, which implies that it is important for the government to take measures to achieve traffic avoidance and promote efficiently and profitably freight-shifting from road to other more environmentally-friendly and sustainable modes.
4. Conclusions and Policy Implications
4.1. Conclusions
This paper built an extended LMDI model to decompose the CO2 emission changes of the logistics industry from 1985 to 2015 (from the early stage of the reform and opening up to the end of the 12th five-year plan) through examining the effects of technological progress, structural adjustment, and urbanization. Simultaneously, we further decomposed the effects of energy intensity and freight transportation structures from the aspect of each freight mode. Then, we introduced a decoupling model that combined the decomposition results to analyze whether the development of the logistics was becoming less dependent on CO2 emissions, and determine the main factors that influenced the decoupling state. The contributions of this paper are not only research objectives: we also constructed research models. In addition, the findings of this paper have significant policy implications for energy saving and emission reduction in the logistics industry. The main conclusions are as follows.
- CO2 emissions in the logistics industry increased by 737.55 million tons (8.4 times) during 1985–2015, with an annual rate of 7.86%. Specifically, the urbanization effect proved to be the decisive factor for the increase in CO2 emissions, while the technological progress effect played a significant inhibiting role in CO2 change. In particular, the economic growth and the urban built-up area expansion played a significant role in the increase of logistics CO2, and contributed a total of 999 million tons to CO2 change. Freight transportation structure was the second largest cause for the increase of logistics CO2, which happened mainly due to the freight transportation shift in China. However, energy intensity and transportation intensity, which indicated the impact of the technical application on logistics CO2 change, appeared to be the dominating factors for the decline in CO2 and contributed 23.71% and 16.49%, respectively, to CO2 change. Therefore, the government is advised to make the best use of the two factors to reduce logistics CO2.
- According to the analysis by time periods, the contribution of urban built-up area expansion to CO2 increase has shown a rising trend during the 10th, 11th, and 12th five-year periods; this is mainly due to the rapid progress of urbanization and the increase of transportation distance. Energy intensity had an evident promoting effect on the CO2 increase during the 12th five-year period compared to the 10th and 11th five-year periods, which may be attributed to the energy efficiency decline of the highways between 2010 and 2015. At the same time, energy structure and freight transportation structure played significant promoting roles during the 2005–2015 and 2005–2010 periods, respectively, which was mainly due to the sharp increase in oil consumption and increase in the share of highways and aviation freight transportation in logistics. In particular, the energy structure had great reduction potentials. The emission reduction potential of new energy and clean energy also cannot be ignored. Besides, during the 12th five-year period, transportation intensity contributed 102.70% to the total CO2 decline caused by transportation intensity from 1985–2015, which is closely related to the application of logistics technologies in recent years.
- From the perspective of transport modes, in terms of the energy intensity, the reduction effects of the railways and waterways were greater than those of highways and aviation. Due to the rising proportion of highways, the CO2 emission reduction effect of energy intensity was more sensitive to the improvement of the energy utilization efficiency of highways. Besides, aviation only had a small inhibiting effect on the CO2 increase. When considering the freight transportation structure, due to the transport mode shift from more energy-efficient modes (i.e., railways, waterways) to less energy-efficient modes (i.e., highways, aviation), highways and aviation played dominating promoting roles in CO2 increases. Moreover, the reduction effect of railways and waterways could not be neglected.
- Weak decoupling and expansive coupling states occurred in two-thirds of the research period, and there was an increase in the number of the expansive negative decoupling state in the 11th and 12th five-year periods, which implies that the development of the logistics industry has become more dependent on CO2 emissions. Besides, the energy intensity decoupling effect, transportation intensity decoupling effect, and population density decoupling effect were major promoting factors in the decoupling relationship. Simultaneously, it should be noted that the energy structure decoupling effect played a small promoting role in the decoupling state, and the optimization of the energy structure had great potential for reducing emissions.
4.2. Policy Implications
In order to achieve CO2 emission reduction targets by 2030 in China and ensure that the development of China’s logistics industry becomes less dependent on energy consumption, this paper identified the main influencing factors of logistics CO2 emissions and analyzed the decoupling state between logistics development and CO2 emissions. By the conclusions drawn above, the following policy implications ought to be considered.
- Transform and upgrade the traditional logistics industry. The government is expected to upgrade the logistics industry further from a traditional transportation and warehousing industry to a modern logistics industry that can provide services for the complete supply chain by information technologies and a higher standardization of logistics facilities and equipment. Specifically, some policies (e.g., subsidy) can be adopted to improve service efficiency and the informatization levels of the third party logistics, manufacturing logistics, and commerce trade logistics, which can enhance the energy use efficiency, transportation efficiency, and supply chain management capabilities.
- Accelerate the research and development of key technologies. On the one hand, the government is encouraged to promote the application of energy-saving and sustainable transport equipment (e.g., fuel-saving automatic clutch, new energy vehicles, and the distributed power supply system of trains) to control CO2 emissions and improve energy efficiency. On the other hand, it is advised to increase funding for developing information technologies (e.g., construction of an information platform, cloud computing, intelligent labels, and path optimization technology) to reduce circuitous transportation effectively and improve logistics efficiency, especially regarding highways and aviation. In particular, it is also urged to develop and adopt big data technology to match vehicles and cargos for reducing empty-run rates. Besides, the government should vigorously promote the modernization and standardization of logistics equipment to promote the connection of various transport modes.
- Optimize the energy structure and freight transportation structure. Energy structure played a significant promoting role during 2005–2015, which is mainly due to the sharp increase in oil consumption. Therefore, the government should encourage logistics enterprises to increase the use of new and clean energy such as natural gas, solar energy, and wind power through subsidies and carbon-trading policies. Moreover, the government is advised to learn from the Marco Polo program run by the European Commission. It is urged to shift freight to greener modes such as railways and waterways to mitigate environmental pollution as well as traffic congestion through financial support. Simultaneously, it is urged to encourage the development of intermodal transport and common delivery to ease energy consumption. The Chinese government should strengthen the overloading management to prompt freight shift from road to railways and waterways for economic scale effects.
- Reduce the impact of urbanization on logistics CO2 emissions. The urban built-up area expansion factor produced the spatial separation of the residence and workplaces and the increase of transportation distance, which caused circuitous transportation problems and more fuel consumption. Therefore, the Chinese government has to plan an urban spatial structure reasonably. For example, the government can further plan and develop a new ecological industry city, with a high agglomeration of industries and urban living facilities to ease the traffic congestion caused by commuter traffic. Second, the government should scientifically plan the logistics infrastructure network and strengthen the construction of integrated freight transport hubs to reduce circuitous transportation and achieve efficient connections between different transport modes. Third, it is expected to optimize the structure for the supply chain to reduce unnecessary transportation distances. Fourth, the government should conduct further training to improve the energy-saving abilities of logistics enterprises and publicize the notion of green logistics in the 13th five-year plan period. Meanwhile, economic growth proved to have the most significant role in promoting CO2 emission increases. Thus, the government ought to combine economic policies with energy-conservation and emission-reduction policies (such accelerating the marketization of energy price) to achieve a low-carbon economy in China.
Author Contributions
Shiqing Zhang and Jianwei Wang conceived, designed and wrote the paper; Wenlong Zheng helped to build the extended LMDI approach and construct the decoupling model.
Acknowledgments
The paper is supported by “the National Natural Science Foundation of China” (No. 51278057) and “the Fok Ying-Tong Education Foundation” (No. 151075).
Conflicts of Interest
The authors declare no conflict of interest.
References
- Mi, Z.; Meng, J.; Guan, D.; Shan, Y.; Song, M.; Wei, Y.M.; Liu, Z.; Hubacek, K. Chinese CO2 emission flows have reversed since the global financial crisis. Nat. Commun. 2017, 8, 1712. [Google Scholar] [CrossRef] [PubMed]
- Davis, S.J.; Caldeira, K.; Matthews, H.D. Future CO2 emissions and climate change from existing energy infrastructure. Science 2010, 329, 1330–1333. [Google Scholar] [CrossRef] [PubMed]
- Ozturk, I.; Acaravci, A. CO2 emissions, energy consumption and economic growth in Turkey. Renew. Sustain. Energy Rev. 2010, 14, 3220–3225. [Google Scholar] [CrossRef]
- Holden, R.; Xu, B.; Greening, P.; Piecyk, M.; Dadhich, P. Towards a common measure of greenhouse gas related logistics activity using data envelopment analysis. Transp. Res. Part A Policy Pract. 2016, 91, 105–119. [Google Scholar] [CrossRef]
- Sun, Q. Empirical research on coordination evaluation and sustainable development mechanism of regional logistics and new-type urbanization: A panel data analysis from 2000 to 2015 for liaoning province in china. Environ. Sci. Pollut. Res. 2017, 24, 14163–14175. [Google Scholar] [CrossRef] [PubMed]
- Zhang, T.F.; Yang, J.; Sheng, P.F. The Impacts and Channels of Urbanization on Carbon Dioxide Emissions in China. Chin. J. Popul. Resour. Environ. 2016, 26, 47–57. (In Chinese) [Google Scholar]
- Du, Q.; Wu, M.; Wang, N.; Bai, L. Spatiotemporal characteristics and influencing factors of china’s construction industry carbon intensity. Pol. J. Environ. Stud. 2017, 26, 2507–2521. [Google Scholar] [CrossRef]
- Wang, C.; Wang, F.; Zhang, X.; Yang, Y.; Su, Y.; Ye, Y.; Zhang, H. Examining the driving factors of energy related carbon emissions using the extended stirpat model based on IPAT identity in xinjiang. Renew. Sustain. Energy Rev. 2017, 67, 51–61. [Google Scholar] [CrossRef]
- Mi, Z.; Meng, J.; Guan, D.; Shan, Y.; Liu, Z.; Wang, Y.; Feng, K.; Wei, Y.-M. Pattern changes in determinants of chinese emissions. Environ. Res. Lett. 2017, 12, 074003. [Google Scholar] [CrossRef]
- Rose, A.; Casler, S. Input–output structural decomposition analysis: A critical appraisal. Econ. Syst. Res. 2006, 8, 33–62. [Google Scholar] [CrossRef]
- Malik, A.; Lan, J.; Lenzen, M. Trends in global greenhouse gas emissions from 1990 to 2010. Environ. Sci. Technol. 2016, 50, 4722–4730. [Google Scholar] [CrossRef] [PubMed]
- Ang, B.W.; Liu, F.L. A new energy decomposition method: Perfect in decomposition and consistent in aggregation. Energy 2001, 26, 537–548. [Google Scholar] [CrossRef]
- Ang, B.W. Decomposition analysis for policymaking in energy. Energy Policy 2004, 32, 1131–1139. [Google Scholar] [CrossRef]
- Ang, B.W. The LMDI approach to decomposition analysis: A practical guide. Energy Policy 2005, 33, 867–871. [Google Scholar] [CrossRef]
- Zhang, Y.J.; Da, Y.B. The decomposition of energy-related carbon emission and its decoupling with economic growth in china. Renew. Sustain. Energy Rev. 2015, 41, 1255–1266. [Google Scholar] [CrossRef]
- Akbostancı, E.; Tunç, G.İ.; Türüt-Aşık, S. CO2 emissions of turkish manufacturing industry: A decomposition analysis. Appl. Energy 2011, 88, 2273–2278. [Google Scholar] [CrossRef]
- Mraihi, R.; Abdallah, K.B.; Abid, M. Road transport-related energy consumption: Analysis of driving factors in tunisia. Energy Policy 2013, 62, 247–253. [Google Scholar] [CrossRef]
- Zhu, X.; Li, R. An analysis of decoupling and influencing factors of carbon emissions from the transportation sector in the beijing-tianjin-hebei area, china. Sustainability 2017, 9, 722. [Google Scholar] [CrossRef]
- Dai, Y.; Gao, H.O. Energy consumption in china’s logistics industry: A decomposition analysis using the lmdi approach. Transp. Res. Part D Transp. Environ. 2016, 46, 69–80. [Google Scholar] [CrossRef]
- Bauer, J.; Bektaş, T.; Crainic, T.G. Minimizing greenhouse gas emissions in intermodal freight transport: An application to rail service design. J. Oper. Res. Soc. 2010, 61, 530–542. [Google Scholar] [CrossRef]
- Burnett, J.W.; Bergstrom, J.C.; Wetzstein, M.E. Carbon dioxide emissions and economic growth in the U.S. J. Policy Model. 2013, 35, 1014–1028. [Google Scholar] [CrossRef]
- Begum, R.A.; Sohag, K.; Abdullah, S.M.S.; Jaafar, M. CO2 emissions, energy consumption, economic and population growth in malaysia. Renew. Sustain. Energy Rev. 2015, 41, 594–601. [Google Scholar] [CrossRef]
- Jahangir Alam, M.; Ara Begum, I.; Buysse, J.; Van Huylenbroeck, G. Energy consumption, carbon emissions and economic growth nexus in bangladesh: Cointegration and dynamic causality analysis. Energy Policy 2012, 45, 217–225. [Google Scholar] [CrossRef]
- Bloch, H.; Rafiq, S.; Salim, R. Coal consumption, CO2 emission and economic growth in china: Empirical evidence and policy responses. Energy Econ. 2012, 34, 518–528. [Google Scholar] [CrossRef]
- Alam, M.J.; Begum, I.A.; Buysse, J.; Rahman, S.; Van Huylenbroeck, G. Dynamic modeling of causal relationship between energy consumption, CO2 emissions and economic growth in india. Renew. Sustain. Energy Rev. 2011, 15, 3243–3251. [Google Scholar] [CrossRef]
- Hu, J.; Gui, S.; Zhang, W. Decoupling analysis of china’s product sector output and its embodied carbon emissions—An empirical study based on non-competitive I-O and tapio decoupling model. Sustainability 2017, 9, 815. [Google Scholar] [CrossRef]
- Tapio, P. Towards a theory of decoupling: Degrees of decoupling in the eu and the case of road traffic in finland between 1970 and 2001. Transp. Policy 2005, 12, 137–151. [Google Scholar] [CrossRef]
- Wu, J.G.; Ye, A.Z. Dynamic Linkages among Transportation, Economic Growthand Carbon Emissions in China: Empirical Research on theData from 1949 to 2012. J. Transp. Syst. Eng. Inf. Technol. 2015, 15, 10–17. (In Chinese) [Google Scholar]
- McKinnon, A.C. Reducing energy consumption and emissions in the logistics sector. In Energy, Transport, & the Environment, 1st ed.; Springer: Berlin, Germany, 2012; Chapter 29; pp. 521–537. [Google Scholar]
- Tang, S.; Wang, W.; Yan, H.; Hao, G. Low carbon logistics: Reducing shipment frequency to cut carbon emissions. Int. J. Prod. Econ. 2015, 164, 339–350. [Google Scholar] [CrossRef]
- Zając, P. The idea of the model of evaluation of logistics warehouse systems with taking their energy consumption under consideration. Arch. Civ. Mech. Eng. 2011, 11, 479–492. [Google Scholar] [CrossRef]
- Zhang, M.; Mu, H.; Ning, Y.; Song, Y. Decomposition of energy-related CO2 emission over 1991–2006 in china. Ecol. Econ. 2009, 68, 2122–2128. [Google Scholar] [CrossRef]
- Mi, Z.; Wei, Y.M.; Wang, B.; Meng, J.; Liu, Z.; Shan, Y.; Liu, J.; Guan, D. Socioeconomic impact assessment of china’s CO2 emissions peak prior to 2030. J. Clean. Prod. 2017, 142, 2227–2236. [Google Scholar] [CrossRef]
- Mi, Z.; Zhang, Y.; Guan, D.; Shan, Y.; Liu, Z.; Cong, R.; Yuan, X.-C.; Wei, Y.-M. Consumption-based emission accounting for chinese cities. Appl. Energy 2016, 184, 1073–1081. [Google Scholar] [CrossRef]
- Zhang, S.; Wang, J.; Zheng, W. Spatio-temporal difference of transportation carbon emission and its influencingfactors in china. Acta Sci. Circumst. 2017, 37, 4787–4797. (In Chinese) [Google Scholar]
- Kaya, Y. Impact of Carbon Dioxide Emission Control on GNP Growth: Interpretation of Proposed Scenarios. In Proceedings of the IPCC Energy and Industry Subgroup, Response Strategies Working Group, Paris, France, September 1990. [Google Scholar]
- Shahbaz, M.; Loganathan, N.; Muzaffar, A.T.; Ahmed, K.; Ali Jabran, M. How urbanization affects CO2 emissions in malaysia? The application of stirpat model. Renew. Sustain. Energy Rev. 2016, 57, 83–93. [Google Scholar] [CrossRef]
- Ang, B.W.; Liu, F.L.; Chew, E.P. Perfect decomposition techniques in energy and environmental analysis. Energy Policy 2003, 31, 1561–1566. [Google Scholar] [CrossRef]
- Liu, N.; Yan, L.I. Interaction between logistics development and economic growth in china. J. Ind. Eng. Eng. Manag. 2007, 21, 151–154. [Google Scholar]
- Zhang, L.G.; Li, D.; Gong, A.Q. Dynamic Changes in Total Factor Energy Efficiency and Regional Disparity in the Logistics Sector in China. Resour. Sci. 2015, 37, 754–763. (In Chinese) [Google Scholar]
- Zhang, D.; Zhan, Q.; Chen, Y.; Li, S. Joint optimization of logistics infrastructure investments and subsidies in a regional logistics network with CO2 emission reduction targets. Transp. Res. Part D Transp. Environ. 2018, 60, 174–190. [Google Scholar] [CrossRef]
- Ma, Y.Y. Study on the spatial spillover effect of total factor productivity in China’s regional logistics industry under low carbon perspective. Macroeconomics 2016, 12, 90–101. (In Chinese) [Google Scholar]
- Zhang, T.; Zeng, A. Spatial econometrics analysis on china transport carbon emissions. Urban Dev. Stud. 2013, 20, 14–20. (In Chinese) [Google Scholar]
- Cong, J.; Zhu, J.; Chen, N.; Liu, X. Comparison of carbon emissions accounting methods and case studies of urban energy-related carbon emissions in china: Based on the perspective of ‘emission factors’ and ‘activity level data’. Urban Probl. 2014, 3, 5–11. (In Chinese) [Google Scholar]
- Climate Change Division of National Development and Reform Commission. Guidelines for the Compilation of China Provincial Greenhouse Gas Inventories; China Environmental Press: Beijing, China, 2014. [Google Scholar]
- Wang, Y.F.; Li, K.P.; Xu, X.M.; Zhang, Y.R. Transport energy consumption and saving in china. Renew. Sustain. Energy Rev. 2014, 29, 641–655. [Google Scholar] [CrossRef]
© 2018 by the authors. Licensee MDPI, Basel, Switzerland. This article is an open access article distributed under the terms and conditions of the Creative Commons Attribution (CC BY) license (http://creativecommons.org/licenses/by/4.0/).