1. Introduction
Energy stored in fossil fuels that is released by human activity causes environmental pollution. Furthermore, fossil fuel energy resources are exhaustible, and alternatives will be needed in the near future. On the other hand, renewable energy resources are clean and cannot be depleted [
1]. Photovoltaic energy is one of the most sustainable forms of energy, as it harvests energy from the sun. It is silent, ecological, local, and economically feasible. So, market expansion in PV technologies has rapidly increased due to reduced initial capital investment in addition to the urgency of realizing energy access in remote areas, as this technology does not require transmission lines. In essence, PV technology promotes sustainable local energy generation.
The published literature is rich with research projects studying PV energy. In Reference [
2], a stochastic method is involved in order to size an off-grid PV system with energy storage. This includes Markov chain and beta probability density function (pdf). The stochastic results are compared with a deterministic method. The stochastic solution provides more reliable and realistic results. In Reference [
3], an off-grid PV/diesel battery is discussed and designed for a village in Russia as a case study. The levelized cost of energy (LCOE) and the CO
2 emissions are calculated to indicate the economical and the environmental feasibility of the proposed configuration. Results show savings in both fuel and oil cost (7.8%) and emissions (51.0%) compared with a conventional fossil fuel plant. The authors of Reference [
4] evaluated the investment in a multi-site photovoltaic plant as a profitability analysis with an objective to maximize the net return. In a techno-economic study [
5], numerous PV configurations are investigated. The LCOE is calculated, which includes capital cost, as well as operation and maintenance costs over the project lifetime. Also, the economic impacts of using batteries or not are discussed. In Reference [
6], a stochastic programming model for the optimal scheduling of a distributed energy system with multiple energy devices including renewables, considering economic and environmental aspects, is presented. The results give the optimized operation strategies which reduce the expected energy costs and CO
2 emissions. In Reference [
7], the authors discuss the feasibility of a grid-connected rooftop/building integrated photovoltaic system for the electrification of consumption with incorporating feed-in tariffs/net metering process regulation in New Delhi, India.
Jordan’s area is about 89,200 km2, with 80% of its 9.5 million inhabitants living predominantly in urban centers in the northwest of the country in areas that amount to approximately 10% of the total available land. As 96% of all energy in Jordan is imported, the country is highly affected by the cost of energy imports, which have been a major burden on its economy. Volatile fuel prices are expected to cost Jordan $3.21 billion annually, representing 19.5% of the GDP. This has a financial impact on the country, as well as a political impact. In particular, Jordan’s potential for renewable energy is significant, but its generation represents less than 5% of current electrical energy production.
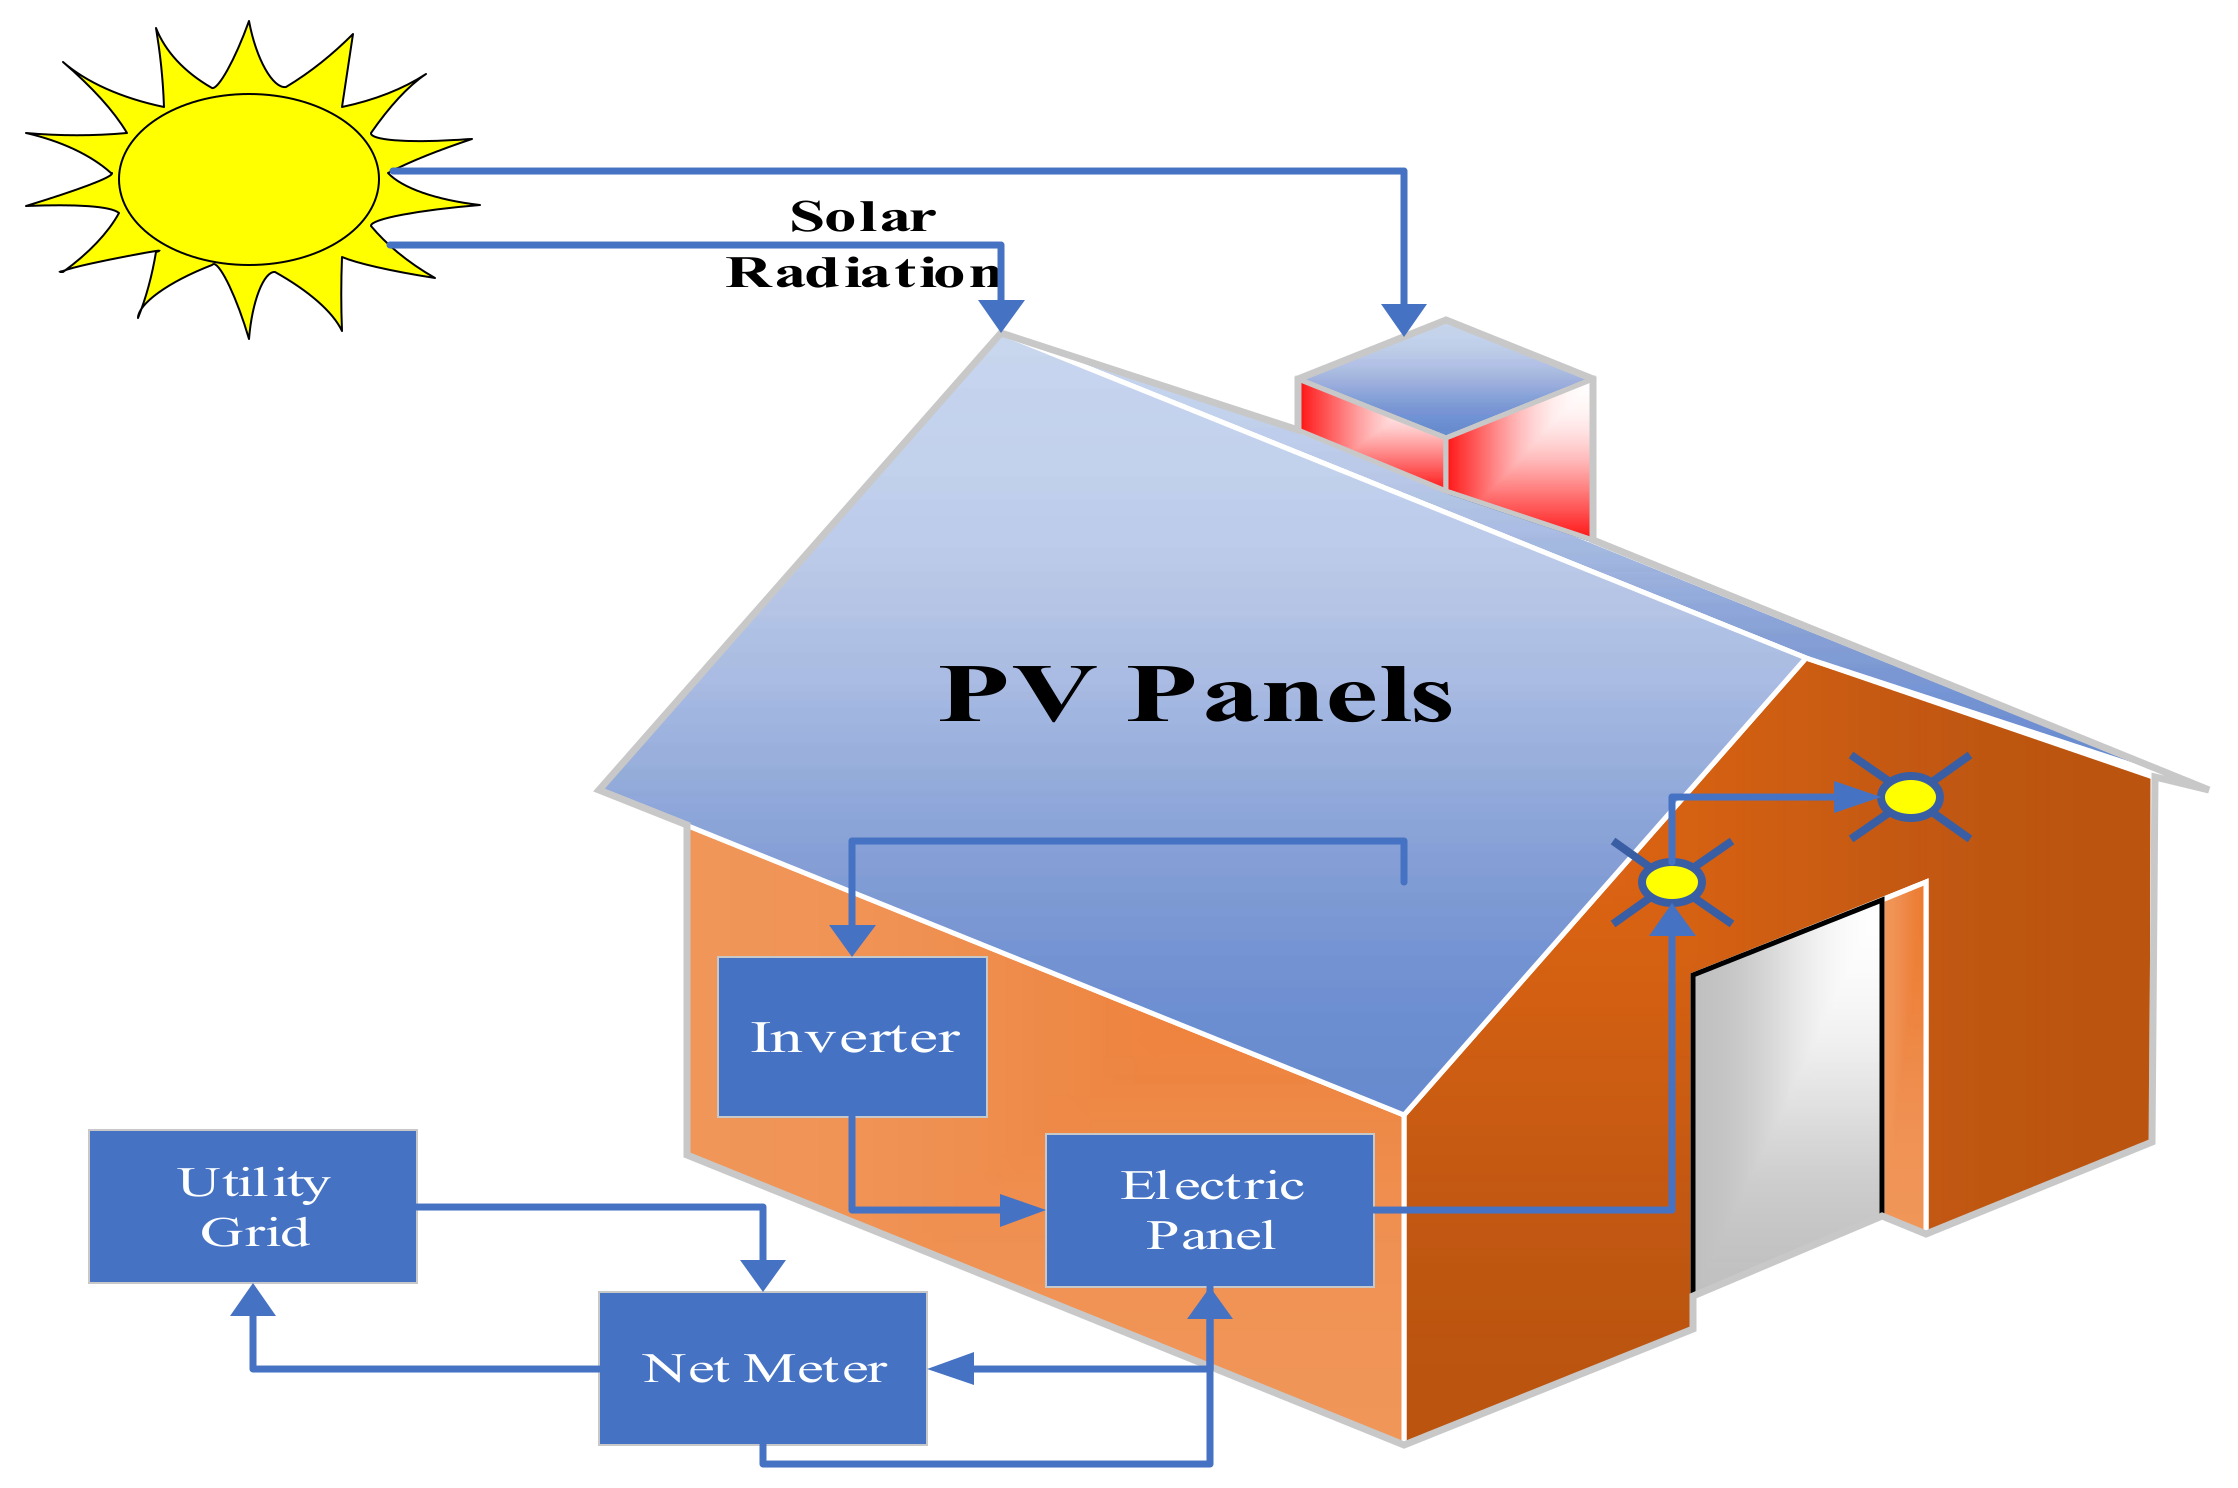
To encourage the deployment of renewable energy systems, the government has approved a net-metering scheme, as shown in
Figure 1 below. This scheme employs a net-meter, which in essence is a bidirectional kWh counter. Any excess energy generated by the system that is not consumed locally at the load is injected into the grid, and at the end of a specific contract period, the net consumption is billed. In Jordan, the contract period is annual, which allows consumers to generate excess energy during the high radiation summer months that can later be retrieved during low generation winter months.
This is especially true for large universities such as Jordan University of Science and Technology (JUST), which are considered large energy consumers. JUST consumed 33.4 GWh in 2016, at a cost of $12.25 million, which represents 12% of the university’s annual budget. This is a huge burden that affects potential development and expansion of the university.
Universities and institutes of higher education are expected to be community role models and lead change in their local surroundings. This is especially true for developing countries were universities house unique intellect and expertise. The United Nations Decade of Education for Sustainable Development (2005–2014) resulted in more attention being directed toward higher education institutions and the sustainability of their operations. In addition students, alumni, and governments are pressuring universities to lead local, national, and international efforts toward increased integration of renewable energy.
In this paper, a full optimized PV system design for JUST is presented. In
Section 2, detailed mathematical modeling of the proposed system is presented.
Section 3 provides a complete PV plant sizing procedure which is implemented as a stochastic optimization problem solved using a scenario aggregation technique. The case study of the PV plant at JUST is considered and a detailed design of the PV plant, which includes its main components, is illustrated in
Section 4. In
Section 5, a detailed financial and environmental benefit analysis of the suggested PV plant is presented. Finally,
Section 6 draws conclusions and shows the financial and environmental feasibility of the proposed system.
3. PV Plant Sizing Procedure
In this section, a mathematical formulation of the proposed system will be presented for optimization. The objective function measures the total cost of the proposed system, which is the capital cost of the installed PV plants. The optimization problem constraints are as follows: the energy generated from the PV plant is equal to load requirements, and the total PV plant area is less than the dedicated land area at JUST. It is assumed that load will be fully supplied by the PV plant, which will result in zero energy consumption from the grid. The optimization problem is proposed as a stochastic optimization problem to find the optimal size of PV plant needed to minimize the cost of the system and to meet the problem constraints.
The total system cost is a function of the PV plant size, since as the installed capacity increases the total system capital cost increases. As shown in Equation (1), the total energy generated from the PV plant can be expressed as in (8):
where
EPV is the total energy generated from the PV plant in MWh,
SPV is the plant size in MW,
i is the index of the time step, and
ti is the time step in hours. The problem constraints mentioned above are shown in (9) and (10), respectively.
where
Dyr is the total energy demand for one year,
ti is one hour, and
Amax is the available area in m
2.
Since the problem has stochastic variables, a stochastic optimization technique must be applied. In the published literature, different methodologies of stochastic optimization have been suggested to solve problems with uncertainties. In Reference [
15], a stochastic optimal sizing of a rural mini-grid composed by a photovoltaic (PV) plant, lithium battery storage, a diesel generator, and a fuel tank is proposed. The problem is formulated as an optimization problem to minimize the net present cost of the mini-grid components. A particle swarm optimization (PSO) procedure integrated with Monte-Carlo simulation is used to solve the optimization problem. PSO is used in Reference [
16] to find the optimal hybrid PV/wind configuration. However, in this paper, a simpler scenario aggregation approach for stochastic optimization, which is presented in Reference [
17], is used to solve the optimization problem. The main advantage of this method is that it is able to capture system uncertainties in addition to being simple to implement. The mathematical model for the stochastic optimization is shown in (11):
where scenario
s is assigned with probability
ps. The optimal solution of this problem is denoted by
x*. In the optimization problem of the proposed system represented by (8)–(10), the scenario
s involves solar radiation
SIi and ambient temperature
TCi. The optimal solution
x* is the optimal size of the PV plant
SPV. The scenarios are assumed to be uniformly distributed, therefore
ps is the reciprocal of the total simulated scenarios (
ns) as in (12):
Then, the optimal solution of the stochastic optimization problem given in (11) can be approximated over
ns simulated scenarios by (13), as shown in the scenario aggregation methodology [
17].
where
xs is the optimal solution for scenario
s. The convergence is verified by limiting the coefficient of variation (
COV) of the optimal vector of solutions
x*, as shown in (14):
where
σs is the standard deviation and
µs is the mean of the vector of solutions
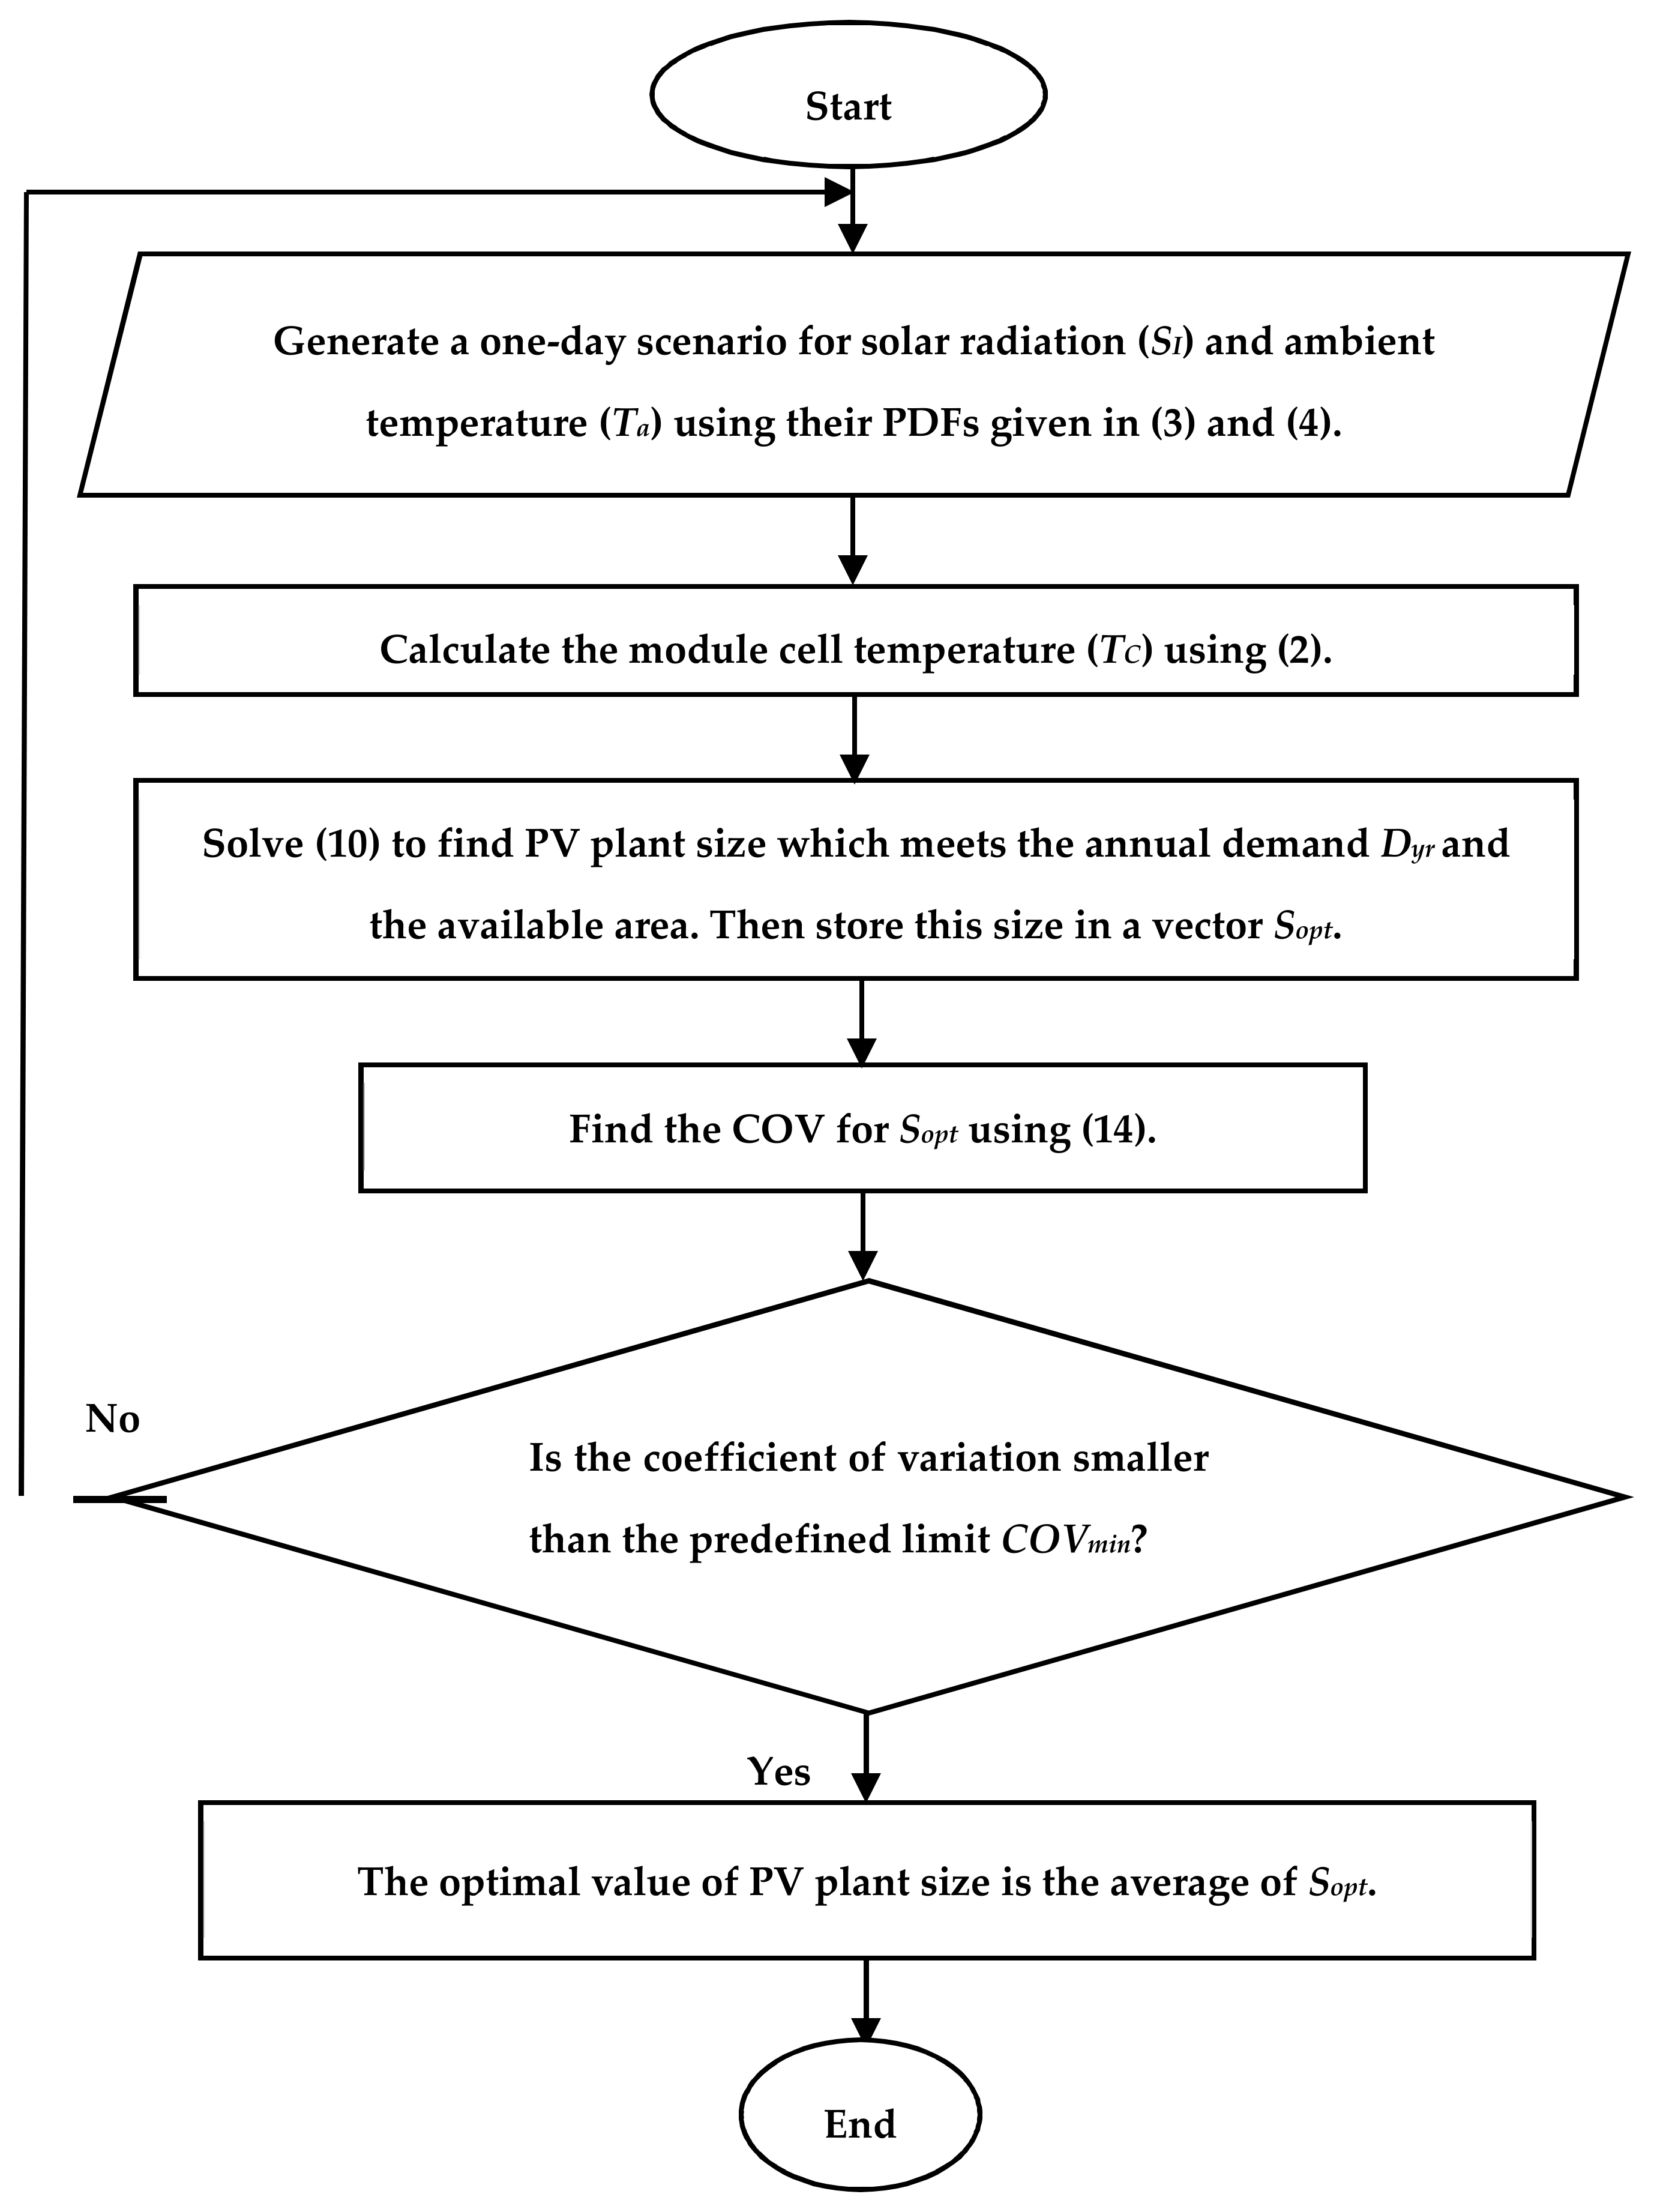
x*. Solving the optimization problem gives the optimal size of the PV plant needed to minimize the system cost (i.e., PV plant size in (8)) and meet the problem constraints defined in (9) and (10). The PV plant sizing procedure can be summarized by the flow chart shown in
Figure 2.
4. Case Study and PV Plant Design
4.1. Case Study
In this case study, the plan of a grid-connected PV plant in JUST is presented. It is worth noting that licensing for renewable energy projects in Jordan is done through the Energy and Minerals Regulatory Commission (EMRS). The latest regulations governing large net-metering project only allow installing a PV system to meet demand, and no oversizing is allowed. A license is only granted after a thorough review of annual consumption analysis, and at the end of the billing year any excess generation is forfeit. An overview of JUST is shown in the following discussion.
4.1.1. About JUST
JUST is a comprehensive, state-supported university located on the outskirts of Irbid. It was established in 1986. Today, JUST has more than 1000 full-time faculty members, with 24,000 undergraduate and 1800 graduate students, in contrast to 2300 students in the 1986/1987 academic year. This increase has led to increased construction and the establishment of more facilities to conform to JUST’s ambitious strategy to extend all possible means to ensure distinctive graduates. This, in turn, has driven the energy demand of JUST to higher levels.
4.1.2. Energy Demand
Due to the rapid increase in the JUST community, more energy resource planning is needed to meet the increasing demand. However, energy resource planning requires careful load study to ensure that the installed capacity of the suggested power system is sufficient to meet the load demand. Therefore, a thorough investigation of JUST’s energy demand during the last five years was conducted and the results are summarized in
Table 1. This table shows the monthly electricity demand of JUST during the last five years. The main contributors to electricity consumption at JUST are the air conditioning, lighting, and water pumping systems, in addition to other minor applications.
As can be seen in the table, the energy demand decreased from September 2014 through April 2015. This is predominately due to the implementation of an energy efficiency program at the university. Building operations implemented a temperature control strategy for all air conditioning systems and installed motion sensors in bathrooms and hallways for lighting control. The increase in consumption afterward is due to the commission of a new building at the university.
4.1.3. Solar Radiation and Temperature
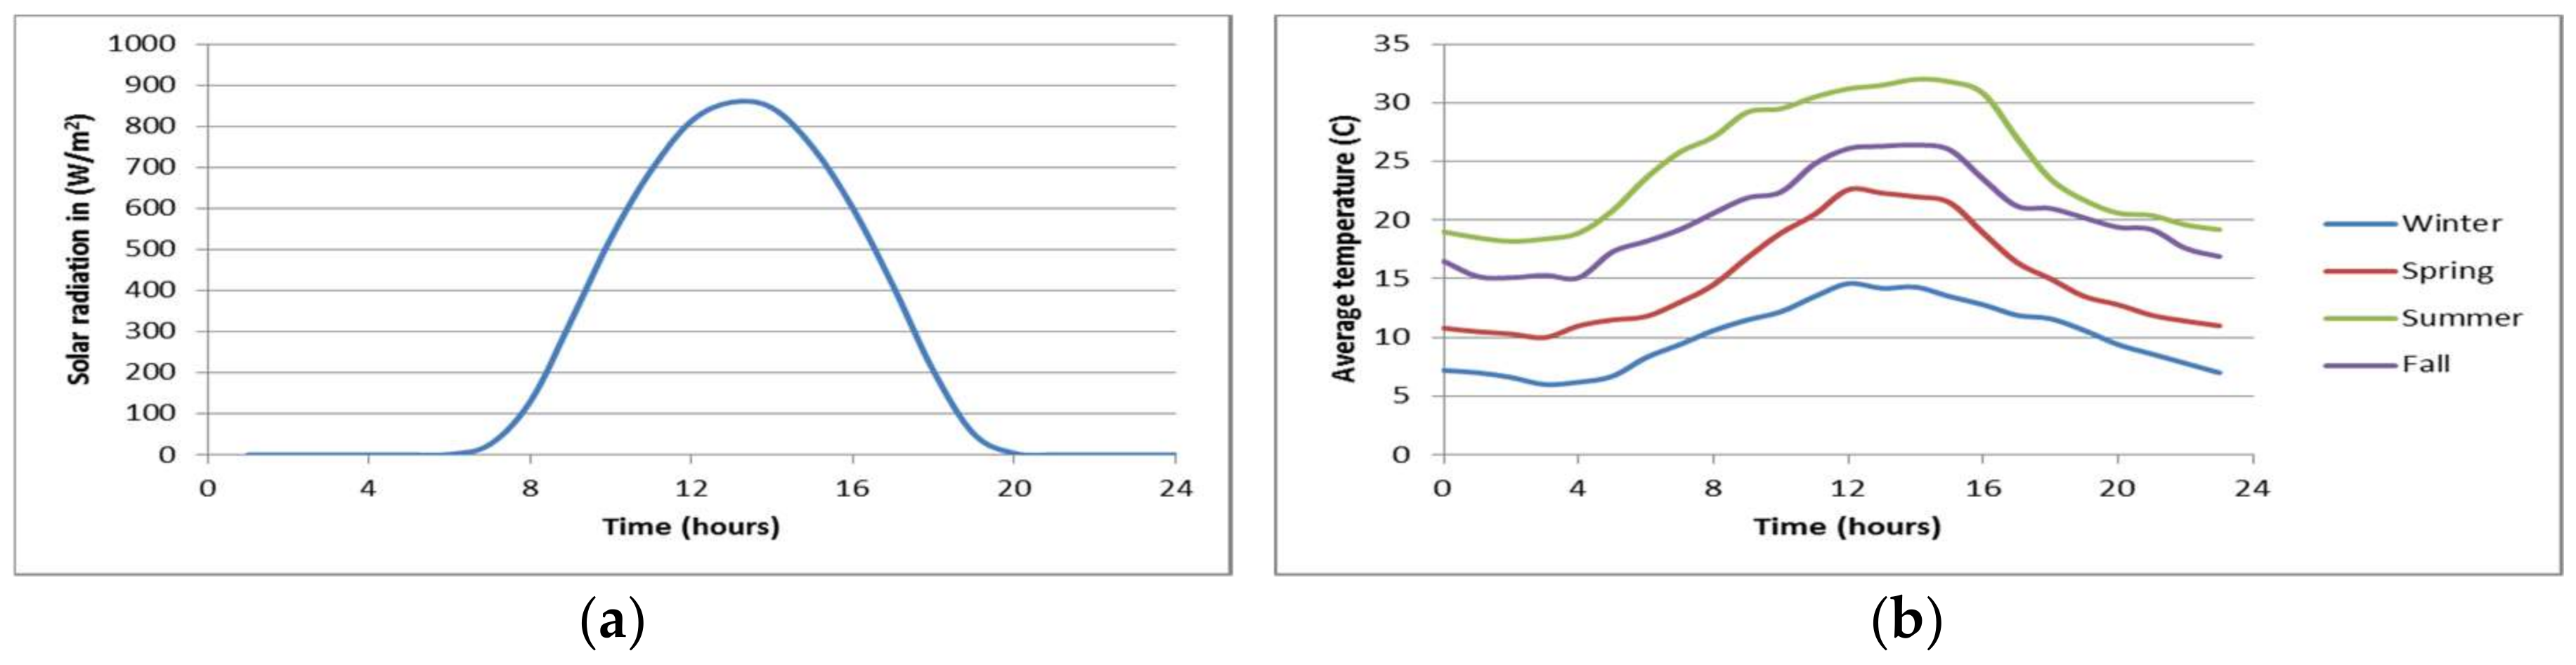
Jordan has, in general, a hot, dry climate characterized by long, hot, dry summers and short, cool winters. The summer season, from late April to October, is hot and dry, with high temperatures averaging around 32 °C. The winter, lasting from November to March, is relatively cool, with high temperatures averaging around 13 °C [
18]. The solar radiation at JUST’s location (32.4950437, 35.989037) is abundant for most of the year, whereas cloudy days amount to less than 10% of the year. One year of solar radiation and ambient temperature data averaged over a one-hour time interval were obtained from the weather station at JUST. The data are shown in
Figure 3 below.
4.2. Simulation Results
The uncertainties in solar radiation and ambient temperature were modeled using Beta and Normal probability distribution functions. These PDFs were built using one year of historical data (2016) that were collected from JUST’s weather station. The mean and standard deviation for each time step were calculated. Then, Beta and Normal distributions were created for each time segment of each day as described in
Section 2. The available area for the PV plant at JUST is 250,000 m
2.
The parameters of the optimization procedure presented in
Section 3 were chosen such that
ns = 5000, and
COVmin = 0.05. After running the PV plant sizing procedure, illustrated in
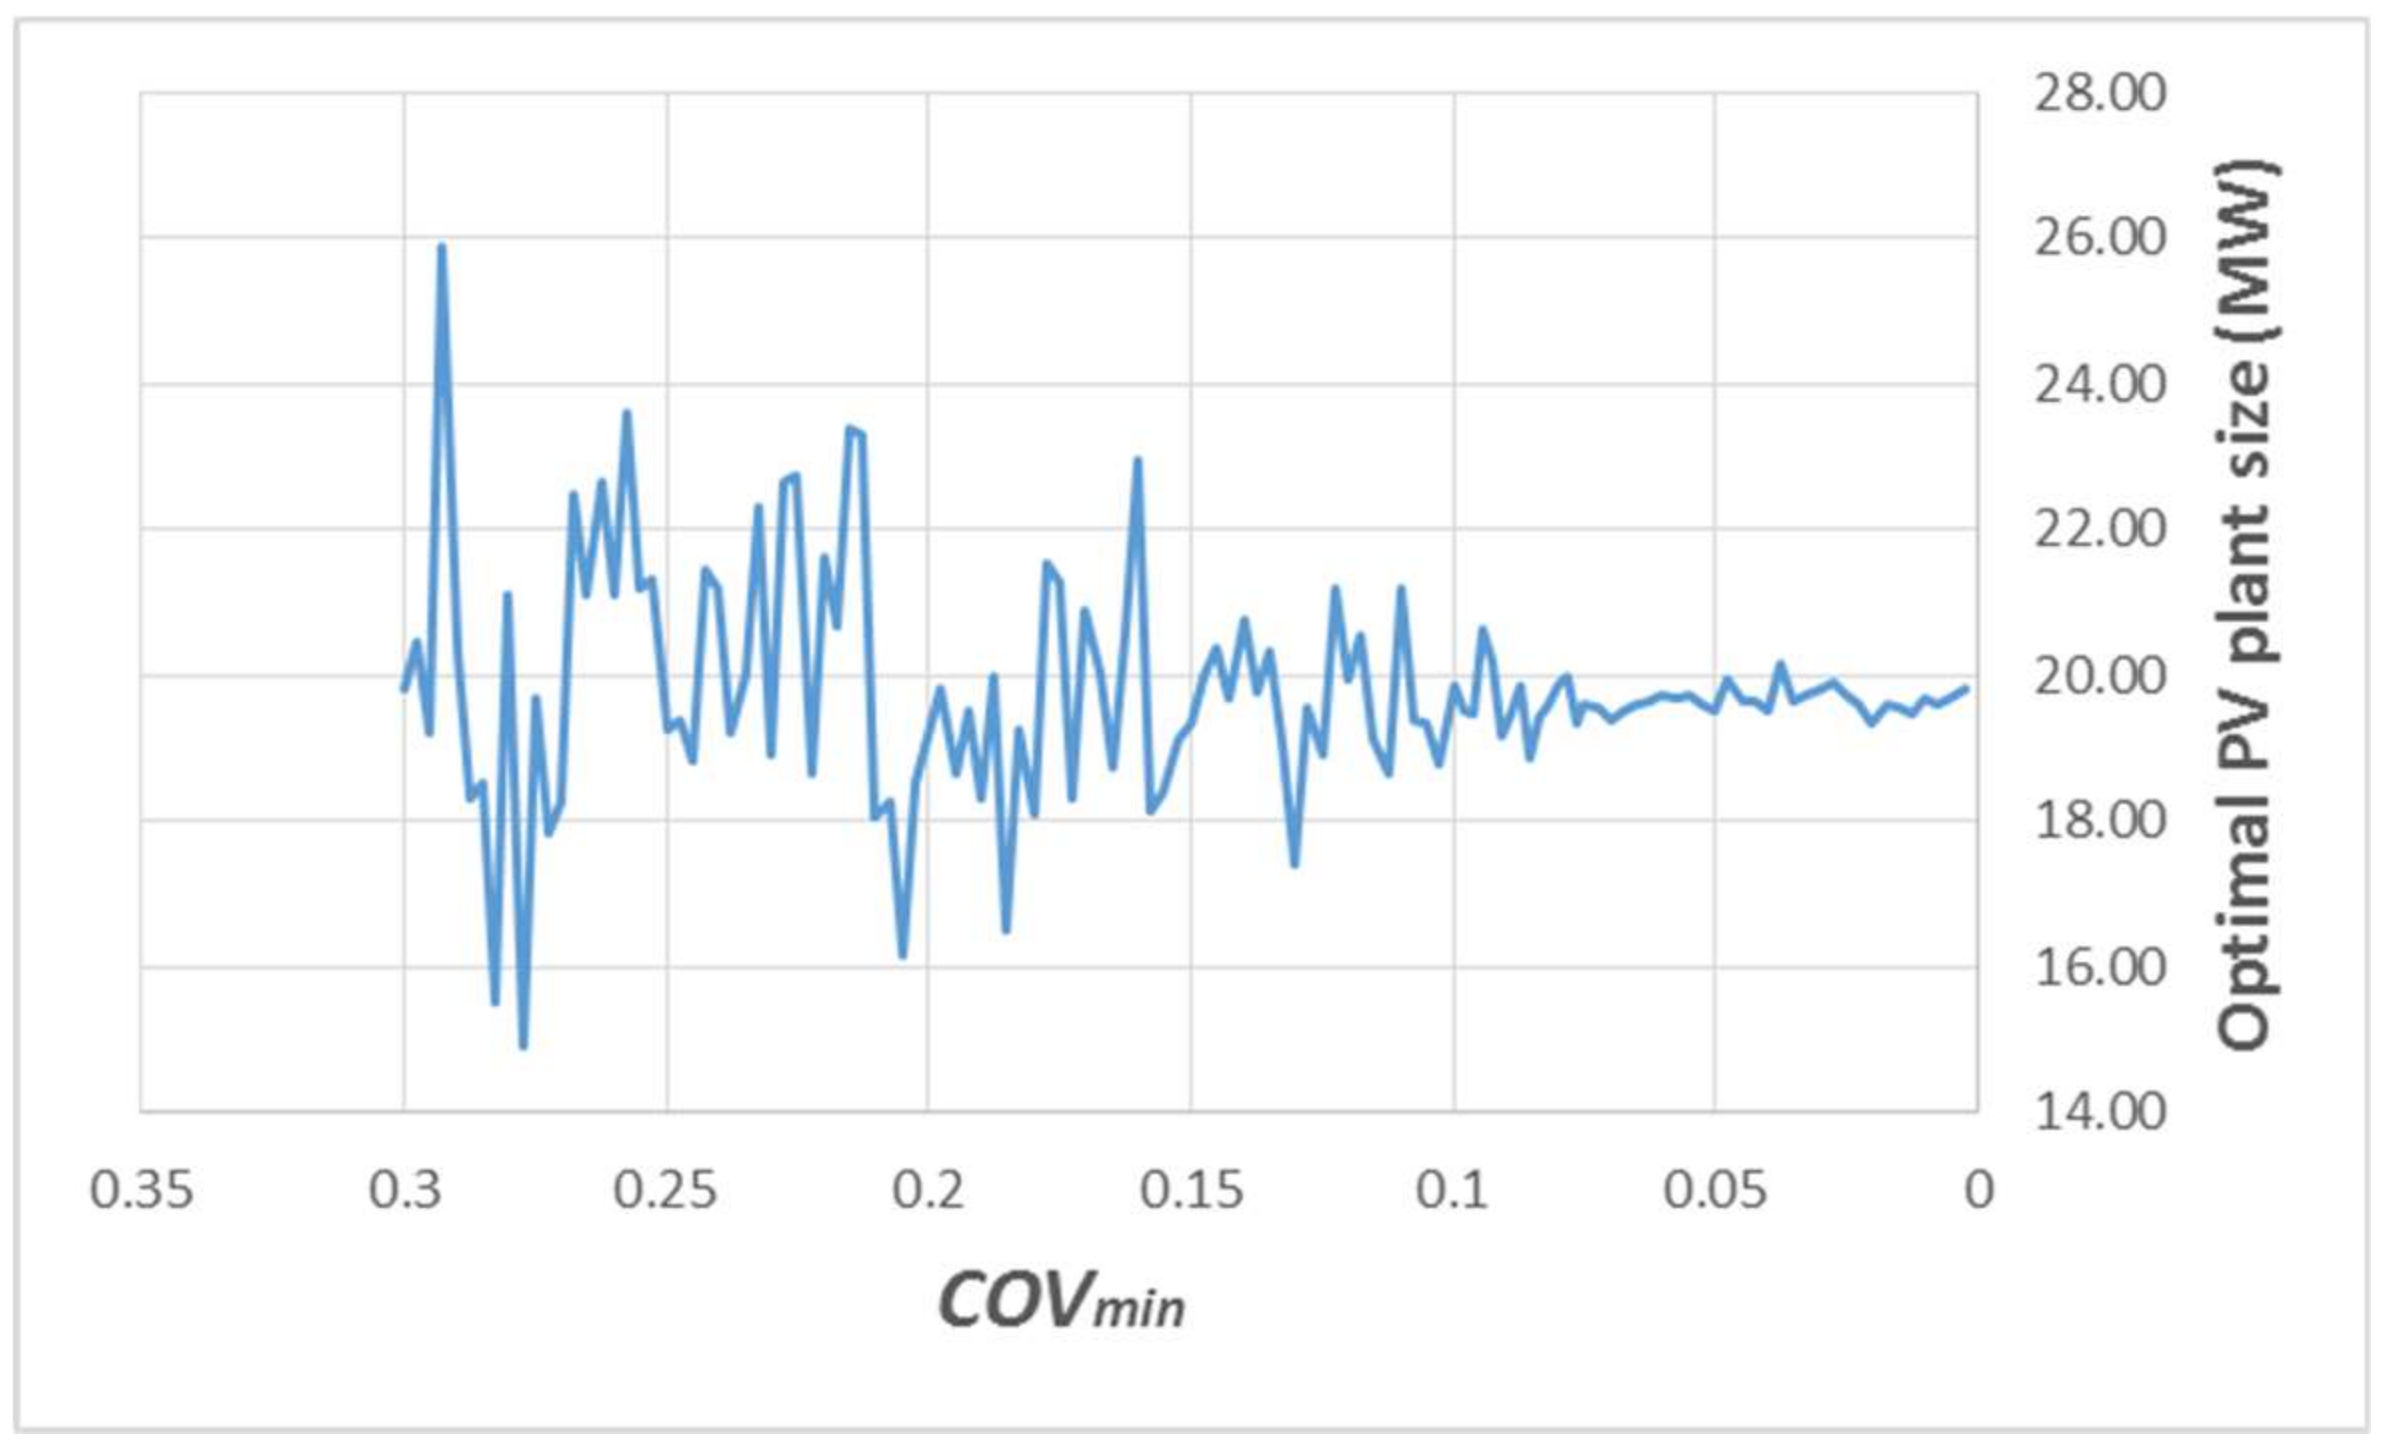
Figure 4, on MATLAB with these selected parameters, the optimal size of the PV plant was found to be 19.64 MW. However, this installed DC capacity does not include electrical losses in the transformer, inverters, or the cables, which are presented in the next subsection.
The accuracy of the solution obtained from the PV plant sizing procedure depends on the number of the sampled scenarios (
ns) and the coefficient of variation (
COVmin). As the
COVmin gets smaller, the number of the required samples increases and the accuracy of the optimal solution increases.
Figure 4 shows the relationship between
COVmin and optimal PV plant size.
4.3. PV Plant Design
JUST is supplied from the national electric grid by Irbid District Electricity Company (IDECO) through three dedicated 33 kV feeders, namely: Techno1, Techno2, and Hassan. A grid impact study (GIS) was carried out by IDECO to assist the suitability of the connecting grid to handle connecting the PV system with a net-metering scheme. It was found that, due to reverse current limits, all three feeders must be utilized to connect the PV system. The connection scheme recommendation was 8 MWp on Techno1, 8 MWp on Techno2, and 4 MWp on Hassan. Therefore, it was decided to divide the plant into five equal zones of 3.928 MWp, with each zone supplying a separate circuit to the associated 33 kV bus. This required five transformers rated at 5 MW. As transformer efficiency is best at 80% loading, and transformer loss calculations are not easily computed. This is due to the fact that the rated PV generation only occurs for a short time during daytime generation. This dictates that the worse-case transformer efficiency should be used for calculations. According to PVSYST, one of the leading PV system simulation software, the major transformer losses that affect PV system design include iron losses, ohmic losses, and night disconnect. This may be estimated to approximately 1% of transformer rating. In our case, this results in 1.3% of the PV plant size.
According to utility standards, MV power cable losses should not exceed 1% of power. The GIS also requires a wide range of power factor (PF) control, which is implemented by the inverters. Top of the line on-grid inverters, that have a wide range of PF set points, have an efficiency of 98.5%. Therefore, the plant should be oversized by 3.8% to meet load demand. The new system size is 20.39 MWp, with a new zone size of 4.08 MWp.
Jenko Solar “JKM265P-60” PV modules were chosen for this project. Jenko has been constantly ranked over the past few years by Bloomberg as a Tier 1 PV module manufacturer. The Jenko PV panel parameters are given in
Table 2.
The SMA Solar Technology “STP 60-10” inverter is chosen for this design. SMA is chosen as it is the lead PV inverter technology in the Jordanian market. This inverter requires a DC input voltage in the range of 565–1000 V
dc with 60 kW rated power. As each of the zones is identical. Thus, for a total generation capacity of 20.39 MW
p, 68 inverters are required per zone. Each inverter requires modules arranged in series and parallel combinations to meet inverter voltage and power demands. Each PV string was chosen to consist of 24 modules with a string voltage of 753.6 V, which ideally lays in the middle of the inverter voltage range. Each string provides a peak power of 6144 W
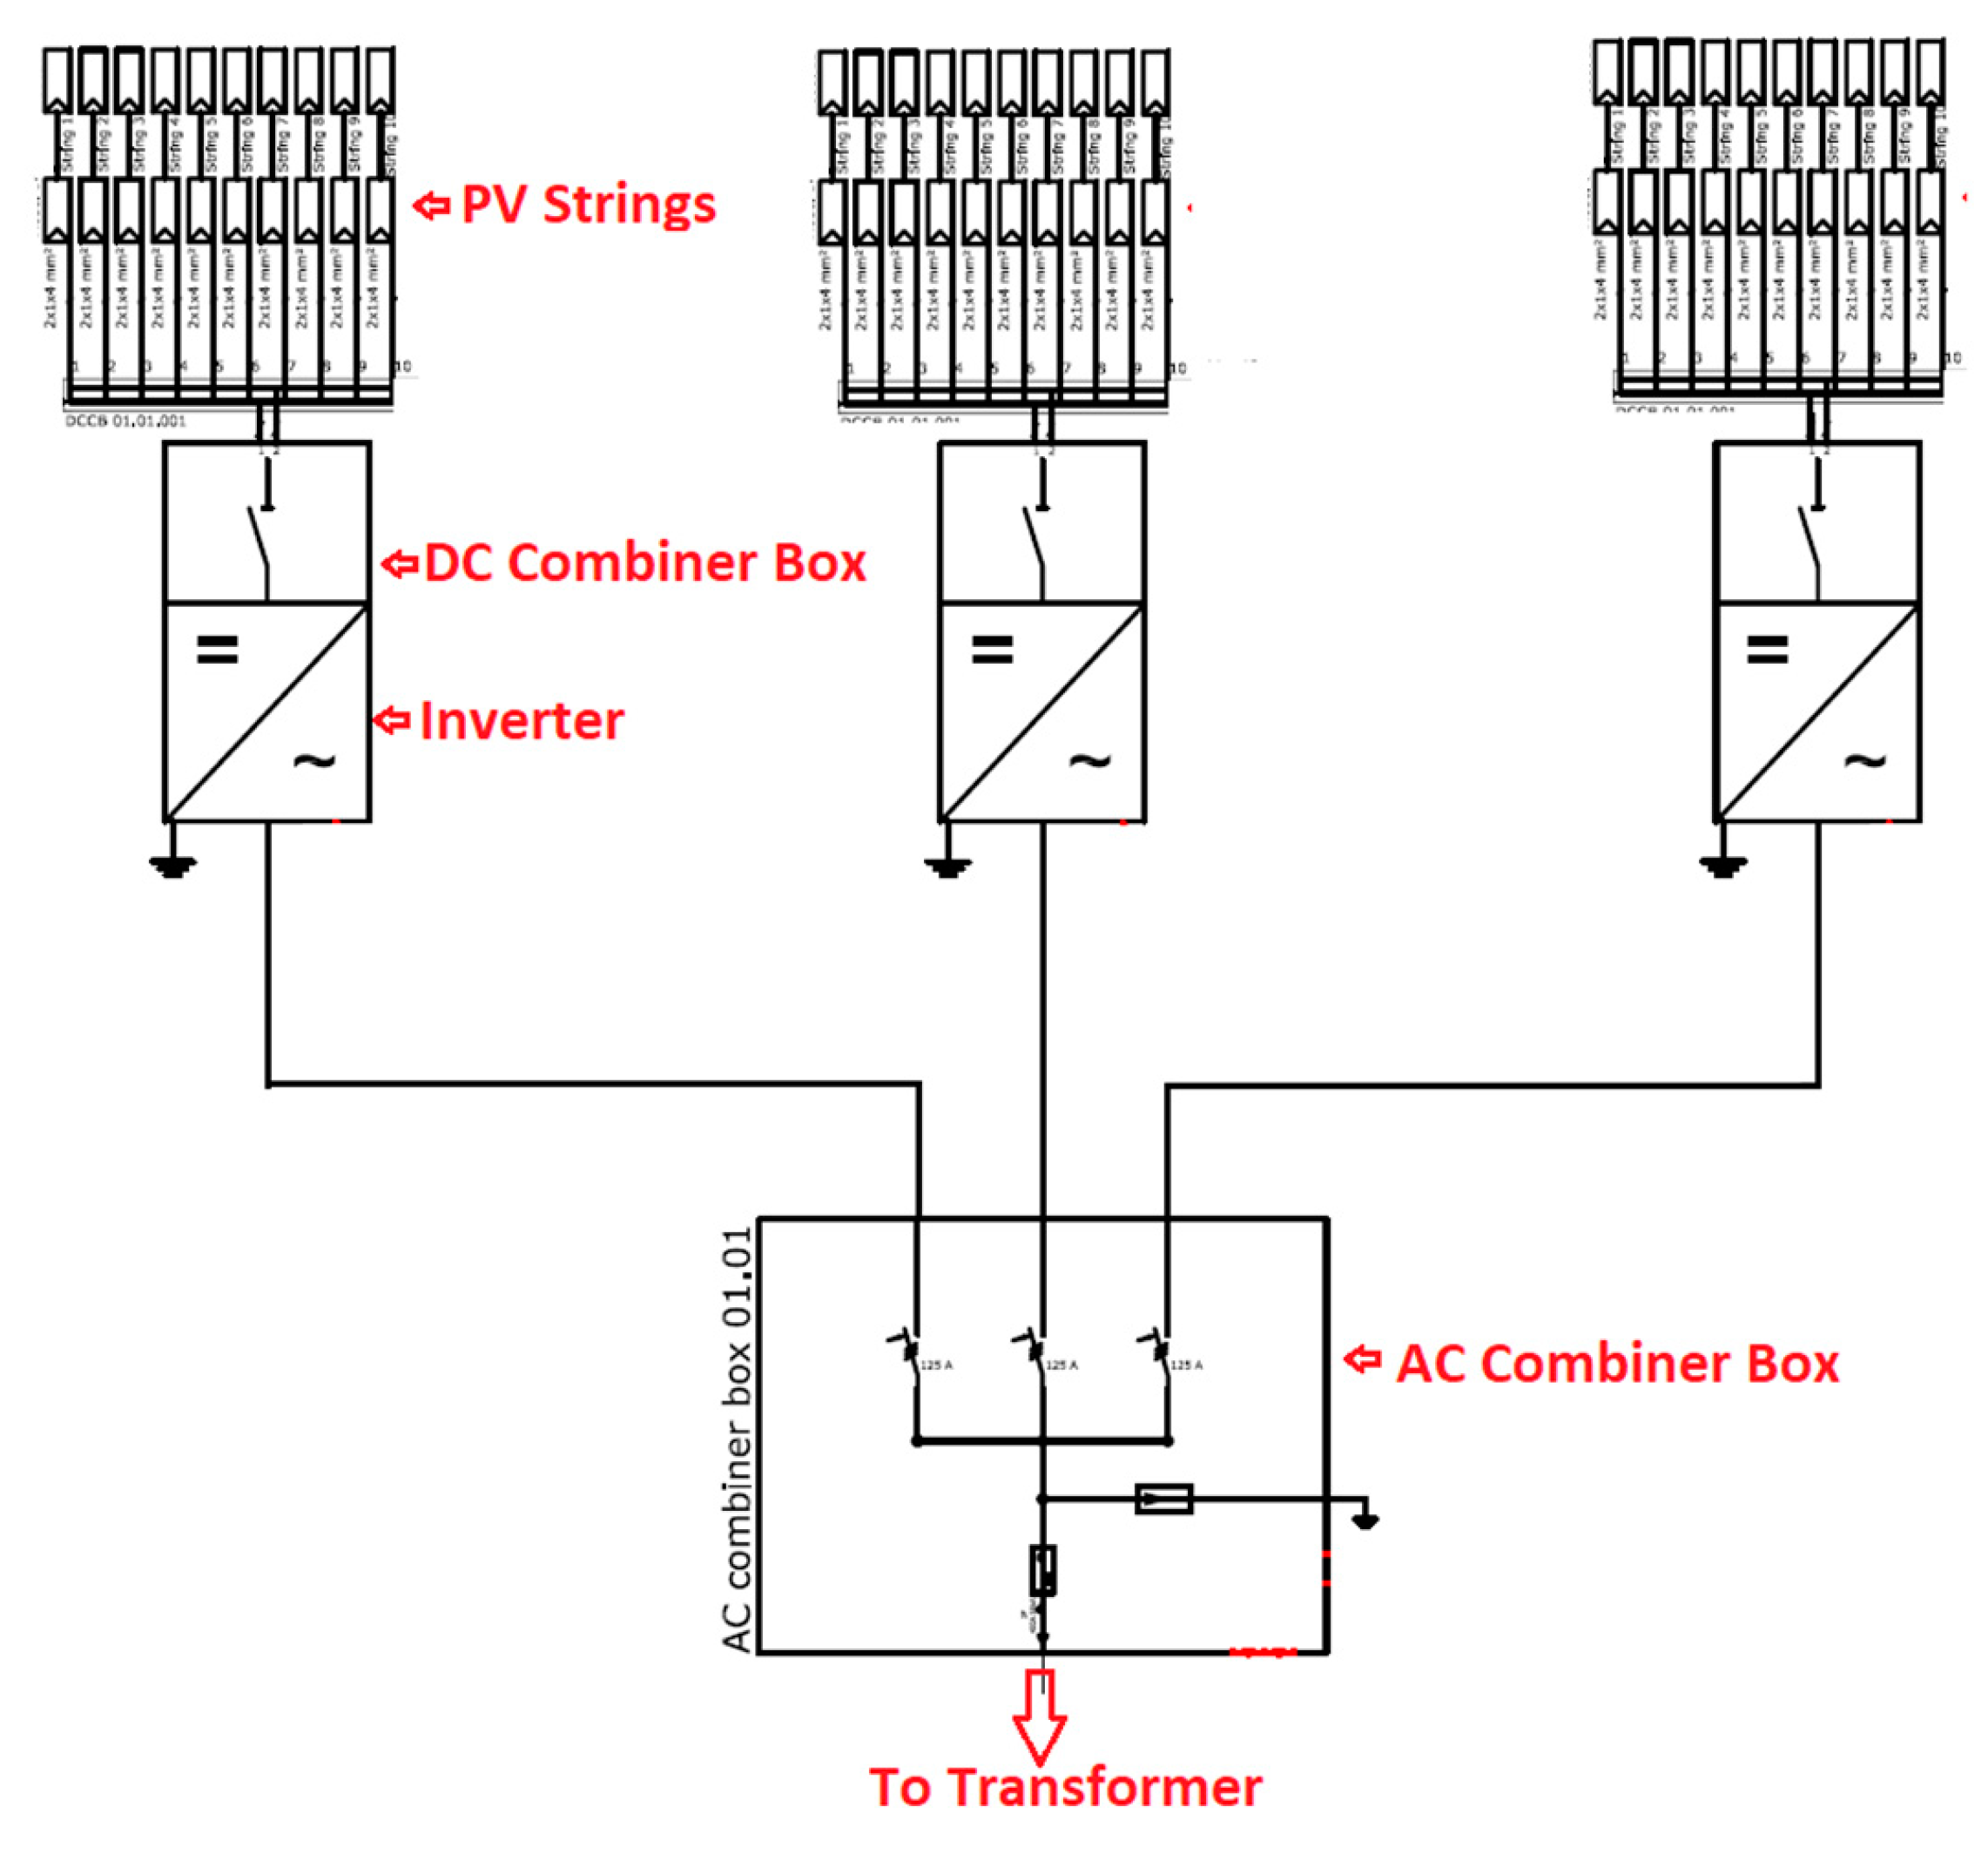
p, and a DC combiner box combines 10 strings per inverter. The DC to AC ratio at the inverter is approximately 1.024 to 1. The complete plant has 340 inverters and 81,600 PV modules for 20.89 MW
p and 20.4 MW
ac planet capacity.
Figure 5 shows the layout of a three-inverter section, detailing PV string connection up to the transformer connection. The rest of the system online diagram is repeatable as the overall plant is scalable.
5. Financial and Environmental Benefits
5.1. Financial Analysis
JUST electricity is billed based on a bracket scheme, as shown in
Table 3.
As JUST consumes much more than 1000 kWh each month, most of the energy consumed is priced at the highest billing bracket. The average kWh cost for 2016 was calculated to be $0.366, with an annual electrical bill of $12.23 million USD. The latest government PV tenders have been awarded a price of $986 per kWp. Therefore, the designed system will cost approximately $21 million. The payback period of this project will include the capital cost in addition to the operational and maintenance costs. These calculations are illustrated in the following discussion.
Payback Period Analysis
The payback period analysis includes the investment cost of the PV plant and the operational and maintenance (O&M) costs. The (O&M) costs used in this discussion are obtained from similar PV plant projects which are currently operational in Jordan. These costs are summarized in
Table 4.
PV modules’ cleaning is necessary to enhance the PV plant yield. This is especially important in the summer months, as dust buildup affects performance. Landscape maintenance is needed to keep landscape healthy and facilitate the maintenance of the plant; this includes weeding, which is important during the spring, when weed height actually introduces shading to the lower part of the panel. Generic maintenance refers to the periodic preventative maintenance needed to keep the plant working satisfactorily. Finally, a typical inverter lifetime is eight to 10 years, and the PV plant project lifetime is 25 years. Therefore, it is assumed that the inverters need to be replaced at years 9 and 18 of the project lifespan.
In order to determine the payback period of this project, the net present value of the project must be calculated. The net present value includes the plant capital cost (initial cost) and the total O&M costs reflected into the present year. The present worth of the total O&M costs can be calculated using (15):
where
O&
Mnwc is the present worth cost of the total O&M costs,
DFj is the discount factor for year
j, and
O&
Mj is the O&M cost for year
j. It is worth mentioning that the inverter replacement cost is calculated for years 9 and 18 only. The discount factor for year
j is a function of the nominal interest rate
i and the inflation rate
f and can be calculated using (16):
In this paper, the nominal interest rate is 7% and the inflation rate is 3%. Using (16) and (17), the net present cost of the O&M costs is found to be equal to $20.7 million. Hence, the net present cost is equal to $41.7 million USD.
The expected PV plant generation in is shown in
Table 5. The generation will decrease with time, as expected, due to the degradation phenomena of the PV modules.
Using the same nominal interest rate used above the estimated payback period of the PV plant is around four years and five months.
5.2. Environmental Benefits
According to the US Environmental Protection Agency (EPA), using eGRID, the US annual non-base load CO
2 output emission rate, considered an accurate “Emission Factor” for electrical consumption, can be calculated using the following rate:
Therefore, the annual CO
2 emissions due to electric consumption at JUST is equal to:
As with any other higher education institution, not all students and academic staff are on campus on a daily basis. Thus, for a complete assessment of the impact of installing the PV plant, the Full-Time Equivalent (FTE) of students and employees was determined to normalize the campus CO2 reduction. A survey of the number of students registered per semester in 2016, in addition to course schedule, employee work hours, and academic staff course load for the different semesters were all considered in the FTE calculation, and the FTE for the university community (students, faculty, and staff) was calculated to be 16110 FTEs. Therefore, the installed PV plant reduces CO2 emissions by 1.6 t per FTE.
The maximum amount of CO2 a person should produce per year in order to halt climate change is 2.0 t CO2. The world average is 5 t, the average in Europe is 6.7 t, the average in the US is 16.5 t, and the average in Jordan is 3.4. These are country averages that include CO2 emission from work, public operations, and home. The CO2 emission reduction due to the JUST PV system brings the universities’ community average to below the 2.0 t limit.
So, installing this PV system not only saves a great deal of financial resources, but also has a tremendous environmental impact, with huge CO2 reduction.


