Conservation Payments, Off-Farm Labor, and Ethnic Minorities: Participation and Impact of the Grain for Green Program in China

Abstract
:1. Introduction
2. The Grain for Green Program and Related Literature
3. Data
4. Estimation and Results
4.1. Likelihood of Participation in Grain for Green
4.2. Effect on Off-Farm Labor of the Grain for Green Program
5. Conclusions and Discussion
Acknowledgments
Author Contributions
Conflicts of Interest
References
- Cho, S.H.; Newman, D.H.; Bowker, J.M. Measuring rural homeowners’ willingness to pay for land conservation easements. For. Policy Econ. 2005, 7, 757–770. [Google Scholar] [CrossRef]
- Smith, R.B.W. The conservation reserve program as a least-cost land retirement mechanism. Am. J. Agric. Econ. 1995, 77, 93–105. [Google Scholar] [CrossRef]
- Moon, K.; Cocklin, C. A landholder-based approach to the design of private-land conservation programs. Conserv. Biol. 2011, 25, 493–503. [Google Scholar] [CrossRef] [PubMed]
- Shiferaw, B.; Holden, S.T. Resource degradation and adoption of land conservation technologies in the Ethiopian highlands: A case study in Andit Tid, North Shewa. Agric. Econ. 1998, 18, 233–247. [Google Scholar] [CrossRef]
- Foley, J.A.; DeFries, R.; Asner, G.P.; Barford, C.; Bonan, G.; Carpenter, S.R.; Chapin, F.S.; Coe, M.T.; Daily, G.C.; Gibbs, H.K.; et al. Global consequences of land use. Science 2005, 309, 570–574. [Google Scholar] [CrossRef] [PubMed]
- Ferraro, P.J.; Simpson, R.D. The cost-effectiveness of conservation payments. Land Econ. 2002, 78, 339–353. [Google Scholar] [CrossRef]
- Wan, H.Y.; Li, C. Study on the participation in decision-making on sloping land conversion program for peasants. Stat. Res. 2013, 30, 83–91. (In Chinese) [Google Scholar]
- Liu, Y.; Dong, Y. Factors’ influencing farmers willingness to participate in Grain for Green project in the post-program era. Econ. Geogr. 2014, 34, 131–138. (In Chinese) [Google Scholar]
- Yin, R.S.; Liu, C.; Zhao, M.J.; Yao, S.B.; Liu, H. The implementation and impacts of China’s largest payment for ecosystem services program as revealed by longitudinal household data. Land Use Policy 2014, 40, 45–55. [Google Scholar] [CrossRef]
- Uchida, E.; Xu, J.T.; Rozelle, S. Grain for Green: Cost-effectiveness and sustainability of China’s conservation set-aside program. Land Econ. 2005, 81, 247–264. [Google Scholar] [CrossRef]
- Chen, X.D.; Lupi, F.; He, G.M.; Ouyang, Z.Y.; Liu, J.G. Factors affecting land reconversion plans following a payment for ecosystem service program. Biol. Conserv. 2009, 142, 1740–1747. [Google Scholar] [CrossRef]
- Guo, H.H.; Li, B.; Yu, H.Y.; Hao, L.X. Research on the Impact of “Grain for Green Project” on households’ production and living conditions. China Popul. Resour. Environ. 2011, 21, 110–114. (In Chinese) [Google Scholar]
- Uchida, E.; Xu, J.T.; Xu, Z.G.; Rozelle, S. Are the poor benefiting from China’s land conservation program? Environ. Dev. Econ. 2007, 12, 593–620. [Google Scholar] [CrossRef]
- Uchida, E.; Rozelle, S.; Xu, J.T. Conservation payments, liquidity constraints and off-farm labor: Impact of the Grain for Green Program on rural households in China. Am. J. Agric. Econ. 2009, 91, 70–86. [Google Scholar] [CrossRef]
- Yao, S.B.; Guo, Y.J.; Huo, X.X. An empirical analysis of the effects of China’s land conversion program on farmers’ income growth and labor transfer. Environ. Manag. 2010, 45, 502–512. [Google Scholar] [CrossRef] [PubMed]
- Groom, B.; Grosjean, P.; Kontoleon, A.; Swanson, T.; Zhang, S.Q. Relaxing rural constraints: A ‘win-win’ policy for poverty and environment in China. Oxf. Econ. Pap. 2010, 62, 132–156. [Google Scholar] [CrossRef]
- Kelly, P.; Huo, X.X. Land retirement and nonfarm labor market participation: An analysis of China’s sloping land conversion program. World Dev. 2013, 48, 156–169. [Google Scholar] [CrossRef]
- Tong, Y.F.; Wang, H.X. The causes of poverty of ethnic population in Western-China and its policy implication. Popul. Econ. 2006, 154, 7–12. (In Chinese) [Google Scholar]
- Ding, S. The ethnic minority-majority income gap in rural China. China Labor Econ. 2006, 3, 86–98. (In Chinese) [Google Scholar]
- Xiang, L.L.; Deng, X.; Qu, X.S. Time-Spatial revolution of poverty in southwest ethnic minorities living area. J. Southwest Univ. Natl. 2013, 34, 124–129. (In Chinese) [Google Scholar]
- Xu, Z.G.; Xu, J.T.; Deng, X.Z.; Huang, J.K.; Uchida, E.; Rozelle, S. Grain for green versus grain: Conflict between food security and conservation set-aside in China. World Dev. 2006, 34, 130–148. [Google Scholar] [CrossRef]
- Xu, Z.G.; Bennett, M.T.; Tao, R.; Xu, J.T. China’s sloping land conversion programme four years on: Current situation, pending issues. Int. For. Rev. 2004, 6, 317–326. [Google Scholar]
- Wang, S.; Yue, X.M. The Grain-for-Green Project, non-farm employment, and the growth of farmer income. Econ. Res. J. 2017, 4, 009. (In Chinese) [Google Scholar]
- State Forestry Administration (SFA). Master Plan for the Sloping Land Conversion Program; State Forestry Administration: Beijing, China, 2003.
- State Council. Notice on the State Council’s Improvement of the Farmland to Forests Policy; State Council: Beijing, China, 2007.
- State Forestry Administration (SFA). National Report on Ecological Benefit Monitoring of the Program of Grain-for-Green (2013); China Forestry Publishing House: Beijing, China, 2014.
- State Forestry Administration (SFA). Sloping Land Conversion Program Plan (2001–2010); State Forestry Administration: Beijing, China, 2003.
- Zuo, T. Implementation of the SLCP. In Implementing the Natural Forest Protection Program and the Sloping Land Conversion Program: Lessons and Policy Recommendations; Xu, J., Katsigris, E., White, T.A., Eds.; Forestry Publishing House: Beijing, China, 2002; pp. 33–49. [Google Scholar]


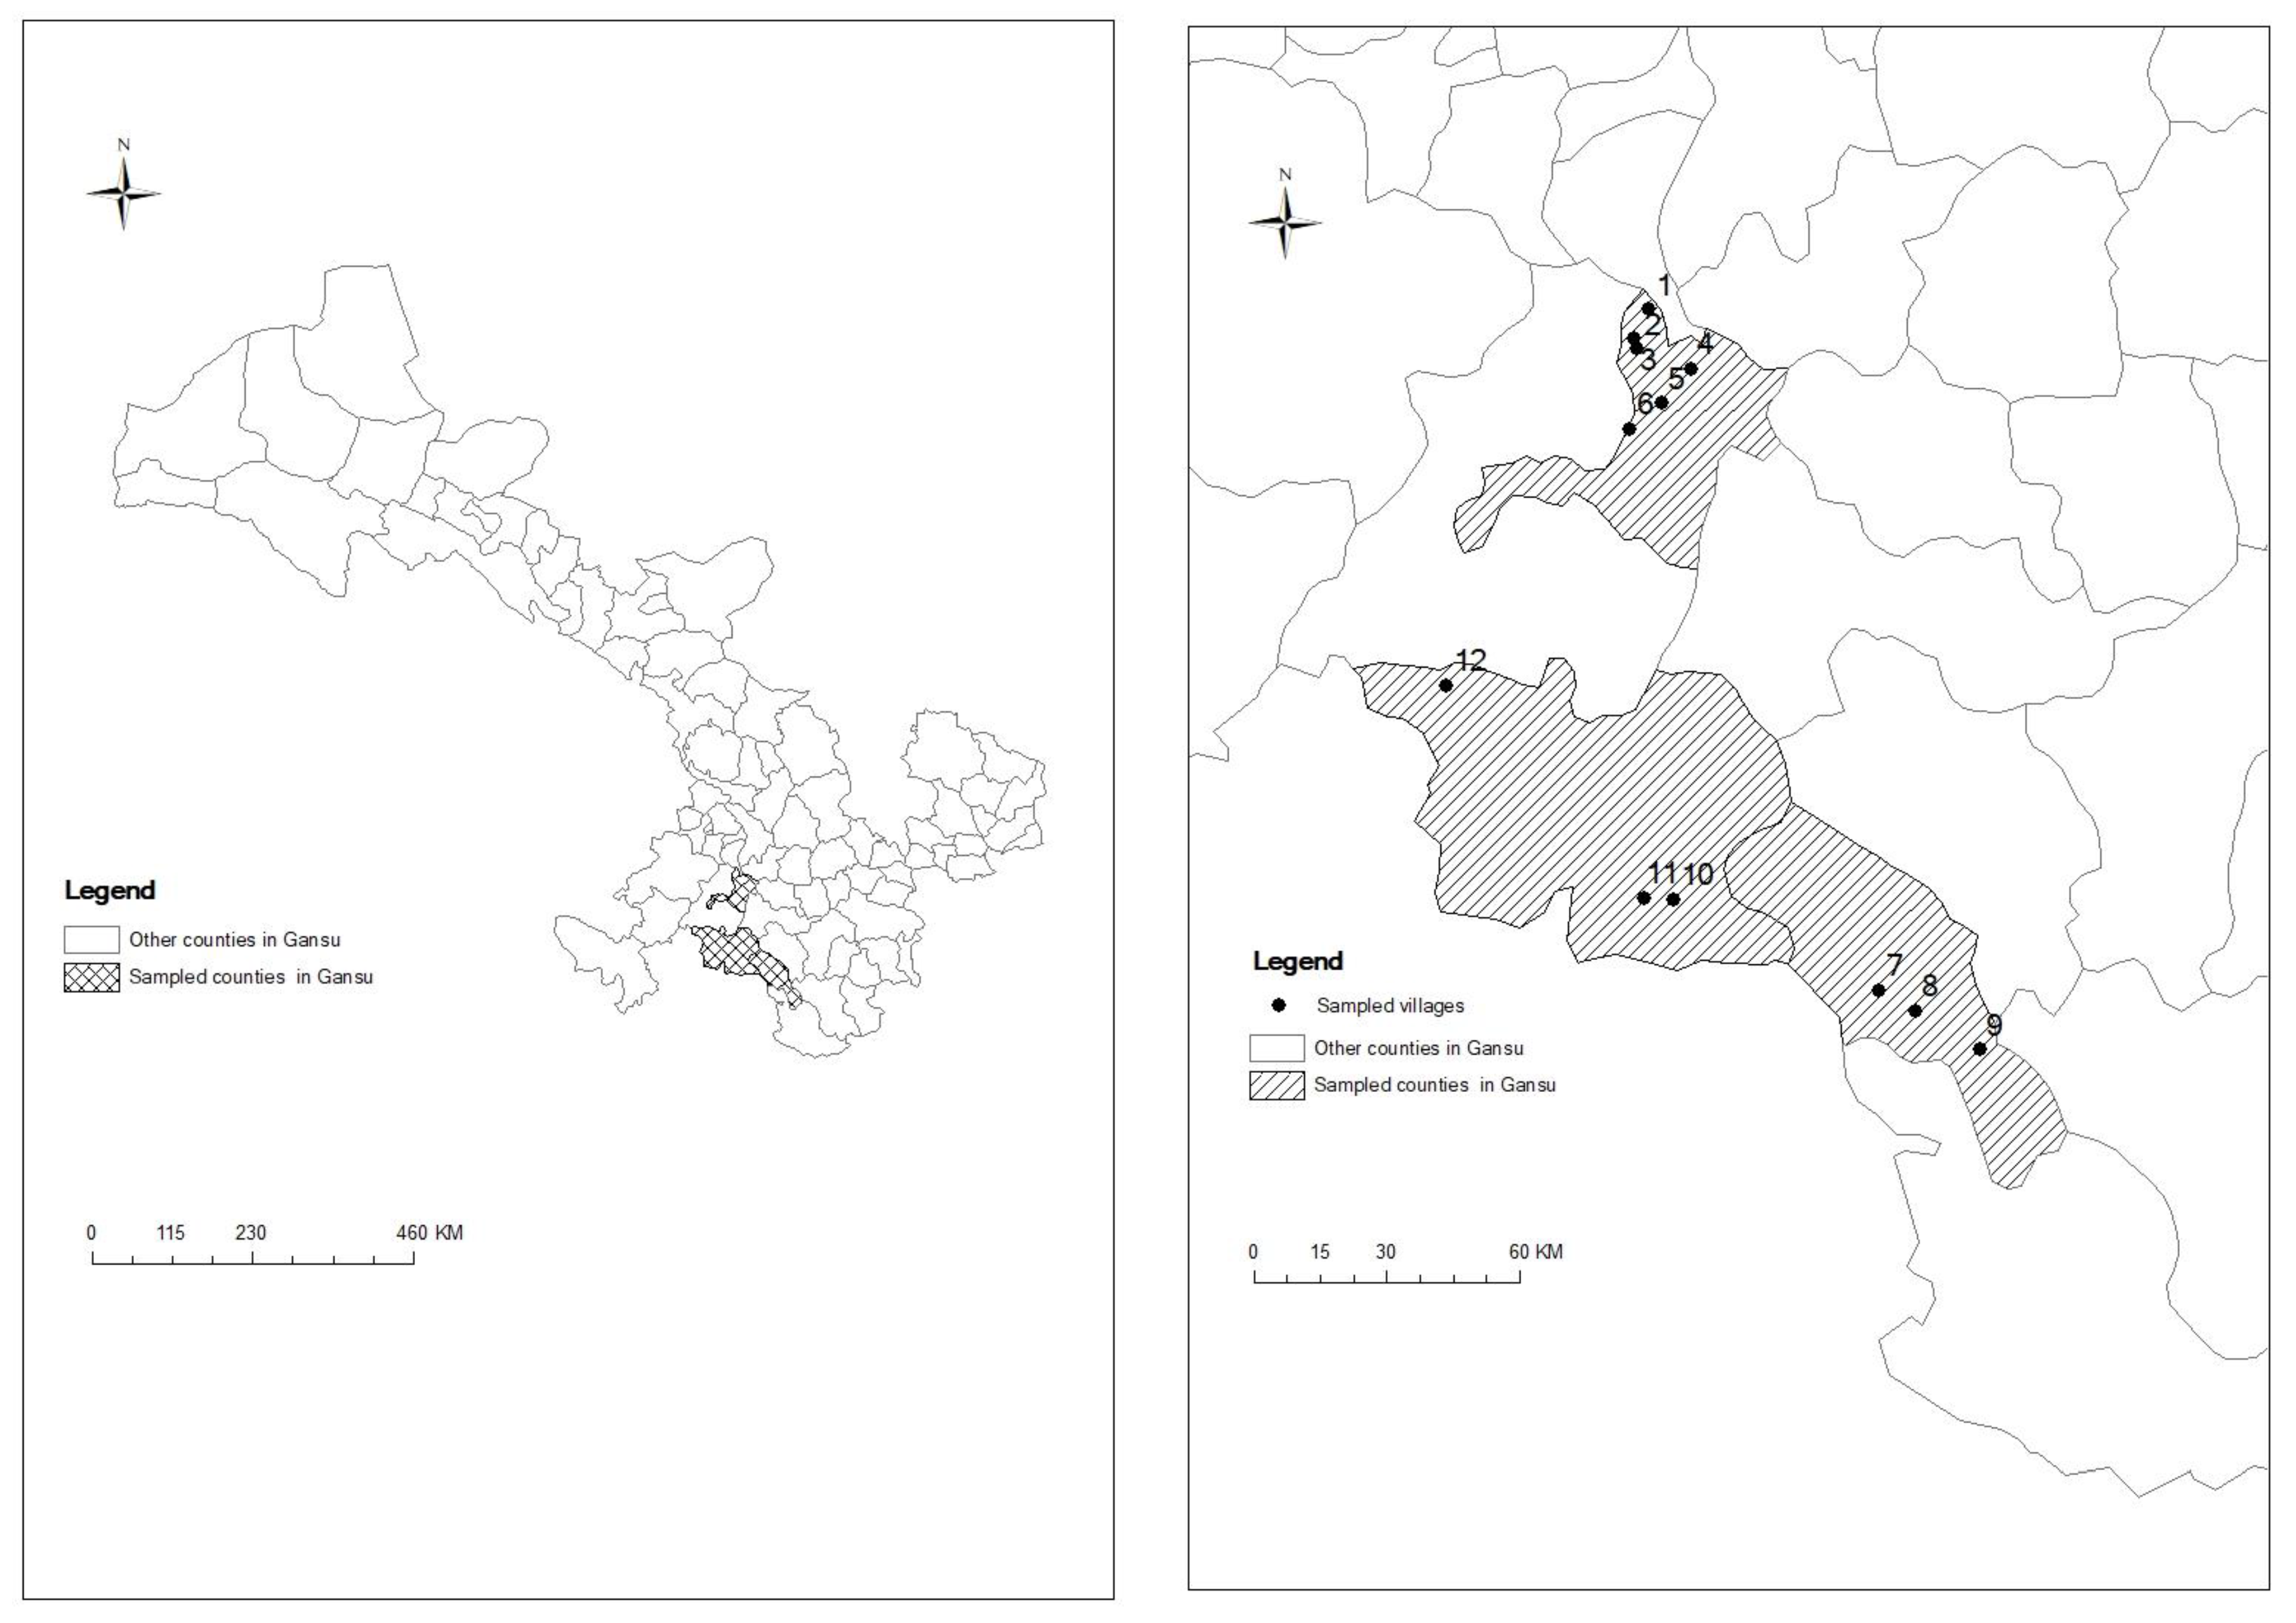
| County Name | ID on Figure 2 | Village Name | Ethnic Minority | Han | Non-Participants | Participants |
|---|---|---|---|---|---|---|
| Lintan | 1 | Zhulin | 1 | 9 | 6 | 4 |
| 2 | Houshan | 0 | 10 | 8 | 2 | |
| 3 | Hongjia | 1 | 9 | 10 | 0 | |
| 4 | Qiuyu | 0 | 10 | 10 | 0 | |
| 5 | Xinzhuang | 0 | 10 | 10 | 0 | |
| 6 | Dacaotan | 0 | 9 | 9 | 0 | |
| Zhouqu | 7 | Bazi | 0 | 10 | 2 | 8 |
| 8 | Jiaorao | 10 | 0 | 1 | 9 | |
| 9 | Kankan | 10 | 0 | 1 | 9 | |
| Diebu | 10 | Kelang | 10 | 0 | 3 | 7 |
| 11 | Nagao | 10 | 0 | 7 | 3 | |
| 12 | Donggui | 10 | 0 | 3 | 7 | |
| Total | 52 | 67 | 70 | 49 |
| Panel A. | Non-Enrolled (Obs = 70 hhs) | Enrolled (Obs = 49 hhs) | Difference | ||
| Mean | S.D. | Mean | S.D. | ||
| Before Grain for Green (1997) | |||||
| Ethnic minority (minority = 1) | 0.229 | 0.423 | 0.735 | 0.446 | 0.506 *** |
| Education of household head (years) | 4.414 | 2.878 | 5.071 | 3.758 | 0.657 |
| Age of household head (years) | 29.6 | 10.329 | 31.959 | 10.553 | 2.359 |
| Gender of household head (male = 1) | 0.986 | 0.120 | 0.900 | 0.306 | −0.086 ** |
| CCP member (member = 1) | 0.1 | 0.302 | 0.122 | 0.331 | 0.022 |
| Number of children | 1.371 | 1.092 | 2.041 | 1.154 | 0.67 *** |
| Number of household members | 4.771 | 1.374 | 5.367 | 1.510 | 0.596 ** |
| Land area (ha) | 2.902 | 6.184 | 3.509 | 4.408 | 0.607 |
| Land quality | 3.899 | 1.304 | 3.788 | 1.097 | −0.111 |
| Distance from land to residence (km) | 1.243 | 0.884 | 2.070 | 4.198 | 0.827 |
| Distance from land to road (km) | 0.985 | 1.548 | 0.912 | 1.019 | −0.073 |
| After Grain for Green (2012) | |||||
| Ethnic minority (minority = 1) | 0.229 | 0.423 | 0.735 | 0.446 | 0.506 *** |
| Education of household head (years) | 4.543 | 2.879 | 5.327 | 3.794 | 0.784 |
| Age of household head (years) | 44.071 | 9.338 | 46.020 | 10.527 | 1.949 |
| Gender of household head (male = 1) | 0.986 | 0.120 | 0.900 | 0.306 | −0.086 ** |
| CCP member (member = 1) | 0.143 | 0.352 | 0.327 | 0.474 | 0.184 ** |
| Number of children | 1.143 | 1.081 | 1.347 | 1.332 | 0.204 |
| Number of household members | 5.329 | 1.359 | 5.755 | 1.877 | 0.426 |
| Land area (ha) | 5.138 | 12.661 | 6.282 | 9.223 | 1.144 |
| Land quality | 3.899 | 1.304 | 3.788 | 1.097 | −0.111 |
| Distance from land to residence (km) | 1.243 | 0.884 | 2.070 | 4.198 | 0.827 |
| Distance from land to road (km) | 0.985 | 1.548 | 0.912 | 1.019 | −0.073 |
| Total subsidy (Chinese Yuan) | 0 | 0 | 596.3 | 563.3 | 596.3 *** |
| Enrolled area (ha) | 0 | 0 | 0.205 | 0.179 | 0.205 *** |
| Panel B. | Non-Enrolled | Enrolled | Difference | ||
| Off-farm labor employment | Mean | S.D. | Mean | S.D. | |
| Before Grain for Green (1997) | 0.429 | 0.672 | 0.245 | 0.434 | −0.184 |
| After Grain for Green (2012) | 1.343 | 1.075 | 1.286 | 0.957 | −0.057 |
| Panel C. | Non-Enrolled | Enrolled | Difference | ||
| Low-skilled Off-farm labor employment | Mean | S.D. | Mean | S.D. | |
| Before Grain for Green (1997) | 0.386 | 0.644 | 0.163 | 0.373 | −0.223 * |
| After Grain for Green (2012) | 1.300 | 1.095 | 1.122 | 0.971 | −0.178 |
| Panel D. | Non-Enrolled | Enrolled | Difference | ||
| Off-farm labor employment requiring higher education | Mean | S.D. | Mean | S.D. | |
| Before Grain for Green (1997) | 0.043 | 0.266 | 0.082 | 0.277 | 0.039 |
| After Grain for Green (2012) | 0.043 | 0.266 | 0.163 | 0.426 | 0.120 ** |
| Dependent Variable: Whether Enrolled in the Program | Dependent Variable: Enrolled Land Area Conditional on Enrollment | Dependent Variable: Enrolled Land Area | ||||
|---|---|---|---|---|---|---|
| (1) | (2) | (3) | (4) | (5) | (6) | |
| Probit | Probit | OLS | OLS | Tobit | Tobit | |
| Ethnic minority | 0.6868 *** | −0.0288 | 0.2776 *** | |||
| (0.1422) | (0.1437) | (0.1055) | ||||
| Education of household head | 0.0042 | 0.0108 | 0.0027 | 0.0027 | −0.003 | −0.0038 |
| (0.0154) | (0.0172) | (0.0068) | (0.007) | (0.0305) | (0.0309) | |
| Age of household head | 0.0050 | 0.0071 | 0.0018 | 0.0017 | 0.0417 | 0.0416 |
| (0.0042) | (0.0046) | (0.0033) | (0.0038) | (0.0338) | (0.0342) | |
| Gender of household head | −0.5150 *** | −0.2524 | 0.0744 | 0.0763 | 0.0027 | 0.0029 |
| (0.1017) | (0.2148) | (0.1133) | (0.1138) | (0.0028) | (0.0029) | |
| CCP member | −0.0064 | −0.1625 | 0.0311 | 0.0318 | 0.0038 | 0.0049 |
| (0.1239) | (0.1185) | (0.0903) | (0.0924) | (0.0063) | (0.0060) | |
| Number of children | 0.1275 | 0.1576 | 0.0245 | 0.0249 | 0.0039 | −0.0008 |
| (0.0896) | (0.1015) | (0.0243) | (0.0263) | (0.0874) | (0.0897) | |
| Number of household members | 0.022 | 0.0095 | −0.0199 | −0.0201 | −0.062 | −0.0703 |
| (0.0454) | (0.0516) | (0.0222) | (0.0227) | (0.0658) | (0.0675) | |
| Land area | −0.0001 | −0.0001 | 0.0156 | 0.0154 | 0.0005 | 0.0005 |
| (0.0007) | (0.0007) | (0.0171) | (0.0183) | (0.0004) | (0.0004) | |
| Land quality | 0.0102 | 0.0089 | 0.0131 | 0.0113 | 0.0432 | 0.052 |
| (0.0541) | (0.0710) | (0.0155) | (0.0233) | (0.0277) | (0.0348) | |
| Distance from land to residence | 0.0347 | 0.0316 | 0.0004 | 0.0004 | 0.0038 *** | 0.0004 |
| (0.0295) | (0.0297) | (0.0039) | (0.0038) | (0.0007) | (0.0008) | |
| Distance from land to road | −0.0458 | −0.0489 | −0.0154 | −0.0158 | 0.0015 | 0.0009 |
| (0.0383) | (0.0382) | (0.0269) | (0.0261) | (0.0044) | (0.0043) | |
| Subsidy | 0.0069 *** | −0.0026 | 0.0033 | 0.0036 ** | −0.0147 | −0.0131 |
| (0.0023) | (0.0028) | (0.0021) | (0.0012) | (0.0210) | (0.0212) | |
| Constant | −10.4498 | −10.4615 | −1.0093 ** | −0.5451 ** | ||
| (6.9711) | (6.0204) | (0.3913) | (0.2495) | |||
| R-squared | 0.225 | 0.329 | 0.322 | 0.322 | 0.843 | 0.858 |
| Observations | 119 | 119 | 49 | 49 | 119 | 119 |
| Minority (Obs = 52 hhs) | Majority (Obs = 67 hhs) | Difference | Estimated Coefficient | Contribution to Outcome Difference (Percentage Point) | ||
|---|---|---|---|---|---|---|
| (1) | (2) | (3) | (4) | (5) | ||
| Outcome | Participation rate (percentage point) | 70.6 | 19.4 | 51.2 *** | ||
| Enrolled land area (ha) | 0.175 | 0.289 | −0.114 ** | |||
| Proportion of enrolled land (percent) | 19.1 | 17.9 | 1.2 | |||
| Characteristics of households and lands in 1997 | Ethnic minority | 1 | 0 | 1 *** | 0.6868 *** | 68.68 |
| Education of household head | 4.49 | 4.836 | −0.346 | 0.0108 | −0.37368 | |
| Age of household head | 30.1 | 30.9 | −0.8 | 0.0071 | −0.568 | |
| Gender of household head | 0.923 | 0.97 | −0.047 | −0.2524 | 1.18628 | |
| CCP member | 0.135 | 0.09 | 0.045 | −0.1625 | −0.73125 | |
| Number of children | 1.615 | 1.672 | −0.057 | 0.1576 ** | −0.89832 | |
| Number of household members | 5.096 | 4.955 | 0.141 | 0.0095 | 0.13395 | |
| Land area | 7.67 | 9.813 | −2.143 | −0.0001 | 0.02143 | |
| Land quality | 3.622 | 4.033 | −0.411 * | 0.0089 | −0.36579 | |
| Distance from land to residence | 2.156 | 1.139 | 1.017 ** | 0.0316 | 3.21372 | |
| Distance from land to road | 1.259 | 0.719 | 0.54 ** | −0.0489 | −2.6406 | |
| Subsidy | 213.8 | 160 | 53.8 *** | −0.0026 | −13.988 |
| Dependent Variable: Number of Off−Farm Labor Units | ||||||
|---|---|---|---|---|---|---|
| (1) | (2) | (3) | (4) | (5) | (6) | |
| OLS | OLS with Village FEs | OLS | OLS with Village FEs | OLS | OLS with Village FEs | |
| Minority × Treatment × Year | −0.6342 ** | −0.9299 ** | ||||
| (0.3157) | (0.3111) | |||||
| Minority × Ratio × Year | −0.7087 | −1.9665 | ||||
| (1.4583) | (1.3328) | |||||
| Minority × Subsidy × Year | −0.0005 | −0.0009 * | ||||
| (0.0003) | (0.0004) | |||||
| Treatment × Year | 0.5642 * | 0.7817 ** | ||||
| (0.3079) | (0.2785) | |||||
| Ratio × Year | 1.1483 | 2.1853 | ||||
| (1.332) | (1.2204) | |||||
| Subsidy × Year | 0.0006 * | 0.0009 ** | ||||
| (0.0003) | (0.0004) | |||||
| Ethnic minority | −0.1330 | 0.5873 * | −0.2794 ** | 0.5166 | −0.2324 ** | 0.5450 * |
| (0.1508) | (0.3029) | (0.1277) | (0.3029) | (0.1172) | (0.2991) | |
| Education of household head | 0.0399 ** | 0.0476 ** | 0.0407 ** | 0.0503 ** | 0.0399 ** | 0.0491 ** |
| (0.0168) | (0.0206) | (0.0169) | (0.0207) | (0.0167) | (0.0202) | |
| Age of household head | 0.0044 | 0.0052 | 0.0037 | 0.0054 | 0.0037 | 0.0056 |
| (0.0055) | (0.0067) | (0.0053) | (0.0071) | (0.0054) | (0.007) | |
| CCP member | 0.0851 | 0.0646 | 0.0723 | 0.0234 | 0.0718 | 0.0331 |
| (0.1652) | (0.1858) | (0.1638) | (0.1734) | (0.1682) | (0.185) | |
| Number of children | −0.0513 | −0.0468 | −0.0596 | −0.0556 | −0.0574 | −0.0537 |
| (0.0566) | (0.0522) | (0.0577) | (0.0533) | (0.0575) | (0.0539) | |
| Number of household members | 0.0363 | 0.0177 | 0.0377 | 0.0235 | 0.039 | 0.0234 |
| (0.0458) | (0.0493) | (0.0455) | (0.0522) | (0.0454) | (0.0506) | |
| Land area | −0.0120 *** | −0.0093 | −0.0106 ** | −0.0076 | −0.0114 ** | −0.0088 |
| (0.0045) | (0.0053) | (0.0046) | (0.0054) | (0.0045) | (0.0052) | |
| Land quality | −0.0467 | −0.0967 | −0.055 | −0.0986 | −0.0496 | −0.0922 |
| (0.0509) | (0.0806) | (0.0517) | (0.0814) | (0.0518) | (0.0798) | |
| Distance from land to residence | −0.0255 ** | −0.0289 | −0.0276 ** | −0.0306 | −0.0280 ** | −0.0305 |
| (0.0110) | (0.0175) | (0.0117) | (0.0173) | (0.0114) | (0.0184) | |
| Distance from land to road | −0.0397 | −0.0101 | −0.0284 | 0.0014 | −0.0317 | −0.0042 |
| (0.0435) | (0.048) | (0.043) | (0.0499) | (0.0428) | (0.0448) | |
| Enrolled area | 0.0346 | 0.0597 | ||||
| (0.3821) | (0.3807) | |||||
| Treatment group | −0.1289 | 0.0149 | ||||
| (0.1652) | (0.2819) | |||||
| Ratio | −0.0725 | 0.2132 | ||||
| (0.2828) | (0.407) | |||||
| Subsidy | −0.0001 | 0 | ||||
| (0.0001) | (0.0001) | |||||
| Year dummy | 0.8370 *** | 0.8299 *** | 0.8275 *** | 0.8207 *** | 0.8205 *** | 0.7933 *** |
| (0.1683) | (0.1443) | (0.1543) | (0.1315) | (0.1501) | (0.1316) | |
| Constant | 0.3298 | 0.3472 | 0.3985 | 0.3708 | 0.3692 | 0.3654 |
| (0.3667) | (0.6394) | (0.3656) | (0.6418) | (0.3631) | (0.6172) | |
| Observations | 238 | 238 | 238 | 238 | 238 | 238 |
| R−squared | 0.3479 | 0.4212 | 0.338 | 0.405 | 0.3426 | 0.4136 |
| Panel A | Dependent Variable: Number of Low-Skilled Off-Farm Labor Units | |||||
| (1) | (2) | (3) | (4) | (5) | (6) | |
| OLS | OLS with Village FEs | OLS | OLS with Village FEs | OLS | OLS with Village FEs | |
| Minority × Treatment × Year | −0.4217 | −0.7432 * | ||||
| (0.3274) | (0.3805) | |||||
| Minority × Ratio × Year | −0.9111 | −2.5453 * | ||||
| (1.4487) | (1.3560) | |||||
| Minority × Subsidy × Year | −0.0005 | −0.0010 ** | ||||
| (0.0004) | (0.0004) | |||||
| Treatment × Year | 0.356 | 0.5857 | ||||
| (0.3236) | (0.3283) | |||||
| Ratio × Year | 1.4866 | 2.8170 ** | ||||
| (1.3085) | (1.2256) | |||||
| Subsidy × Year | 0.0006 * | 0.0010 ** | ||||
| (0.0003) | (0.0004) | |||||
| Observations | 238 | 238 | 238 | 238 | 238 | 238 |
| R-squared | 0.3414 | 0.4059 | 0.3401 | 0.4049 | 0.3436 | 0.4132 |
| Panel B | Dependent Variable: Number of High-Skilled Off-Farm Labor Units | |||||
| (1) | (2) | (3) | (4) | (5) | (6) | |
| OLS | OLS with Village FEs | OLS | OLS with Village FEs | OLS | OLS with Village FEs | |
| Minority × Treatment × Year | −0.2125 | −0.1867 | ||||
| (0.1840) | (0.1308) | |||||
| Minority × Ratio × Year | 0.2024 | 0.5788 | ||||
| (0.2511) | (0.3727) | |||||
| Minority × Subsidy × Year | −0.0000 | 0.0001 | ||||
| (0.0001) | (0.0001) | |||||
| Treatment × Year | 0.2081 | 0.1960 * | ||||
| (0.1847) | (0.1088) | |||||
| Ratio × Year | −0.3383 | −0.6317 * | ||||
| (0.2275) | (0.3145) | |||||
| Subsidy × Year | −0.0000 | −0.0001 | ||||
| (0.0001) | (0.0001) | |||||
| Observations | 238 | 238 | 238 | 238 | 238 | 238 |
| R-squared | 0.1193 | 0.196 | 0.1012 | 0.1872 | 0.0999 | 0.1843 |
© 2018 by the authors. Licensee MDPI, Basel, Switzerland. This article is an open access article distributed under the terms and conditions of the Creative Commons Attribution (CC BY) license (http://creativecommons.org/licenses/by/4.0/).
Share and Cite
Xie, L.; Zeng, B.; Jiang, L.; Xu, J. Conservation Payments, Off-Farm Labor, and Ethnic Minorities: Participation and Impact of the Grain for Green Program in China. Sustainability 2018, 10, 1183. https://doi.org/10.3390/su10041183
Xie L, Zeng B, Jiang L, Xu J. Conservation Payments, Off-Farm Labor, and Ethnic Minorities: Participation and Impact of the Grain for Green Program in China. Sustainability. 2018; 10(4):1183. https://doi.org/10.3390/su10041183
Chicago/Turabian StyleXie, Lunyu, Bohan Zeng, Li Jiang, and Jintao Xu. 2018. "Conservation Payments, Off-Farm Labor, and Ethnic Minorities: Participation and Impact of the Grain for Green Program in China" Sustainability 10, no. 4: 1183. https://doi.org/10.3390/su10041183
APA StyleXie, L., Zeng, B., Jiang, L., & Xu, J. (2018). Conservation Payments, Off-Farm Labor, and Ethnic Minorities: Participation and Impact of the Grain for Green Program in China. Sustainability, 10(4), 1183. https://doi.org/10.3390/su10041183