Article

Benefit and Risk Perceptions of Controversial Facilities: A Comparison between Local Officials and the Public in China

1
Political Science and Public Administration School, Shandong University, Qingdao 266000, China
2
Center for Crisis Management Research (Sponsored by Beijing Planning Office of Philosophy & Social Science), School of Public Policy & Management, Tsinghua University, Beijing 100084, China
*
Author to whom correspondence should be addressed.
Sustainability 2018, 10(4), 1092; https://doi.org/10.3390/su10041092
Submission received: 12 February 2018 / Revised: 29 March 2018 / Accepted: 3 April 2018 / Published: 5 April 2018
(This article belongs to the Special Issue Disasters, Crisis, Hazards, Emergencies and Sustainable Development)

Abstract

:
This article investigates the perception biases of local government officials and the general public by comparing their benefit and risk perceptions towards controversial facilities. The analysis framework of Social Judgement Theory (SJT)—i.e., (a) economic benefits, (b) environmental health, and (c) social and political factors—was used to design the research. SJT is a widely recognized theoretical framework that includes experimental approaches to the study of cognitive conflicts. An experimental survey was conducted to collect data in order to make a comparison of the weight of different elements. Results demonstrate that there are perception differences between the general public and local officials on controversial facilities. Local officials responsible for endorsing and supervising plants attach more significance to environmental factors than the public, while the public focuses more on social and political factors than officials. There is no significant difference in the cognition of economic benefits. Factors such as demolition compensation and legitimacy may provoke these perception gaps. This paper enriches the current understanding of SJT and policy making for controversial facilities by investigating the perception gaps between officials and the general public.

1. Introduction

“Controversial facilities” is a concept widely used in public policy and politics studies and practices. It refers to facilities which may result in hazards or the unreasonable allocation of risks and benefits [1]. There are several kinds of controversial facilities; those most closely associated with sustainability are hazard or pollution risk facilities, such as chemical plants, nuclear power plants [2,3], and landfills [4,5]. Sustainability is a multidimensional concept involving economic, environmental, and social factors [6]. Controversial facilities are at the hub of these three factors; while they are essential to economic development, they remain risky owing to their negative impact, and are thus opposed by local residents. Controversial facilities may face protests or even clashes with nearby residents as part of a phenomenon referred to as not-in-my-back-yard (NIMBY) syndrome [7,8,9]. Disputes or even conflicts caused by controversial facilities are a barrier to regional sustainability. Making the facilities more acceptable could help to achieve balanced sustainability for economic growth and social progress.
Perceptions of benefits and risks seem to be the original cause for controversy. China is witnessing high-speed economic growth and keen demand for controversial facilities, which have collided with the dense population in various cities. Consequently, narrow and state-centered approaches to regulating such facilities lead to conflicts, protests, and even violence [10,11]. Government officials always play an important role in controversial facility programmes [12]. Because of different perspectives, local officials who take part in decision-making or consultation processes may have different perceptions of controversial facilities than the public [13,14]. Officials always concentrate on the overall utility and hazards of facilities, while the public not only focuses on their immediate surroundings but also on the risk and uncertainty involved [15,16,17]. Perceptions of risks and benefits result in behaviour, which, combined with the non-equivalence of decision-making power and negative externalities, makes conflicts actually occur [4,14,18,19]. Conflicts between economic development and social stability generated by perception biases concerning controversial facilities may also fundamentally affect the sustainability of the region.
This paper concentrates on perception biases towards facilities and aims to clarify the similarities and differences in risk and benefit perceptions of controversial facilities between officials and the public. To compare the weights of risk and benefit perceptions between these two groups, a psychological model called Social Judgement Theory (SJT) was used. Also, a unique experimental method of measurement was executed along with the SJT model to measure the weight of risks and benefits in accepting controversial facilities by different people. Such a measurement method not only reveals one’s weighting of risk and benefit perceptions when making a decision, it is also more accurate in comparing the degree of perception among individuals.
The outline of this paper is as follows. Section 2 puts forward a series of hypotheses based on the literature. Section 3 explains the methodology of Social Judgement Theory and the data used in this paper. Section 4 presents the results. Section 5 investigates how the risk and benefit perceptions of controversial facilities differ between local officials and the public. Finally, Section 6 concludes with a summary of the findings, an interpretation of the results, and an assessment of the broader lessons.

2. Benefit and Risk Perception of Controversial Facilities

2.1. Benefit Perception versus Risk Perception

In the process of controversial facility siting, the psychological activities of the public result in behaviours that may lead to conflicts. Thus, acceptance of controversial facilities is the key factor in both practice and theory. Acceptance is strongly related to a pair of opposite variables: risk perception and benefit perception. Risk perception refers to the risks presented and felt by specific individuals from the environment: specific objective risk varies across individual perceptions [20]. It also refers to fears about some factors that may have a direct negative effect on the acceptance of a controversial facility [21]. Meanwhile, risk perception is the fundamental variable informing public attitudes; it refers to a comprehensive judgement about the possibility and damage of a specific risk [22]. Risks related to controversial facilities include environmental risks, health risks, and risks to property or economic interests [23]. Generally, higher risk perception leads to more serious protests against a local controversial facility.
Political and social factors in controversial facility siting also matter. These entail fair procedures, open participation, and transparent decision-making processes. A siting process characterized by fairness, openness, and transparency means fewer conflicts. In contrast, centralized and non-transparent decision-making may lead to conflicts [11,24,25]. On the one hand, communication helps the decision-maker choose a site that is less prone to conflict. Insufficient crisis communication, on the other hand, can make it more difficult for a person to accept policies that are harmful to them. Risk perception is amplified by injustice and doubt, which lowers trust and reduces acceptance of the facility.
Accordingly, benefit perception also affects public acceptance of controversial facilities. As a variable that contrasts with risk perception, benefit perception can often increase acceptance of controversial facilities: the higher the perception of benefits, the higher the acceptance [26]. Benefit perception is often manifested as economic interests, especially for enterprises and productive facilities [27]. These enterprises not only bring benefits to society as a whole, such as power plants, landfills, and nuclear facilities, but can also bring direct benefits to local communities. Such benefits include employment and tax increases as well as development in education, transportation, and infrastructure [28]. In this case, a productive facility with negative externalities may be more controversial: the risks and benefits appear contradictory. It makes sense to study how officials and the public weigh and choose between those factors.
Accordingly, the following hypotheses are put forward:
H1:
Controversial facilities with stronger backing and planning towards environmental health protection are more acceptable.
H2:
Controversial facilities likely to engage with local communities on social and political factors are more acceptable.
H3:
Controversial facilities with higher economic benefits are more acceptable.

2.2. Perceptive Deviation between Local Officials and the Public

In China, owing the lack of an open democratic decision-making process, residents and the general public have no legal and effective participation mechanism, so it is difficult for them to express their opinions on the siting of controversial facilities. Therefore, the siting of facilities is mainly determined by the operator and the government, and residents can only choose to accept or resist [10,11,29]. In this case, it is particularly important to pay attention to the differences between officials and the public in their understanding of controversial facilities concerning two main aspects. On the one hand, cognition or perception directly affect behaviour, so biases in perception of controversial facility siting between the public and officials become a source of conflict. On the other hand, officials need to take account of the similarities and differences between the public and themselves, for they have to choose a reasonable location and deal with such conflicts [13,14].
As a mixture of interest and risk, the main stakeholders focus on different aspects of the same facility, and that is why controversial facilities lead to “controversy”. Officials and the public have different cognitive patterns when faced with the same benefits or risks. Officials are more concerned with the overall utility and benefits of the facility, and have rational knowledge of the risks [15,16,17]. The public, however, is more concerned about the threat to their way of life posed by the facilities as well as the risk of uncertainty [16,30]. A study on intersubjective cognitive differences found that government officials pay more attention to the system, policy, and implementation feasibility, experts and scholars are more concerned about their professional background considerations, and the surrounding populace pays more attention to actual needs related to their self-interest [29]. However, the existing research has not considered the weight and composition of environmental health, socioeconomic factors, and economic factors.
Accordingly, an additional hypothesis can be made:
H4:
Local officials and the public deviate from each other on the perceived weight that should be given to economic benefits, environmental health, and social and political factors.

3. Method and Data

3.1. Method: Social Judgement Theory

To make a comparison of the weighting of different elements, we opted to use SJT, which is both a model of cognition and an approach used to study cognitive conflict. The theory was developed by Hammond [31,32,33] based on the Lens model [34]. SJT assumes that individuals perceive subjects through certain cues. When people rely on the weight of these cues to make judgements, they may deviate from the objective truth, which results in cognitive biases. Cues and their weight also vary from person to person, which results in cognitive conflict or biases in perception [
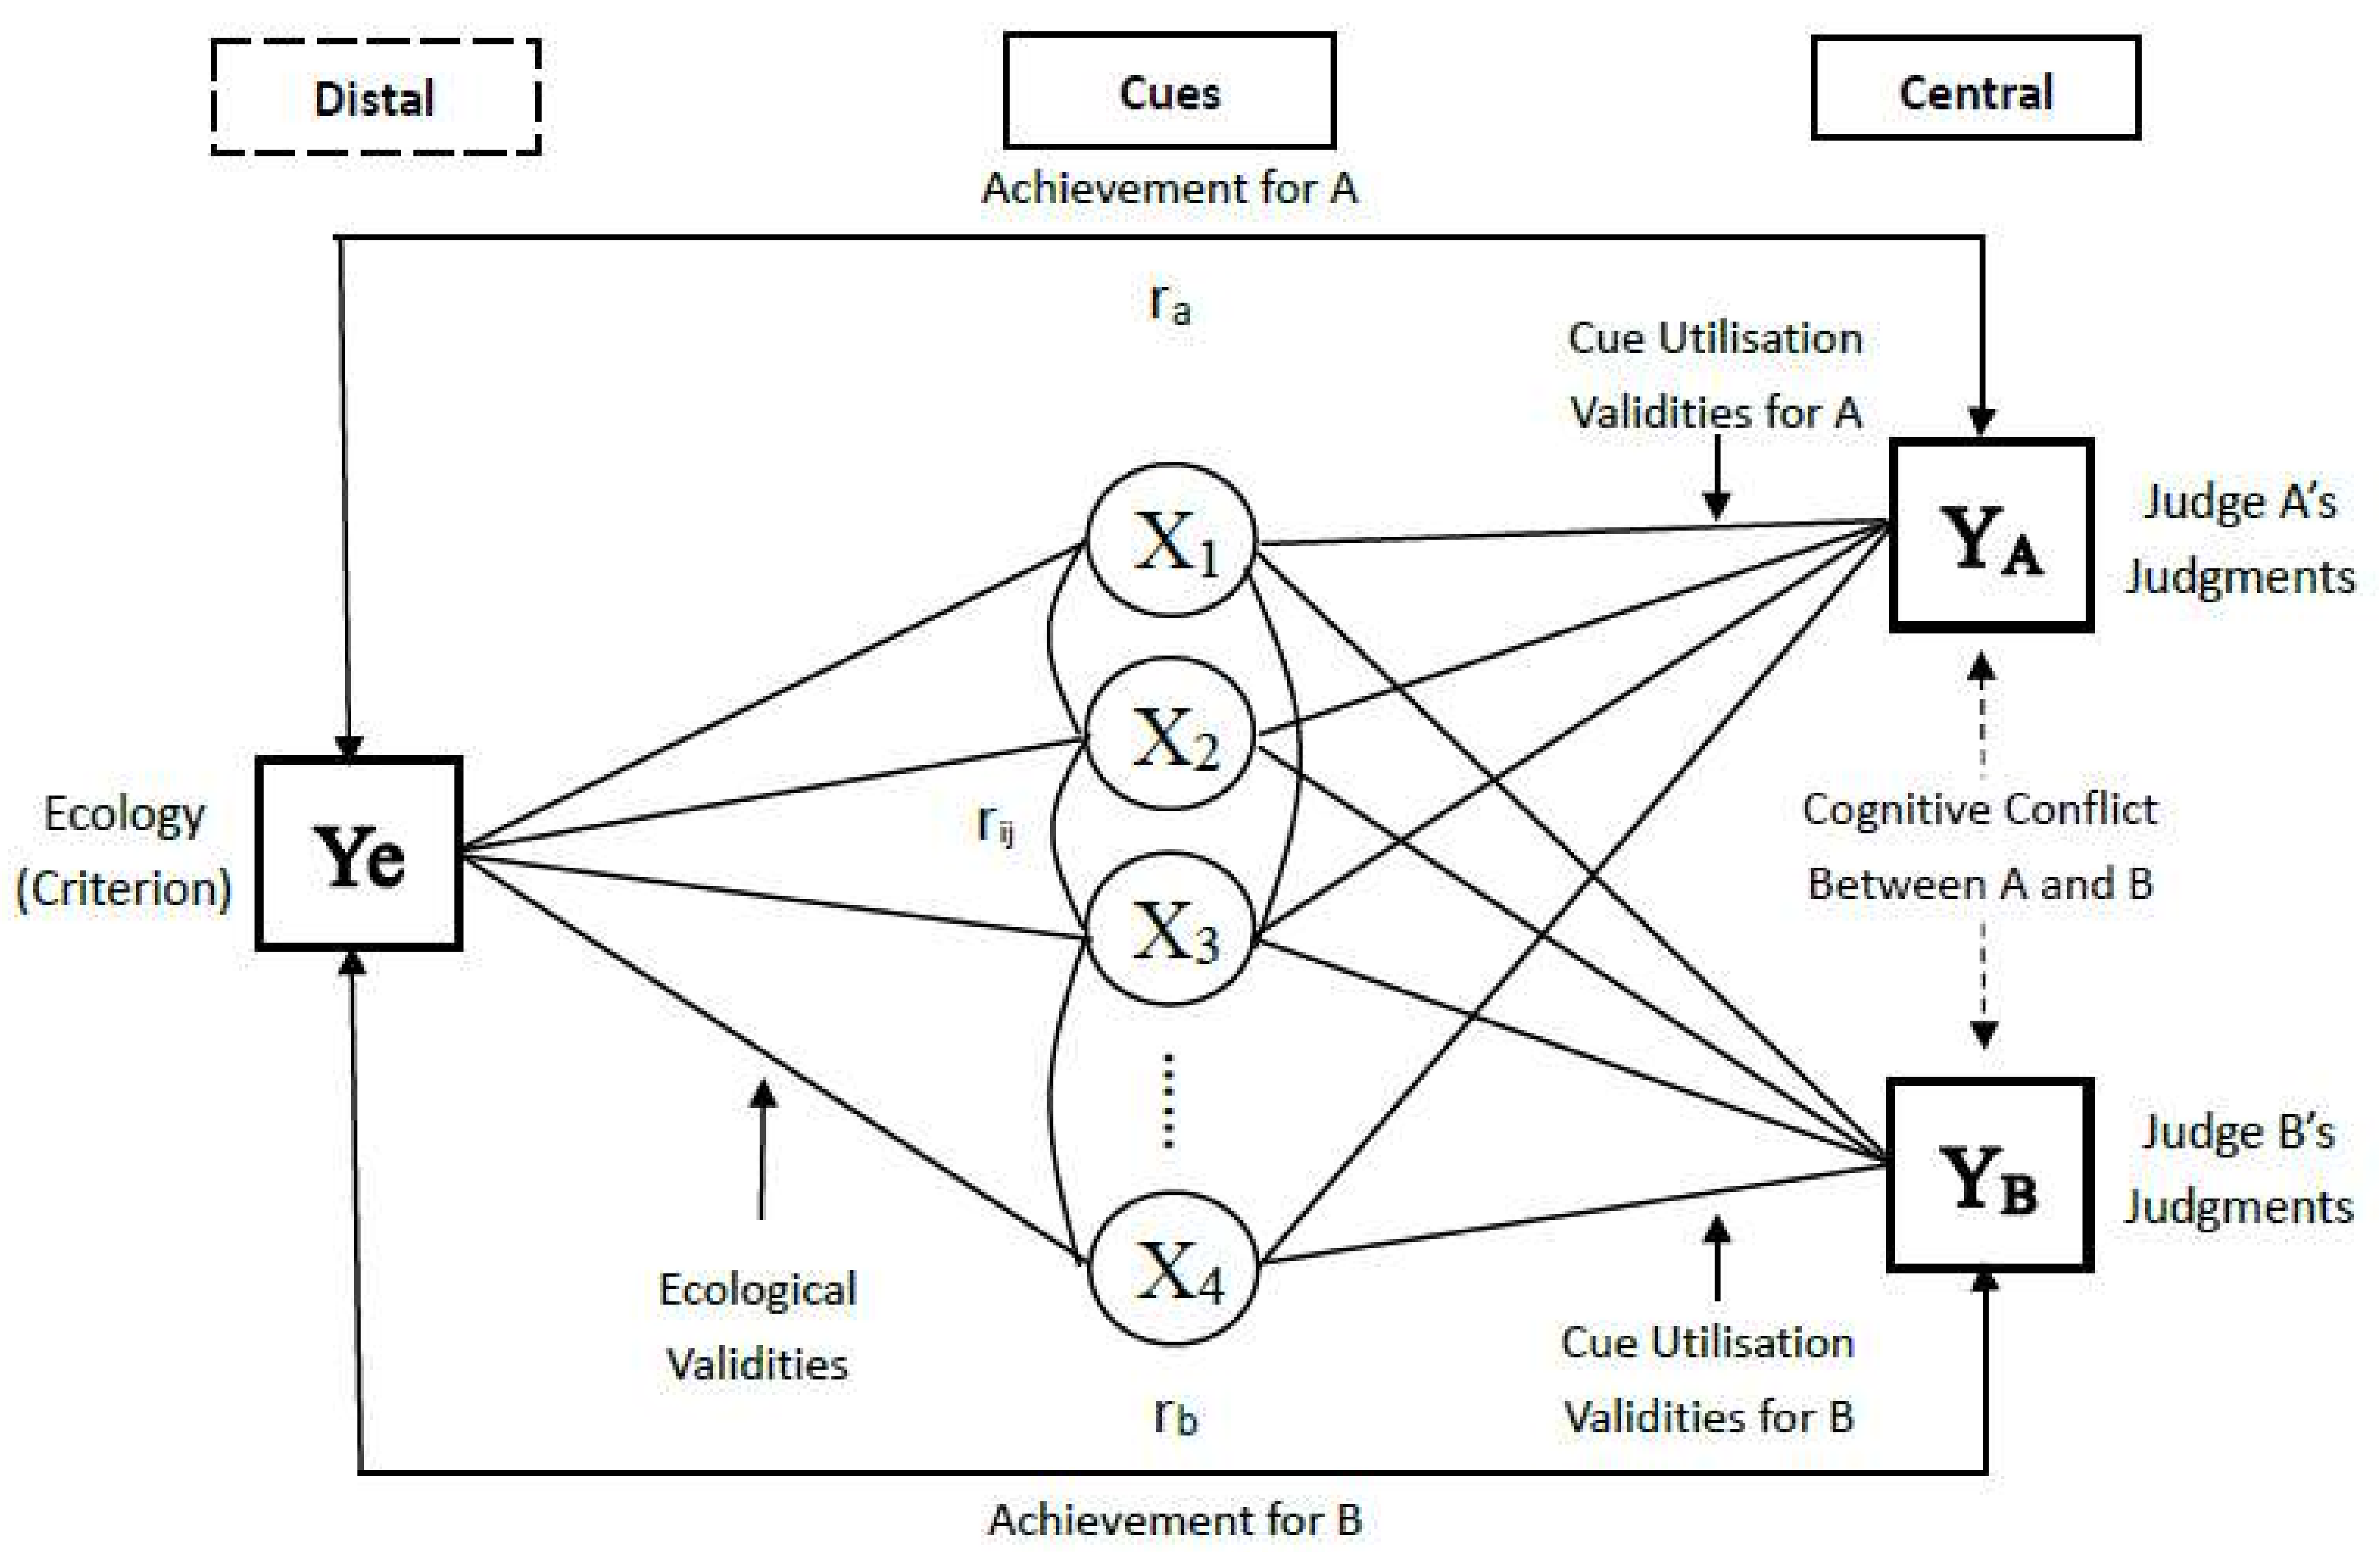
35]. We used the dual-system model developed by Cooksey (Figure 1) to measure the perceptive biases between different groups of people [35]. The SJT method is a small-sample research method which represents each participant’s cognitive system using a regression model. Researchers establish the regression model by surveying the weight that participants give to different cues and analysing the intersubjective cognitive conflicts. Because our research objects were difficult to access, we wanted to accurately measure their cognition of the controversial facility to study the cognitive conflicts of different groups of people. SJT is more a quasi-experimentation and psychological measurement approach than a social survey method; it focuses on cognitive differences and conflicts between participants. Thus, this type of measurement is not suitable for analyses and comparisons using large samples.
To ensure that the participants had specific perceptions of the chemical plant, we conducted a case study. If we had done a survey in a region without a chemical plant, then the subjects would have had quite different chemical plants in mind based on their own experiences. Some scholars have suggested that researchers should separate proposed facilities from established ones. Once a facility is established, residents are likely to be more supportive of it, because their lives have been changed [21]. Therefore, we decided to conduct the survey in an area where there was a risky chemical plant. In this context, we knew that both officials and residents would have specific perceptions of the risks and benefits of the plant.

3.2. The Case and Background

The X chemical plant, which is a pollution enterprise that had experienced accidents years ago in the administrative region of the L city government, was selected as a case. The names of the chosen plant and the city it is located in are anonymized to protect them from possible damage to reputation. L city is located in the west of Shandong, China. As the pillar industry of L city, the X plant has not only made a great contribution to L city’s economic development, but also created many job opportunities and tax revenues, and many other enterprises rely on it.
However, the plant is not safe for two reasons: industrial accidents (sometimes explosions) and chronic pollution. In recent years, two accidents have occurred. The first was a flash explosion which had only a limited effect, but the second involved a big explosion and a significant economic loss. In terms of pollution, the technicians at the plant insist that the production process is scientific, safe, and legal, but local officials consider that argument not entirely credible. Residents have noticed a pungent smell around the plant and significantly contaminated water being discharged. The main products of the X chemical plant include vitriol and chemical fertilizers, some of which are toxic, so industrial chemical leaks caused by accidents may also lead to pollution. Apparently, environmental pollution does exist, and the risks caused by the plant are real and widely known by the locals.

3.3. Cues and Model

Controversial facilities may have complex impacts on the surrounding environment. One of the most fundamental impacts is that the facilities may drive down house prices nearby, which is an important economic impact, as other research has indicated [21]. Hunter and Leyden argued that controversial effects, rather than being attributable to concerns such as property values and aesthetics, depend mainly on two factors: fear of potential health effects and distrust in the government’s management [36]. Thus, factors related to controversial facilities possibly involve at least three aspects: economic benefit factors, social–political factors, and environmental health factors. These three factors are all involved in the case of the X chemical plant.

3.3.1. Economic Benefit Factors

Controversial facilities can have economic impacts on the surrounding residents. Experience from southern China shows that controversial facilities with hazard and pollution risks will affect house prices, which means a prominent economic effect on nearby residents [37]. However, such facilities may not relate to house prices in the case of the X plant, because houses in nearby villages cannot be traded. There is no market for houses in villages, so their value or price is meaningless. Thus, the main factors become economic compensation, employment opportunities, and the economic development of the region. Scholars have found that some communities are faced with a difficult dilemma: they support the employment and economic benefits that come with controversial facilities, but they are reluctant to accept hazardous and noxious facilities [28]. We added four economic benefit factors to make this more specific for participants to understand: a one-time relocation allowance, indirect economic feedback, employment opportunities, and regional industry planning.

3.3.2. Environmental Health

Chemical plants can create both water and air pollution at the same time, and waste treatment also matters. In terms of water pollution, a chemical plant can pollute both groundwater and surface water, such as rivers. As for air pollution, a chemical plant can make the air not only visibly turbid, but also invisibly pungent. Accidental explosions could also aggravate the pollution problem because of the leakage of harmful material. In addition, pollution or environmental risks are often limited in scope, so the distance from the facility to the residents is an important factor [38]. Four second-grade indexes related to environmental health were added: distance, water pollution, a waste disposal method, and additional indicators.

3.3.3. Social and Political Factors

Researchers have observed that the public does not protest controversial facilities, but protests against the decision-making institution instead [39]. Therefore, the controversial facilities are related to government PR (public relations) and public decision-making. In China, the most common form of public decision-making is public hearings. Trust in facilities consists of trust in the technological installations and the relevant parties’ ability to operate the installations. Trust in the government, however, also consists of trust in policies and laws. Three factors were added as second-grade indexes to make this specific.

3.3.4. A Table of Indexes for Further Understanding

Previous research has indicated that it is better to design fewer than five cues when using SJT [35]. For simplicity, we chose three cues: economic benefits, environmental health, and social–political factors. The participants were unable to make judgements with only these phrases. To aid their understanding, we provided a table of indexes to the participants before they responded to the questionnaire (see Table 1). The table consists of three grades of indexes. The first two grades, as mentioned previously, are mainly simple names of factors, while the third-grade indexes give details based on the second-grade indexes.

3.4. Measurement and Data

Based on measurements under SJT, we chose “economic benefit”, “environment and health”, and “social and political factors” as cues to elicit 15 profiles; the participants then gave their judgements on the cues’ respective acceptability. Before the formal questionnaire, we provided a table to show the specific contents of the three cues (as shown in Table 1). However, we did not reveal the second-grade indexes when surveying in order to avoid information overload. As mentioned previously, SJT is not suitable for analyses and comparisons using large samples, especially for an accurate analysis of cognitive distinctions. Therefore, this study did not follow random sampling principles, but focused on the importance of status in the local government and nearby communities. In terms of government officials, we selected seven officials who contacted the local chief executives most frequently from the Municipal Party Committee Office of L City as well as four main executives of the town near the X Plant. In addition, there were six officials from the Development and Reform Commission (which is responsible for formulating economic development strategies) and eight Administration of Work Safety officials, who are responsible for safety supervision. Among the villagers, we invited participants who enjoyed a good reputation and possessed leadership qualities. We invited 11 cadres from the village near the plant as well as 15 young, successful businessmen. As there had been some accidents, the local government officials were sensitive to such a survey. To ensure reliability and confidentiality, we only gathered information about the gender, educational background, and age of the participants (see Appendix A).
To avoid error, we designed a rule to eliminate unqualified participants. We treated the goodness of fit (R-square) of the regression equation as standard, and used it to express the judgement of specific participants. Details of the indicators are described below. If the R2 was higher than 0.7, we considered the participants to have understood the meaning of the subject, and made a reliable judgement. We kept such samples with an R2 higher than 0.7, and ruled out the others. In the end, we obtained a sample set with 17 local residents and 20 officials. All of the statistics and analyses are based on the qualified sample set (Table 2).
We tested the differences of the two groups on the three main demographic variables. Significant differences (p < 0.05) were found between the two groups on sex ratio (χ2 = 4.78, p = 0.03), age (t = 6.70, p = 0.00), and education level (t = 4.44, p = 0.00). However, that did not result from sampling bias, as the subjects were not selected via random sampling, but by their importance in the two groups. It was indicated that the number of males was obviously higher than females in both groups. The educational level of the official group was obviously higher than the other group, and the official participants were also younger than the resident participants.
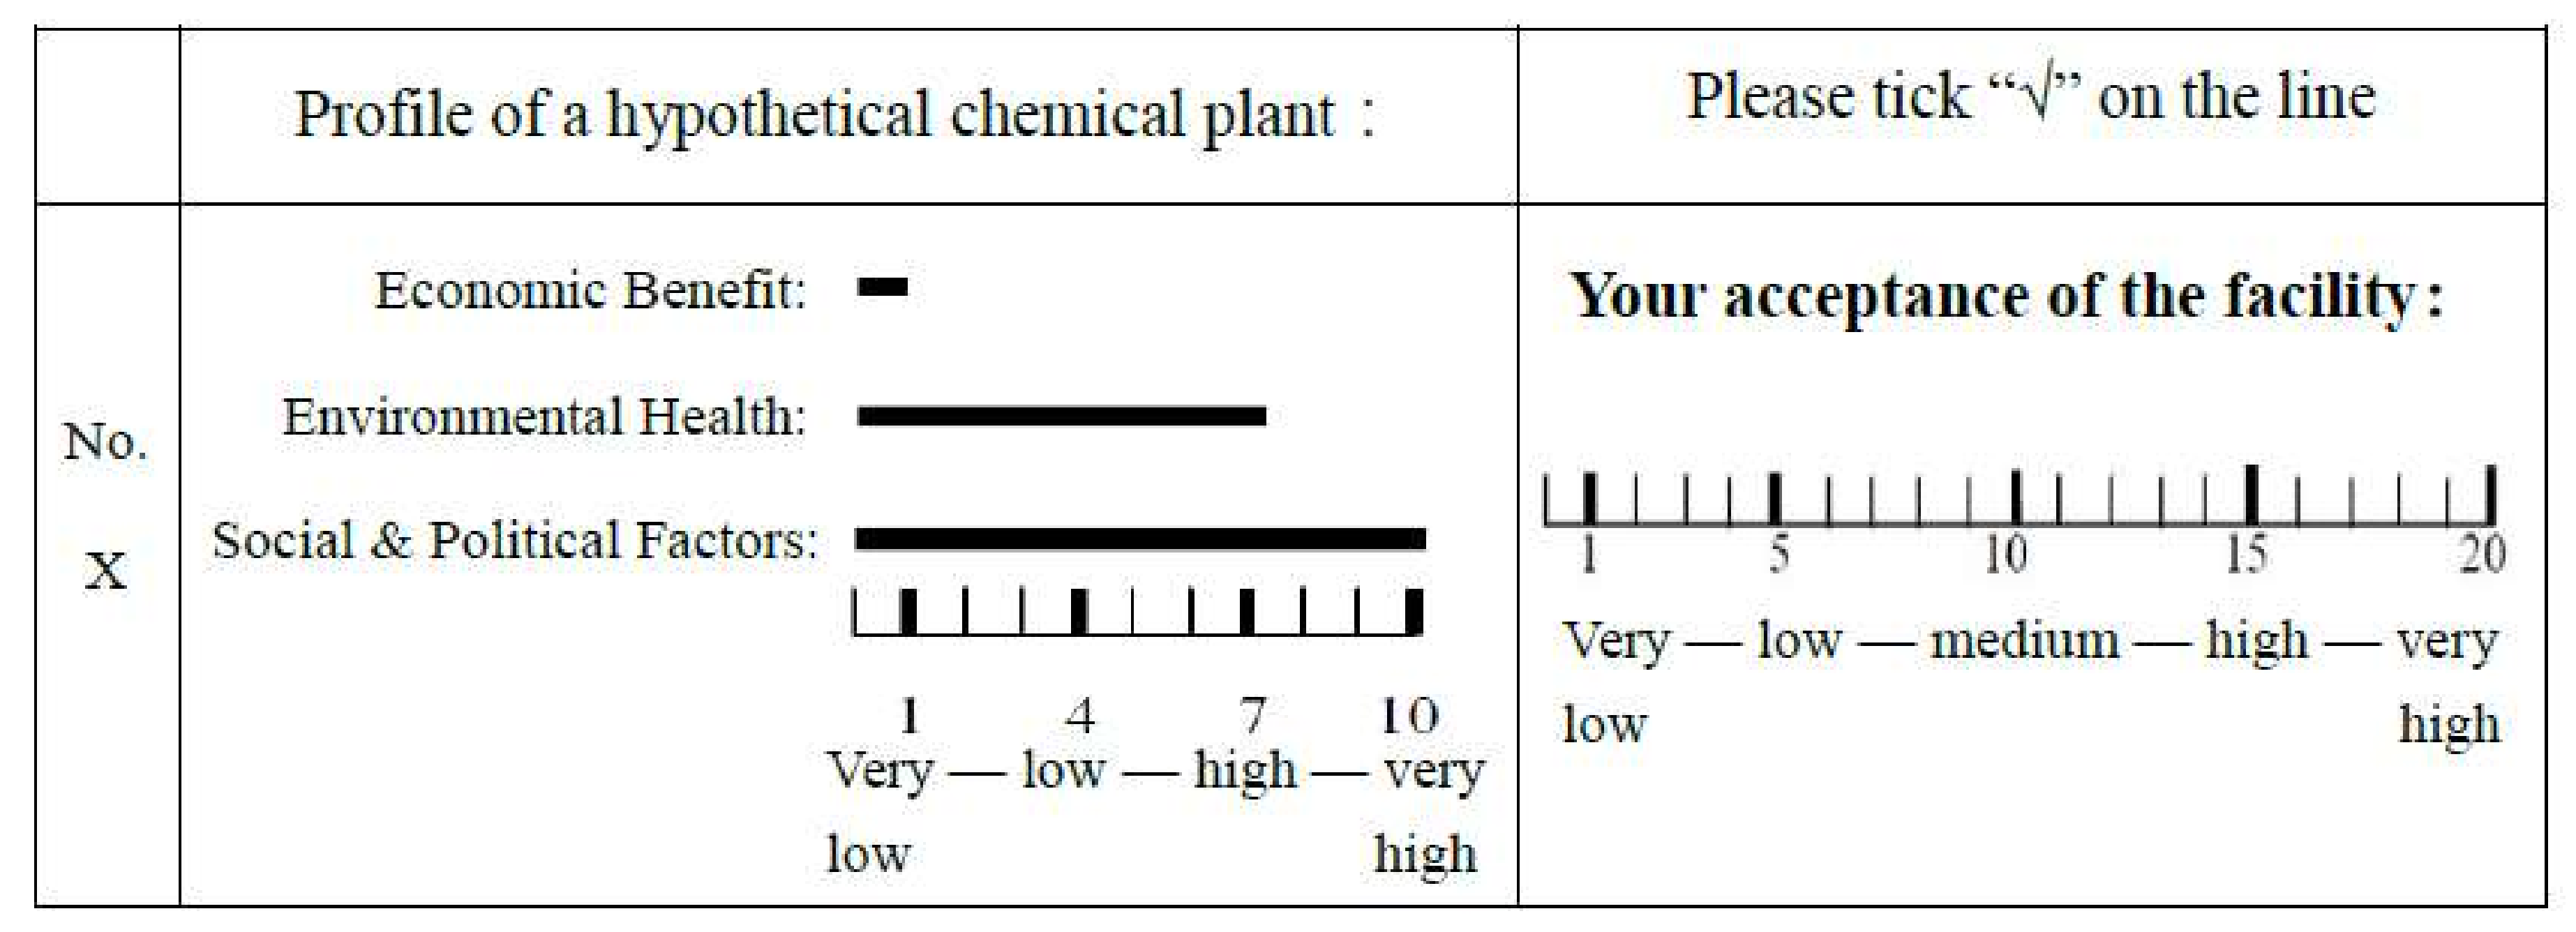
Based on the Lens model, a questionnaire for the SJT method is something like a graphical questionnaire (see Figure 2). As a general rule, the number of profiles was 5 times the number of cues. We generated 15 groups of cues using random numbers (see Appendix B). In order to avoid multicollinearity, we measured the correlation between the three cues. The correlation coefficient between X1 and X2 is 0.1; the correlation coefficient between X2 and X3 is also 0.1, and the correlation coefficient between X1 and X3 is 0.25. The results showed that there was no significant correlation between the cues. Consequently, the respondents only needed to make judgements about their acceptance of these profiles. We obtained 15 sets of profiles with cues and judgements, and thereby conducted a regression analysis using the software POLICY PC (pexc3, Executive Decision Services LLC, Albany, NY, USA), which was specially designed for the SJT method. As the software generated the results, we obtained the weight of each cue for each subject.

4. Results

4.1. Indicators for Analysis

According to the measurement method designed by Hammond [33] and the Dual-System Design developed by Cooksey [35], participants’ cognition can be simulated by the multiple linear regression model:
  Y ^   = a + β 1 x 1 + β 2 x 2 + + β i x i .
In this way, regression coefficients (βi) become key objects for the analysis of cognitive conflict. The most common method for weighing a cue involves a simple transformation of the coefficients, which appears to be a standardizing treatment:
r w β i = | β i | i = 1 k | β i | .
Therefore, we not only learned how much weight participants gave to the cues, but could also compare the weights of different cues intersubjectively. The result of the goodness of fit (R2) test yielded the proportion of variance in judgements that had been systematically captured by the linear model of the judgements. The results also showed the contributions that cues make to the judgement process. As SJT reveals, R2 also represents cognitive consistency or the degree of cognitive control, which means the higher the R2, the better the cognitive consistency. Customarily, the subjects’ criteria are thought to be consistent when R2 > 0.8, and it is also acceptable at R2 > 0.7. Thus, when we began the statistical analysis, we ruled out the samples with R2 < 0.7. Therefore, we obtained three indicators to analyse cognitive status: the weight of each cue (rwβi), the positive or negative relationship between cues and the acceptance (β), and cognitive consistency (R2). The last indicator was used for screening qualified samples, while the others were used to analyse cognitive status.

4.2. The Weight of Each Cue

The statistical analysis and case box plot (see Figure 3) indicated that neither residents nor officials gave much weight to economic benefits. Ruling out two singular values in each group, we found that the average weights of both the residents’ group (N = 15, mean = 13.81) and officials’ group (N = 18, mean = 15.38) were low, and the distributions of the two groups were similarly concentrated (standard deviation of the residents’ group = 10.33, standard deviation of the officials’ group = 9.77).
As for the environmental and health cue, the statistical analysis and case box plot (see Figure 4) showed that both residents and officials gave it greater weight. Ruling out one singular value in the officials’ group, we found that the average weight of officials (N = 19, mean = 59.18) was higher than that of residents (N = 17, mean = 43.42), while the distribution of the official weights was a little more concentrated than the other (standard deviation of the resident group = 20.49, standard deviation of the officials group = 17.02).
As for the social and political cue, the statistical analysis and box plot (see Figure 5) showed that residents gave it more weight than officials in general. The average weight of residents (N = 17, mean = 36.80) was higher than that given by officials (N = 20, mean = 23.02), but the distribution of the resident group’s weights were not very concentrated (standard deviation of the resident group = 21.21, standard deviation of the officials’ group = 14.79). That means that there was a cognitive gap within the residents’ group.
For further comparison, we used an independent-samples t-test to test if there was a statistical difference on cognitive weight between the two groups. First of all, the results of the One-Sample Kolmogorov–Smirnov test showed that this group of data took the shape of a normal distribution (see Appendix C). The results of the t-test showed that there was no significant difference on the cognitive weight of the economic benefits cue between officials and residents (t = 0.45, df = 31, p = 0.66). However, as for the cognitive weight on the environmental health cue (t = 2.52, df = 34, p = 0.02) and the social–political cue (t = 2.25, df = 2.25, p = 0.03), there were significant differences. Residents weighted the social–political cue more, while officials weighted the environmental health cue more (see Appendix D).

4.3. Relationship between Cues and Acceptable Degree

The term “function forms” refers to the shape and directionality of cue-judgement (or cue-criterion) relationships [35]. As we used the linear form alone, there were only two kinds of functional form: positive linear and negative linear. Quite a number of participants’ cognitive functional forms for the evaluation of economic benefits were negative. Results showed that nearly 30% of resident participants made negative judgements against the economic benefit cue, while up to 45% of officials did the same. That does not mean that the stronger the economic benefit the lower the acceptance, but simply reflects that the participants did not endorse the development mode by relying on the chemical plant. On the contrary, both residents and officials agreed that the more environmentally friendly a chemical plant was, the more acceptable it would be. As for the social and political factors, only a small number of respondents made a negative judgement, with only one subject weighting the negative relationship up to 30% when others’ weights on the negative cue were much lower. Generally speaking, the residents and officials agreed that the acceptance and social–political elements were in a proportional relationship (see Table 3).

5. Discussion

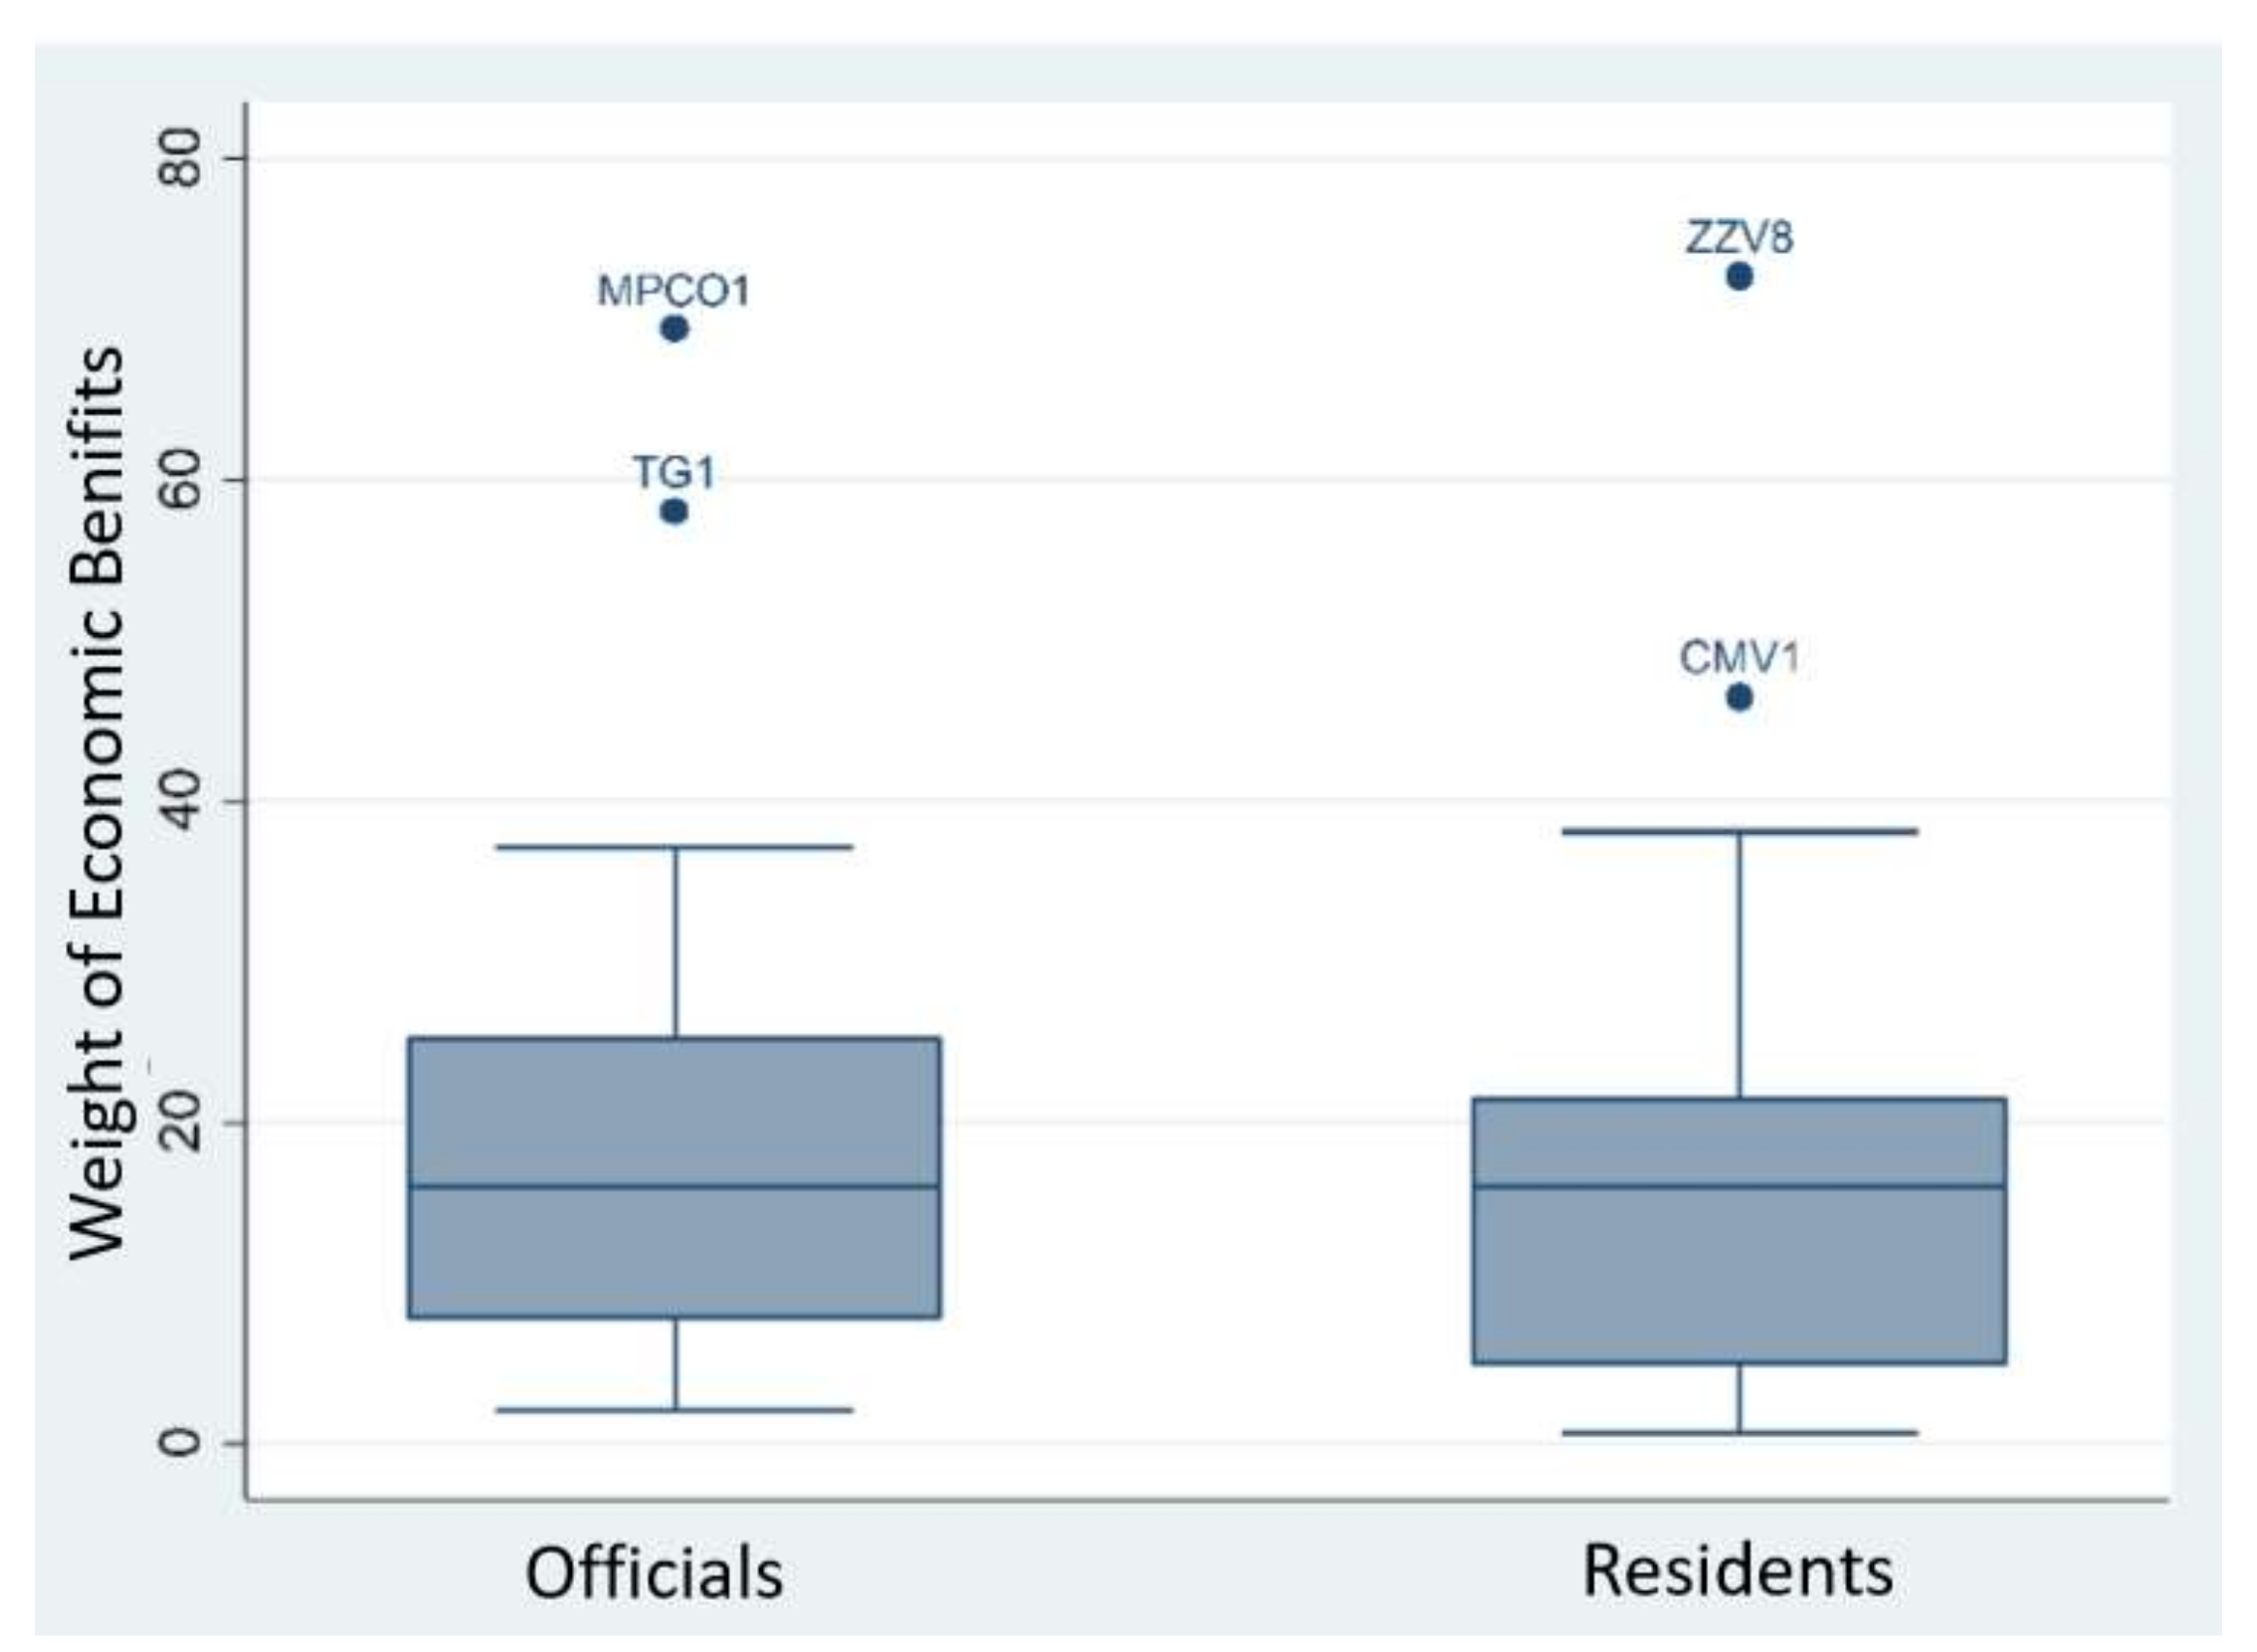
The central argument of this paper concerns the perception biases between government officials and the public towards controversial facilities, and aims to clarify the similarities and differences in their perceptions of controversial facilities’ risks and benefits. Consequently, we set up four hypotheses, the first three of which concentrate on the acceptance and perception of controversial facilities, while the last one concerns the similarities and differences between the two groups. Results indicate that H1 and H4 are verified, H3 is largely verified, and H2 is not verified. In terms of environmental health, all participant officials and locals agree that controversial facilities with higher environmental health levels are more acceptable, so H1 is proved. As for economic benefits, about 30% of the residents and nearly half of the officials do not agree that higher economic benefits can make the controversial facilities more acceptable, so H2 is not verified. With regard to social and political factors, 70% of the residents and 85% of the officials agree that if the social and political factors are dealt with more effectively, facilities may be more acceptable. That means H3 is also proved in general.
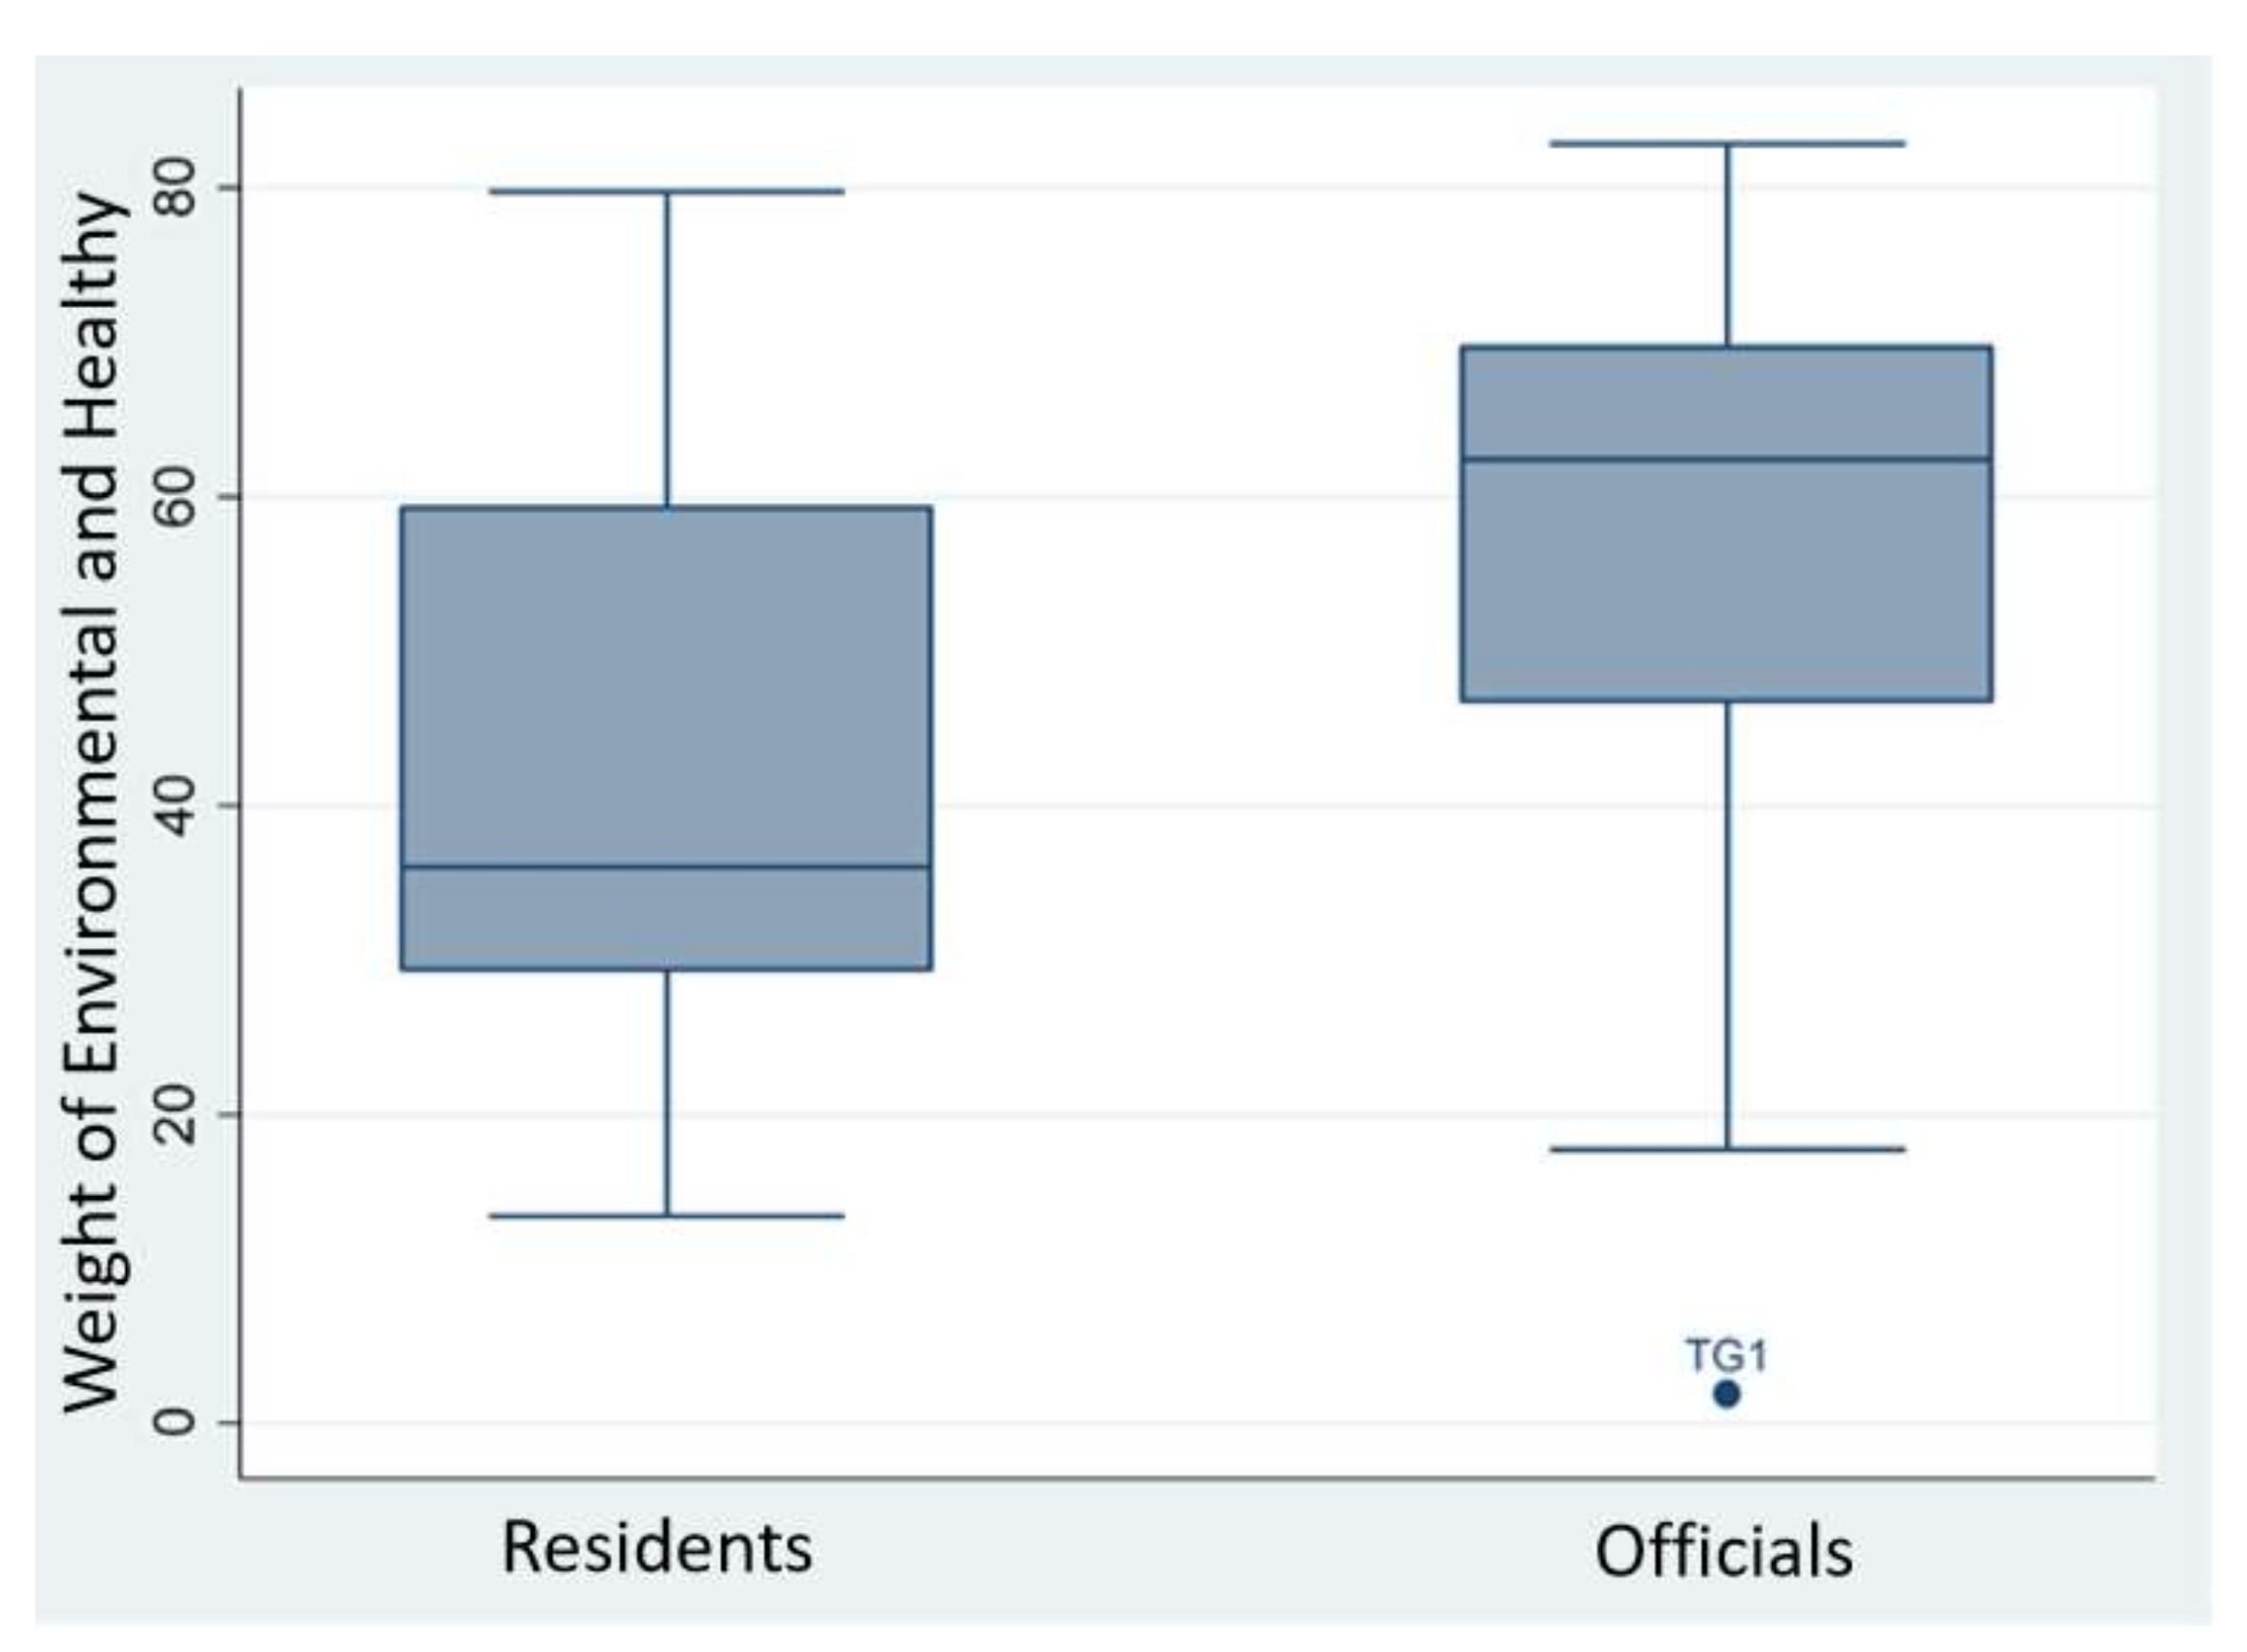
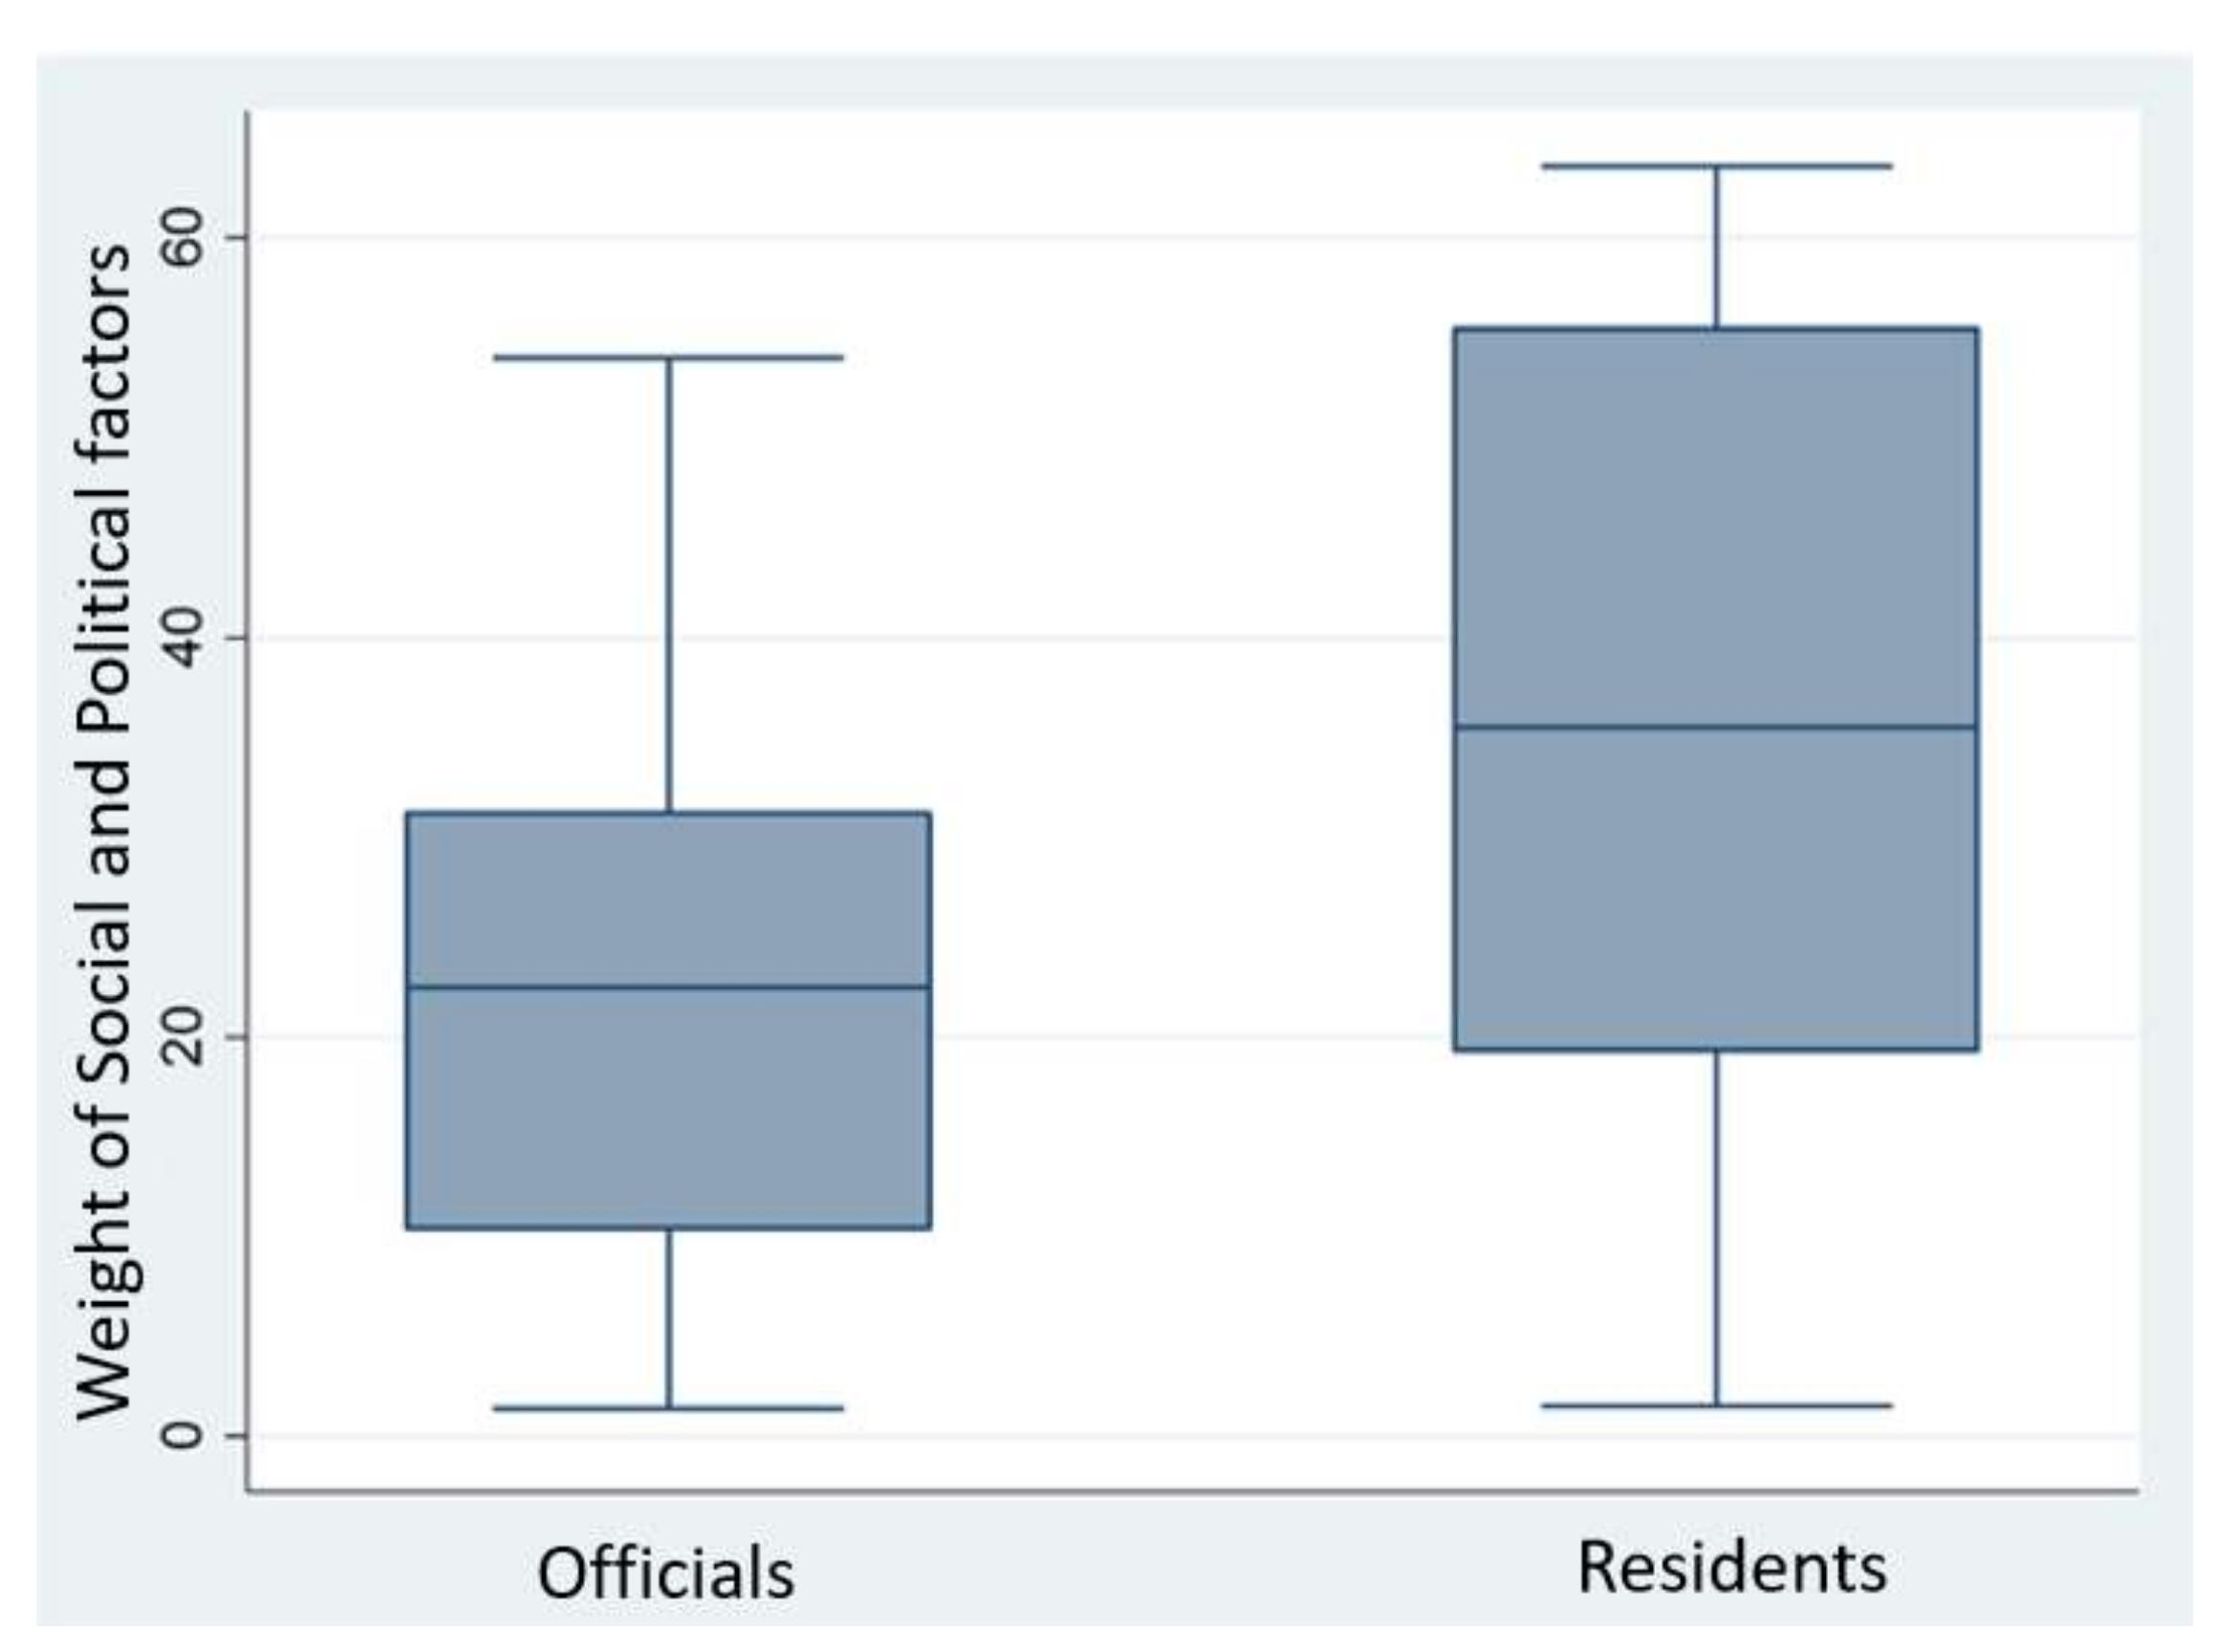
In verifying H4 and comparing the benefit and risk perceptions of the public and officials, the main argument of the study can be demonstrated by comparing the weight of cues. After comparing “economic benefits” and “social and political factors”, we found that local officials responsible for endorsing and supervising plants attached more significance to environmental factors than the local people around the plant, who focused more on social and political factors than the officials. There was no significant difference in their cognitive beliefs about economic benefits. Thus, it can be seen that there is a cognitive conflict between government officials and villagers regarding the same facility, and it is informed by the importance they place on different factors. This conflict does not exist between “economic benefits” and “social and political” cues, but instead between “social and political factors” and “environmental health” cues. Yet that appears to run counter to common sense: government officials prefer overall utility, and refer to economic benefits, whereas the public focuses on their surroundings, such as residential environmental quality [15,16,17]. In contrast, most officials, as members of society, may dislike polluters more. Social and political factors, such as a relocation allowance and policy legitimacy, might also be important factors leading to conflicts, which confirms the findings of previous research [11,24,25].
From another perspective, it might be false and even misleading to use the ‘official-people’ dichotomy when siting controversial facilities. We can offer two possible explanations for such a result. On the one hand, in the former hypothesis, we considered officials and residents as two different groups. If we take them as one group, we find that the officials have a relatively higher income and are well-educated and younger. They are likely to be post-materialists who possess a more intense consciousness towards protecting the environment. On the other hand, residents’ perceptions and interests in their daily lives are more direct and short term, while pollution and safety risks are often chronic and hard to detect. In addition, officials not only make judgements according to rational analyses, but have more information and knowledge [40].
For regional sustainability, the siting and management process of controversial facilities should be more carefully conducted. That means closing up the gap in perception biases between officials and the public in terms of facility location and supervision. As results have proved in China, controversial facilities are not entirely unacceptable to residents. When controversial facilities have been built, and once irrational emotions have dissipated, we may find that there is no significant difference in the weight placed on economic benefits between residents and officials. However, this does not mean that residents can be bribed with money. As residents focus more on social and political factors, they expect more fairness in facility building. In China at present, there are no effective formal communication channels, or a fair distribution of benefits and risks, between the public and the government [10,11]. The so-called communication is mostly limited to propaganda, which means the public enjoys little “discourse power” [29]. A formal communication mechanism, reasonable benefit distribution, and fair institutional arrangements may be solutions to conflicts over siting or NIMBYism.
It is also necessary to take more concrete actions to mitigate cognitive biases so as to bring about the positive effects of the controversial facilities and promote sustainable development in the region. First of all, builders and managers should reinforce public relations to change perceptions concerning region-friendly design and construction [41]. Second, the experience of water governance in southern China indicates that an effective cooperation network with government is essential to rational sustainability in China [42]. Finally, after controlling for the negative effects of the controversial facilities, managers should raise awareness of the positive effects of such facilities and turn issues into resources [43].
As a possible origin of the NIMBY syndrome, the benefit and risk perceptions of controversial facilities in China are worthy of investigation. It is important to begin more extensive and in-depth studies in the field of cognitive conflict. Broader fields of study and more detailed factors will need to be involved in future studies. Meanwhile, when studying controversies and crisis management in China, the complicated bureaucratic administrative system cannot be ignored. This study delivered preliminary findings on cognitive conflicts between officials and residents with a small sample, but the specific reasons and impacts are left to future studies.

6. Conclusions

This paper revealed the perception biases of officials and members of the public toward controversial facilities. Perception biases mainly relate to the benefit and risk perceptions of such facilities. An experimental method was used to elucidate these biases. Results indicated that the public gave greater weight to social and political factors more than government officials, while environmental health had greater weight among the officials. Meanwhile, economic benefits and environmental health were almost equally weighted. These results confirmed the existing research findings using a novel method with evidence from China. Further studies could usefully concentrate on the reasons for such biases and use new methods to fill the gap.

Acknowledgments

This work was supported by Young Scholars Program of Shandong University under Grant 2015WLJH10 and Key Research Project 2016 of the Ministry of Education under Grant 16JZD026. We gratefully thank to Nath Aldalala’a’s, Liangdong Lu’s and Yusi Chen’s suggestion and comments in writing and revising the article, and thanks to Jiabing Lu for his help in data analysis and suggestion in methodolgy. We also thank to Da Hong, Mengzhen Qin, Limin Liu and Yushan Zhang for their data collection, suggestion, and comments.

Author Contributions

Authors contributed equally to this work.

Conflicts of Interest

The authors declare no conflict of interest. The founding sponsors had no role in the design of the study; in the collection, analyses, or interpretation of data; in the writing of the manuscript, and in the decision to publish the results.

Appendix A

Table A1. Table of R2 and demographic variables.
GroupIDR-SquareGenderAgeEducational Level
the general publicVC1 *0.67male41–50High School
VC20.86male51–60Junior High School
VC30.85male51–60High School
VC4 *0.68male41–50Junior High School
VC50.85male31–40Bachelor’s Degree
VC60.89male51–60High School
VC70.75male31–40High School
VC8 *0.68male31–40Bachelor’s Degree
VC9 *0.57male41–50Junior High School
VC100.8male51–60Primary School
VC11 *0.56male31–40College
VC120.86male51–60High School
VC13 *0.55male41–50Primary School
VC140.88male31–40Primary School
VC15 *0.41male31–40High School
ZZV10.76male41–50Junior High School
ZZV20.82female31–40Primary School
ZZV30.8malemore than 60Junior High School
ZZV40.79malemore than 60High School
ZZV50.89male41–50Junior High School
ZZV6 *0.53male41–50Primary School
ZZV7 *0.61female41–50Primary School
ZZV80.82malemore than 60Primary School
ZZV90.9male41–50Junior High School
CMV10.95male20–30College
CMV20.92male41–50Junior High School
government officialMPCO10.85male31–40College
MPCO20.93male31–40Master’s Degree
MPCO30.88female20–30Master’s Degree
MPCO4 *0.56male20–30Master’s Degree
MPCO50.82male31–40College
MPCO60.93male31–40Master’s Degree
MPCO70.94male31–40College
AWS10.86male31–40College
AWS20.85male31–40College
AWS30.84female31–40College
AWS40.83male31–40Master’s Degree
AWS50.76female20–30College
AWS60.73male41–50College
AWS70.8female20–30College
AWS8 *0.48male31–40College
DRC10.8female20–30College
DRC20.87male31–40College
DRC30.86male31–40College
DRC40.78female20–30College
DRC5 *0.46male31–40College
DRC6 *0.65female20–30Master Degree
TG10.94male31–40College
TG2 *0.51female20–30College
TG30.8male20–30College
TG40.89male51–60Junior High School
Note: We did not take samples with the “*” mark into calculation because of their low R2 value.

Appendix B

Table A2. Values of cues.
ProfileEconomic BenefitEnvironmental HealthSocial and Political Factors
Profile 1147
Profile21710
Profile3177
Profile41410
Profile5441
Profile6471
Profile74710
Profile84101
Profile9714
Profile1010710
Profile117107
Profile127101
Profile131014
Profile141047
Profile151071

Appendix C

Table A3. One-Sample Kolmogorov–Smirnov Test on three cues.
ItemsWeight of Economic BenefitWeight of Environment and HealthWeight of Social and Politics
N373737
Normal Parameters a,bMean19.744450.391229.3509
Std. Deviation17.8222821.4554319.07818
Most Extreme DifferencesAbsolute0.2110.120.123
Positive0.2110.0730.123
Negative−0.142−0.12−0.093
Kolmogorov–Smirnov Z1.2840.7310.747
Asymp. Sig. (2-tailed)0.0740.6580.632
a Test distribution is Normal; b Calculated from data.

Appendix D

Table A4. T-test of the general public’s and officials’ weight on three cues.
VariableLevene’s Test for Equality of VariancesT-Test for Equality of Means
tdfSig. (2-tailed)Mean DifferenceStd. Error Difference95% Confidence Interval of the Difference
FLowerUpper
Weight of Economic Benefits0.19Equal variances−0.45310.66−1.573.51−8.725.57
Weight of Environment and Health1.87Equal variances−2.52340.02−15.776.25−28.47−3.06
Weight of Social and Political Factors5.91Unequal variances2.2527.940.0313.796.121.2626.32

References

  1. Pelekasi, T.; Menegaki, M.; Damigos, D. Externalities, NIMBY syndrome and marble quarrying activity. J. Environ. Plan. Manag. 2012, 55, 1192–1205. [Google Scholar] [CrossRef]
  2. Mah, N.Y.; Hills, P.; Tao, J. Risk perception, trust and public engagement in nuclear decision-making in Hong Kong. Energy Policy 2014, 73, 368–390. [Google Scholar] [CrossRef]
  3. Visschers, V.H.M.; Keller, C.; Siegrist, M. Climate change benefits and energy supply benefits as determinants of acceptance of nuclear power stations: Investigating an explanatory model. Energy Policy 2011, 39, 3621–3629. [Google Scholar] [CrossRef]
  4. Lake, R.W. Planners’ alchemy transforming NIMBY to YIMBY: Rethinking NIMBY. J. Am. Plan. Assoc. 1993, 59, 87–93. [Google Scholar] [CrossRef]
  5. Luloff, A.E.; Albrecht, S.; Bourke, L. NIMBY and the hazardous and toxic waste siting dilemma: The need for concept clarification. Soc. Nat. Resour. 1998, 11, 81–89. [Google Scholar] [CrossRef]
  6. Kuhlman, T.; Farrington, J. What is Sustainability? Sustainability 2010, 2, 125–140. [Google Scholar] [CrossRef]
  7. McAvoy, G.E. Controlling technocracy: Citizen rationality and the Nimby syndrome. Policy Stud. J. 1999, 36, 397–398. [Google Scholar]
  8. Quah, E.; Tan, K.C. Siting Environmentally Unwanted Facilities: Risks, Trade-offs and Choices; Elgar: Northampton, UK, 2002; pp. 23–46. ISBN 1858987105. [Google Scholar]
  9. Rabe, B.G. Beyond Nimby: Hazardous Waste Siting in Canada and the United States; Brookings Institution: Washington, DC, USA, 1994; p. 199. ISBN 0815773080. [Google Scholar]
  10. Johnson, T. Environmentalism and NIMBYism in China: Promoting a rules-based approach to public participation. Environ. Politics 2010, 19, 430–448. [Google Scholar] [CrossRef]
  11. Wolsink, M. Wind power and the NIMBY-myth: Institutional capacity and the limited significance of public support. Renew. Energy 2000, 21, 49–64. [Google Scholar] [CrossRef]
  12. Burby, R.J.; Dalton, L.C. Plans can matter! The role of land use plans and state planning mandates in limiting the development of hazardous areas. Public Adm. Rev. 1994, 54, 229. [Google Scholar] [CrossRef]
  13. Takahashi, L.M.; Dear, M.J. The changing dynamics of community opposition to human service facilities. J. Am. Plan. Assoc. 1997, 63, 79–93. [Google Scholar] [CrossRef]
  14. Takahashi, L.M.; Gaber, S.L. Controversial facility siting in the urban environment resident and planner perceptions in the United States. Environ. Behav. 1998, 30, 184–215. [Google Scholar] [CrossRef]
  15. Sjöberg, L. Risk perception: Experts and the public. Eur. Psychol. 1998, 3, 1–12. [Google Scholar] [CrossRef]
  16. Slovic, P. Trust, emotion, sex, politics, and science: Surveying the risk-assessment battlefield. Risk Anal. 1999, 19, 689–701. [Google Scholar] [CrossRef] [PubMed]
  17. Hansen, J.; Holm, L.; Frewer, L.; Robinson, P.; Sandøe, P. Beyond the knowledge deficit: Recent research into lay and expert attitudes to food risks. Appetite 2003, 41, 111. [Google Scholar] [CrossRef]
  18. Greenberg, M.; Schneider, D.; Martell, J. Hazardous waste sites, stress, and neighborhood quality in USA. Environmentalist 1994, 14, 93–105. [Google Scholar] [CrossRef]
  19. Lake, R.W.; Disch, L. Structural constraints and pluralist contradictions in hazardous waste regulation. Environ. Plan. A 1992, 24, 663–681. [Google Scholar] [CrossRef]
  20. Slovic, P.; Finucane, M.L.; Peters, E.; Macgregor, D.G. Risk as analysis and risk as feelings: Some thoughts about affect, reason, risk, and rationality. Risk Anal. 2004, 24, 311–322. [Google Scholar] [CrossRef] [PubMed]
  21. Dan, V.D.H. NIMBY or not? Exploring the relevance of location and the politics of voiced opinions in renewable energy siting controversies. Energy Policy 2007, 35, 2705–2714. [Google Scholar] [CrossRef]
  22. Slovic, P. Perceived risk, trust, and democracy. Risk Anal. 2010, 13, 675–682. [Google Scholar] [CrossRef]
  23. Pol, E.; Moreno, E.; Guàrdia, J.; Íñiguez, L. Identity, quality of life, and sustainability in an urban suburb of Barcelona adjustment to the city-identity-sustainability network structural model. Environ. Behav. 2002, 34, 67–80. [Google Scholar] [CrossRef]
  24. Krohn, S.; Damborg, S. On public attitudes towards wind power. Renew. Energy 1999, 16, 954–960. [Google Scholar] [CrossRef]
  25. King, T.J. Damming the flow: Cultural barriers to perceived ‘procedural justice’ in Wonthaggi, Victoria. Cult. Stud. Rev. 2010, 16, 1465–1477. [Google Scholar] [CrossRef]
  26. Jin, S.C. The roles of affect and cultural heuristics in benefit and risk perception for collaborative resolution of NIMBY conflict: Crematory facility siting in Korea. Int. Rev. Public Adm. 2009, 13, 33–43. [Google Scholar] [CrossRef]
  27. Dear, M.J. Understanding and overcoming the NIMBY syndrome. J. Am. Plan. Assoc. 1992, 58, 288–302. [Google Scholar] [CrossRef]
  28. Krannich, R.; Little, R.; Cramer, L.A. Rural community residents’ views of nuclear waste siting in Nevada. In Public Reactions to Nuclear Waste: Citizens’ Views of Repository Siting; Dunlap, R.E., Kraft, M.E., Rosa, E.A., Eds.; Duke University Press: Durham, NC, USA, 1993; pp. 263–287. [Google Scholar]
  29. Sun, C.; Nan, L.; Ouyang, X. Chinese public willingness to pay to avoid having nuclear power plants in the neighborhood. Sustainability 2014, 6, 7197–7223. [Google Scholar] [CrossRef]
  30. Sjöberg, L. Risk perception by the public and by experts: A dilemma in risk management. Hum. Ecol. Rev. 1999, 6, 1–9. [Google Scholar] [CrossRef]
  31. Hammond, K.R.; Stewart, T.R.; Brehmer, B.; Steinmann, D.O. Social judgment theory. In Human Judgement and Social Policy: Irreducible Uncertainty, Inevitable Error, Unavoidable Injustice; Arkes, H.R., Hammond, K.R., Eds.; Cambridge University Press: New York, NY, USA, 1986; pp. 56–76. ISBN 0195143272. [Google Scholar]
  32. Hammond, K.R. Human Judgement and Social Policy: Irreducible Uncertainty, Inevitable Error, Unavoidable Injustice; Oxford University Press: New York, NY, USA, 1996; pp. 60–92. ISBN 0-19-509734-3. [Google Scholar]
  33. Hammond, K.R.; Stewart, T.R.; Brehmer, B.; Steinmann, D.O. Social judgment theory. In Human Judgement & Decision Processes; Kaplan, M.F., Schwartz, S., Eds.; Academic Press: New York, NY, USA, 1975; pp. 271–312. [Google Scholar] [CrossRef]
  34. Brunswik, E. Representative design and probabilistic theory in a functional psychology. Psychol. Rev. 1955, 62, 193–217. [Google Scholar] [CrossRef] [PubMed]
  35. Cooksey, W.R. The methodology of social judgement theory. Think. Reason. 1996, 2, 141–174. [Google Scholar] [CrossRef]
  36. Hunter, S.; Leyden, K.M. Beyond NIMBY: Explaining opposition to hazardous waste facilities. Policy Stud. J. 2010, 23, 601–619. [Google Scholar] [CrossRef]
  37. Sun, C.; Meng, X.; Peng, S. Effects of waste-to-energy plants on China’s urbanization: Evidence from a hedonic price analysis in Shenzhen. Sustainability 2017, 9, 475. [Google Scholar] [CrossRef]
  38. Warren, C.R.; Lumsden, C.; O’Dowd, S.; Birnie, R.V. ‘Green on green’: Public perceptions of wind power in Scotland and Ireland. J. Environ. Plan. Manag. 2005, 48, 853–875. [Google Scholar] [CrossRef]
  39. Lam, K.; Lee, W.; Fung, T.; Woo, L. Challenges of managing NIMBYism in Hong Kong. In Facility Siting in the Asia-Pacific: Perspectives on Knowledge Production and Application; Fung, T., Lesbirel, S.H., Lam, K., Eds.; Chinese University Press: Hong Kong, China, 2011; pp. 169–182. ISBN 978-962-996-406-1. [Google Scholar]
  40. Rohrmann, B.; Ortwin, R. Risk perception research. In Cross-Cultural Risk Perception; Springer: Boston, MA, USA, 2000; pp. 11–53. ISBN 978-1-4757-4891-8. [Google Scholar]
  41. Chan, Y.P.; Han, S.H.; Lee, K.W.; Yong, M.L. Analyzing Drivers of Conflict in Energy Infrastructure Projects: Empirical Case Study of Natural Gas Pipeline Sectors. Sustainability 2017, 9, 2031. [Google Scholar] [CrossRef]
  42. Huang, C.; Chen, T.; Yi, H.; Xu, X.; Chen, S.; Chen, W. Collaborative environmental governance, inter-agency cooperation and local water sustainability in China. Sustainability 2017, 9, 2305. [Google Scholar] [CrossRef]
  43. D’Adamo, I.; Rosa, P.; Terzi, S. Challenges in waste electrical and electronic equipment management: A profitability assessment in three European countries. Sustainability 2016, 8, 633. [Google Scholar] [CrossRef]
Figure 1. A Lens model representation of interpersonal conflict; revised from: [35].
Sustainability 10 01092 g001
Figure 2. Profile of a hypothetical chemical plant.
Sustainability 10 01092 g002
Figure 3. Boxplot for the weight of economic benefits.
Sustainability 10 01092 g003
Figure 4. Boxplot for the weight of environmental health.
Sustainability 10 01092 g004
Figure 5. Boxplot for the weight of social and political factors.
Sustainability 10 01092 g005
Table 1. Indexes for cues.
First-Grade IndexesSecond-Grade IndexesThird-Grade Indexes
Economic benefitsEconomic compensationDirect economic compensation
Indirect economic reward
CareerIncreased employment opportunities
Local developmentRegional industry planning
Environmental healthDistanceDistance from home
Water pollutionPollution of groundwater
Pollution of rivers
Air pollutionFloating particles in the atmosphere
Irritating and corrosive gases
Waste disposal methodCapability of treating pollution
Additional indicatorsAccidental explosions
Social and political factorsPublic participationInformation disclosure
Holding public hearings
Sense of trustOperational capability
Operational risk
Fairness of systemPolicies at present
Relevant laws and regulations
Table 2. Demographic information.
VariablesCategoriesGroup
ResidentsOfficials
GenderMale1614
Female16
Educational LevelPrimary school40
Junior high school61
High school50
College215
Master’s degree04
Age20–3016
31–40412
41–5041
51–6051
60+30
Table 3. The slope of the cues.
GroupCuePositive SlopeNegative Slope
CountPercentageCountPercentage
Residents near X plantEconomic benefits1270.59529.41
Environment and health17100.0000.00
Social and political factors1588.24211.76
Government officialsEconomic benefits1155.00945.00
Environment and health20100.0000.00
Social and political factors1785.00315.00

