Article

Short-Term Wind Electric Power Forecasting Using a Novel Multi-Stage Intelligent Algorithm

1
School of Economics and Management, North China Electric Power University, Beijing 102206, China
2
Beijing Key Laboratory of New Energy and Low-Carbon Development, North China Electric Power University, Changping, Beijing 102206, China
*
Author to whom correspondence should be addressed.
Sustainability 2018, 10(3), 881; https://doi.org/10.3390/su10030881
Submission received: 18 February 2018 / Revised: 8 March 2018 / Accepted: 15 March 2018 / Published: 20 March 2018

Abstract

:
Unmanned aerial vehicles (UAV, drones) used as delivery vehicles have received increasing attention due to their mobility and accessibility to remote areas. The purpose of this study is to evaluate the environmental impacts of drone versus motorcycle delivery and to compare the expected environmental improvements due to drone delivery in urban and rural areas. In addition, the potential environmental contributions of electric motorcycles were assessed to determine the effects of introducing this new type of vehicle. Changes in the national electricity generation plan were also examined. The results showed that global warming potential (GWP) per 1 km delivery by drone was one-sixth that of motorcycle delivery, and the particulates produced by drone delivery were half that of motorcycle delivery. The actual environmental impact reduction in consideration of the delivery distance was 13 times higher in a rural area than in an urban area. Increasing the use of environmentally friendly electricity systems, such as solar and wind power, would further enhance the environmental effects of a drone delivery system.

Graphical Abstract

1. Introduction

Since it was first mentioned at the World Economic Forum in 2016, increased attention has focused on the fourth industrial revolution, which involves maximizing production capacity and efficiency by adding new technologies to existing industries [1,2]. One innovative technology is adding the use of drones (or unmanned aerial vehicles, UAVs) [3,4]. The global drone market reached $552 million in 2014 and is expected to grow every year by 16.9% [5]. Unlike conventional drones that have been widely used for military purposes, the private sector will lead the drone market in the future [6]. Although drones were developed for military purposes and were mainly used as reconnaissance and assault weapons, their use has greatly expanded due to the advantage of collecting a wide range of information as they move rapidly through the sky [7,8,9]. For example, images taken by drones are used in sports broadcasts, documentaries, and media reports. They are even commonly used for humanitarian purposes, such as transporting vaccines in low- and middle-income countries and helping refugees migrate [10,11,12].
Drone use in logistics services has also become common, taking advantage of drones’ sensing abilities using cameras and sensors and their accessibility to difficult terrains [13,14]. For example, Amazon, the largest online retailer in the US, introduced “Amazon Prime Air” in December 2013, which uses self-developed drones called “Octocopters” to deliver goods up to 55 pounds within 30 min to a customer within a radius of 16 km [15,16]. Amazon has already succeeded in testing the drones on several occasions and has acquired a patent for a UAV delivery system [17]. Another global logistics company, DHL, developed third-generation drones and has assessed the feasibility of use for the entire delivery system, including flight technology, accurate shipping and storage, flight performance, and autonomous flight [13]. Drone use for delivery has also been tested for food delivery services, where delivery speed is critical. For example, in San Francisco, delivering tacos by drones was piloted, and Domino’s succeeded in developing a commercial delivery of pizza by drone in November 2016 [18,19,20].
To apply drone capabilities to actual logistics services, research has been conducted on how drones can be combined with existing truck delivery services. Murray and Chu [6] and Agatz, et al. [21] proposed a model to solve the travelling salesman problem in the context of drone delivery. Carlsson and Song [22] also claimed that using drones along with the current delivery system could improve the efficiency of travel distance by a square root of the ratio of the speeds of a truck and UAV. Based on these assumptions, scholars have conducted research on the economic efficiency of drone use. Choi and Schonfeld [23] calculated the necessary size of a drone fleet to minimize delivery costs and found that the cost varies depending on the working period, operating speed, demand density, and battery capacity. In addition, Welch [15] conducted a cost-benefit analysis of the Amazon Prime Air service, and it was predicted that Amazon would gain a competitive advantage over other companies through the introduction of drone delivery and that the benefits would be greater than the initial cost for system construction.
As the problems related to the drones such as safety and privacy issues were raised, countries established regulations for the commercial use of drones, and some studies have analyzed and compared the regulations of each country [24,25]. In February 2015, the US Federal Aviation Authority (FAA) established an approval process for companies trying to use the drones commercially. According to this law, operators must pass a written exam developed for a private pilot, which is administered by the Transportation Security Administration. Also, operators must observe the safety regulations restricting the flight area of drones to be away from private property, and at least six miles away from the airport [26]. Not only the government, but also the drone industry, has made efforts to set up regulations and follow them. Unmanned Vehicle Systems International, which represents the US drones industry, has released a Code of Conduct to protect privacy and liberty rights. Also, DJI Innovations, a drone manufacturer, recently applied a GPS system to prevent the drones from entering restricted areas or flying higher than their permitted height.
Other countries also have their own laws regarding the commercial use of drones. According to Jones, the commercial use of drones is prohibited or practically prohibited due to strict requirements in 16 countries, and 18 countries, including Korea, allow drones to be operated only within visual line of sight. On the other hand, 27 countries, including the United States and Japan, have made an exception to the visual line of sight restriction to allow the commercial use of drones if they have been approved in advance or the weight or altitude of the drones is within the permitted range. Finally, six countries have made the drones commercially viable if they meet the simple guidelines such as obtaining licenses. As the technological and social situations of drones are constantly changing, the laws regarding drones are also constantly being updated, usually toward permitting drone use [27].
In addition to studies on costs and regulations, studies on environmental impacts should also be conducted prior to the introduction of this new technology. Stolaroff [28] called for a life cycle assessment (LCA) of drone delivery to establish rules and regulations; however, to date, limited research has been done on the relative merit of drone delivery in terms of environmental impacts, although some studies have analyzed the energy use and CO2 emissions of drones. In particular, Goodchild and Toy [29] showed that the relative CO2 emissions of drones compared to trucks vary according to the drones’ energy requirements, travel distances, and number of recipients. To increase the advantages of drone delivery in terms of CO2 emissions, energy requirements should be low, the delivery distance should be short, and the number of recipients should be small. Figliozzi [30] also calculated the life cycle CO2 emissions of drones and conventional diesel vans. While the CO2 emissions per unit distance were much lower for drones, the relative advantage of drones was lost when the customers were grouped because drones can only deliver to one place at a time. Lohn [31] identified the same weakness of drones and recommended additional drone centers to conserve energy.
Several studies have suggested that drones have the potential to conserve energy and to reduce CO2 emissions; however, because there is no infrastructure for drone delivery yet, few scholarly analyses have been conducted to determine the actual CO2 reduction when drones are used in cities. Other environmental impacts must be considered as well. Many companies are striving to reduce environmental pollution as part of their corporate social responsibility, and the Korean government has implemented a certification system and subsidies for green logistics companies [32]. Therefore, a comprehensive and specific analysis of the environmental impacts of drone delivery is needed in preparation for the application of drones in the logistics industry.
The purpose of this study was to evaluate and compare the environmental impacts of an existing motorcycle delivery system and a new drone delivery system to deliver food using the LCA. Regional variations of environmental improvement impacts after introducing drones were also evaluated based on the average delivery distance in urban and rural areas. In addition, other factors that could affect the results were examined, such as the introduction of electric motorcycles and changes in the way electricity is produced.

2. Materials and Methods

2.1. The Item to Be Shipped and the Shipping Method

Shipping distance and fuel efficiency were considered to evaluate the amount of pollutants and the environmental impacts of the delivery method. To focus on the delivery stage to compare a conventional and drone-based delivery system, information regarding some conditions that are unavailable for drones was excluded from the scope of this study, including the price and maintenance costs of drones, the current technology development stage, the delivery failure rate, and weather conditions.
Using drones for delivery facilitates access to areas that are inaccessible or difficult to reach by land, and delivery time is decreased by avoiding traffic congestion; however, a limited battery life and load capacity make drones unsuitable for long distances or large capacity freight. In addition, previous studies have shown that drones are inefficient compared to other modes of transportation when delivering to multiple destinations in the same area. Therefore, using drones for food delivery is more appropriate than parcel delivery because the weight and volume of the products are constant, the shipping distance is relatively short, and the recipients are much less likely to be absent. In addition, the advantage of drone delivery speed can be maximized for food delivery because a faster delivery speed prevents the food from becoming cool or spoiled. Thus, food delivery was selected as the delivery item for the current study.
Food delivery service is well developed in Korea and is expected to grow more due to structural changes of the population, such as the increase of single-person households, and the enhanced convenience of using delivery service according to technological development. Food delivery in Korea is mostly done by using a motorcycle to deliver to one house at a time, which is a suitable condition to change the delivery means to drones. Specific delivery distance was necessary in order to make an accurate comparison between drone and motorcycle delivery. Therefore, in this study, a specific food and brand was selected. The three most common delivery foods in Korea were chicken, pizza, and Chinese food [33]. In this study, pizza was selected because there was little volume difference between each menu and the packaging was light. Also, Domino’s has already tested the use of drones to deliver pizza and has proven that it is feasible [19].
Unlike packages, which are typically delivered by truck, pizza is mainly delivered by motorcycle in Korea. Therefore, the environmental impacts of pizza delivery by motorcycle and by drone were compared in this study. To evaluate the environmental impact of drone delivery, the environmental impact of 1 kWh of electricity was evaluated. Then, shipping distance and electricity consumption per unit distance were multiplied to calculate the environmental impact value for a single drone delivery. The electricity consumption per unit distance was obtained by referring to the product information of a specific drone model. The selected model was MD4-1000 (Microdrones GmbH: Siegen, Germany) from Microdrones, which was successfully used in DHL’s delivery test of drugs in 2014. MD4-1000 has an average flight time of 45 min and a flight speed of 12 m/s using a 22.2 V, 13,000 mAh battery (Microdrones). For the motorcycle test, the environmental impact of 1 L of gasoline was evaluated and then multiplied by the gasoline mileage and the shipping distance to calculate the environmental impact value for a single delivery. The gasoline mileage value used in this study was 63.5 km, which is the mileage of a Honda Super Cub, a motorcycle model for business purposes.

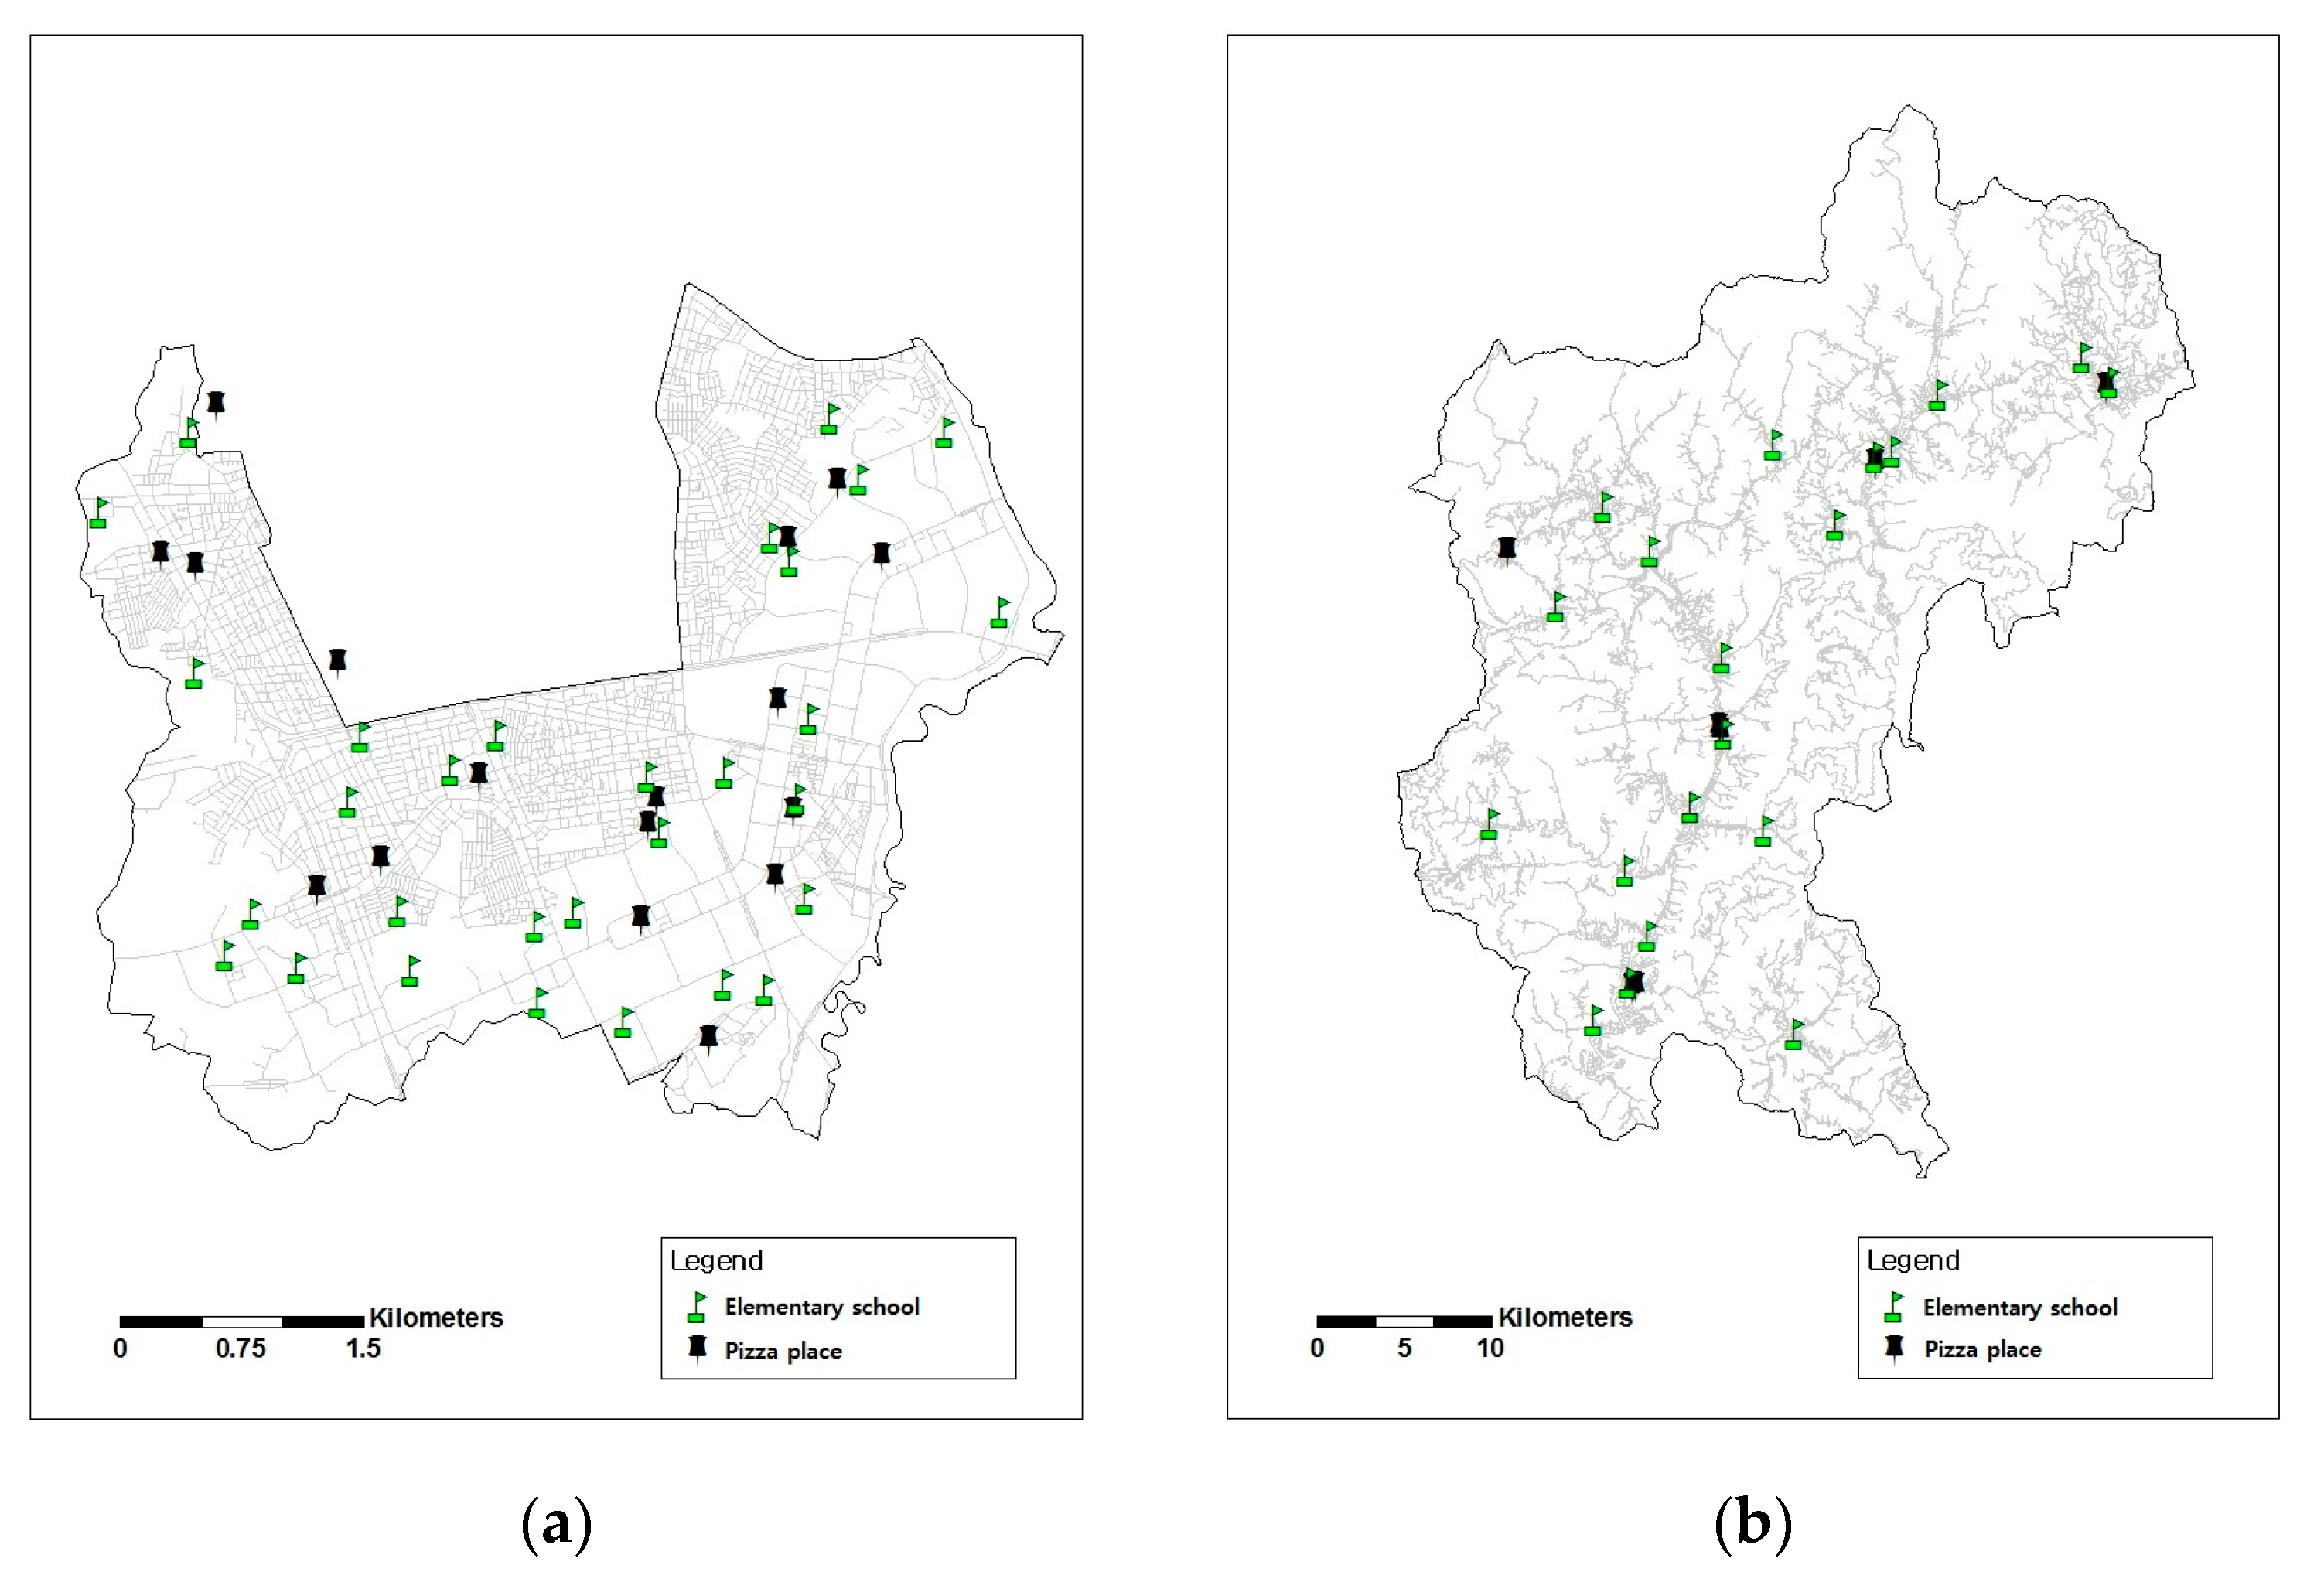
2.2. Target Area and Shipping Distance

Drone delivery was introduced to reduce shipping costs in countries with large land areas, a low population density, and high labor costs. They have been particularly suitable in rural areas where the population density and accessibility by land are lower than for cities. In addition, introducing drone delivery to rural areas could be more cost-effective and environmentally friendly. To compare the environmental improvement effects of using drone delivery in urban and rural areas, Yangcheon-gu, which has the highest population density (26,463.6 per km2) in Seoul, and Pyeongchang-gun, Gangwon-do, which has a low population density (27.6 per km2), were selected.
Since the environmental impacts of delivery increase proportionally with the distance traveled, it is important to estimate the appropriate shipping distance in each region. The location of elementary schools in each region was used to determine the shipping distance because the location of elementary schools can easily be determined in both urban and rural areas and because they reflect the actual residential area of the local residents. According to Rules on the Structure and the Establishment of Urban Facilities, schools are constructed to maintain proper distance intervals considering the population density and estimated student enrollment. One elementary school serves two neighboring residential districts, and the commute distance should be within 1500 m. In other words, the number and location of elementary schools are determined based on the population size, density, and residential areas of the region. Furthermore, according to a study in Pyeongchang-gun by [34], town halls, which are the center of the living areas in rural regions, are typically within 5 km of convenient facilities, such as elementary schools, police stations, and public health clinics, suggesting that such facilities could represent the center of each administrative district. Therefore, for 30 elementary schools in Yangcheon-gu and 20 elementary schools in Pyeongchang-gun, the distance from each school to the nearest pizza restaurant was calculated, and the average was used to calculate the environmental impacts of the delivery method in each region (Figure 1).
For drone delivery, the straight-line distance between the elementary school and the pizza restaurant was used. For motorcycle delivery, the actual travel distance was estimated by multiplying the bypass coefficient of Seoul and Gangwon-do to the straight line distance [35]. Pizza restaurants that do not deliver were excluded. For Pyeongchang-gun, the stores located in a resort area were also excluded because they usually do not deliver outside the resort.

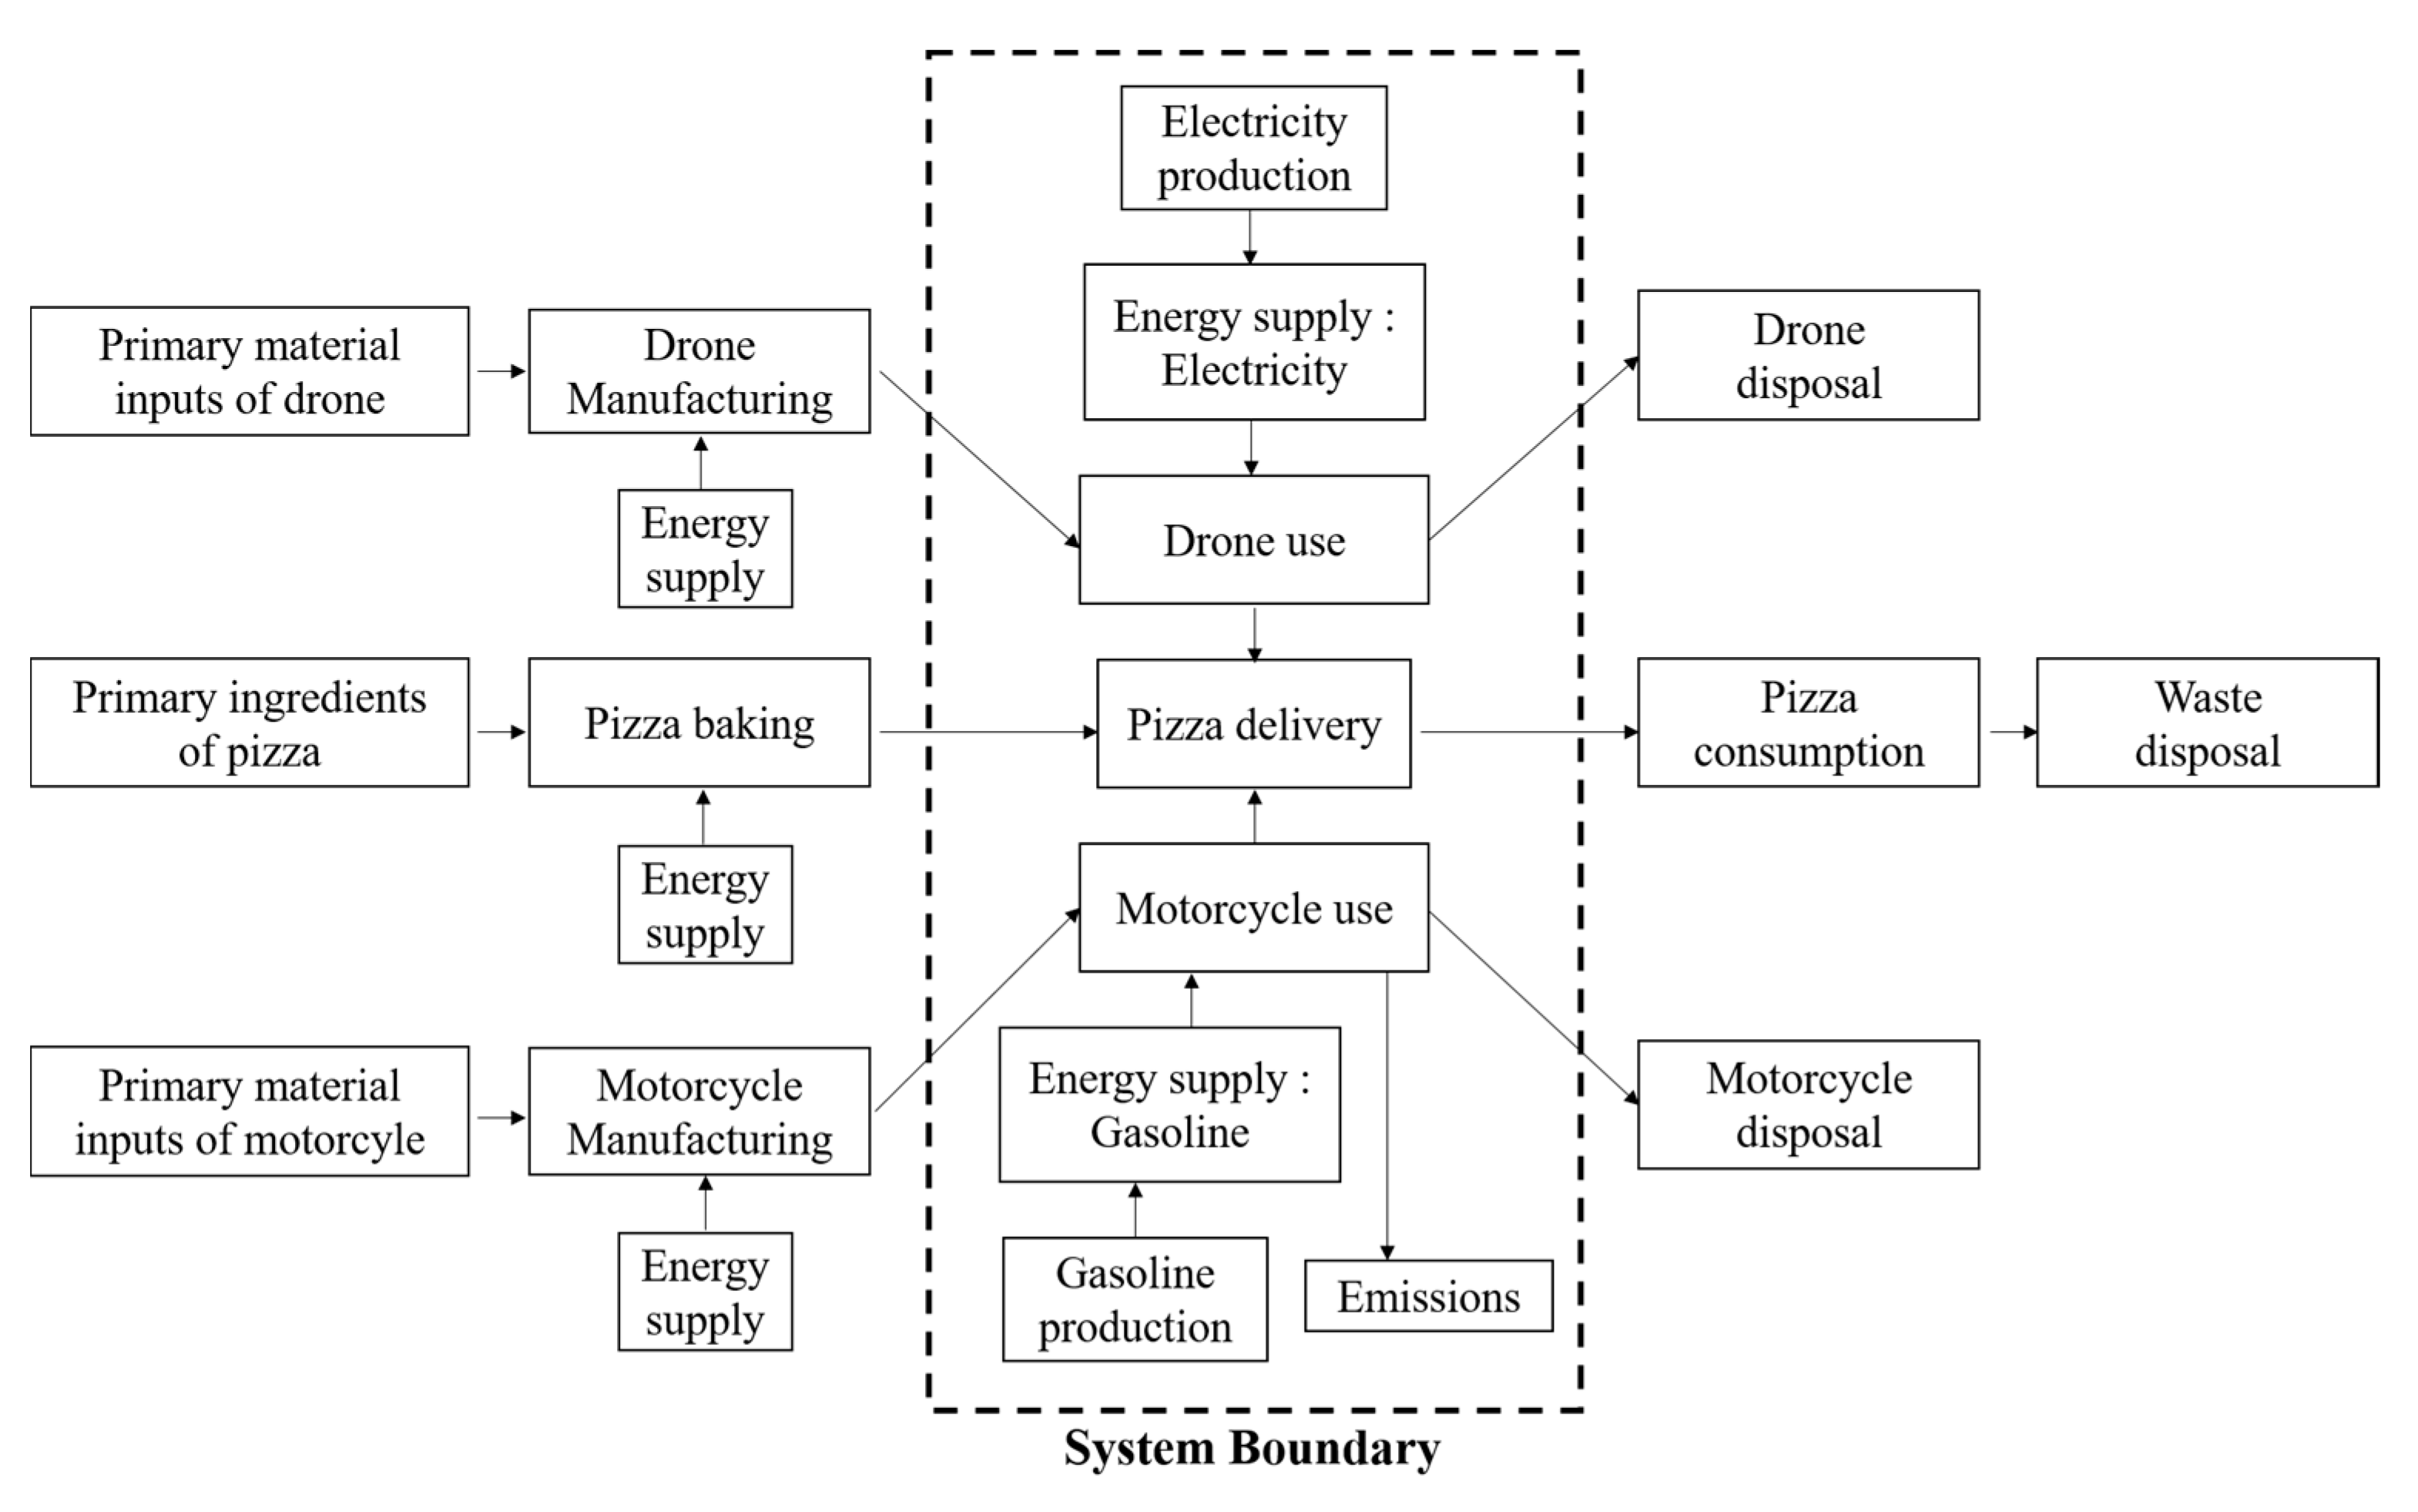
2.3. Life Cycle Analysis (LCA)

LCA quantifies all inputs and outputs to measure environmental impacts and compares the overall environmental impacts of particular products or services [36]. “Life cycle” is a concept that includes all the necessary steps to consume a product, including raw material production, manufacturing, distribution, use, disposal, and transportation. According to ISO 14040, an international standard for environmental management, LCA has four stages: goal and scope definition, life cycle inventory analysis, life cycle impact assessment, and interpretation [37].
The first stage of LCA is to define the purpose and scope of the research. At this stage, the background of the research should be presented. The functional unit, scope of analysis, and allocation method are also determined. A functional unit is a quantitative representation of what is to be analyzed specifically. Especially when comparing various products or services that can replace each other, setting an appropriate functional unit is crucial. The quantity or level of the desired function is defined first, and the number of products or services needed to achieve the function are then calculated. In this study, the functional unit was set as a single delivery of pizza in Yangcheon-gu, Seoul, and Pyeongchang-gun, Gangwon-do. The system boundary determines the scope of the process to be evaluated. The system boundary of this study is the delivery of pizza from the area of production to consumption, and drones and motorcycles were selected as the transportation methods (Figure 2).
A list of inputs and outputs was created during the life cycle inventory (LCI) analysis step. The values of inputs and outputs were applied according to the functional unit determined in the goal and scope definition step. In this study, the LCI data on electricity from a national LCI database provided by the Korea Environmental Industry and Technology Institute (KEITI) were used for drones, and the gasoline LCI data from the same database were used for motorcycles. For gasoline usage, LCI data at the use stage were also included because many types of greenhouse gases and pollutants are emitted during the combustion process. The data related to gasoline combustion were obtained from the US LCI database provided by the National Renewable Energy Laboratory (NREL) [38]. The sum of the environmental impacts from the production and combustion of gasoline was used as the environmental impact of motorcycle delivery.
The purpose of the third step, which is the impact assessment, is to evaluate the actual damage to the environment based on the result of the inventory analysis. The impact assessment step should include characterization, which distributes output materials to impact categories and converts them into a single unit. The normalization and weighting steps may then optionally be performed. Weighting is used to determine the relative importance of each impact category considering its social meaning. The environmental impact value of a product or service can be derived by summing the products of the weighting factors and the normalized value of each category. In this study, TOTAL (a tool for type III labeling and LCA), developed by KEITI, was used for the impact assessment. TOTAL is an LCA software developed by the Korean government. Since the “Enforcement Decree of the Environmental Technology and Industry Support Act” came into effect in 1995, the Korean government has encouraged the use of LCA. As there was no LCA software developed in Korea, software from Europe such as SimaPro and GaBi were used. However, they were not compatible due to different data formats and they were not easy for beginners to access. This led to the development of the government-led LCA software. After analyzing the strengths and weaknesses of various LCA software, and gathering the opinions from various experts, TOTAL was born in 2005. TOTAL provides a national database in the form of an Eco-Spold based on ISO TS 14048, and also provides public databases such as APME and IISI, so that it can be compatible with other LCA software [39]. The results from TOTAL were compared in terms of particulates and the 10 categories selected by the Korean Ministry of Trade, Industry, and Energy (Table 1).
At the interpretation stage, the main issues are summarized, the results are evaluated, and the conclusions are drawn. In this study, the results were compared to a third type of transportation, the electric motorcycle, since it is another environmentally friendly means of delivery. The environmental impact of 1 km of delivery distance by electric motorcycle and the environmental impacts of all three modes of transportation were compared. In addition, the US LCI database was used to compare the reduction effect of drones based on the national power generation schemes.
Finally, the environmental impact of the increased use of renewable energy was estimated.

3. Results and Discussion

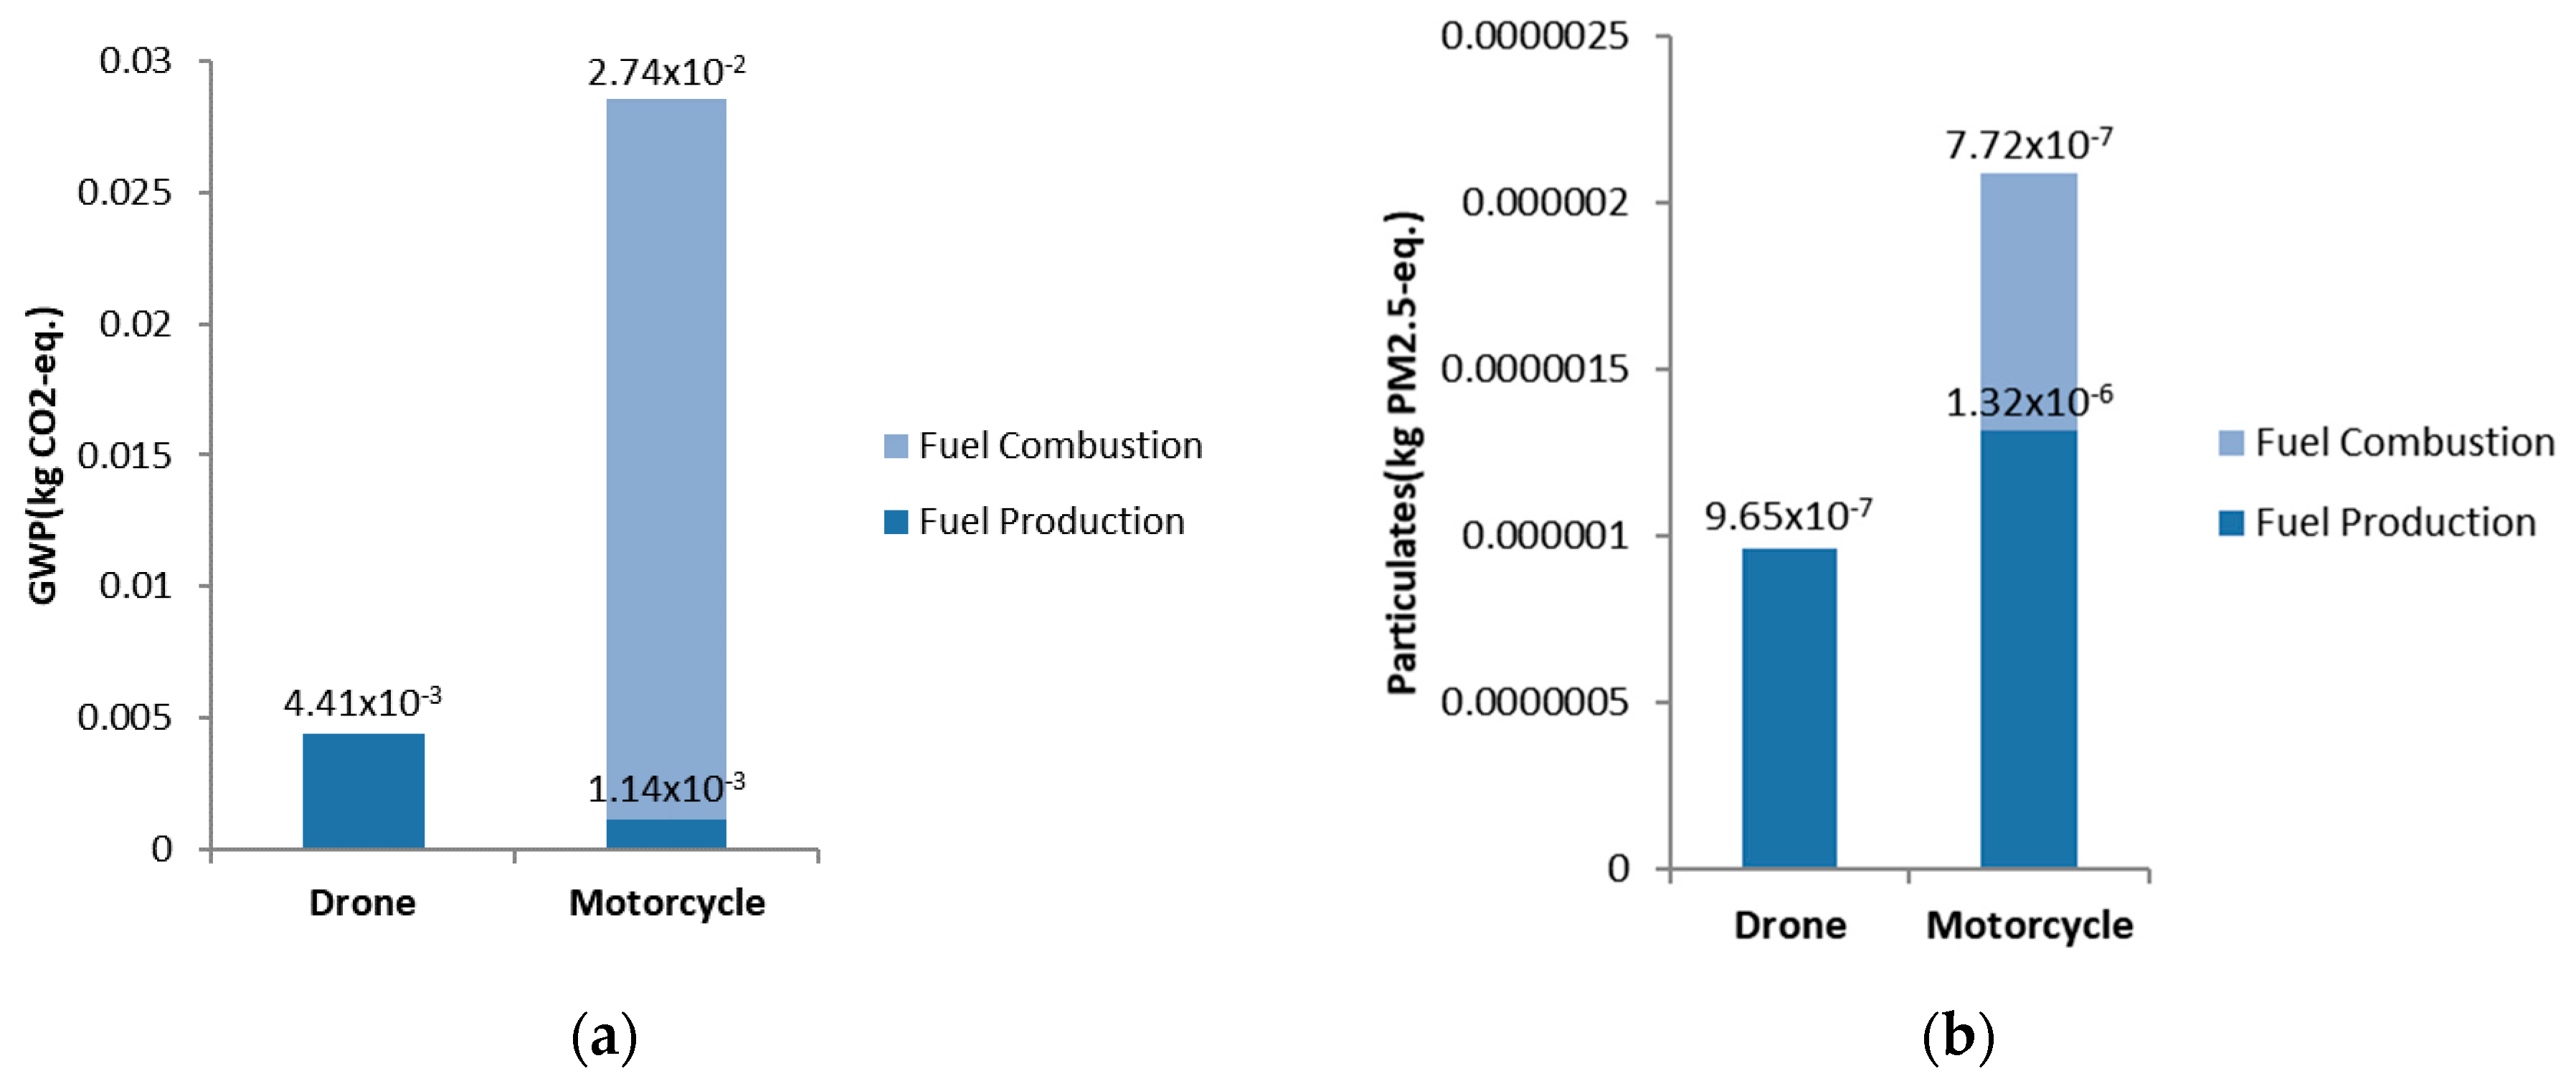
3.1. Comparison of the Environmental Impacts of Motorcycle Delivery and Drone Delivery

The global warming potential (GWP) and the amount of particulates generated for 1 km of delivery with a drone and motorcycle were calculated using the TOTAL software (Figure 3). The GWP of 1 km traveled by drone was 4.41 × 10⁻³ kg CO2-eq. The GWP of 1 km traveled by motorcycle was 2.85 × 10⁻² kg CO2-eq. In the energy production stage, electricity production generated more greenhouse gases than gasoline production; however, the GWP generated by burning gasoline was 24 times more than the production stage, leading to a significant difference in the total GWP. When particulates were compared, 9.65 × 10⁻⁷ kgPM2.5-eq. were generated for drone delivery, and 2.09 × 10⁻⁶ kg PM2.5-eq. were generated for motorcycle delivery. For the particulates, gasoline emissions were higher in both the production and combustion stages. Therefore, it is expected that greenhouse gases and particulates would be reduced if the existing motorcycle delivery method were converted to the drone delivery method.
The environmental impacts of the drone and motorcycle delivery methods were analyzed in the same way for eight other environmental impact categories, including eutrophication, acidification, and ozone layer destruction. Table 2 and Table 3 show the results of the characterization, normalization, and weighting by environmental impact category. The environmental impact difference between drones and motorcycles ranged from four to 518 times, but the environmental impact of motorcycle delivery was higher in nine of the ten categories. On the other hand, the marine aquatic ecotoxicity potential (MAETP) was about 5.22 times higher when using drones, with drones generating 2.25 × 10⁻³ kg 1,4DCB-eq. and motorcycles producing 4.31 × 10⁻⁴ kg 1,4DCB-eq. The weighted environmental impact value was 4.37E × 10−7 for drone delivery and 1.46 × 10⁻⁶ for motorcycle delivery. Therefore, if the delivery vehicle were changed from motorcycles to drones, the GWP and particulates, as well as the overall environmental impact, would decrease.

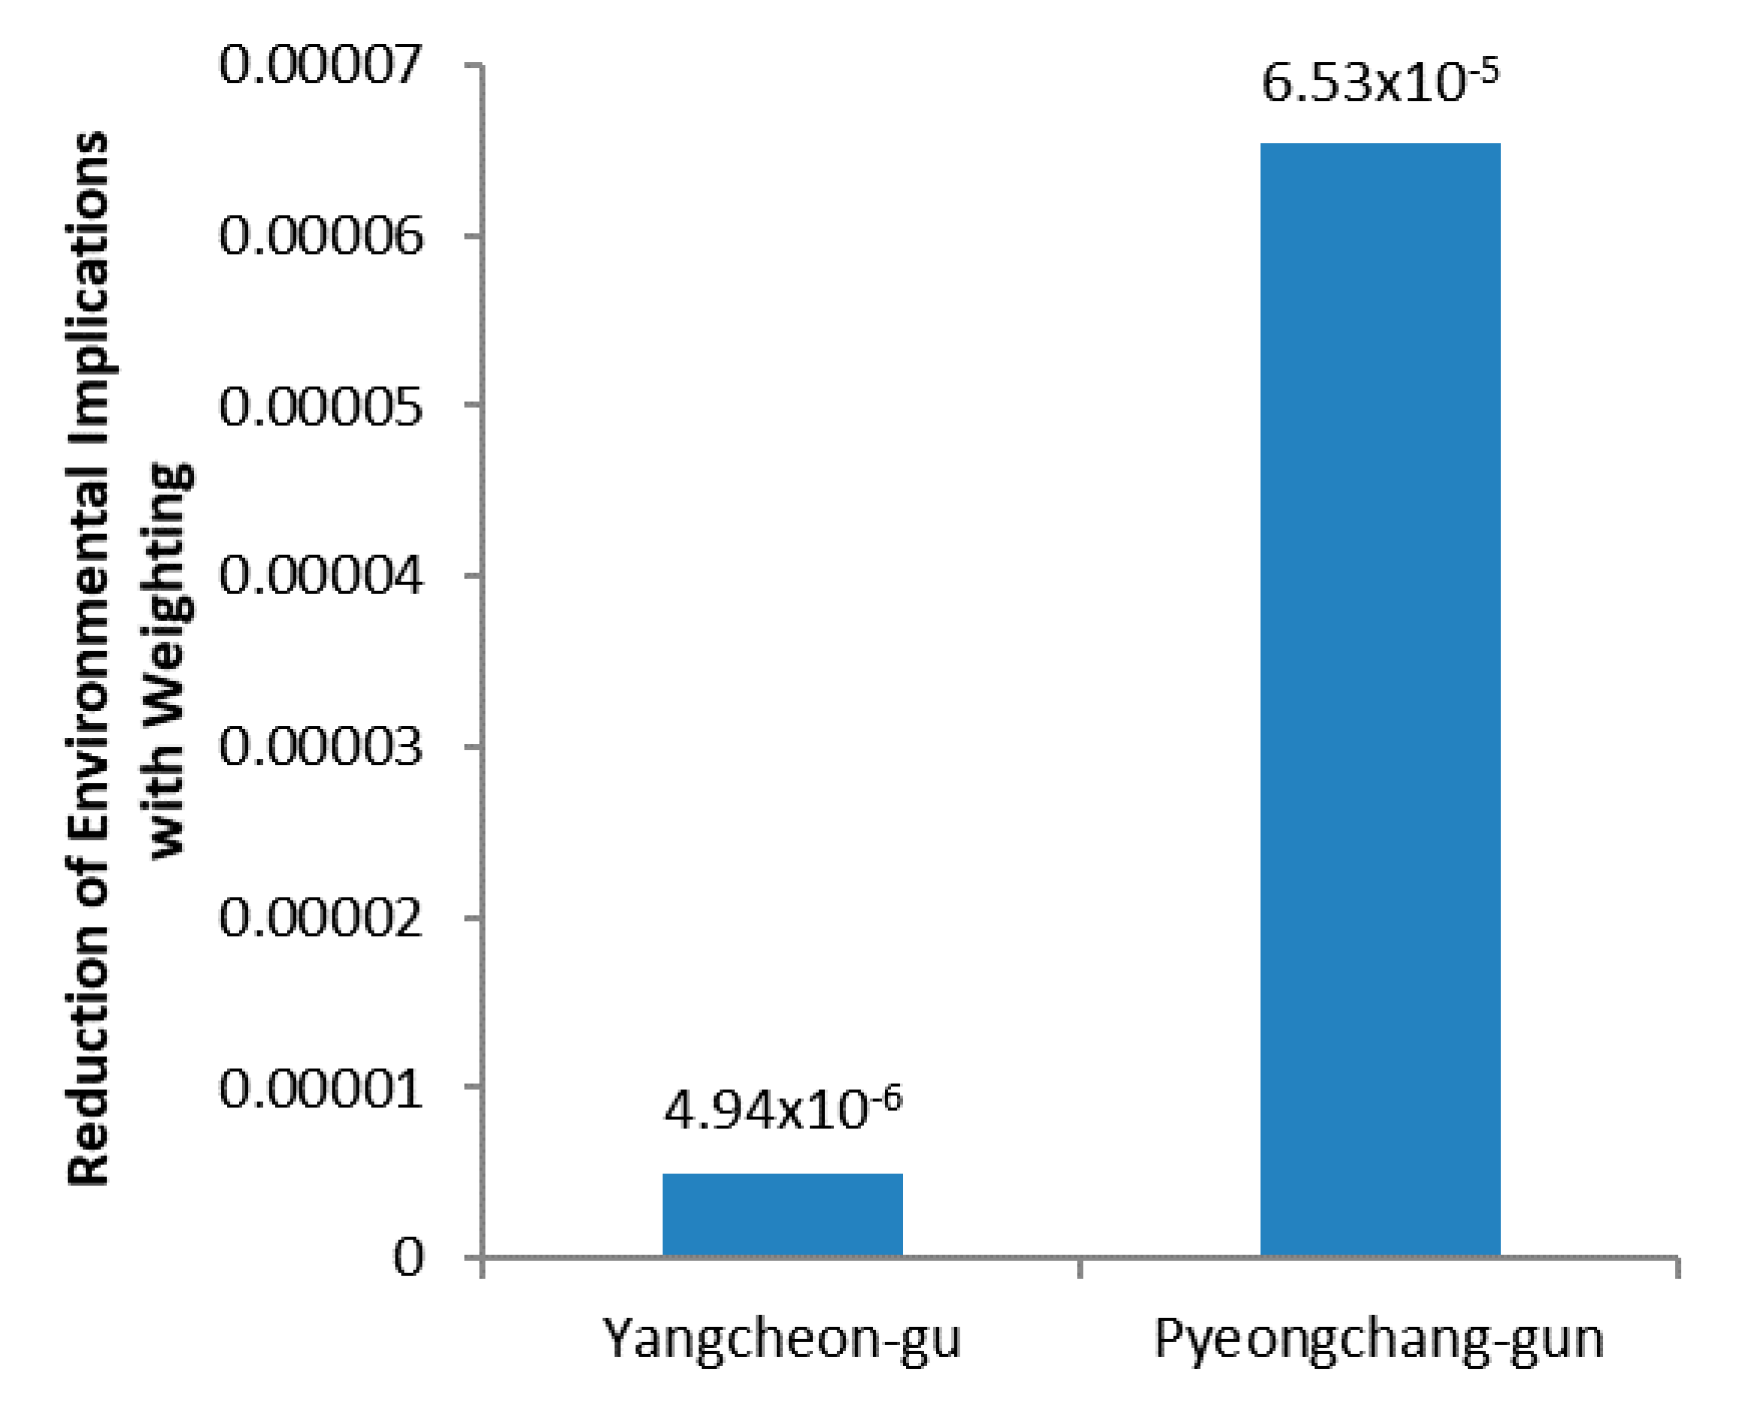
3.2. Comparison of GWP and the Effects of Particulate Reduction between Urban and Rural Areas

Based on the location of elementary schools in Yangcheon-gu and Pyeongchang-gun, the average straight distance for pizza delivery in Yangcheon-gu was 0.40 km, and the average distance of pizza delivery in Pyeongchang-gun was 4.42 km. Therefore, the travel distance of the drones considering the round trip was 0.80 km in Yangcheon-gu and 8.83 km in Pyeongchang-gun. The distance for motorcycle delivery was 0.97 km in Yanggcheon-gu and 12.68 km in Pyeongchang-gun, which was multiplied by the bypass coefficient of each region.
The GWP and particulates generated for one shipment were calculated using the shipping distance by region and pollutants per the 1 km delivery calculations. The GWP produced when delivering pizza in Yangcheon-gu was 3.51 × 10⁻³ kg CO2-eq. using drone delivery and 2.76 × 10⁻² kg CO2-eq. using motorcycle delivery. These results indicate that the GWP declined by 2.41 × 10⁻² kg CO2-eq. when the shipping method changed from motorcycle to drone delivery. In Pyeongchang-gun, it was 3.90 × 10⁻² kg CO2-eq. for drone delivery and 0.362 kg CO2-eq. for motorcycle delivery, so the GWP reduction in Pyeongchang-gun was 0.323 kg CO2-eq. The particulates produced in Yangcheon-gu by drone and motorcycle were 7.69 × 10⁻⁷ kg PM2.5-eq. and 2.33 × 10⁻⁶ kg PM2.5-eq., respectively, and 8.52 × 10⁻⁶ kg PM2.5-eq. and 3.05 × 10⁻⁵ kg PM2.5-eq in Pyeongchang-gun, respectively. These results indicate that the particulate reduction was 1.56 × 10⁻⁶ kg PM2.5-eq. in Yangcheon-gu and 2.20 × 10⁻⁵ kg PM2.5-eq. in Pyeongchang-gun.
The analysis indicates that the GWP and particulate reduction by converting existing motorcycle delivery to drone delivery was 13.4 and 14.1 times higher in Pyeongchang-gun than in Yangcheon-gu, respectively. In other words, the environment improvement effects of introducing drones could be greater in Pyeongchang-gun, where the delivery distance is relatively longer than Yangcheon-gu. Because rural areas have a lower population density and their residential areas are more scattered than cities, the environmental improvement effect of drone usage in rural areas is higher than that of cities.

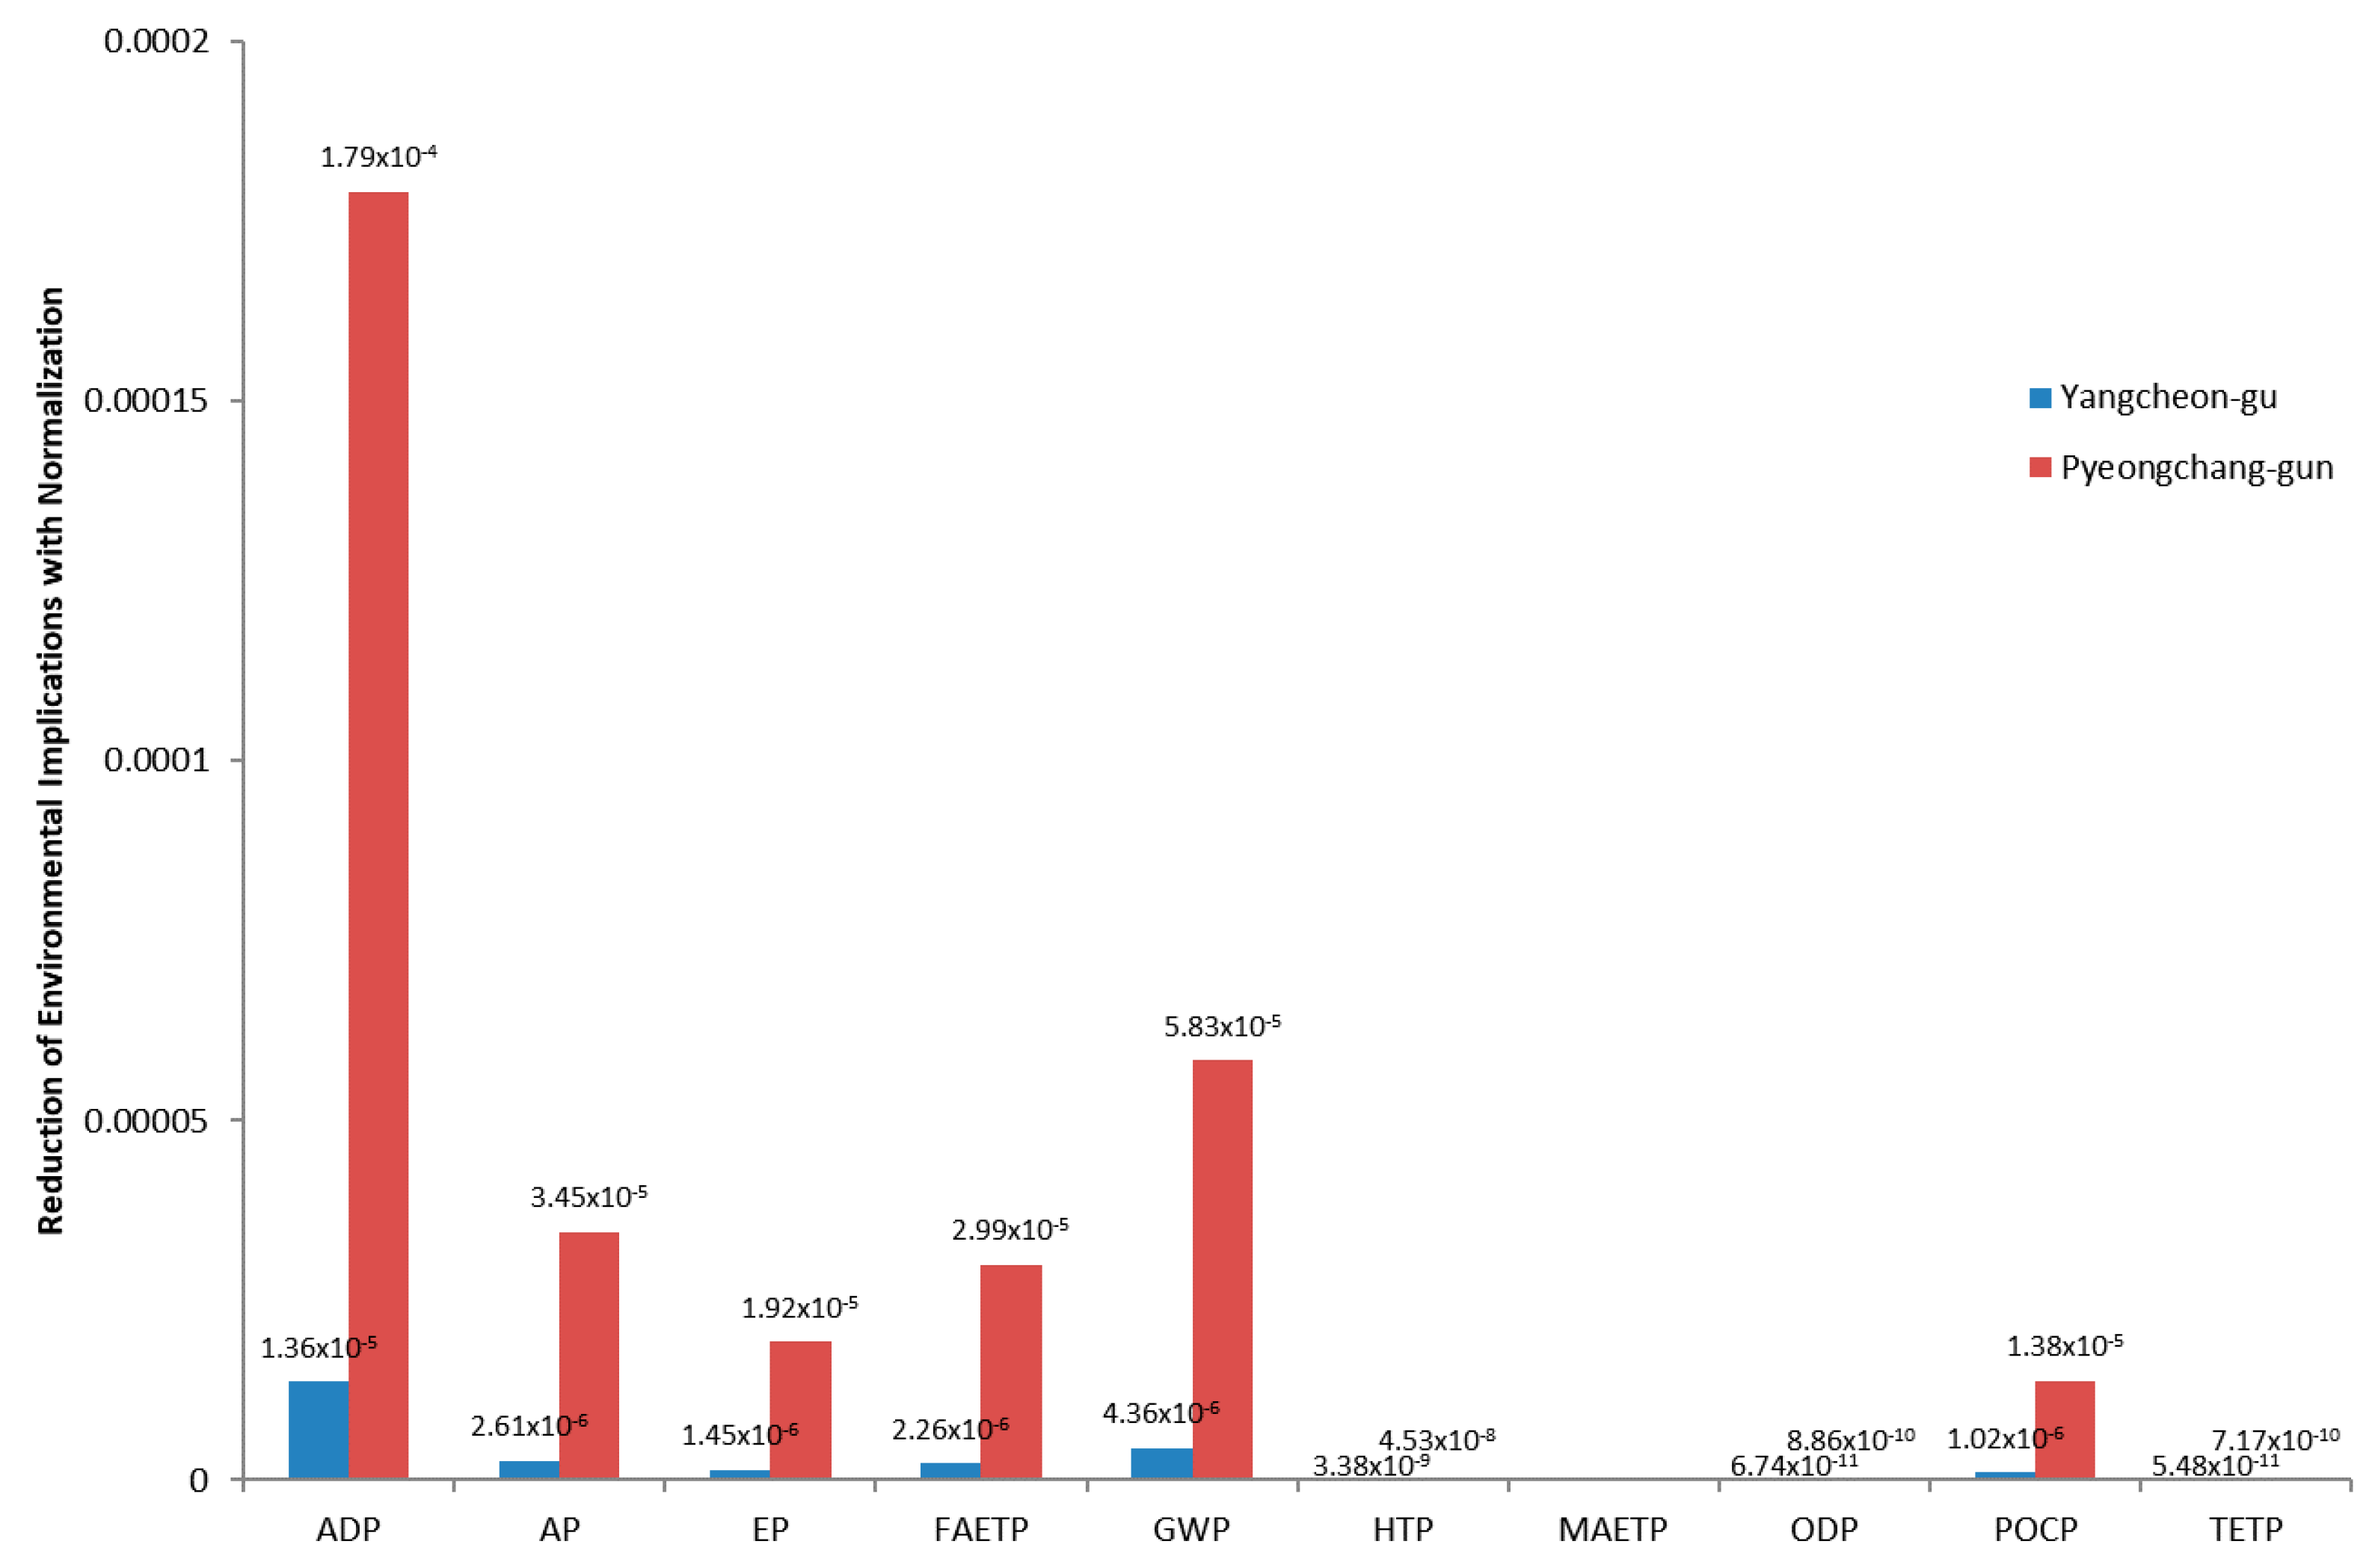
3.3. Comparison of the Reduction Effects between Urban and Rural Areas by Impact Category

After calculating and normalizing the environmental impacts of drone and motorcycle delivery methods for the ten categories presented in result 1, the reductions in urban and rural areas were compared by calculating the difference between Yangcheon-gu and Pyeongchang-gun. The environmental improvement effect of Pyeongchang-gun was relatively higher than that of Yangcheon-gu in all nine areas except MAETP, where the environment deteriorated when using drones (Figure 4). The difference in the reduction effect was the highest with ADP, where the value was 1.79 × 10⁻⁴ for Pyeongchang-gun and 1.36 × 10⁻⁵ in Yangcheon-gu, which is a difference of 13 times higher. To comprehensively evaluate the environmental impact categories, the weighted results of Yangcheon-gu and Pyeongchang-gun were compared. The total environmental improvement effects of all 10 categories were evaluated as 4.94 × 10⁻⁶ in Yangcheon-gu and 6.53 × 10⁻⁵ in Pyeongchang-gun (Figure 5). Therefore, the environmental improvement effect expected from the introduction of drone delivery in the rural area was 13 times higher than that in the urban area.

3.4. Interpretation

3.4.1. Environmental Impact of Delivery Using Electric Motorcycles

At this stage, the environmental impact of electric motorcycles, an alternative to gasoline motorcycles, was analyzed and compared considering the mobility, applicability, and efficiency of delivery. Interest in electric motorcycles as low-emission and eco-friendly urban vehicles has increased. The use of electric motorcycles is likely to increase, particularly in areas with small passenger cars and small logistics sectors [40], due to their low fuel cost, ease of commercialization and development, and low carbon emissions. In addition, the Seoul Metropolitan Government provides a subsidy of 2.5 million won for every electric motorcycle purchased for delivery purposes. Recently, the amount of the subsidy has gradually increased, and the target supply for 2017 increased by 2.7 times compared to 2016. Electric motorcycles have the advantage that they can be used even when the order quantity is large because they can carry more products compared to drones. Therefore, it would be possible to identify the effect of a more efficient alternative delivery vehicle if electric motorcycles were also evaluated to determine the environmental impact.
The environmental impact of electric motorcycles was calculated using the initial environmental impact data from drone and gasoline motorcycles. The electricity data from the national LCI database were used as the LCI, and the delivery distance reflecting the bypass coefficient was applied to the electric motorcycle in the same manner as for the gasoline motorcycle. To determine the power needed for 1 km of movement, the electric motorcycle “Valencia” of Green Mobility was selected. This model was selected from the six models approved by the Ministry of Environment because it has signed a business agreement with the Korea Franchise Industry Association. This model has a mileage of 60 km and uses a 72 V, 30,000 mAh battery.
The GWP and particulates produced when delivering within 1 km by electric motorcycle were 1.80 kg CO2-eq. and 3.90 kg CO2-eq., respectively. The results were compared with the GWP and particulates emissions of the drone and gasoline motorcycle presented in result 1 (Figure 6). Because most of the greenhouse gases are emitted during the combustion stage of gasoline, the GWP was from highest to lowest for the gasoline motorcycle, electric motorcycle, and drone; however, the electric motorcycle produced the most particulates, followed by the gasoline motorcycle and the drone. In other words, more particulates are generated during electricity production than during gasoline production and combustion. Nonetheless, the particulates are reduced with drone use compared to both types of motorcycles because they do not consume much electricity, but electric motorcycles generated more particulates than gasoline motorcycles because they consumed more electricity when traveling 1 km. Therefore, in terms of greenhouse gas emissions, electric vehicles can be environmentally friendly, but in terms of particulates, the introduction of electric motorcycles could have a worse impact on the environment than using conventional gasoline motorcycles.

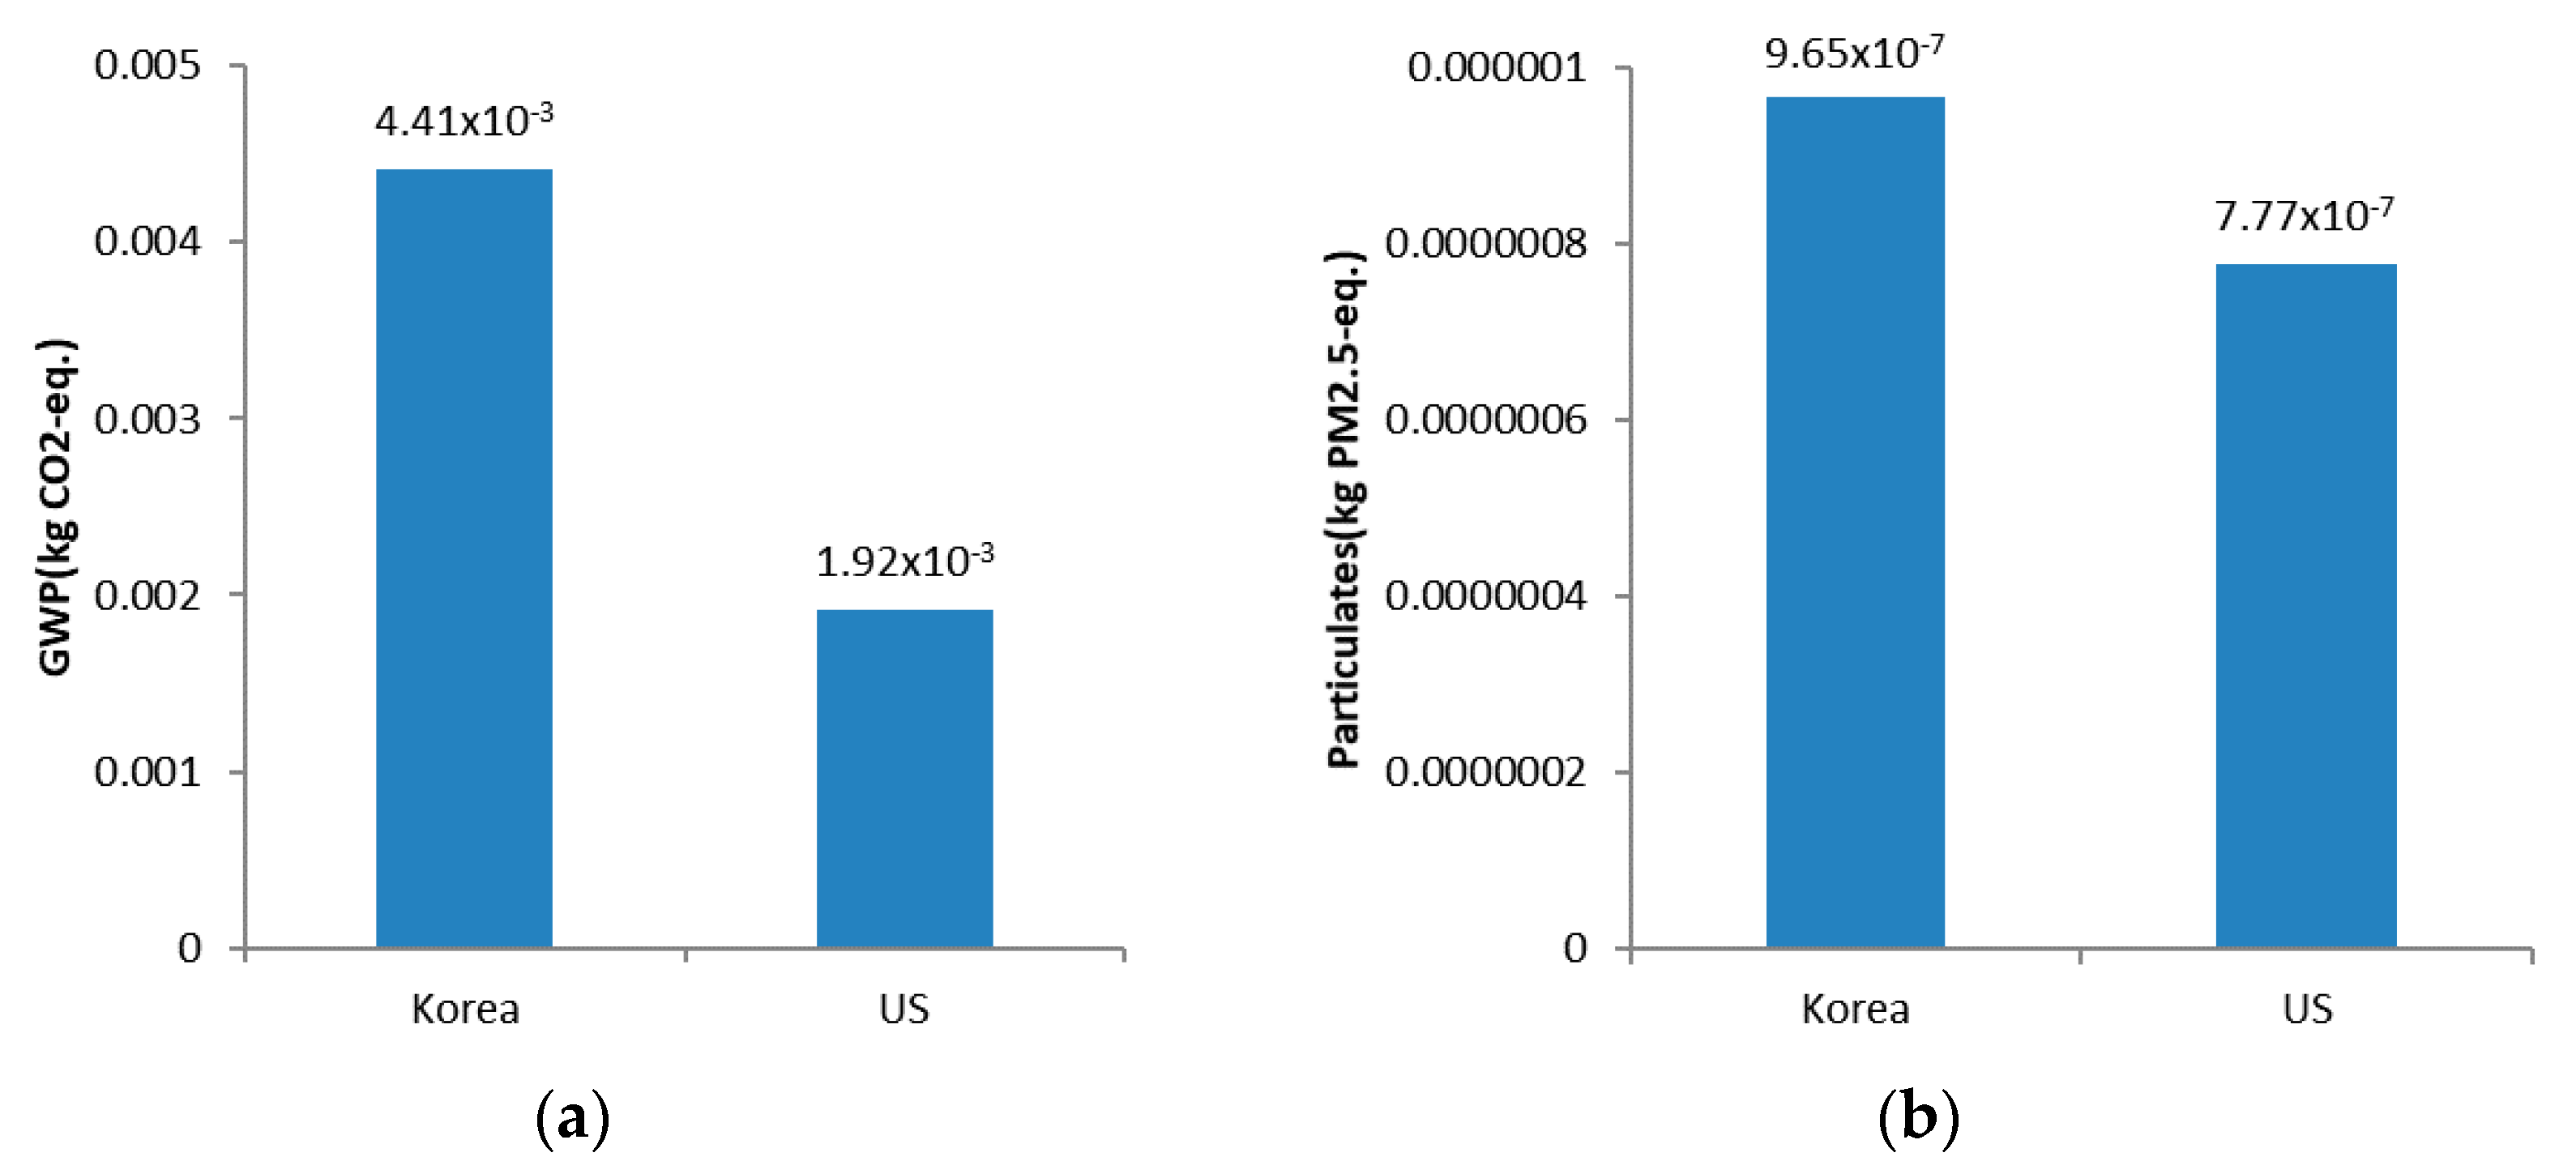
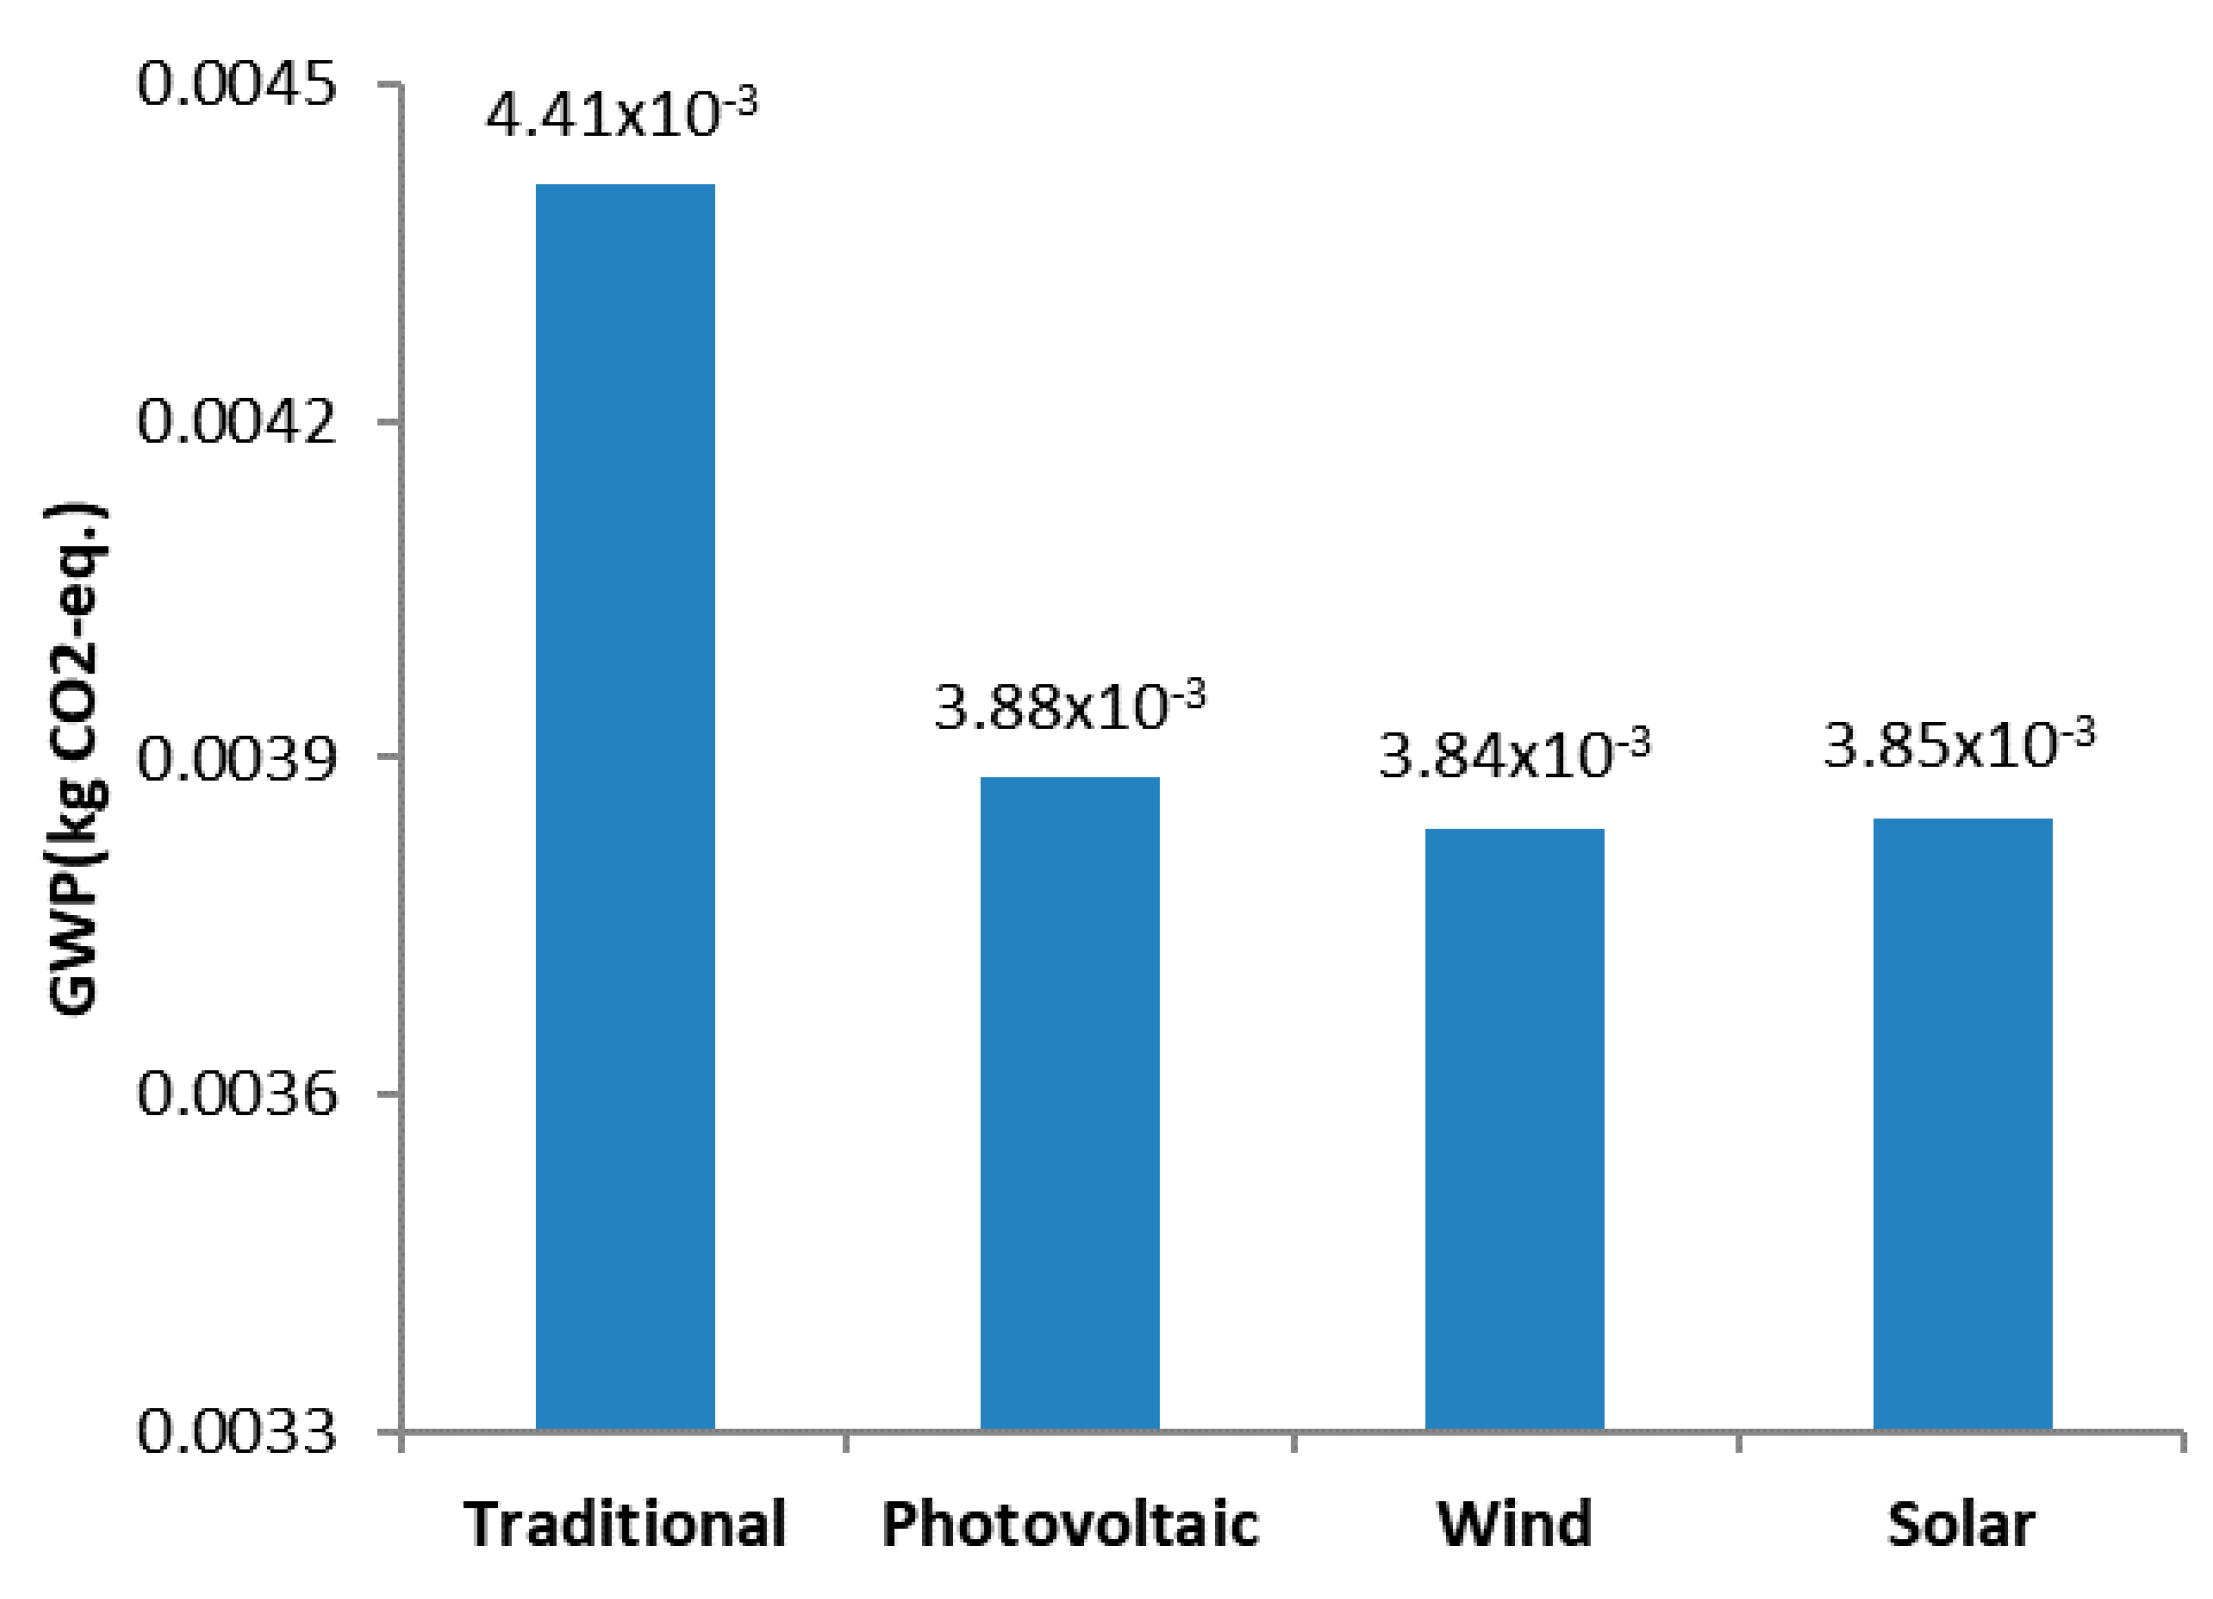
3.4.2. Comparison of the Drones’ Reduction Effect According to the National Power Generation Scheme

Since the proportion of electricity production varies from country to country, the environmental impact of electricity production can also vary. Therefore, LCAs of electricity production in the United States and Korea were conducted, and the environmental impacts of drones considering power generation were compared after calculating the travel distance. As there are various ways among countries to generate electricity, such as coal-fired power generation, hydroelectric power generation, and nuclear power generation, each country sets an acceptable proportion for each method considering the internal and external conditions (Table 4). Thus, the environmental impact of drones using electricity may vary from country to country because the environmental impacts of each power generation method are different.
The environmental impact associated with US power generation was analyzed using the US LCI data provided by the National Renewable Energy Laboratory (NREL). The item used was “Electricity, at Grid, US, 2008”, and GaBi was used as the LCA software. First, the GWP and particulates produced to generate 1 kWh of electricity were obtained, and the GWP and particulates for 1 km of delivery travel distance were calculated based on the travel distance of a drone per unit of electricity. The GWP was 1.92 × 10⁻³ kg CO2-eq., and the particulates were 7.77 × 10⁻⁷ kg PM2.5-eq. per 1 km when drones were powered by electricity produced in the US. These values were compared with the environmental impact data of electricity produced in Korea obtained previously (Figure 7).
Electricity production in Korea caused more pollution than electricity production in the US for both categories. The GWP amount was 2.3 times higher, and the particulates amount was 1.24 times higher in Korea. Therefore, when the use of the existing delivery vehicle is converted to the use of drones, the environmental improvement impact seems to be greater in the US than in Korea. In Germany, which has a higher proportion of renewable energy than other countries, it is expected that the reduction effect of changing the use of the delivery vehicle would be more remarkable due to a lower environmental impact of electricity generation.

3.4.3. Drones’ GHG Reduction Effect by Expanding Renewable Energy

According to the electricity generation plan of Korea, the share of renewable energy will increase. To evaluate the environmental impact of this transition, an LCA was conducted for each renewable energy generation method, and the environmental impact of drone delivery was compared by calculating the travel distance.
The national LCI database of the Korea Environmental Industry and Technology Institute was previously used in this study to estimate the environmental impacts of electricity generation in Korea; however, the internal and external conditions related to the power supply are constantly changing due to several factors, such as the rising demand for air conditioning, controversies over nuclear power generation, and changes in GHG reduction conditions. In particular, as it has become increasingly important to address climate change and to reduce greenhouse gases, many countries plan to expand the share of renewable energy in the long-term.
The Korean government also establishes a plan for renewable energy every five years in accordance with the Framework Act on Low Carbon, Green Growth, and the Act on the Promotion of the Development, Use and Diffusion of New and Renewable Energy. According to the 2014 4th Basic Renewable Energy Plan of the Ministry of Trade, Industry, and Energy, Korea is planning to gradually increase the ratio of renewable energy and to supply 13.4% of total energy as renewable energy by 2035. If the supply of renewable energy increases, the amount of greenhouse gases generated during the electricity generation process will be reduced, making the reduction effect of drone delivery even higher.
To compare the reduction effect of drones based on photovoltaic, wind, and solar power generation, which are proposed as core energy sources in the Basic Renewable Energy Plan, meta-analysis data on GWP generation were used for each method [41,42]. To generate 1 kWh of electricity, photovoltaic power produced 0.052 kg CO2-eq., wind power produced 0.015 kg CO2 eq., and solar power produced 0.023 kg CO2 eq. of greenhouse gases. The GWP of future electricity production was obtained according to the Basic Plan using 86.6% of the power generated in the conventional way and using the remaining 13.4% generated from each renewable energy. This was converted to the amount per 1 km of drone delivery (Figure 8). Compared to the 4.41 × 10⁻³ kg CO2-eq. of greenhouse gases for the current power generation system, photovoltaic power generation could reduce greenhouse gases to 3.88 × 10⁻³ kg CO2-eq., wind power could reduce them to 3.84 × 10⁻³ kg CO2-eq., and solar power could reduce them to 3.85 × 10⁻³ kg CO2-eq. Therefore, as the proportion of renewable energy increases, the reduction effect of drones will also increase.

4. Conclusions

In this study, the environmental impact of drones, a new means of delivery, was compared with the environmental impact of conventional delivery vehicles using the LCA. Based on the gasoline and electricity production data of the national LCI DB, the environmental impacts of a 1-km delivery distance using each type of vehicle were evaluated. In addition, the environmental improvement effects of using drones in urban and rural areas were compared based on the actual delivery distances in the residential areas of Yangcheon-gu, Seoul, and Pyeongchang-gun, Gangwon-do, based on the locations of elementary schools.
The LCA results showed that the GWP generated by 1 km of drone delivery distance (4.41 × 10⁻³ kg CO2-eq.) was one-sixth that of the GWP generated by 1 km of motorcycle delivery distance (2.85 × 10⁻² kg CO2-eq.). The particulate emissions of drones (9.65 × 10⁻⁷ kg PM2.5-eq.) was estimated to be about half that of motorcycles (2.09 × 10⁻⁶ kg PM2.5-eq.). When the comprehensive environmental impact was evaluated after adding nine impact categories and normalizing and weighting the data, the environmental impact of drones was found to be one-twelfth that of the motorcycle.
The reduction of pollution by utilizing drones was more effective in rural areas than in cities. In Yangcheon-gu, the GWP reduction per delivery was 2.41 × 10⁻² kg CO2-eq., and the particulate reduction was 1.56 × 10⁻⁶ kg PM2.5-eq. In Pyeongchang-gun, the GWP reduction was 0.323 kg CO2-eq., and the particulate reduction was 2.20 × 10⁻⁵ kg PM2.5-eq. The environmental improvement effect was higher in Pyeongchang-gun for both GWP and particulates. Pyeongchang-gun had a 13.2 times higher environmental impact reduction effect than Yangcheon-gu when the ten categories were considered together because it had a longer delivery distance.
In addition, in preparation for the emergence of new eco-friendly vehicles, electric motorcycles were added to the comparison to determine the environmental impact per distance. The GWP was higher for gasoline motorcycles because more greenhouse gases were generated in the combustion stage of gasoline than in the production stage, but electric motorcycles produced more particulates because particulates are mostly generated during electricity production. Therefore, the environmental impacts of various impact categories, as well as the GWP, should be analyzed and compared before introducing electric vehicles.
Another important consideration is that Korea’s electricity production method generates 2.49 × 10⁻³ kg CO2-eq. more GWP and 1.88 × 10⁻⁷ kg PM2.5-eq. more particulates than US electricity production. As mentioned in the 4th Basic Renewable Energy Plan, if 13.4% of energy could be supplied as renewable energy such as solar and wind power by 2035, 10~14% of greenhouse gases could be reduced compared to current emissions. Therefore, if the environmental impact per unit of electricity could be reduced by the increased use of renewable energy, the environmental improvement effect of drone use would be higher.
In this study, the environmental impacts of each delivery vehicle type were calculated using the national LCI database and the US LCI database; however, the baseline year of the LCI data was 2000 for the national LCI database and 2008 for the US LCI database, so the changes in environmental impacts due to technological developments and changes in the electricity generation plan have not been adequately considered. Therefore, if the databases were upgraded in the future and the data on various electricity generation methods were added, the accuracy of the results would improve.

Acknowledgments

This research was supported by the National Research Foundation of Korea (NFR) grant funded by the Korea government (Ministry of Science and ICT) (No. NRF-2017R1E1A1A01078227).

Author Contributions

Jiyoon Park designed, conducted the study, analyzed the data, and wrote the manuscript. Solhee Kim planned specific analysis methods, conducted LCA using the US LCI data, and reviewed and reformatted the overall paper. And Kyo Suh developed the concept, supervised the project, and provided various materials and methods related to the research. All authors have read and approved the final manuscript.

Conflicts of Interest

The authors declare no conflict of interest.

References

  1. Evans, M. Future war in cities: Urbanization’s challenge to strategic studies in the 21st century. Int. Rev. Red Cross 2016, 98, 37–51. [Google Scholar] [CrossRef]
  2. Zhou, K.; Liu, T.; Zhou, L. Industry 4.0: Towards future industrial opportunities and challenges. In Proceedings of the 2015 12th International Conference on Fuzzy Systems and Knowledge Discovery (FSKD), Zhangjiajie, China, 15–17 August 2015; pp. 2147–2152. [Google Scholar]
  3. Smith, K.W. Drone technology: Benefits, risks, and legal considerations. Seattle J. Environ. L. 2015, 5, 290–302. [Google Scholar]
  4. Xu, J.-F. An Innovative Technology of Distributed Control System Integration for Unmanned Aerial Vehicles. Acta Simul. Syst. Sin. 2003, 3. Available online: http://en.cnki.com.cn/Article_en/CJFDTOTAL-XTFZ200303037.htm (accessed on 19 March 2018).
  5. Commercial, U.A.V. Commercial Drone Market Analysis By Product (Fixed Wing, Rotary Blade, Nano, Hybrid), by Application (Agriculture, Energy, Government, Media & Entertainment) and Segment Forecasts to 2022; Grand View Research: San Francisco, CA, USA, 2016. [Google Scholar]
  6. Murray, C.C.; Chu, A.G. The flying sidekick traveling salesman problem: Optimization of drone-assisted parcel delivery. Trans. Res. Emerg. Technol. 2015, 54, 86–109. [Google Scholar] [CrossRef]
  7. Nex, F.; Remondino, F. Uav for 3D mapping applications: A review. Appl. Geomat. 2014, 6, 1–15. [Google Scholar] [CrossRef]
  8. Lee, S.H.; Lee, S.; Song, H.; Lee, H.S. Wireless sensor network design for tactical military applications: Remote large-scale environments. In Proceedings of the MILCOM 2009 Military Communications Conference, Boston, MA, USA, 18–21 October 2009; pp. 1–7. [Google Scholar]
  9. Springer, P.J. Military Robots and Drones: A Reference Handbook; ABC-CLIO: Santa Barbara, CA, USA, 2013. [Google Scholar]
  10. Haidari, L.A.; Brown, S.T.; Ferguson, M.; Bancroft, E.; Spiker, M.; Wilcox, A.; Ambikapathi, R.; Sampath, V.; Connor, D.L.; Lee, B.Y. The economic and operational value of using drones to transport vaccines. Vaccine 2016, 34, 4062–4067. [Google Scholar] [CrossRef] [PubMed]
  11. Boccardo, P.; Chiabrando, F.; Dutto, F.; Tonolo, F.G.; Lingua, A. UAV deployment exercise for mapping purposes: Evaluation of emergency response applications. Sensors 2015, 15, 15717–15737. [Google Scholar] [CrossRef] [PubMed]
  12. Bravo, R.; Leiras, A. Literature review of the application of UAVs in humanitarian relief. In Proceedings of the XXXV Encontro Nacional de Engenharia de Producao, Fortaleza, Brazil, 13–16 October 2015; pp. 13–16. [Google Scholar]
  13. Heutger, M. Unmanned Aerial Vehicle in Logistics. In A DHL Perspective on Implications and Use Cased for the Logistics Industry; DronesX Media LLC: Burbank, CA, USA, 2014. [Google Scholar]
  14. Wilkinson, P.; Cole, D. The role of radio science in disaster management. URSI Radio Sci. Bull. 2010, 83, 45–51. [Google Scholar]
  15. Welch, A. A Cost-Benefit Analysis of Amazon Prime Air. Bachelor’s Thesis, University of Tennessee at Chattanooga, Chattanooga, TN, USA, 2015. [Google Scholar]
  16. Pandit, V.; Poojari, A. A study on amazon prime air for feasibility and profitability: A graphical data analysis. IOSR J. Bus. Manag. 2014, 16, 6–11. [Google Scholar] [CrossRef]
  17. Mohammed, F.; Idries, A.; Mohamed, N.; Al-Jaroodi, J.; Jawhar, I. UAVs for smart cities: Opportunities and challenges. In Proceedings of the 2014 International Conference on Unmanned Aircraft Systems (ICUAS), Orlando, FL, USA, 27–30 May 2014; pp. 267–273. [Google Scholar]
  18. Bamburry, D. Drones: Designed for product delivery. Des. Manag. Rev. 2015, 26, 40–48. [Google Scholar]
  19. Pepitone, J. Domino’s Tests Drone Pizza Delivery. CNNMoney. 4 June 2013. Available online: http://money.cnn.com/2013/06/04/technology/innovation/dominos-pizza-drone/index.html (accessed on 19 March 2018).
  20. Javaid, A.; Sun, W.; Alam, M. Uavnet simulation in uavsim: A performance evaluation and enhancement. In Proceedings of the International Conference on Testbeds and Research Infrastructures, Guangzhou, China, 5–7 May 2014; Springer: Berlin, Germany, 2014; pp. 107–115. [Google Scholar]
  21. Agatz, N.; Bouman, P.; Schmidt, M. Optimization Approaches for the Traveling Salesman Problem with Drone; Elsevier: Amsterdam, The Netherlands, 2016. [Google Scholar]
  22. Carlsson, J.G.; Song, S. Coordinated logistics with a truck and a drone. Manag. Sci. 2017. [Google Scholar] [CrossRef]
  23. Choi, Y.; Schonfeld, P.M. Optimization of multi-package drone deliveries considering battery capacity. In Proceedings of the 96th Annual Meeting of the Transportation Research Board, Washington, DC, USA, 8–12 January 2017. [Google Scholar]
  24. Clarke, R.; Moses, L.B. The regulation of civilian drones’ impacts on public safety. Comput. Law Secur. Rev. 2014, 30, 263–285. [Google Scholar] [CrossRef]
  25. Clarke, R. The regulation of civilian drones’ impacts on behavioural privacy. Comput. Law Secur. Rev. 2014, 30, 286–305. [Google Scholar] [CrossRef]
  26. Rao, B.; Gopi, A.G.; Maione, R. The societal impact of commercial drones. Technol. Soc. 2016, 45, 83–90. [Google Scholar] [CrossRef]
  27. Jones, T. International Commercial Drone Regulation and Drone Delivery Services; RR-1718/3-RC; RAND Corporation: Santa Monica, CA, USA, 2017. [Google Scholar]
  28. Stolaroff, J. The Need for a Life Cycle Assessment of Drone-Based Commercial Package Delivery; Lawrence Livermore National Laboratory (LLNL): Livermore, CA, USA, 2014. [Google Scholar]
  29. Goodchild, A.; Toy, J. Delivery by drone: An evaluation of unmanned aerial vehicle technology in reducing CO2 emissions in the delivery service industry. Transp. Res. Part D Transp. Environ. 2017. [Google Scholar] [CrossRef]
  30. Figliozzi, M.A. Lifecycle modeling and assessment of unmanned aerial vehicles (drones) CO2 e emissions. Transp. Res. Transp. Environ. 2017, 57, 251–261. [Google Scholar] [CrossRef]
  31. Lohn, A.J. What’s the Buzz? The City-Scale Impacts of Drone Delivery; RAND Corporation: Santa Monica, CA, USA, 2017. [Google Scholar] [CrossRef]
  32. Kim, H. A Study on the main Status of Environment Logistics and Expansion Strategy in Korea. J. Korea Port Econ. Assoc. 2009, 25. Available online: http://ocean.kisti.re.kr/IS_mvpopo001P.do?method=multMain&poid=tkpea&kojic=OMGJBU&free= (accessed on 19 March 2018).
  33. Kwon, J.; Kim, S.; Park, E.; Song, J. A study on the number of domestic food delivery services. Korean J. Appl. Stat. 2015, 28, 977–990. [Google Scholar] [CrossRef]
  34. Kim, S.; Kim, T.; Suh, K. Analysis of the implication of accessibility to community facilities for land price in rural areas using a hedonic land price model. J. Korean Soc. Rural Plan. 2016, 22, 93–100. [Google Scholar] [CrossRef]
  35. Kim, T.; Shin, Y.; Lee, J.; Suh, K. Calculation of regional circuity factors using road network distance in South Korea. J. Korea Plan. Assoc. 2013, 48, 319–329. [Google Scholar]
  36. Wolf, M.-A.; Chomkhamsri, K.; Brandao, M.; Pant, R.; Ardente, F.; Pennington, D.W.; Manfredi, S.; de Camillis, C.; Goralczyk, M. ILCD Handbook—General Guide for Life Cycle Assessment-Detailed Guidance; Joint Research Centre: City of Brussels, Belgium, 2010. [Google Scholar]
  37. ISO (International Organization for Standardization). ISO 14043: Environmental Management—Life Cycle Interpretation; International Organization for Standardization: Geneva, Switzerland, 1998. [Google Scholar]
  38. NREL (National Renewable Energy Laboratory). U.S. Life Cycle Inventory Database; National Renewable Energy Laboratory: Lakewood, CO, USA, 2012. [Google Scholar]
  39. KEITI (Korea Environmental Industry & Technology Institute). Life Cycle Assessment Software (TOTAL) Manual for eco Labeling; Korea Environmental Industry & Technology Institute (KEITI): Seoul, Korea, 2000. [Google Scholar]
  40. Kil, B.-S.; Kim, G.-C. The analysis of a electric scooter’s performance through motor and battery capacity changing. Trans. Korean Soc. Automot. Eng. 2011, 19, 7–13. [Google Scholar]
  41. Burkhardt, J.J.; Heath, G.; Cohen, E. Life cycle greenhouse gas emissions of trough and tower concentrating solar power electricity generation. J. Ind. Ecol. 2012, 16. [Google Scholar] [CrossRef]
  42. Hsu, D.D.; O’Donoughue, P.; Fthenakis, V.; Heath, G.A.; Kim, H.C.; Sawyer, P.; Choi, J.K.; Turney, D.E. Life cycle greenhouse gas emissions of crystalline silicon photovoltaic electricity generation. J. Ind. Ecol. 2012, 16. [Google Scholar] [CrossRef]
Figure 1. Locations of elementary schools and pizza restaurants in Yangcheon-gu and Pyeongchang-gun. (a) Yangcheon-gu (Population: 460,467; Area: 17.4 km2); (b) Pyeongchang-gun (Population: 40,470; Area: 1464 km2).
Sustainability 10 00881 g001
Figure 2. System boundary of a food (pizza) delivery system for drone and motorcycle.
Sustainability 10 00881 g002
Figure 3. Global warming potential (GWP) and particulates matter (PM2.5) produced per 1 km delivery by drone and motorcycle. Energy options for drone and motorcycle are electricity and gasoline, respectively. (a) GWP; (b) PM2.5.
Sustainability 10 00881 g003
Figure 4. Reduction impact in Yangcheon-gu and Pyeongchang-gun by category.
Sustainability 10 00881 g004
Figure 5. Weighted reduction impact of drones in Yangcheon-gu and Pyeongchang-gun.
Sustainability 10 00881 g005
Figure 6. GWP and particulates of 1 km delivery by drone, motorcycle, and electric motorcycle. (a) GWP of 1 km delivery; (b) PM2.5 of 1 km delivery.
Sustainability 10 00881 g006
Figure 7. GWP and particulates of 1 km delivery distance by drone in South Korea and in the U.S. (a) GWP; (b) PM2.5.
Sustainability 10 00881 g007
Figure 8. GWP of 1 km drone delivery under renewable energy scenario.
Sustainability 10 00881 g008
Table 1. Life Cycle Impact Categories.
Impact CategoryUnit
ADPAbiotic Depletion Potential1/year
APAcidification Potentialkg SO2-eq
EPEutrophication Potentialkg PO43−-eq
FAETPFreshwater Aquatic Ecotoxicity Potentialkg 1,4 DCB-eq.
GWPGlobal Warming Potentialkg CO2-eq.
HTPHuman Toxicity Potentialkg 1,4 DCB-eq.
MAETPMarine Aquatic Ecotoxicity Potentialkg 1,4 DCB-eq.
ODPOzone Depletion Potentialkg CFC11-eq.
POCPPhotochemical Oxidants Creation Potentialkg ethylene-eq.
TETPTerrestrial Ecotoxicity Potentialkg 1,4 DCB-eq.
PM2.5Particulates Matterkg PM2.5-eq.
Table 2. Environmental impacts of 1 km drone delivery with characterization, normalization, and weighting.
CategoryUnitCharacterizationNormalizationWeighting
ADP1/year1.54 × 10−56.17 × 10−74.37 × 10−7
APkg SO2-eq./kg7.46 × 10−61.87 × 10⁻⁷
EPkg PO43−-eq./kg1.39 × 10−61.06 × 10⁻⁷
FAETPkg 1,4 DCB eq./kg3.14 × 10−72.10 × 10⁻⁷
GWPkg CO2-eq./kg4.41 × 10−37.97 × 10⁻⁷
HTPkg 1,4 DCB eq./kg9.86 × 10−76.66 × 10⁻¹⁰
MAETPkg 1,4 DCB eq./kg2.25 × 10−32.90 × 10⁻⁸
ODPkg CFC 11-eq./kg1.02E × 10−132.49 × 10⁻¹²
POCPkg ethylene eq./kg3.05 × 10−62.97 × 10⁻⁷
TETPkg 1,4 DCB eq./kg1.78 × 10−131.09 × 10⁻¹³
Table 3. Environmental impacts of 1 km motorcycle delivery with characterization, normalization, and weighting.
CategoryUnitCharacterizationNormalizationWeighting
ADP1/year3.62 × 10−41.46 × 10−55.46 × 10−6
APkg SO2-eq./kg1.13 × 10−42.85 × 10⁻⁶
EPkg PO43−-eq./kg2.08 × 10−51.59 × 10⁻⁶
FAETPkg 1,4 DCB eq./kg3.76 × 10−62.50 × 10⁻⁶
GWPkg CO2-eq./kg2.85 × 10−25.16 × 10⁻⁶
HTPkg 1,4 DCB eq./kg5.98 × 10−64.04 × 10⁻⁹
MAETPkg 1,4 DCB eq./kg4.31 × 10−45.56 × 10⁻⁹
ODPkg CFC 11-eq./kg2.92 × 10−127.17 × 10⁻¹¹
POCPkg ethylene eq./kg1.34 × 10−51.30 × 10⁻⁶
TETPkg 1,4 DCB eq./kg9.24 × 10−115.67 × 10⁻¹¹
Table 4. Shares (%) of national electricity sources by country (2011).
NationsCoalPetroleumGasNuclearHydraulicRenewable
Korea40.35.020.531.10.72.5
US43.30.924.219.07.45.2
Germany45.11.113.917.92.919.1
France3.10.64.879.48.04.0
Japan27.014.735.99.88.04.7
China78.90.22.01.814.72.4

