Article

The Relationship between Social Visibility and CSR Disclosure

1
Department of Business Administration, University of Sahiwal (formerly BZU Sub-Campus Sahiwal), Sahiwal 57000, Pakistan
2
Department of Accounting, Faculty of Economics and Administration, King Abdulaziz University, Jeddah 80200, Saudi Arabia
3
Institute of Management Sciences Bahauddin Zakariya University, Multan 60800, Pakistan
4
Department of Commerce, Bahauddin Zakariya University, Multan 60800, Pakistan
*
Author to whom correspondence should be addressed.
Sustainability 2018, 10(3), 866; https://doi.org/10.3390/su10030866
Submission received: 12 January 2018 / Revised: 25 February 2018 / Accepted: 6 March 2018 / Published: 19 March 2018

Abstract

:
The aim of this research is to investigate the link between different proxies of social visibility such as company size, company profitability, environmental sensitivity, and multinational subsidiary with CSR disclosure. This study used a content analysis method to extract CSR-related information from the annual reports of 253 listed companies of Pakistan. The collected data was analyzed through a multiple linear pooled regression analysis technique. The results showed that company size, company profitability, environmental sensitivity, and to be a multinational subsidiary have a significant positive relationship with CSR disclosure. This indicates that different aspects of corporate social visibility are associated with CSR disclosure. We assert that highly socially visible companies, prone to pressures from various actors of the society such as the media, NGOs, the government, and other stakeholders, appear to disclose CSR information to manage relationships with these actors.

1. Introduction

The observed variation in CSR disclosure mentioned in various empirical papers [1,2,3] and the voluntary nature of CSR disclosure are the main reasons underlying the long-standing interest in the examination of disclosures made by companies regarding their engagement in CSR activities. The extant disclosure studies have used various theoretical perspectives to explain the disclosure of CSR information [1,3,4,5,6,7,8,9,10], but the legitimacy theoretical perspective appears to be the mostly preferred framework for explaining CSR disclosure [2,11,12,13,14]. However, there is still no consensus on whether legitimacy theory provides a comprehensive theoretical basis for the understanding of the disclosure of CSR information [15,16,17,18], particularly in the context of developing countries where fewer empirical studies have been conducted as compared to the developed countries [2,18,19,20].
The context of developing countries, as compared to the developed countries, carries different social, political, and economic factors, as argued by Mahadeo et al. [2], which result in different arrangements in terms of corporate citizenship behavior, corporate rules and regulations, level of state intervention in governing corporate behavior, the level of concern of the public in environmental issues, and their attitude towards corporate social responsibilities. This has been noticed through the patterns of CSR disclosures by corporations in developed and developing countries and the factors influencing them. Corporations in developed countries appear to place more importance on environment-related issues, while companies in developing countries give preference to human resource and community-related matters [2,18,21]. Further, in developed countries, domestic stakeholder groups such as regulators, shareholders, creditors, investors, environmentalists, the media, and the wider public, have been found to be influencing CSR disclosure [18]. Contrary to this, corporations in developing countries perceive little pressure from domestic stakeholders and are rather influenced by foreign stakeholders such as international buyers, foreign investors, and international media [18]. Our interest in this research lies in examining how corporations behave with respect to CSR disclosure in such contexts. In this respect, we examine the CSR disclosure in a developing country, i.e., Pakistan, through legitimacy theoretical lens and by quantitatively analyzing the link between corporate social visibility and CSR disclosure.
The motivations for conducting this study are manifold. Firstly, previous scholarship has pointed out that the disclosure of CSR information is a country dependent phenomenon as different results were shown by studies conducted in different contexts [18,20,22,23]. This is perhaps the main motivation for presenting CSR disclosure results in another developing country context, i.e., Pakistan. Secondly, the extant literature has shown that the majority of the studies on factors influencing CSR disclosure were conducted in developed country contexts (cf. Fifka [24] meta-analysis of 200 studies and Ali et al., [18]) and scholarship has pointed out that there is still much need for more research on the factors influencing CSR disclosure in emerging/developing economies [18,25,26,27,28,29]. This research presents much needed evidence on the state of CSR disclosure in a developing country, i.e., Pakistan, and contributes to the literature on developing countries. Thirdly, scholarships [2,30] have pointed out that CSR disclosure, as a legitimacy driven tool, needs to be placed in the national context of the study rather than to evaluate CSR disclosure against the practices prevalent in Anglo-Saxon countries. Indeed, little research has examined the link between CSR disclosure and the implications of legitimacy theory in the context of developing countries [2]. Finally, previous studies in developing countries relied on one window of observation (i.e., one year data) when examining the determinants of CSR disclosure. Thus, reliance on one window of observations may lead towards biased conclusions, and therefore this research incorporates longitudinal data to establish the link between social visibility and CSR disclosure [3,5,31].
The investigation of the corporate social responsibility (CSR) scenario in the current research setting, i.e., Pakistan, is interesting due to multiple reasons. The first most important reason is the family centered style of management, with most of the large corporations being owned by family groups. Many family owned corporations have been involved in practicing CSR for many decades. Thus, the selection of CSR initiatives is influenced by the cultural and social preferences of that family. For example, Mr. Muhammad Iqbal Qarshi, a founder of Qurshi Industries Ltd, set up the Qurshi Foundation for providing health care and education-related services to the poor segment of the society. In addition to this, the foundation is providing monetary assistance to needy people to meet their basic needs.
The second most important reason is that Pakistan lacks formal and widely accepted mechanisms of corporate reputational ratings such as Fortune and Kinder Lydenberg Domini (KLD), thus CSR is not being promoted in Pakistan. In Pakistan, the Pakistan Centre of Philanthropy (PCP) confers awards to corporations based on their philanthropic contributions, but to what extent corporations and relevant stakeholders are giving value to these awards has not yet been investigated. The conferring of awards by social agencies and the government provides recognition of corporate social and environmental initiatives. Companies have been found reporting socially responsible actions/awards in their annual reports/websites [32]. It has been argued that the better performing companies are more concerned about the disclosure of CSR information [33].
The third reason for conducting this study in the context of Pakistan is the publication of CSR disclosure guidelines (2009 and 2012), by the Securities and Exchange Commission of Pakistan, requiring companies to disclose CSR-related information in their annual reports. However, all the companies are not complying with the voluntary guidelines because of the poor enforcement of laws in Pakistan [32]. This can be confirmed from findings of the study pointing out that the quality of CSR disclosure in Pakistan is quite poor [20,32]. It also inspires researchers to investigate the reasons underlying disclosures in the contexts where the enforcement of laws is quite poor. Given the uniqueness of Pakistani companies, the nature of CSR disclosure and the factors driving them attracts considerable interest.
The remainder of this paper is structured as follows. The next section reviews the CSR disclosure literature about developing countries. The third section discusses the theoretical framework and associated hypothesis. The fourth section presents the methodology of this research. The fifth section discusses data analysis results and the last section presents a discussion of the results.

2. CSR Disclosure about Developing Countries

The studies on determinants of CSR disclosure conducted in developing countries are lesser in number than the studies conducted in developed countries (see Meta-Analysis by Fifka [24] and the literature review by Belal and Momin [29] and Ali et al. [18]). The factors examined by the studies conducted in developing countries mainly fall within the categories of company characteristics, general contextual factors, and internal contextual factors. In the first category, the most commonly examined determinants are corporate size, corporate financial performance, and corporate industry, and they have been found to be influencing CSR disclosure [1,2,6,9,27,30,34,35]. In the second category, national contextual factors, such as: social, political, and cultural factors, resulted in variation in CSR disclosure among developing countries [36,37,38]. Further to this, the CSR reporting agenda in developing countries is derived by external forces/powerful stakeholders such as foreign investors [9,19,39,40], international buyers [19,22], international regulatory bodies, i.e., World Bank [41], international media [22], and government initiatives/regulations [5,7,42,43]. It has been noticed that corporations in developing countries perceive a little pressure from the local public for CSR disclosure [19,44,45]. In the third category, intention to build company image [19,27,44], the cost of reporting CSR information [19,46], non-availability of CSR data [46,47], poor corporate performance [19], a positive attitude of managers [47,48], and a lack of motivation [46,47] do influence CSR disclosure in developing countries. The disclosure studies have also pointed out that corporate governance mechanisms such as board size [28], independence of the board [40], multiple directorships of the chairman [30,49], presence of non-executive directors and foreign nationals on the board [50], presence of an audit committee [40], and establishment of an independent CSR department in a company [9] have positively influenced CSR (or environmental) disclosure.

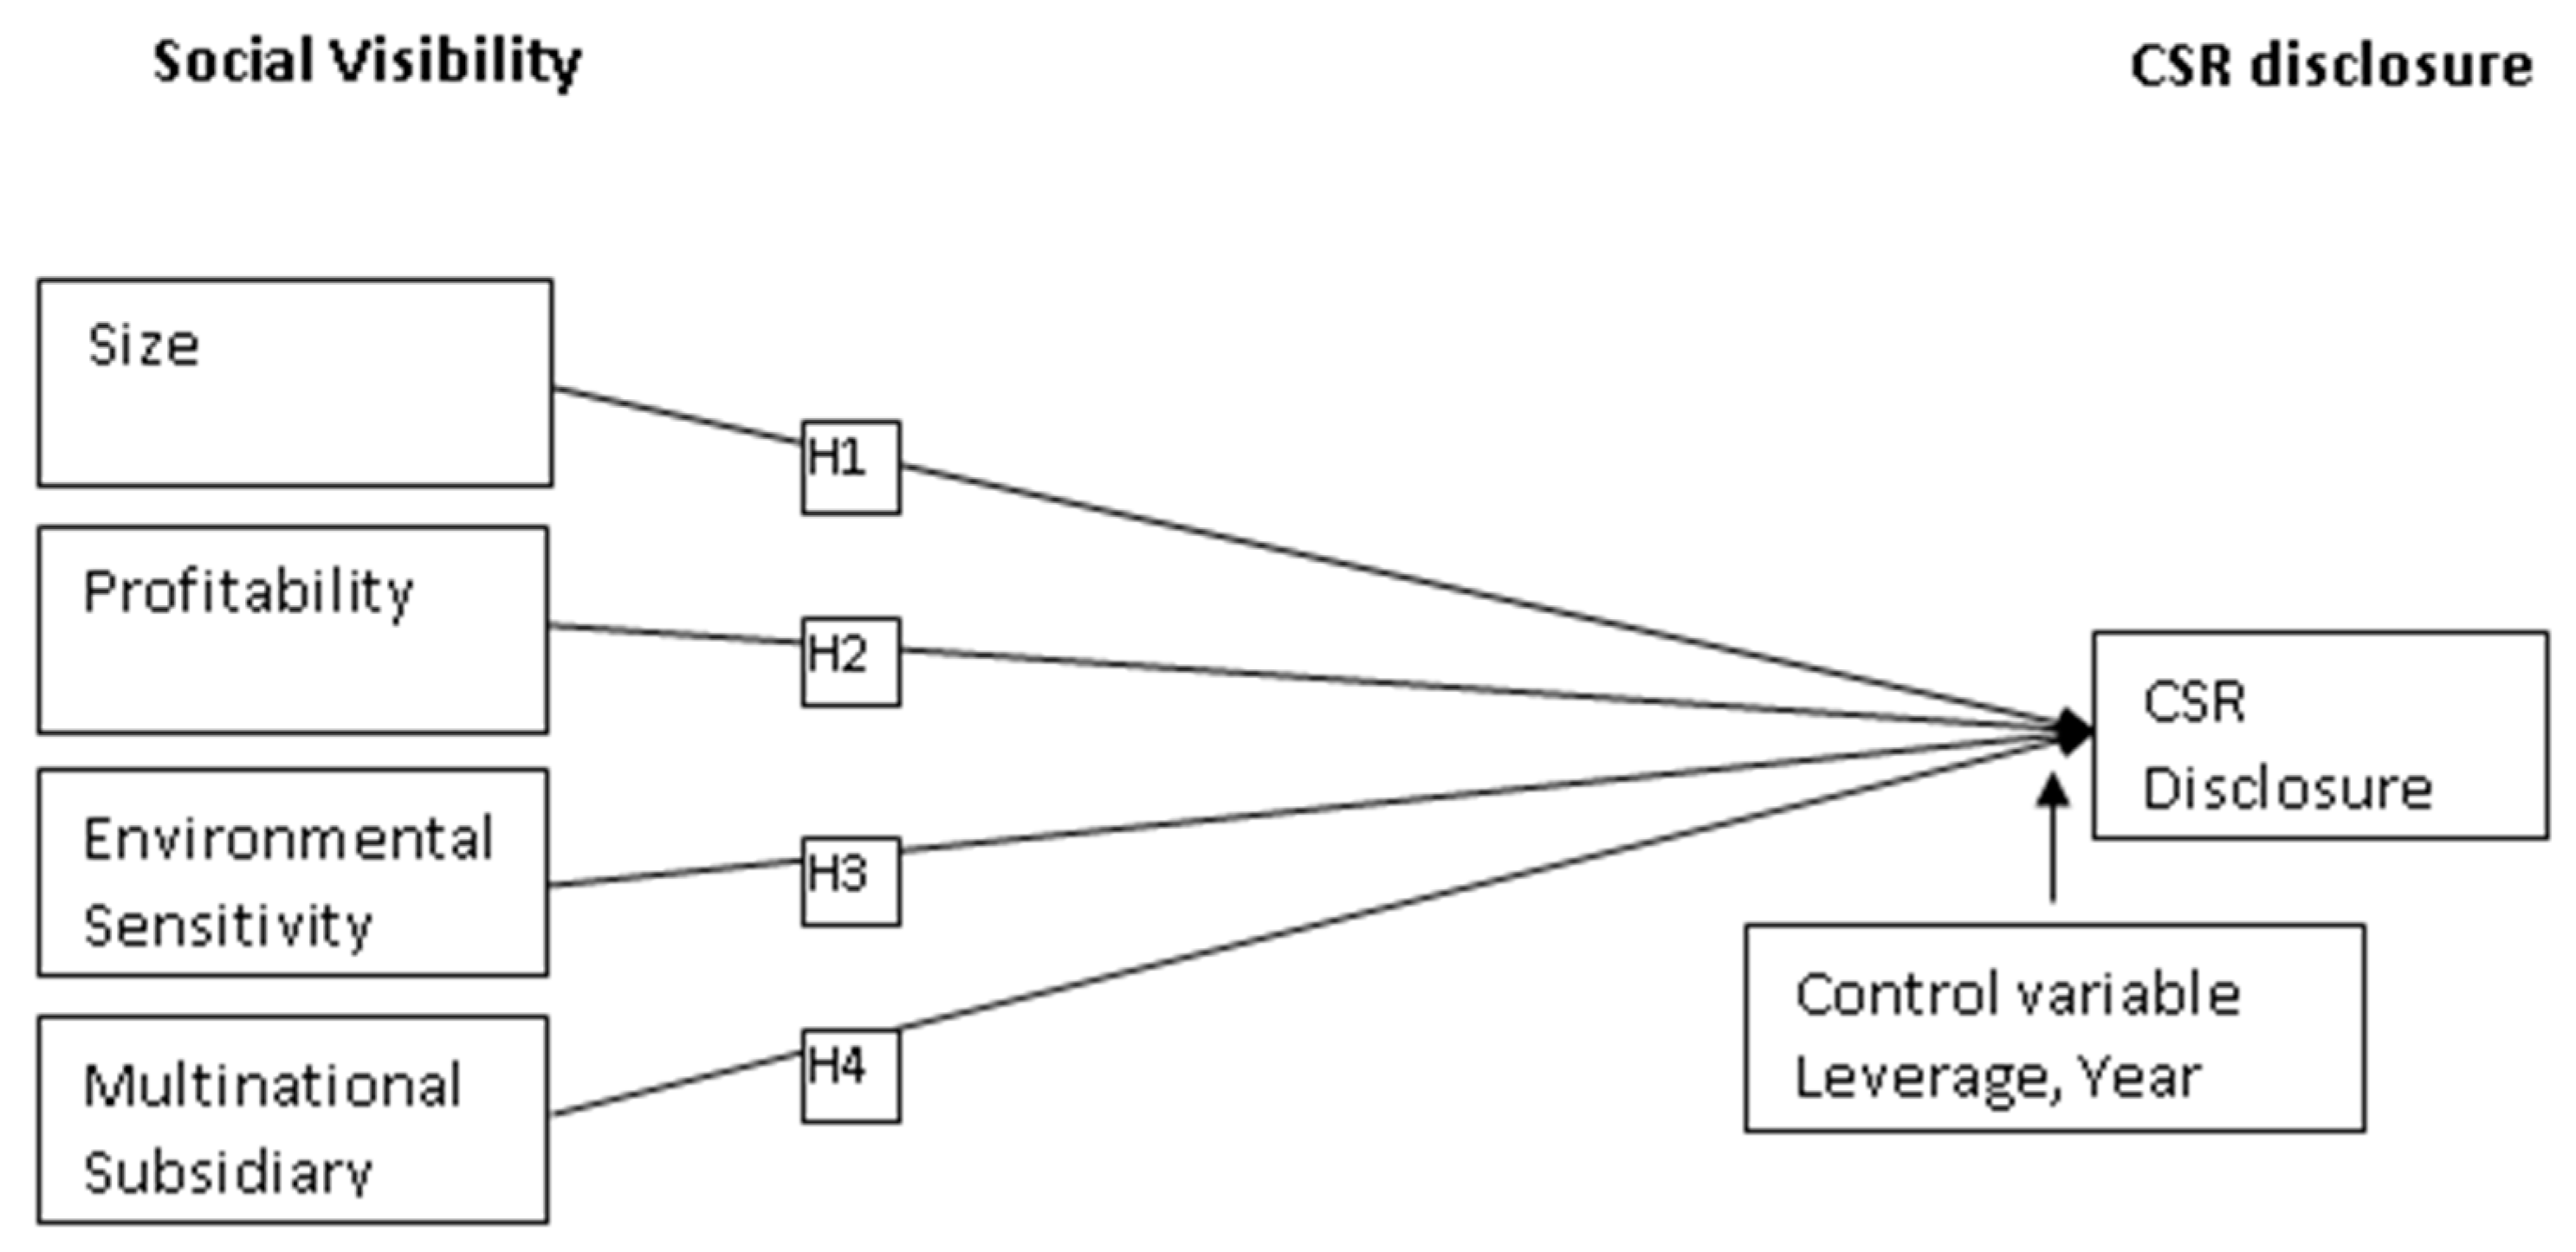
3. Theoretical Framework

The theoretical model developed here is based on the assumption that different proxies of social visibility, such as corporate size, profitability, industry type, and to be a subsidiary of multinationals, may have different effects on CSR disclosure, and is shown in Figure 1. The concepts and the hypotheses mentioned in the model are described below.

CSR Disclosure

The term ‘CSR disclosure’ is similar to the other terms, e.g., ‘social and environmental disclosure’ [51,52] and ‘corporate social reporting’ [52], used in the extant literature. CSR disclosure is defined as the voluntary provision of information on a corporation’s interaction with its natural and social environment [15,51,52,53,54]. The information published by a company may fall under several categories [52]. However, most social accountancy researchers agree that CSR-related information falls into four categories: environment, human resource, products and consumer, and community involvement [1,5,51]. Therefore, the information disclosed by a corporation in these categories is considered as ‘CSR disclosure’ in this research.

Social Visibility

Social visibility is the extent to which a company is known to the public [1,3,51,55]. A highly socially visible company attracts more stakeholders’ demands for socially responsible activities such as carrying out flood relief efforts, treating employees fairly, sponsoring events, donating funds, and building educational institutions, etc. [2]. A highly socially visible company will be exposed to pressures from various stakeholders such as the media, NGOs, the government to act in a socially and environmentally responsible manner [56,57], and consequently disclosure of those actions. It is not essential that a socially visible company would disclose CSR information due to external pressures rather than adopt a proactive approach by disclosing CSR information to be recognized as a legitimate company by reflecting consistency between corporate actions and the practices institutionalized in the environment in which the firm is operating [1,3,12,58]. Thus, it can be expected that a socially visible company would disclose more CSR information than a less socially visible company. Here, different company characteristics such as a large firm size, large profits, industry’s environmental sensitivity [1,3,51,55], and international experience [1] are considered as proxies of different aspects of a company’s public or social visibility. We relied on these proxies of social visibility due to a couple of reasons. Firstly, the availability of secondary data on these proxies, and secondly, these factors, particularly company size, company profitability, and company’s industry, are the most commonly examined determinants of CSR disclosure [1,2,30,51].

Hypotheses

Company’s Size

Prior studies have used company size as a proxy for social visibility (for example see Patten [55]; Reverte [3]; Hackston and Milne [51]; Mahadeo et al. [2]; Branco and Rodriques [1]). Large companies with high social visibility are more exposed to pressure groups including the media, NGOs, and the government, which may affect their operating practices [57]. According to legitimacy theory, changing societal expectations regarding social and environmental issues [59,60] requires companies to disclose their CSR performance to gain support and legitimize their activities [1,3]. A positive association between company size and its CSR disclosure has been observed in prior literature on both developed (Australia [61]; Six European Countries [62]; North America and Europe [63]; UK and Germany [64]; Companies included in MSCI World Index [65]) and developing countries (Malaysia: [26,66,67,68] Bangladesh [69]; Pakistan [49] India [27,34]; Saudi Arabia [70]). In addition to this, a recent literature review study has also pointed out that company size appears to influence CSR disclosure in both developed and developing countries [18]. Relating this to the context of the study, there are 648 large listed companies, including financial and non-financial, operating in Pakistan [71], which may be exposed to various groups such as the government and NGOs in Pakistan. Thus, based on the existing literature, the following hypothesis can be formulated.
Hypothesis 1 (H1).
Company size has a significant positive relationship with CSR disclosure.

Company’s Profitability

Financial performance of the company is also considered as one of the main determinants of CSR disclosure [57] as profitable companies are more scrutinized by the media and other pressure groups including NGOs and social movement organizations. According to legitimacy theory, profitable companies may incorporate changing societal expectations regarding CSR disclosure to be recognized as a socially responsible company [56]. The empirical evidence in both developed [63,72] and developing countries [18,27,49,66,67,73,74,75] have showed a significant relationship between a company’s profitability and its CSR disclosure. Thus, based on the above empirical evidence, the following hypothesis can be developed.
Hypothesis 2 (H2).
A company’s profitability has a significant positive relationship with CSR disclosure.

Industry’s Sensitivity

Social visibility has also been measured through industry affiliation [1]. Extensive research conducted in both developed [51,61,62] and developing countries [49,66,67,76,77] found that industry affiliation is also a determinant of CSR disclosure. Consistent with the results of these studies, a recent review study has demonstrated that an industry’s environmental sensitivity positively influences CSR disclosure in both developed and developing countries [18]. According to Perez-Batres et al. [78], industries can be dirty (sensitive industry) or clean. The dirtiest industries try to act in a socially responsible way as they are subject to more pressures from the media and NGOs and may face stringent future environmental regulations [56]. Legitimacy theory also explains that the dirtiest companies disclose their CSR information to gain support and legitimize their operations [59,60]. In line with the results of prior studies, the following hypothesis can be formulated.
Hypothesis 3 (H3).
A highly environmentally sensitive company has a significant positive relationship with CSR disclosure.

Multinational Companies Subsidiaries

The social visibility of multinational’s subsidiaries is high due to their presence in more than one country and these companies are exposed to both host and home country expectations and regulations. Thus, these companies are exposed to wider pressure groups including international media and NGOs (i.e., ILO, WWF). For example, Islam and Deegan [22] illustrated that multinational companies (i.e., NIKE and Rebuke) in the UK forced Bangladeshi garment manufacturers not to employ child labour due to pressures from international media and NGOs. From a legitimacy theoretical perspective, CSR information can be disclosed in order to conform to the expectations of the society [59,60]. Bearing in mind this theoretical perspective, multinational subsidiaries may disclose CSR information to conform to both host country and home country expectations.
According to the legitimacy theory perspective, multinationals disclose more CSR information to conform to both host and home county expectations and regulations. In Bangladesh, multinational companies disclosed more CSR information than national companies [79]. Prior literature also found that the parent company’s country affects multinational’s subsidiaries’ CSR disclosure [52,80,81,82]. Much work has been done in evaluating CSR disclosure in developed countries; however, our knowledge about CSR information disclosure in developing countries is embryonic [27]. In Pakistan, many multinational subsidiaries are operating from developed countries such as the UK, the USA, Germany, Norway, and Switzerland. Companies operating in developed countries are assumed to be more socially responsible than those operating in developing countries. In line with the above discussion, the fourth hypothesis of this paper is that multinational subsidiaries (have broad visibility) operating in Pakistan will disclose more CSR information than national companies of Pakistan.
Hypothesis 4 (H4).
A multinational company’s subsidiary has a significant positive relationship with CSR disclosure.

Control Variable

Previous scholarships have pointed out a significant relationship between company leverage and CSR disclosure [1,67,83], and therefore the leverage ratio has been considered as a control variable in this study. In addition to this, CSR disclosure might have increased with the passage of time, and therefore we have used a year dummy, as a control variable, to account for differences in CSR disclosure made in 2008 and 2011.

4. Materials and Methods

Research Method

This research uses a content analysis research method to codify the reported information in the annual reports into CSR disclosure themes. Content analysis is defined as a method of codifying the text (or content) into various categories (or groups) based on certain criteria [84,85]. It is the most commonly used method in the extant literature to determine corporate social and environmental disclosure scores [1,5,13,23,51,82,86,87,88,89,90]. Annual reports were selected as a source of information for content analysis due to their easily accessibility and long-standing credibility. Further, the same medium was used as a source of information for content analysis in the previous disclosure studies [21,30,43,51]. In addition to this, all the listed companies of Pakistan are required to publish their CSR-related information in the annual reports [91]. The annual reports of the listed companies were coded by two independent trained coders based on the CSR disclosure instrument. The calculated CSR disclosure scores were later reconciled and the discrepancies, if found, were resolved after a discussion with the coders. The data regarding financial ratios was also collected by the coders and later used to manually calculate the financial ratios.

Sample

The sample of this study consists of two cross sections of listed companies of Pakistan. The companies whose individual annual reports were available for the year 2008 and 2011 on their respective websites or on the website of the Pakistan Stock Exchange (PSE) were included in the sample. The first cross contains companies’ annual reports published in the year 2008 and, in this cross-section, 119 companies’ annual reports were selected. The second cross section contains annual reports published in the year 2011 and, in this cross section, 134 companies’ annual reports were selected. Thus, the sample consists of the annual reports of 253 listed companies. The sample consists of 56% manufacturing, 34% financial and insurance, and 10% other firms. Previous authors have argued that relying on only one window of observations for establishing the relationship between CSR disclosure and its antecedent factors may lead towards biased conclusions [2,30]. Therefore, this study incorporates two years (2008 and 2011) of data to obtain valid results.

Measurement of Dependent and Independent Variables

CSR Disclosure

The CSR disclosure instrument was developed based on the existing literature (notably Hackston and Milne [51]; Vountisjarvi [92]; Branco and Rodrigues [1]) and later updated/contextualized based on the CSR reporting guidelines published by the Securities and Exchange Commission of Pakistan (SECP) in the year 2009 and 2012, and on the CSR-related information reported in the annual reports of thirty leading companies of Pakistan. The final CSR disclosure instrument consists of four dimensions, e.g., environment, human resource, products and consumer, and community involvement, and each dimension has several themes. In addition to this, each theme has several indicators, which have further been grouped into three categories, namely aims, actions, and performance indicators (for detail see Appendix A). The disclosure of these indicators is considered as CSR in this research. Consistent with the previous studies [1,3,30,51], CSR disclosure is considered as a composite construct. The extent of CSR disclosure was measured, consistent with previous studies [51,79,93,94], by counting the number of sentences disclosed as CSR. ‘Sentence’ is the natural unit of written English and is easier to count than its alternatives, e.g., words [51] (Table 1).

Data Analysis Technique

The relationship between social visibility variables and CSR disclosure hypothesized earlier was tested by using a multiple linear pooled regression model. The general model of empirical analysis is:
Disclosure = ƒ (Proxies of social visibility, Control variables)
This general model can be further explained as:
Disclosureit = α1 + β1CSit + β2 CPit+ β3 ESit+ β4 MNNsit + β5 Leverageit+ β6 Year dummy+ εit
Here,
  • CS: Company Size
  • CP: Corporate Profitability
  • ES: Environmental sensitivity
  • MNNs: Multinationals Subsidiaries
  • t = 2008 and 2011
  • i = 1, 2, 3… 253.

5. Results

Descriptive Results

Table 2 provides the results of a descriptive analysis of all the variables used in this study. The sampled companies used an average of 45 sentences to describe their CSR-related activities. In addition to this, 34.8% of the sampled companies are operating in environmentally sensitive industries and 14.2% of the sampled companies are multinational owned subsidiaries. The companies included in the sample are large in size (average total asset = 30,682,678 thousand Pakistani rupee) and their average profitability is 3.30% of total assets (return on assets = 3.30%).

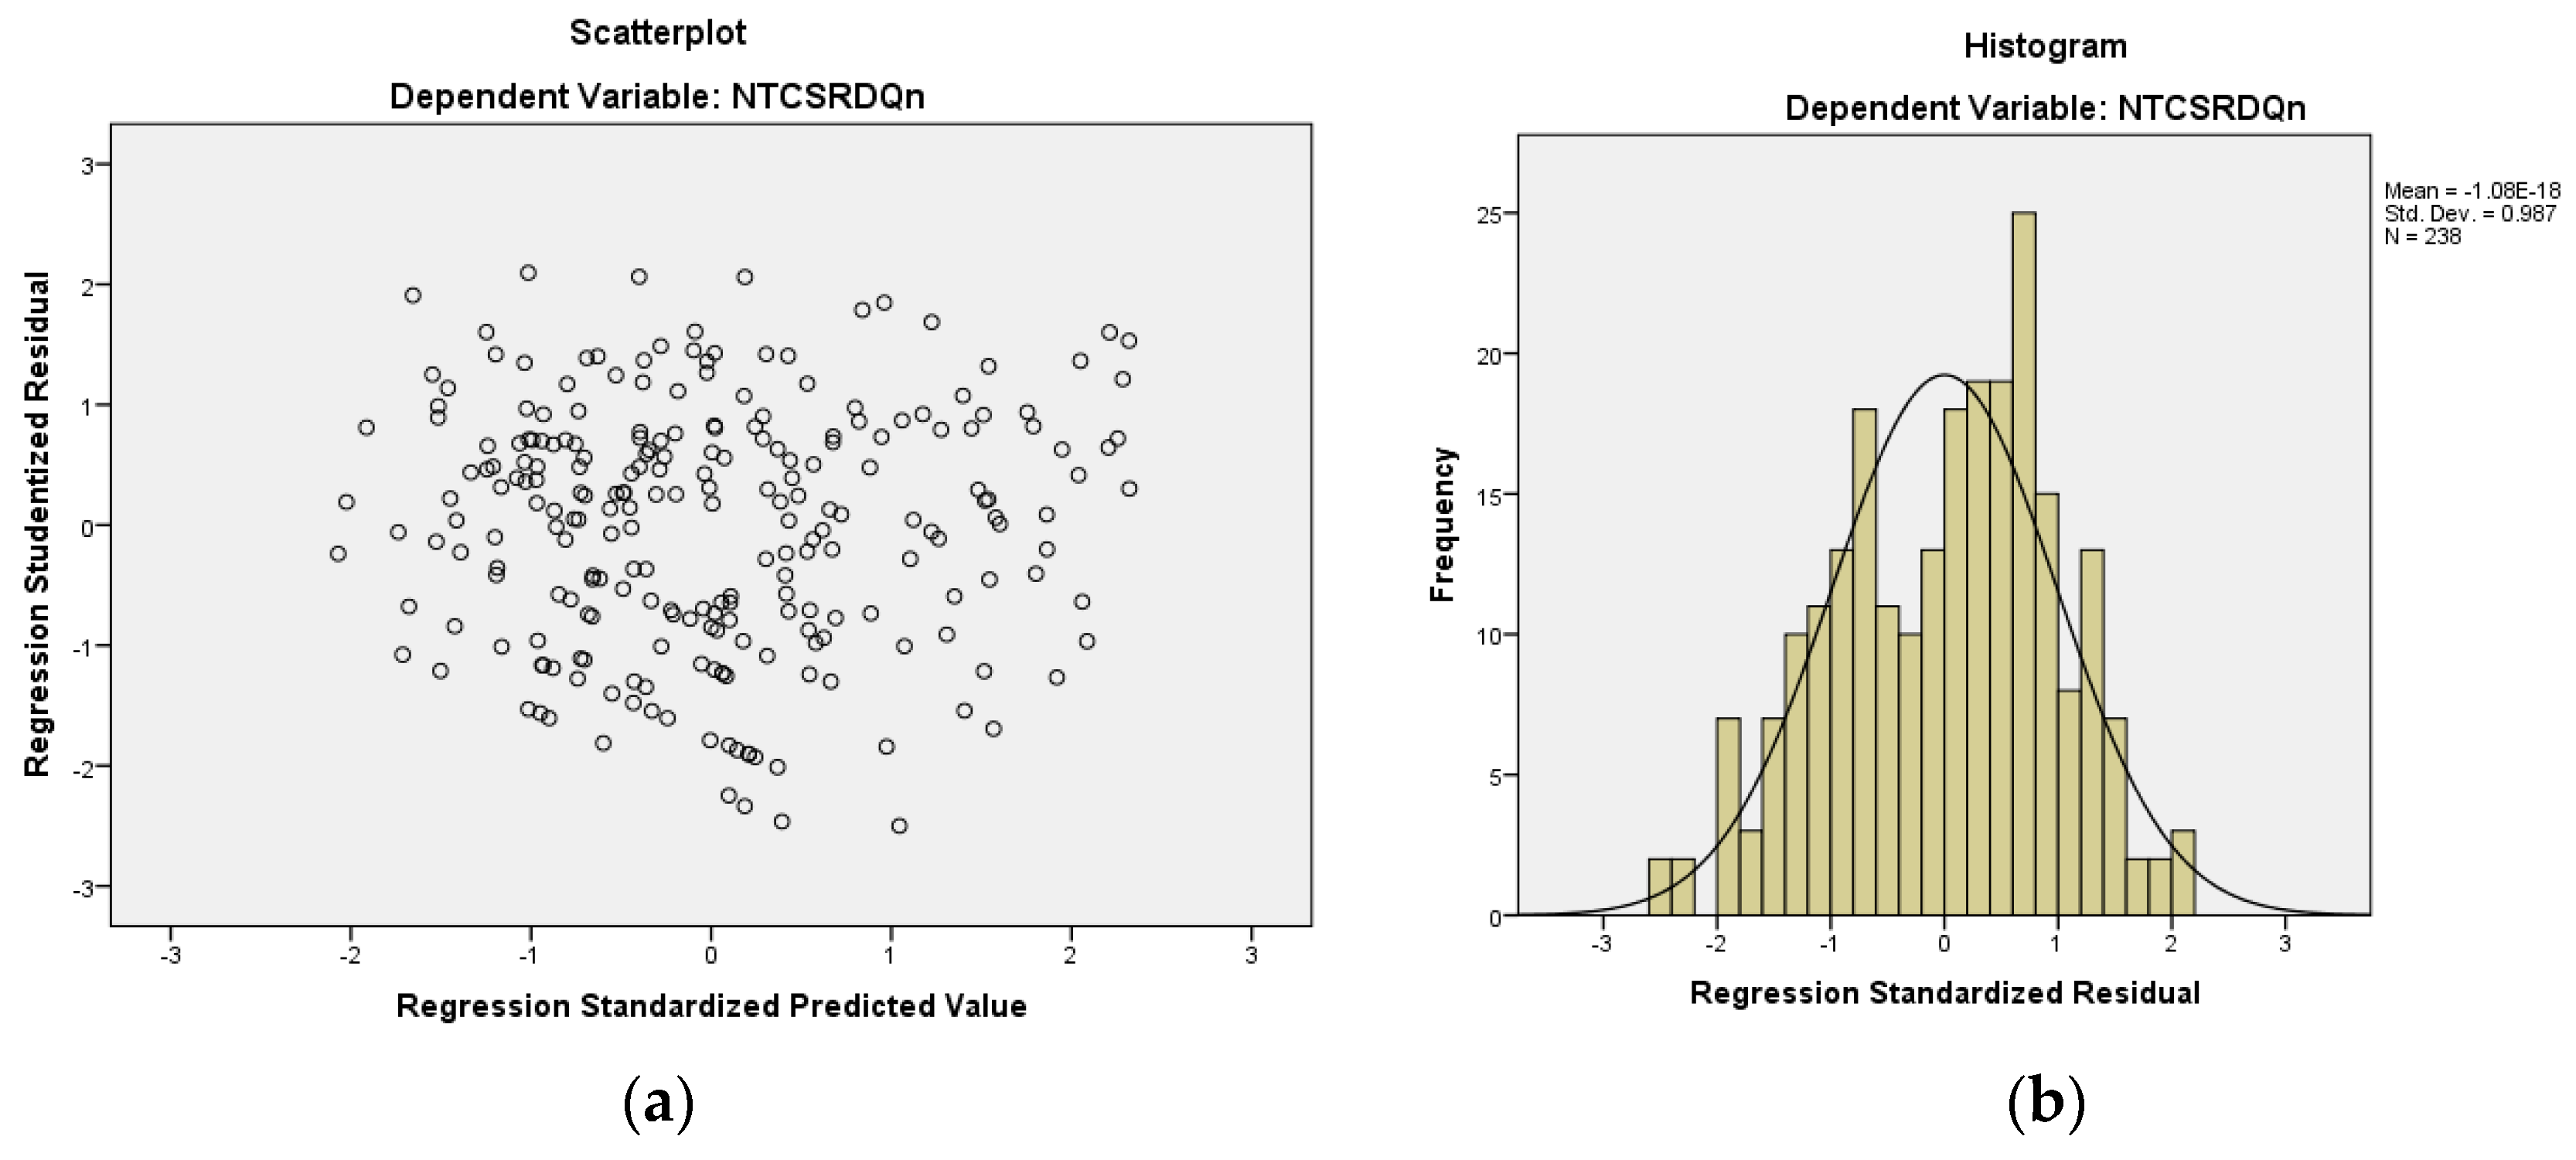
Regression Analysis Assumptions

This section discusses the assumptions of the regression analysis models (i.e., the extent of CSR disclosure). The plotting of standardized predicted values against the studentized residuals showed that the overall model is linear (see Figure 2a). The partial regression plots have shown that each variable in the model has a linear relationship with the dependent variable. The histogram shows that the residuals are normally distributed (see Figure 2b). Correlation matrix (see Table 3) and multicollinearity statistics such as tolerance and VIF values (see Table 4) show an absence of the multicollinearity problem in the model. A Breusch-Pagan test (χ2 = 0.22, p-value = 0.6364) for heteroscedasticy also shows constant variance of the residuals.

Regression Analysis Results

This research used a multivariate pooled regression analysis technique to examine the impact of social visibility variables with the extent of CSR disclosure. To examine this relationship, we used three models (i.e., experimental, base, and full). The experimental model explains 28.7% (adjusted R2) of variation in the CSR disclosure (p < 0.001). In the experimental model, company size, profitability, environmental sensitivity, and a subsidiary of multinationals were found to be significant. Model 2 contains control variables and it shows that none of the control variables are significant. Model 3 contains all the experimental and control variables and these collectively explain 28.7% of variation in the CSR disclosure (p < 0.001). This model shows a significant positive relationship between company size and the extent of CSR disclosure (p < 0.001). This result is consistent with the findings of existing disclosure studies, particularly Haniffa and Cooke [30], Amran and Devi [5], and Mahadeo et al. [2]. The results suggest that large companies with a high social visibility in Pakistan appear to favour CSR disclosure. In line with the findings of Haniffa and Cooke [30], the model shows a significant positive relationship (p < 0.001) between profitability (i.e., return on assets) and the extent of CSR disclosure. Model 3 also shows a significant positive relationship, as expected, of an industry’s environmental sensitivity with the extent of CSR disclosure (p < 0.001). This result is consistent with the previous studies, particularly Newson and Deegan [77], who have shown that high profile environmentally sensitive companies are disclosing significantly more CSR information than those in low profile industries. Consistent with the findings of a study conducted in Bangladesh [79], to be a multinational subsidiary was found to be significantly positively related to the extent of CSR disclosure (p < 0.001). In addition to this, we used an independent sample t-test to trace out the difference in CSR disclosure by multinationals with respect to their origin. We have found that multinationals originating from developed countries such as France, Germany, the USA, and the UK appear to disclose more information as compared to the multinationals from developing countries such as: Lebanon, Saudi Arabia, Oman, Japan, and Singapore (p < 0.047). Further, the control variables such as the leverage ratio and year dummy were found to be insignificant in the regression model.

Robustness of Results

To check the robustness of the results, we run multivariate regressions for the year 2008 and 2011. Table 5 presents the results of multivariate regression analysis performed on year 2008 data. For the year, we used three models (i.e., experimental, control, and full) to examine the impact of social visibility variables on CSR disclosure. Model 1 contains all the experimental variables and shows that company size, profitability, and environmental subsidiary have a significant positive relationship with CSR disclosure. The variables included in this model collectively explain a variation of 25% (adjusted R2). Model 2 shows that the control variable is not significantly influencing CSR disclosure. Model 3 contains all the experimental and control variables and these variables collectively explain 25.5% of variation in the CSR disclosure (p < 0.001). This model also shows that company size, profitability, and environmental sensitivity have a significant positive relationship with CSR disclosure.
Table 6 presents the results of multivariate regression analysis performed on the data collected for the year 2011. To examine the relationship between social visibility variables and CSR disclosure, we used three models (experimental, control, and full). Model 1 includes experimental variables and this model explains 30.5% of variation in the CSR disclosure (p < 0.001). In this model, company size, profitability, environmental sensitivity, and to be a multinational subsidiary have a significant positive relationship with the extent of CSR disclosure. Model 2 shows that the control variable is not a significant factor. Model 3 contains all the control and experimental variables. These variables collectively explain 31.1% of variation in the CSR disclosure (p < 0.001). This model shows that company size, profitability, environmental sensitivity, and to be a multinational subsidiary positively influence CSR disclosure. These results are consistent with the results found in Table 4. The results found in Table 5 and Table 6 show that company size, environmental sensitivity, and profitability have a significant positive influence over time, while multinational subsidiary was found to be significant in 2011 but not in 2008.

6. Discussion and Conclusions

The results have shown that different proxies of social visibility are associated with CSR disclosure. Company size has a significant positive relationship with CSR disclosure. This result is consistent with the findings of studies conducted in both developed [11,23,86,87] and developing countries [1,2,5,9,34]. This result suggests that large companies with a high social visibility in Pakistan appear to support the CSR issues in order to manage social expectations and/or to build reputation. This can be better understood by looking into Pakistani context, where 22% of the population are living below the poverty line and are deprived of basic facilities, i.e., education, health, and shelter. These facts reflect the substantial need for health care, educational, and other facilities (i.e., food and infrastructure) in Pakistan and can be regarded as the society’s expectations. The extant literature shows that Pakistani companies appear to pay more attention to community-related issues such as health and education-related matters as compared to other issues of concern such as environmental protection [32], thus supporting the legitimacy theoretical stance. Hence, the results provide support for the hypothesis H1, i.e., company size has a significant relationship with CSR disclosure.
In line with the studies conducted in both developed [87,95] and developing countries [6,30,34,50], we have found a significant positive relationship between company profitability and CSR disclosure. This result suggests that financially visible (i.e., highly profitable) companies in Pakistan appear to favour CSR issues to respond to the public expectations and to ensure them that profits are not being earned by exploiting the society’s resources such as environmental and human resources. Hence the results provide support for the hypotheses H2, i.e., company financial visibility has led to an increase in CSR disclosure.
Consistent with the earlier two proxies of social visibility and with the findings of previous studies conducted in developed [6,11,62,87] and developing countries [1,5,27,34,42,76], environmental sensitivity has a significant positive relationship with CSR disclosure. This suggests that environmentally sensitive companies of Pakistan appear to give more attention to CSR issues. The motive underlying this pattern of disclosure may be to build an environment friendly image and, as a proactive measure, to discard criticism regarding protection of the environment and irresponsible use of society’s resources. Hence, the result provides full support for the hypotheses H3, i.e., environmentally sensitive companies tend to display greater CSR disclosure.
Consistent with other proxies of social visibility, multinational subsidiary status was also found to be significantly positively related with CSR disclosure. This shows that multinational subsidiaries in Pakistan, as compared to the domestic companies, appear to pay more attention to CSR issues. This has happened due to the multitudes of pressures, perceived by subsidiaries of multinationals in Pakistan, and appearing to disclose CSR information in order to maintain their legitimate status in both the home and the host country. In addition to this, subsidiaries of multinationals from developed countries appear to disclose more information than the subsidiaries of multinationals from developing countries. This has happened due to the difference in the multitude of pressures, perceived by subsidiaries from developed and developing countries, from home country regulations, host country regulations, international media, international NGOs, and international customers. Hence the result provides support for the hypotheses H4, i.e., multinational subsidiary status is found to be significantly influencing CSR disclosure.
In sum, the results have shown that different proxies of social visibility such as company size, company profitability, environmental sensitivity, and to be a subsidiary of multinationals are associated with CSR disclosure. This suggests the highly visible firms in developing countries appear to exhibit more CSR disclosure than the less visible firms. As pointed out by existing studies (see Haniffa and Cooke [30]; Ali et al. [49]; Le et al. [97]; Coles et al. [98]), this might by happening due to the implementation of sophisticated corporate governance mechanisms such as independence of the board, CSR committees, board size, and CSR-based incentives in highly visible companies. This result contributes to the literature on determinants of CSR disclosure about developing countries in general and about Pakistan in particular, which has previously been ignored by the research community. This result has some implications for the listed companies. Highly visible firms are prone to the monitoring of various stakeholders such as the media, NGOs (i.e., ILO, WWF), institutional investors, and regulatory bodies, and this requires highly visible firms to make disclosure about issues highly important to these stakeholders. This will enable highly visible firms to maintain their legitimate status with these stakeholders and will further enable these firms to access resources required by them for their survival without bearing any resistance from the stakeholders actively monitoring corporations’ behavior. It is further suggested that highly visible firms need to follow the proactive approach in managing social issues relevant to them in order to avoid any resistance from their powerful stakeholders. Further, consistent with the findings of earlier studies, notably Haniffa and Cooke [30], Ali et al. [49], and Khan et al. [40], these companies may adopt sophisticated corporate governance mechanisms to enhance their CSR disclosure.
This study is not free from limitations. Firstly, this study focused on large listed companies of Pakistan and therefore the results of this study cannot be applied to other non-listed companies including small and medium sized enterprises. Therefore, future research should incorporate data from non-listed companies for the understanding of factors considered important for the disclosure of CSR information. Secondly, this study took a sample of listed companies from a single developing country, and therefore the results of this study cannot be generalized to other countries. In order to further validate these findings, the same model may be tested in other country contexts including developing and developed countries. Thirdly, this study used the extent of CSR disclosure in examining the relationship between different proxies of social visibility and CSR disclosure. The incorporation of other measures such as the level and quality of CSR disclosures in determining the association between social visibility proxies and CSR disclosure will further validate the results of this study. Fourthly, this study relied on the CSR disclosure data published in the years 2008 and 2011 and could not use the recent data. The inclusion of the most recent data will enable us to understand the up-to-date picture of CSR reporting in Pakistan. Thus, future researchers are required to incorporate the latest data while examining the nature of CSR disclosure in Pakistan. Fifthly, by disclosing more CSR information, a company may become more socially visible. This aspect of reverse causality has not been investigated in this research, and therefore future researchers need to investigate the matter of endogeneity in their research. Finally, this study relies on limited proxies of social visibility and the incorporation of other proxies such as: corporate philanthropic expenditures, comprehensive webpage, number of employees, advertising intensity, and/or social media presence, may provide better insights in order to understand the relationship between social visibility and CSR disclosure.

Author Contributions

Five authors have contributed to this research. The first author formulated an idea and converted it into reality by writing an introduction, literature review, development of hypotheses and data analysis section. The second author fixed the revisions mentioned by the reviewers. The third and the fifth authors have done the data analysis and drafted the conclusion. The fourth author drafted the conclusion and discussion section of this article.

Conflicts of Interest

The authors declare no conflict of interest.

Appendix A

Final CSR disclosure instrument-CSR disclosure dimensions, themes, and their indicators.
Company’s Name: Company’s Sector:
Company’s Products:
Company’s Code: Total Score:
Coder’s Name: □  □
Disclosure Themes and IndicatorsWhere to locate informationIdentification of indicatorScore
 A. ENVIRONMENTAL DISCLOSURE:
 1. Environmental Pollution:
AIMS/INTENTIONS:
Pollution abatement
No emissions *


Vi/Mii/CViii/SEiv


ACTIONS:
Research and development for pollution abatement
Compliance with environmental laws and regulations (i.e., ISO 14000, GOTSv)
Repair of damage to the environment
Anti-litter campaigns (i.e., beach cleaning campaign/systems)
Trees plantation related to pollution reduction *
Installation of new equipments (e.g., dust collection equipment) *
Noise education *
Providing protective gadgets from noise *
Environmental management system in place *

DRvi/CSRSvii/ES viii


PERFORMANCE:
Research and development expenditure for pollution abatement
Percentage of pollution reduction
Amount spent on trees plantation *
Number of trees planted *
Environmental awards (e.g., AEEA Awards, NFEH, ACCA-WWF) *
Amount Spent *

DR/CSRS/ES


 2. Conservation of Natural Resourcesix:
AIMS/INTENTIONS:
Conservation of natural resources


V/M/CV/SE

 
ACTIONS:
Recycling glass
Recycling metal
Recycling plastic *
Recycling oil
Recycling water (e.g., installation of water recycling system)
Recycling paper
Use recycled material
Efficiently using material resources in manufacturing process (by changing or adopting procedures)
Installation/up gradation of system (e.g., installation of gas and heat recovery system) *

CSRS/ES


PERFORMANCE:
%age or amount of glass recycled or used or both
%age or amount of metal recycled or used or both
%age or amount of plastic recycled or used or both *
%age or amount of oil recycled or used or both
%age or amount of water recycled or used or both
%age or amount of paper recycled or used or both
Amount (or %age) of gas saved *
Amount of other natural resources saved *

DR/C
SRS/ES


 3. Energy:
AIMS/INTENTIONS:
Conservation of energy in the conduct of business operations


V/M/CV/SE

 
ACTIONS:
Using energy more efficiently during the manufacturing process
Utilizing waste material for energy production
Conducting research to improve energy efficiency
Voicing the company concerns about energy shortage (i.e., energy shortage awareness programmes)
Running energy saving programmes for employees (i.e., educating employees to turn off the unnecessary lights and computers) *
Use renewable energy (e.g., wind energy, solar energy, energy from wasted heat) *
Installation/up gradation of system to save energy (e.g., rich reflux re-boiler) *

DR/CSRS/ES


PERFORMANCE:
Energy savings result from product recycling
Amount of increased energy efficiency of products
Received award on energy saving (conservation) programmes
Amount of money spent on energy conservation programmes
Amount of energy saved *

DR/CSRS/ES


 4. Aesthetics:
AIMS/INTENTIONS:
Beautify the environment
To become green factory *


V/M/CV/SE


ACTIONS:
Designing facilities harmonious to the environment
Contribution in terms of cash or art/sculptures to the beauty of the environment
Restoring historical buildings and structures
Sponsoring gardening and spring flower competition *
Planting trees (not related pollution reduction) *

DR/CSRS/ES


PERFORMANCE:
Amount of cash spent on the beauty of the environment
Number of building restored and restructured *
Number of trees planted *
Amount spent of trees plantation *

DR/CSRS/ES


 5. Environment Other:
AIMS/INTENTIONS:
Educate employees on environmental issues
Wildlife conservation *
General awareness *
Environmental protection (in general) *


V/M/CV/SE/CSRS


ACTIONS:
Environmental awareness programs for employees
Undertake environmental impact studies to monitor the company’s impact on the environment
General awareness programmes (e.g., earth day celebration, world environmental day) *

DR/CSRS/ES


PERFORMANCE:
Amount of money spent on environmental training of employees *
Number of employees received environmental training *
Amount of money spent on wild life conservation *

DR/CSRS/ES


 B. HUMAN RESOURCE DISCLOSURE:
 1. Training and Staff Development:
AIMS/INTENTIONS:
Life-long learning or continuous learning
Employability of an employee
Provide career development opportunities *


V/M/CV/SE


ACTIONS:
Training aiming at achieving formal qualifications
Development discussions
In-house/outside trainings *
Abroad training *
Job rotation
Competence appraisals
Personal development plans
Support for employees_ studies on their own accord
Measures to integrate low skilled employees
Seminars and workshops *

DR/CSRS/EmpSx


PERFORMANCE:
Cost of training
Time spent for training
Perception measures (qualitative or quantitative)
Number of employees participating in training initiatives

DR/EmpS/CNxi


 2. Pay and Benefits:xii
AIMS/INTENTIONS:
Just, equal pay
Reward according to their abilities and performance *


V/M/CV/SE


ACTIONS:
Incentive schemes (results or performance based pay etc. for both employees and directors)
Option schemes (for both employees and directors)
Shares and options owned by individual directors
Personnel fund
providing assistance or guidance to employees who are in the process of retiring or who have been made redundant; **
Providing staff accommodation/staff home ownership schemes; **
Providing recreational activities/facilities **
Employees’ pension and provident funds plans *
Education support for employees’ children *

DR/EmpS

POSxiii


NTFSxiv


PERFORMANCE:
Perception measures (qualitative or quantitative)
Average wage
Spread of wages
Pay and conditions compared against local equivalent averages (qualitative or quantitative)
Amount of pension and provident fund *
Number of employees’ children benefited *
Performance awards (e.g., gold medals, long service awards) *

DR/CSRS/EmpS/CN


NTFS


 3. Participation and Staff Involvement:
AIMS/INTENTIONS:
Principle of open or two way communication
Foster team work and employees participation*


V/M/CV/SE


ACTIONS:
Representation of personnel in the company’s administration
Teams
A co-operative body
Trade-unions, collective agreements
A suggestion scheme
Intranet
Work-force meetings
A personnel newsletter
A personnel guide
Informing personnel about corporate strategy
Immediate supervisor as a communication channel
E-mail to the managing director
Anonymous complaint points
Informing personnel about financial performance
Internal staff letters*

DR/CSRS/EmpS/CN


PERFORMANCE:
Perception measures (qualitative or quantitative)
Number of days or losses related to industrial action
Ratio of recognised trade-unions to existing trade unions

DR/CSRS/EmpS


 4. Health and Safety and Individual Well-being:
AIMS/INTENTIONS:
Stress on preventive activities (e.g., occupational health and safety)
Retaining the personnel working capacity up to proper retirement age
zero accidents
Employees’ health and safety*
Improve working conditions*


V/M/CV/SE


ACTIONS:
Support for sport (e.g., cricket tournaments, gym, cafeteria, swimming facility) or recreation (e.g., family functions, musical nights)
Support for rehabilitation
Measurements
Training or advice on health issues
Support to employees with mental problems
Health screening, follow up
G.P (general practitionerxv) services
Action against drugs or alcohol
Special doctor services
Special attention paid to ageing people
Surveys on stress
Health and safety training (e.g., fire fighting drills)
Occupational health and safety system audited by third parties (OSHAS 180001)
Analysing the causes of work-related accidents and safety surveys
Improving the workplace ergonomics
Improving the hygiene at work
Improving the management of threat and violence
Health and safety awareness programmes (e.g., publish monthly health and safety bulletins, celebrating no smoking day, health and safety videos, safety presentations )*
Installing health and safety detective equipments*

DR/CSRS/EmpS


PERFORMANCE:
Rate of absence
Occupational health costs
Perception measures (qualitative or quantitative) (e.g., external health and safety ratings)
Work organisation and community (disclosed in context of employee well-being)
Number of occupational injuries
Number of employees trained *
Occupational health and safety awards *
Number of man hours achieved *

DR/CSRS/EmpS/CN


 5. Measurement of Policies:
AIMS/INTENTIONS:
To measure the success the of HRM related policies and process
ACTIONS:
Working atmosphere or job satisfaction survey
Other internal survey
External survey


V/M/CV/SE


PERFORMANCE:
Staff turnover (or attrition rate)
Breakdown by length of employment contract
Average length of employment contract
Standards (qualitative or quantitative)
Awards (qualitative or quantitative)
Working atmosphere or job satisfaction index
Ethical funds (with or without reference to HRM, qualitative or quantitative)
Retention rate

DR/CSRS/EmpS


 6. Employment Policy:
AIMS/INTENTIONS:
Positive employer image


V/M/CV/SE

 
ACTIONS:
Traineeships for students (i.e., internships/apprenticeships)
Summer and part-time employment of students
Company has offered training and employment for unemployed people
Company has offered training and employment for ageing people
Company has offered training and employment for people with disabilities
Company has offered training and employment for immigrants or ethnic minorities
Company has offered training and employment for low skilled people

DR/CSRS/EmpS


PERFORMANCE:
Number of new recruits
Number of traineeships
Results of external employer image surveys (qualitative or quantitative)
Number of ageing new recruits
Number of new recruits with disabilities
Number of new recruits from immigrants/ethnic minorities

DR/CSRS/EmpS


 7. Equal Opportunities:
AIMS/INTENTIONS:
Principle of non-discrimination/equal opportunities/diversity


V/M/CV/SE

 
ACTIONS:
Equal opportunity plan
Diversity or equal opportunity training
Attention paid to equality in wages
Measures to facilitate the adaptation of immigrants or ethnic minorities
Code of practice for sexual harassment
Code of practice for bullying (aggressive behaviour)
Surveys on equality
Targeted recruitment in order to balance gender segregation
Measures to facilitate the adaptation of people with disabilities
Engagement of third party (outside agency) in the recruitment process*
Social accountability standard (e.g., SA 8000)*

DR/CSRS/EmpS


PERFORMANCE:
Breakdown by age
Average age
Breakdown by gender
Number of women in management positions
Number of immigrants or employees from ethnic minorities
Number of people with disabilities
Number of people with disabilities in management positions
Number of people with ethnic background in management positions
Number of legal non-compliances with legislation
Workforce profile compared to the community profile for travel to workforce (qualitative or quantitative)
Perception measures (qualitative or quantitative)
Number of women working in the factory*

DR/CSRS/EmpS


 8. Work–life Balance:
AIMS/INTENTIONS:
Principle of work–life balance


V/M/CV/SE/CSRS

 
ACTIONS:
Flexitimexvi
Support for childcare (e.g., day care centre)
Better maternity or parental leave advantages than stipulated in law and collective agreements
Encouragement for men to use their family leave options
Complementary training for those returning from family leave
Survey on work-life balance
Concierge (attendant) services

DR/CSRS/EmpS


PERFORMANCE:
Perception measures (qualitative or quantitative)

DR/CSRS/EmpS
 
 C. PRODUCTS AND CONSUMERS DISCLOSURE:
 1. Product Developments:
AIMS/INTENTIONS:
Develop or improve company’s products


CSRS


ACTIONS:
Development related to the company’s products including Packaging
Making containers reusable
Research and developments related to product developments

DR/CSR/PSxvii


PERFORMANCE:
Amount/percentage figure of research and development expenditure
Amount/percentage figure showing research and development benefits

DR/CSRS/PS
 
 
 2. Product Safety:
AIMS/INTENTIONS:
Improve product safety


V/M/CV/SE/CSRS

 
ACTIONS:
Products meet applicable standards (i.e., ISO 22000 product standards, Oeko Tex 100 in textile sector)
Actions taken to make products safe for consumers
Conducting research on company products
Sanitary procedures improved in the processing and manufacturing of products
Educating people about companies products’ negative impacts

DR/CSRS/PS


PERFORMANCE:
Product safety awards

DR/CSRS/PS
 
 3. Product Quality:
AIMS/INTENTIONS:
Improve/maintain product quality


V/M/CV/SE/CSRS

 
ACTIONS:
Product quality audited by third party (i.e., ISO 9000)
Employ state of art machines and technology*
DR/CSRS/PS/Awards section
 
 
PERFORMANCE:
Firm’s product quality awards/prizes
DR/CSRS/PS/Awards section
 
 4. Consumers’ Relations**:
AIMS/INTENTIONS:
Customers’ relationship building*
Customers’ satisfaction*


V/M/CV/SE/CSRS


ACTIONS:
Customers satisfaction survey
External survey
Customers complaints system
Education about company’s products (e.g., properly labelled, advertised, and communicated)*
Free Customer Service (especially in automobile)*

DR/CSRS/PS


PERFORMANCE:
Number of customers complaints
Customers satisfaction results (Perception measure used by Vuontisjarvi, [92]
Number of consumers’ educated *

DR/CSRS/PS


 D. COMMUNITY INVOLVEMENT DISCLOSURE:
 1. Support for Education/training ***:
AIMS/INTENTIONS:
To promote public education


V/M/CV/SE/CSRS

 
ACTIONS:
Aiding medical research
Sponsoring educational conferences and seminars
Funding scholarship (i.e., need based or merit based) programmes or activities
Running personality development/stress management workshops *
Establishing/renovating schools *
Company visit of students *
Supporting NGOs providing education *
Organize vocational courses/trainings (e.g., driving courses, mobile repairing, home appliances repairing, Technical diplomas) *
Offering free water, electricity, and gas facility to the schools *
Establishing/running educational projects with NGOs *
Supporting educational institutions *

DR/CSRS/CRxviii


PERFORMANCE:
Amount of money spent on education *
Amount of sponsorship *
Number of scholarship *
Number of students benefited *
Number of students trained *
Number of school built *

DR/CSRS/CR


 2. Support for Art and Culture:
AIMS/INTENTIONS:
To promote a country’s arts and culture


V/M/CV/SE/CSRS

 
ACTIONS:
Sponsoring art exhibitions
Sponsoring national pride campaigns
Support government sponsored campaigns
Sponsoring cultural events *
Supporting social evenings (i.e., musical nights for the community excluding a company’s employees) *
Contesting arts events *

DR/CSRS/CR


PERFORMANCE:
Amount of sponsorships
Number of persons benefited from the events *

DR/CSRS/CR
 
 
 3. Support for Public Health ***:
AIMS/INTENTIONS:
To make the public healthy


V/M/CV/SE/CSRS

 
ACTIONS:
Sponsoring public health projects
Sponsoring medical trusts *
Conducting research on road accidents *
Running health awareness programmes (e.g., HIV/AIDS awareness programmes, blood screening camps, safety lectures) *
Sponsoring national safety conferences *
Establish health institutions (i.e., hospitals and health care units) *
Supporting NGOs providing healthcare facilities *

DR/CSRS/CR


PERFORMANCE:
Amount of money spent on public health programmes *
Number of people benefited from health projects/awareness programmes *

DR/CSRS/CR
 
 
 4. Sponsoring Sporting or Recreational Projects ***:
AIMS/INTENTIONS:
To promote sports in the country


V/M/CV/SE/CSRS

 
ACTIONS:
Sponsoring sports events (i.e., tennis championship, squash championship, cricket tournament, and swimming competition)*

DR/CSRS/CR
 
PERFORMANCE:
Amount of money spent on sports activities *
Number of teams participated *

DR/CSRS/CR
 
 
 5. Other Community Activities ***:
AIMS/INTENTIONS:
To develop/uplift community (facilities or infrastructure)
To support established community activities, events, or organizations


V/M/CV/SE/CSRS


ACTIONS:
Support for the development of airports *
Installation of clean drinking water plants *
Providing clean drinking water *
Development of parks, roads, culverts, and bridges *
Developing and maintaining sewerage and drainage system *
Development of union council offices *
Providing support to the local police *
Donation of cash
Donation of company products
Donations of employees’ time
Opening companies’ facilities to the public
Offering free water, gas facility to the mosques of the vicinity *
Provide maintenance facility to the mosques *
Development of rehabilitation centres (for flood/earth affecties or prisoners) *
Providing relief goods to flood/earth affecties *

DR/CSRS/CR


PERFORMANCE:
Quantitative evidence of development of parts, roads, and bridges *
Amount of money spent on building community facilities *
Number of (or amount spent on) cleaning drinking plants installed *
Amount of donation *
Quantity of products donated *
Amount of employees time *
Number of people benefited *
Number of rehabilitation centres built *
PCP awards *

DR/CSRS/CR


NTFSxix


 E. GENERAL DISCLOSURE:
Includes disclosure which will not be covered by above CSR disclosure categories: environment, human resource, products and consumers, and community involvement disclosure. For example: Vendors/partners training and education.
AIMS/INTENTIONS:
General CSR information (for quantitative disclosure) *
Core Values *
Statement of Ethics and Business Practices *
Code of Ethics *


ACTIONS:
Training to vendors and partners (i.e., suppliers)
 
PERFORMANCE:
Number of person trained *
Amount spent on training of vendors and partners *
CSR awards *


SOCIAL VISIBILITY VARIABLES:
Total Assets (0,000): …………………………………………
Total Debts (0,000):………………………………………….
Net Income (Net profit after taxes) (0,000): ………………………………………
Industry Sensitivity (If a company is operating in industry having SIC code 28XX excluding 283X, 22XX, 26XX, and 2911)
Whether the company is a subsidiary of Multinationals  □ Yes No  □
i Vision statement; ii Mission statement; iii Core values; iv Statement of ethics; v Global organic textile standard; vi Director’s report; vii Corporate social responsibility section; viii Environment section; ix Hackston and Milne [51] treated conservation of natural resources as indicator of environmental pollution theme under environmental disclosure category. However, five out of 10 sampled companies reported information about this indicator. That is why this indicator is considered a separate theme here. However, its definition was adopted from Hackston and Milne [51]. Conservation of natural resources included recycling glass, metal, oil, water, and paper [51]; x Employees’ section; xi Company notes; xii Pay and benefits theme does not include disclosures made to comply with accounting regulations such as: salaries and wages, other employees’ costs and salaries, and pension arrangement for directors (consistent with Vuontisjarvi [92]; xiii Pattern of shareholdings; xiv Notes to financial statements; xv A medical practitioner who treats acute and chronic illnesses and provides preventive care and health education for all ages; xvi A system of working, in which an employee can choose the hours of starting and leaving time each day; xvii Product section; xviii Community relations; xix Notes to financial statements.
Human resource disclosure themes and their indicators were adopted from Vuontisjarvi [92], except indicators with an asterisk (*) sign, while environmental disclosure and products disclosure themes and indicators were adopted from Hackston and Milne [51], except indicators with an asterisk (*) sign. Moreover, Hackston and Milne [51] discussed all indicators of community involvement under one theme, ‘community involvement’, but Branco and Rodrigues [1] discussed these indicators under five themes: charitable donations and activities, support for education, support for the arts and culture, support for public health, and sponsoring sports and recreational projects, which have been adopted to categorise community development indicators of Hackston and Milne [51]. Indicators displaying an asterisk (*) sign were included in the research instrument based on reported information in companies’ annual reports. Indicators with two asterisk (**) signs were adopted from Hackston and Milne [51]. Themes exhibiting three asterisk (***) signs were adopted from Branco and Rodrigues [1].

References

  1. Branco, M.C.; Rodrigues, L.L. Factors influencing social responsibility disclosure by Portuguese companies. J. Bus. Ethics 2008, 83, 685–701. [Google Scholar] [CrossRef]
  2. Mahadeo, J.; Oogarah–Hanuman, V.; Soobaroyen, T. A longitudinal study of corporate social disclosures in a developing economy. J. Bus. Ethics 2011, 104, 545–558. [Google Scholar] [CrossRef]
  3. Reverte, C. Determinants of corporate social responsibility disclosure ratings by Spanish listed firms. J. Bus. Ethics 2009, 88, 351–366. [Google Scholar] [CrossRef]
  4. Laan Smith, J.; Adhikari, A.; Tondkar, R.H. Exploring differences in social disclosures internationally: A stakeholder perspective. J. Account. Public Policy 2005, 24, 123–151. [Google Scholar] [CrossRef]
  5. Amran, A.; Devi, S.S. The impact of government and foreign affiliate influence on corporate social reporting: The case of Malaysia. Manag. Audit. J. 2008, 23, 386–404. [Google Scholar] [CrossRef]
  6. Tagesson, T.; Blank, V.; Broberg, P.; Collin, S. What explains the extent and content of social and environmental disclosures on corporate websites: A study of social and environmental reporting in Swedish listed corporations? Corp. Soc. Responsib. Environ. Manag. 2009, 16, 352–364. [Google Scholar] [CrossRef]
  7. Huang, C.; Kung, F. Drivers of environmental disclosure and stakeholder expectation: Evidence from Taiwan. J. Bus. Ethics 2010, 96, 435–451. [Google Scholar] [CrossRef]
  8. Oh, W.; Chang, Y.; Martynov, A. The effect of ownership structure on corporate social responsibility: Empirical evidence from Korea. J. Bus. Ethics 2011, 104, 283–297. [Google Scholar] [CrossRef]
  9. Chiu, T.; Wang, Y. Determinants of social disclosure quality in Taiwan: An application of stakeholder theory. J. Bus. Ethics 2014, 121, 1–20. [Google Scholar] [CrossRef]
  10. Thorne, L.; Mahoney, L.S.; Manetti, G. Motivations for issuing standalone CSR reports: A survey of Canadian firms. Account. Audit. Account. J. 2014, 27, 686–714. [Google Scholar] [CrossRef]
  11. Patten, D.M. Exposure, legitimacy, and social disclosure. J. Account. Public Policy 1991, 10, 297–308. [Google Scholar] [CrossRef]
  12. Deegan, C. Introduction: The legitimising effect of social and environmental disclosures—A theoretical foundation. Account. Audit. Account. J. 2002, 15, 282–311. [Google Scholar] [CrossRef]
  13. Deegan, C.; Rankin, M.; Tobin, J. An examination of the corporate social and environmental disclosures of BHP from 1983–1997: A test of legitimacy theory. Account. Audit. Account. J. 2002, 15, 312–343. [Google Scholar] [CrossRef]
  14. Parker, L.D. Social and environmental accountability research: A view from the commentary box. Account. Audit. Account. J. 2005, 18, 842–860. [Google Scholar] [CrossRef]
  15. O’Dwyer, B. Managerial perceptions of corporate social disclosure: An Irish story. Account. Audit. Account. J. 2002, 15, 406–436. [Google Scholar] [CrossRef]
  16. Owen, D. Chronicles of wasted time? A personal reflection on the current state of, and future prospects for, social and environmental accounting research. Account. Audit. Account. J. 2008, 21, 240–267. [Google Scholar] [CrossRef]
  17. Blowfield, M.; Murray, A. Corporate Responsibility, 2nd ed.; Oxford University Press: Oxford, UK, 2011. [Google Scholar]
  18. Ali, W.; Frynas, J.G.; Mahmood, Z. Determinants of Corporate Social Responsibility (CSR) Disclosure in Developed and Developing Countries: A Literature Review. Corp. Soc. Responsib. Environ. Manag. 2017, 24, 261–356. [Google Scholar] [CrossRef]
  19. Belal, A.R.; Owen, D.L. The views of corporate managers on the current state of, and future prospects for, social reporting in Bangladesh: An engagement–based study. Account. Audit. Account. J. 2007, 20, 472–494. [Google Scholar] [CrossRef]
  20. Ali, W.; Frynas, J.G. The Role of Normative CSR-Promoting Institutions in Stimulating CSR Disclosures in Developing Countries. Corp. Soc. Responsib. Environ. Manag. 2017. [Google Scholar] [CrossRef]
  21. Belal, A.R. A study of corporate social disclosures in Bangladesh. Manag. Audit. J. 2001, 16, 274–289. [Google Scholar] [CrossRef]
  22. Islam, M.A.; Deegan, C. Motivations for an organisation within a developing country to report social responsibility information. Account. Audit. Account. J. 2008, 21, 850–874. [Google Scholar] [CrossRef] [Green Version]
  23. Gray, R.; Kouhy, R.; Lavers, S. Corporate social and environmental reporting: A review of the literature and a longitudinal study of UK disclosure. Account. Audit. Account. J. 1995, 8, 47–77. [Google Scholar] [CrossRef]
  24. Fifka, M.S. Corporate Responsibility Reporting and its Determinants in Comparative Perspective—A Review of the Empirical Literature and a Meta-analysis. Bus. Strateg. Environ. 2013, 22, 1–35. [Google Scholar] [CrossRef]
  25. De Villiers, C.; van Staden, C.J. Can less environmental disclosure have a legitimising effect? Evidence from Africa. Account. Organ. Soc. 2006, 31, 763–781. [Google Scholar] [CrossRef]
  26. Mohd Ghazali, N.A. Ownership structure and corporate social responsibility disclosure: Some Malaysian evidence. Corp. Gov. 2007, 7, 251–266. [Google Scholar] [CrossRef]
  27. Kansal, M.; Joshi, M.; Batra, G.S. Determinants of corporate social responsibility disclosures: Evidence from India. Adv. Account. 2014, 30, 217–229. [Google Scholar] [CrossRef]
  28. Haji, A.A. Corporate social responsibility disclosures over time: Evidence from Malaysia. Manag. Audit. J. 2013, 28, 647–676. [Google Scholar] [CrossRef]
  29. Belal, A.R.; Momin, M. Corporate social reporting (CSR) in emerging economies: A review and future direction. Res. Account. Emerg. Econ. 2009, 9, 119–143. [Google Scholar]
  30. Haniffa, R.M.; Cooke, T.E. The impact of culture and governance on corporate social reporting. J. Account. Public Policy 2005, 24, 391–430. [Google Scholar] [CrossRef]
  31. Holder-Webb, L.; Cohen, J.R.; Nath, L.; Wood, D. The supply of corporate social responsibility disclosures among U.S. firms. J. Bus. Ethics 2009, 84, 497–527. [Google Scholar] [CrossRef]
  32. Ali, W. Corporate Social Responsibility Disclosure (CSRD): A Case Study of Pakistan. Ph.D. Thesis, Middlesex University, London, UK, 2014. [Google Scholar]
  33. Abu, B.A.; Ameer, R. Readability of corporate social responsibility communication in Malaysia. Corp. Soc. Responsib. Environ. Manag. 2011, 18, 50–60. [Google Scholar]
  34. Singh, D.R.; Ahuja, J.M. Corporate social reporting in India. Int. J. Account. 1983, 18, 151–169. [Google Scholar]
  35. Gul, S.; Muhammad, F.; Rashid, A. Corporate Governance and Corporate Social Responsibility: The Case of Small, Medium, and Large Firms. Pak. J. Commer. Soc. Sci. 2017, 11, 01–34. [Google Scholar]
  36. Wanderley, L.; Lucian, R.; Farache, F.; Sousa Filho, J. CSR information disclosure on the web: A context–based approach analysing the influence of country of origin and industry sector. J. Bus. Ethics 2008, 82, 369–378. [Google Scholar] [CrossRef]
  37. Williams, S.M. Voluntary environmental and social accounting disclosure practices in the Asia–Pacific region: An international empirical test of political economy theory. Int. J. Account. 1999, 34, 209–238. [Google Scholar] [CrossRef]
  38. Kamla, R. Critically Appreciating Social Accounting and Reporting in the Arab Middle East: A Postcolonial Perspective. Adv. Int. Account. 2007, 20, 105–177. [Google Scholar] [CrossRef]
  39. Teoh, H.Y.; Thong, G. Another look at corporate social responsibility and reporting: An empirical study in a developing country. Account. Organ. Soc. 1984, 9, 189–206. [Google Scholar] [CrossRef]
  40. Khan, A.; Muttakin, M.B.; Siddiqui, J. Corporate governance and corporate social responsibility disclosures: Evidence from an emerging economy. J. Bus. Ethics 2013, 114, 207–223. [Google Scholar] [CrossRef]
  41. Rahaman, A.S.; Lawrence, S.; Roper, J. Social and environmental reporting at the VRA: Institutionalised legitimacy or legitimation crisis? Crit. Perspect. Account. 2004, 15, 35–56. [Google Scholar] [CrossRef]
  42. Tsang, E.W. A longitudinal study of corporate social reporting in Singapore: The case of the banking, food and beverages and hotel industries. Account. Audit. Account. J. 1998, 11, 624–635. [Google Scholar] [CrossRef]
  43. Amran, A.; Devi, S.S. Corporate social reporting in Malaysia: A political theory perspective. Malays. Account. Rev. 2007, 6, 19–44. [Google Scholar]
  44. Momin, M.A.; Parker, L.D. Motivations for corporate social responsibility reporting by MNC subsidiaries in an emerging country: The case of Bangladesh. Br. Account. Rev. 2013, 45, 215–228. [Google Scholar] [CrossRef]
  45. Belal, A.R.; Cooper, S. The absence of corporate social responsibility reporting in Bangladesh. Crit. Perspect. Account. 2011, 22, 654–667. [Google Scholar] [CrossRef]
  46. Mitchell, C.G.; Hill, T. Corporate social and environmental reporting and the impact of internal environmental policy in South Africa. Corp. Soc. Responsib. Environ. Manag. 2009, 16, 48–60. [Google Scholar] [CrossRef]
  47. De Villiers, C.J. Why do South African companies not report more environmental information when managers are so positive about this kind of reporting? Meditari Account. Res. 2003, 11, 11–23. [Google Scholar] [CrossRef]
  48. Kuasirikun, N. Attitudes to the development and implementation of social and environmental accounting in Thailand. Crit. Perspect. Account. 2005, 16, 1035–1057. [Google Scholar] [CrossRef]
  49. Ali, W.; Sandhu, M.A.; Iqbal, J.; Tufail, M.S. Corporate Governance and CSR Disclosure: Evidence from a Developing Country. Pak. J. Soc. Sci. 2016, 36, 225–238. [Google Scholar]
  50. Khan, H.U.Z. The effect of corporate governance elements on corporate social responsibility (CSR) reporting: Empirical evidence from private commercial banks of Bangladesh. Int. J. Law Manag. 2010, 52, 82–109. [Google Scholar] [CrossRef]
  51. Hackston, D.; Milne, M.J. Some determinants of social and environmental disclosures in New Zealand companies. Account. Audit. Account. J. 1996, 9, 77–108. [Google Scholar] [CrossRef]
  52. Gray, R.; Owen, D.; Adams, C. Accounting & Accountability: Changes and Challenges in Corporate and Environmental Reporting; Prentice Hall: Hemel Hempstead, UK, 1996. [Google Scholar]
  53. Deegan, C.; Gordon, B. A study of the environmental disclosure practices of Australian corporations. Account. Bus. Res. 1996, 26, 187–199. [Google Scholar] [CrossRef]
  54. Guthrie, J.; Parker, L.D. Corporate social reporting: A rebuttal of legitimacy theory. Account. Bus. Res. 1989, 19, 343–352. [Google Scholar] [CrossRef]
  55. Patten, D.M. Intra–industry environmental disclosures in response to the Alaskan oil spill: A note on legitimacy theory. Account. Organ. Soc. 1992, 17, 471–475. [Google Scholar] [CrossRef]
  56. Campbell, J.L. Why would corporations behave in socially responsible ways? An institutional theory of corporate social responsibility. Acad. Manag. Rev. 2007, 32, 946–967. [Google Scholar] [CrossRef]
  57. Wang, H.; Qian, C. Corporate philanthropy and corporate financial performance: The roles of stakeholder response and political access. Acad. Manag. J. 2011, 54, 1159–1181. [Google Scholar] [CrossRef]
  58. Chauvey, J.N.; Giordano-Spring, S.; Cho, C.H.; Patten, D.M. The normativity and legitimacy of CSR disclosure: Evidence from France. J. Bus. Ethics 2015, 130, 789–803. [Google Scholar] [CrossRef]
  59. Dowling, J.; Pfeffer, J. Organizational legitimacy social values and organizational behaviour. Pac. Sociol. Rev. 1975, 18, 122–136. [Google Scholar] [CrossRef]
  60. Lindblom, C.K. The implications of organizational legitimacy for corporate social performance and disclosure. In Proceedings of the Critical Perspectives on Accounting Conference, New York, NY, USA, 1994. [Google Scholar]
  61. McMurtrie, T. Factors influencing the publication of social performance information: An Australian case study. Corp. Soc. Responsib. Environ. Manag. 2005, 12, 129–143. [Google Scholar] [CrossRef]
  62. Adams, C.A.; Hill, W.; Roberts, C.B. Corporate social reporting practices in Western Europe: Legitimating corporate behaviour? Br. Account. Rev. 1998, 30, 1–21. [Google Scholar] [CrossRef]
  63. Sotorrío, L.; Sánchez, J. Corporate social responsibility of the most highly reputed European and North American firms. J. Bus. Ethics 2008, 82, 379–390. [Google Scholar] [CrossRef]
  64. Adams, C.A. Internal organisational factors influencing corporate social and ethical reporting: Beyond current theorising. Account. Audit. Account. J. 2002, 15, 223–250. [Google Scholar] [CrossRef]
  65. Thijssens, T.; Bollen, L.; Hassink, H. Secondary stakeholder influence on CSR disclosure: An application of stakeholder salience theory. J. Bus. Ethics 2015, 132, 873–891. [Google Scholar] [CrossRef]
  66. Thompson, P.; Zakaria, Z. Corporate social responsibility reporting in Malaysia. J. Corp. Citizsh. 2004, 13, 125–136. [Google Scholar] [CrossRef]
  67. Haniffa, R.M.; Cooke, T.E. Culture, corporate governance and disclosure in Malaysian corporations. Abacus 2002, 38, 317–349. [Google Scholar] [CrossRef]
  68. Zulkifi, N.; Amran, A. Realising corporate social responsibility in Malaysia: A view from the accounting profession. J. Corp. Citizsh. 2006, 24, 101–114. [Google Scholar]
  69. Imam, S. Corporate social reporting in Bangladesh. Manag. Audit. J. 2000, 15, 133–141. [Google Scholar] [CrossRef]
  70. Habbash, M.; Habbash, M. Corporate governance and corporate social responsibility disclosure: Evidence from Saudi Arabia. Soc. Responsib. J. 2016, 12, 740–754. [Google Scholar] [CrossRef]
  71. SECP. Securities and Exchange Commission of Pakistan Annual Report 2011; Securities and Exchange Commission of Pakistan: Karachi, Pakistan, 2011. [Google Scholar]
  72. Bichta, C. Corporate socially responsible (CSR) practices in the context of Greek industry. Corp. Soc. Responsib. Environ. Manag. 2003, 10, 12–24. [Google Scholar] [CrossRef]
  73. Rahul, H. Corporate social responsibility—An Indian perspective. Adv. Manag. 2010, 3, 42–44. [Google Scholar]
  74. Sangle, S. Empirical analysis of determinants of adoption of proactive environmental strategies in India. Bus. Strateg. Environ. 2010, 19, 51–63. [Google Scholar] [CrossRef]
  75. Rettab, B.; Brik, A.; Mellahi, K. A study of management perceptions of the impact of corporate social responsibility on organisational performance in emerging economies: The case of Dubai. J. Bus. Ethics 2009, 89, 371–390. [Google Scholar] [CrossRef]
  76. Dyduch, J.; Krasodomska, J. Determinants of Corporate Social Responsibility Disclosure: An Empirical Study of Polish Listed Companies. Sustainability 2017, 9, 1934. [Google Scholar] [CrossRef]
  77. Newson, M.; Deegan, C. Global expectations and their association with corporate social disclosure practices in Australia, Singapore, and South Korea. Int. J. Account. 2002, 37, 183–213. [Google Scholar] [CrossRef]
  78. Perez–Batres, L.; Miller, V.V.; Pisani, M.J.; Henriques, I.; Renau-Sepulveda, J. Why do firms engage in national sustainability programs and transparent sustainability reporting? Manag. Int. Rev. 2012, 52, 107–136. [Google Scholar] [CrossRef]
  79. Sobhani, F.A.; Amran, A.; Zainuddin, Y. Revisiting the practices of corporate social and environmental disclosure in Bangladesh. Corp. Soc. Responsib. Environ. Manag. 2009, 16, 167–183. [Google Scholar] [CrossRef]
  80. Belal, A.; Owen, D.L. The rise and fall of stand–alone social reporting in a multinational subsidiary in Bangladesh: A case study. Account. Audit. Account. J. 2015, 28, 1160–1192. [Google Scholar] [CrossRef]
  81. Famiola, M.; Adiwoso, S.A. Corporate social responsibility diffusion by multinational subsidiaries in Indonesia: Organisational dynamic and institutional effect. Soc. Responsib. J. 2016, 12, 117–129. [Google Scholar] [CrossRef]
  82. Da Silva Monteiro, S.M.; Aibar-Guzmán, B. Determinants of environmental disclosure in the annual reports of large companies operating in Portugal. Corp. Soc. Responsib. Environ. Manag. 2010, 17, 185–204. [Google Scholar] [CrossRef]
  83. Belkaoui, A.; Karpik, P.G. Determinants of the corporate decision to disclose social information. Account. Audit. Account. J. 1989, 2, 36–51. [Google Scholar] [CrossRef]
  84. Abbott, W.F.; Monsen, R.J. On the measurement of corporate social responsibility: Self–reported disclosures as a method of measuring corporate social involvement. Acad. Manag. J. 1979, 22, 501–515. [Google Scholar] [CrossRef]
  85. Milne, M.J.; Adler, R.W. Exploring the reliability of social and environmental disclosures content analysis. Account. Audit. Account. J. 1999, 12, 237–256. [Google Scholar] [CrossRef]
  86. Bouten, L.; Everaert, P.; Van Liedekerke, L.; De Moor, L.; Christiaens, J. Corporate social responsibility reporting: A comprehensive picture? Account. Forum 2011, 35, 187–204. [Google Scholar] [CrossRef]
  87. Cormier, D.; Magnan, M.; Van Velthoven, B. Environmental disclosure quality in large German companies: Economic incentives, public pressures or institutional conditions? Eur. Account. Rev. 2005, 14, 3–39. [Google Scholar] [CrossRef]
  88. Gray, R.; Kouhy, R.; Lavers, S. Constructing a research database of social and environmental reporting by UK companies. Account. Audit. Account. J. 1995, 8, 78–101. [Google Scholar] [CrossRef]
  89. Hou, J.; Reber, B.H. Dimensions of disclosures: Corporate social responsibility (CSR) reporting by media companies. Public Relat. Rev. 2011, 37, 166–168. [Google Scholar] [CrossRef]
  90. Zeghal, D.; Ahmed, S.A. Comparison of social responsibility information disclosure media used by Canadian firms. Account. Audit. Account. J. 1990, 3, 38–53. [Google Scholar] [CrossRef]
  91. CSR Order. Companies (Corporate Social Responsibility) General Order; Securities and Exchange Commission of Pakistan: Karachi, Pakistan, 2009. [Google Scholar]
  92. Vuontisjärvi, T. Corporate social reporting in the European context and human resource disclosures: An analysis of Finnish companies. J. Bus. Ethics 2006, 69, 331–354. [Google Scholar] [CrossRef]
  93. Hasseldine, J.; Salama, A.I.; Toms, J.S. Quantity versus quality: The impact of environmental disclosures on the reputations of UK Plcs. Br. Account. Rev. 2005, 37, 231–248. [Google Scholar] [CrossRef] [Green Version]
  94. Rahman, A.A.; Md-Hashim, M.F.A.; Abu-Bakar, F. Corporate social reporting: A preliminary study of Bank Islam Malaysia Berhad (BIMB). Issues Soc. Environ. Account. 2010, 4, 18–39. [Google Scholar] [CrossRef]
  95. Cormier, D.; Magnan, M. Corporate environmental disclosure strategies: Determinants, costs and benefits. J. Account. Audit. Financ. 1999, 14, 429–451. [Google Scholar] [CrossRef]
  96. Patten, D.M. The relation between environmental performance and environmental disclosure: A research note. Account. Organ. Soc. 2002, 27, 763–773. [Google Scholar] [CrossRef]
  97. Li, F.; Li, T.; Minor, D. A Test of Agency Theory: CEO Power, Firm Value, and Corporate Social Responsibility. Int. J. Manag. Financ. 2016, 12, 611–628. [Google Scholar] [CrossRef]
  98. Coles, J.L.; Daniel, N.D.; Naveen, L. Managerial incentives and risk–taking. J. Financ. Econ. 2006, 79, 431–468. [Google Scholar] [CrossRef]
Figure 1. Theoretical Model.
Sustainability 10 00866 g001
Figure 2. CSR Disclosure (Quantity)—Regression analysis assumptions. (a) Analysis of standardized Residuals; (b) Residual histogram.
Sustainability 10 00866 g002
Table 1. Social Visibility Variables.
Social Visibility Variables
VariablesMeasurement (References)
Company SizeTotal assets [30,67,87,95]
Corporate ProfitabilityReturn on assets [1,3,5,11,83]
Industry sensitivity:1—A company operating in an industry having SIC code 06XX, 12XX, 10XX, 13XX, 19XX, 17XX, 20XX,21XX, 22XX, 23XX, 24XX, 29XX, 27XX, 35Xx, 41XX, 51XX, 49XX, and 50XX
0—Otherwise [1,82,96]
Multinational Subsidiaries1 is assigned to company which is a subsidiary of a multinational and 0 if otherwise [82]
Control Variables
LeverageTotal debts divided by total assets [1,67,83]
Table 2. Descriptive Statistics for the independent and dependent variables.
VariablesMinimumMaximumMeanStd. Deviation
CSR disclosure (extent)-CSRD0067245.0373.90
Profitability (ROA)−45.25%44.25%3.30%10.27%
Company Size (0.000)-CS 11,263.001,153,480,10030,682,678.4201.0399E8
Dummy Variables %age
Environmental Sensitivity-ES0.001.0034.8%
Multinational Subsidiary-MNSs0.001.0014.2%
N = 253
Table 3. Spearman’s rho Correlations.
NTCSRDQnNCSNROAESMNNsNCDummy
NTCSRDQn1.000
NCS0.339 **1.000
NROA0.229 **−0.0261.000
ES0.355 **0.208 **0.147 *1.000
MNNs0.331 **0.219 **0.203 **0.215 **1.000
NC0.0580.269 **−0.315 **−0.039−0.0751.000
Dummy−0.0050.001−0.0070.000−0.012−0.003
NCS = Normal Score of Company Size, NROA = Normal Score of ROA, NC = Normal Score of leverage ratio, ES = Environmental sensitivity, MNNs = Multinationals Subsidiaries, NCSRDQn = Normal Score of CSR Disclosure Extent, * p < 0.1, ** p < 0.05, N = 253.
Table 4. Determinants of the extent of CSR disclosure.
VariablesPredictionModel 1
Experimental Model
Model 2
Control Model
Model 3
Full Model
Decision
Social Visibility Variables
NCS+Ve0.255 ***
(0.052)
0.233 ***
(0.054)
Accepted
NROA+Ve0.161 ***
(0.052)
0.182 ***
(0.054)
Accepted
ES+Ve0.246 ***
(0.108)
0.246 ***
(0.108)
Accepted
MNNs+Ve0.225 ***
(0.147)
0.230 ***
(0.147)
Accepted
Control Variables
NC 0.074
(0.061)
0.081
(0.056)
Dummy 0.008
(0.117)
0.013
(0.099)
(Constant) −0.234 ***
(0.083)
0.027
(0.085)
−0.236 ***
(0.083)
N 253253253
F-Value (Sig. Value) 20.969 (0.000)0.694 (0.500)17.878 (0.000)
Adjusted R2 28.7%0.6%28.7%
Tolerance Values 0.913–0.9991.000–1.0000.870–0.999
VIF Values 1.001–1.0951.000–1.0001.001–1.149
Durbin-Watson 2.1792.1442.146
Standardized Beta for Regression Coefficient, Standard errors are parentheses, NCS = Normal Score of Company Size, NROA = Normal Score of ROA, NC = Normal Score of leverage ratio, ES = Environmental sensitivity, MNNs = Multinationals Subsidiaries, NCSRDQn = Normal Score of CSR Disclosure Extent, *** p < 0.01.
Table 5. Multivariate regression analysis results for the year 2008.
PredictionModel 1
Experimental Model
Model 2
Control Model
Model 3
Full Model
Decision
Social Visibility Variables
NCS+Ve0.193 **
(0.078)
0.168 **
(0.080)
Accepted
NROA+Ve0.190 **
(0.080)
0.203 **
(0.080)
Accepted
ES+Ve0.246 ***
(0.162)
0.253 ***
(0.162)
Accepted
MNNs+Ve0.799
(0.218)
0.217
(0.218)
Control Variable
NC 0.082
(0.088)
0.107
(0.079)
(Constant) −0.226 **
(0.096)
0.027
(0.085)
−0.233 **
(0.095)
N 119119119
F-Value (Sig. Value) 10.857 (0.000)0.799 (0.373)9.075 (0.000)
Adjusted R2 25%0.7%25.5%
Tolerance Values 0.892–0.9421.0000.887–0.931
VIF Values 1.062–1.1211.0001.074–1.127
Durbin-Watson 2.1062.1802.076
Standardized Beta for Regression Coefficient, Standard errors are parentheses, NCS = Normal Score of Company Size, NROA = Normal Score of ROA, NC = Normal Score of leverage ratio, ES = Environmental sensitivity, MNNs: Multinationals Subsidiaries, NCSRDQn = Normal Score of CSR Disclosure Extent, ** p < 0.05, *** p < 0.01.
Table 6. Multivariate regression analysis results for the year 2011.
VariablesPredictionModel 1
Experimental Model
Model 2
Control Model
Model 3
Full Model
Decision
Social Visibility Variables
NCS+Ve0.308 ***
(0.071)
0.295 ***
(0.075)
Accepted
NROA+Ve0.142 *
(0.069)
0.159 *
(0.076)
Accepted
ES+Ve0.244 ***
(0.147)
0.242 ***
(0.147)
Accepted
MNNs+Ve0.238 ***
(0.202)
0.241 ***
(0.203)
Accepted
Control Variable
NL 0.066
(0.086)
0.043
(0.083)
(Constant) −0.218 **
(0.086)
0.043
(0.080)
−0.217 **
(0.086)
N 134134134
F-Value (Sig. Value) 15.587 (0.000)0.582 (0.447)12.452(0.000)
Adjusted R2 30.5%0.3%31.1%
Tolerance Values 0.918–0.9631.0000.752–0.933
VIF Values 1.039–1.0901.0001.072–1.330
Durbin-Watson 2.2092.1132.190
Standardized Beta for Regression Coefficient, Standard errors are parentheses, NCS = Normal Score of Company Size, NROA = Normal Score of ROA, NL = Normal Score of leverage ratio, ES = Environmental sensitivity, MNNs = Multinationals Subsidiaries, NCSRDQn = Normal Score of CSR Disclosure Extent, * p < 0.1, ** p < 0.05, *** p < 0.01.

