A Dynamic Analysis to Evaluate the Environmental Performance of Cities in China

Abstract
1. Introduction
2. Methodology
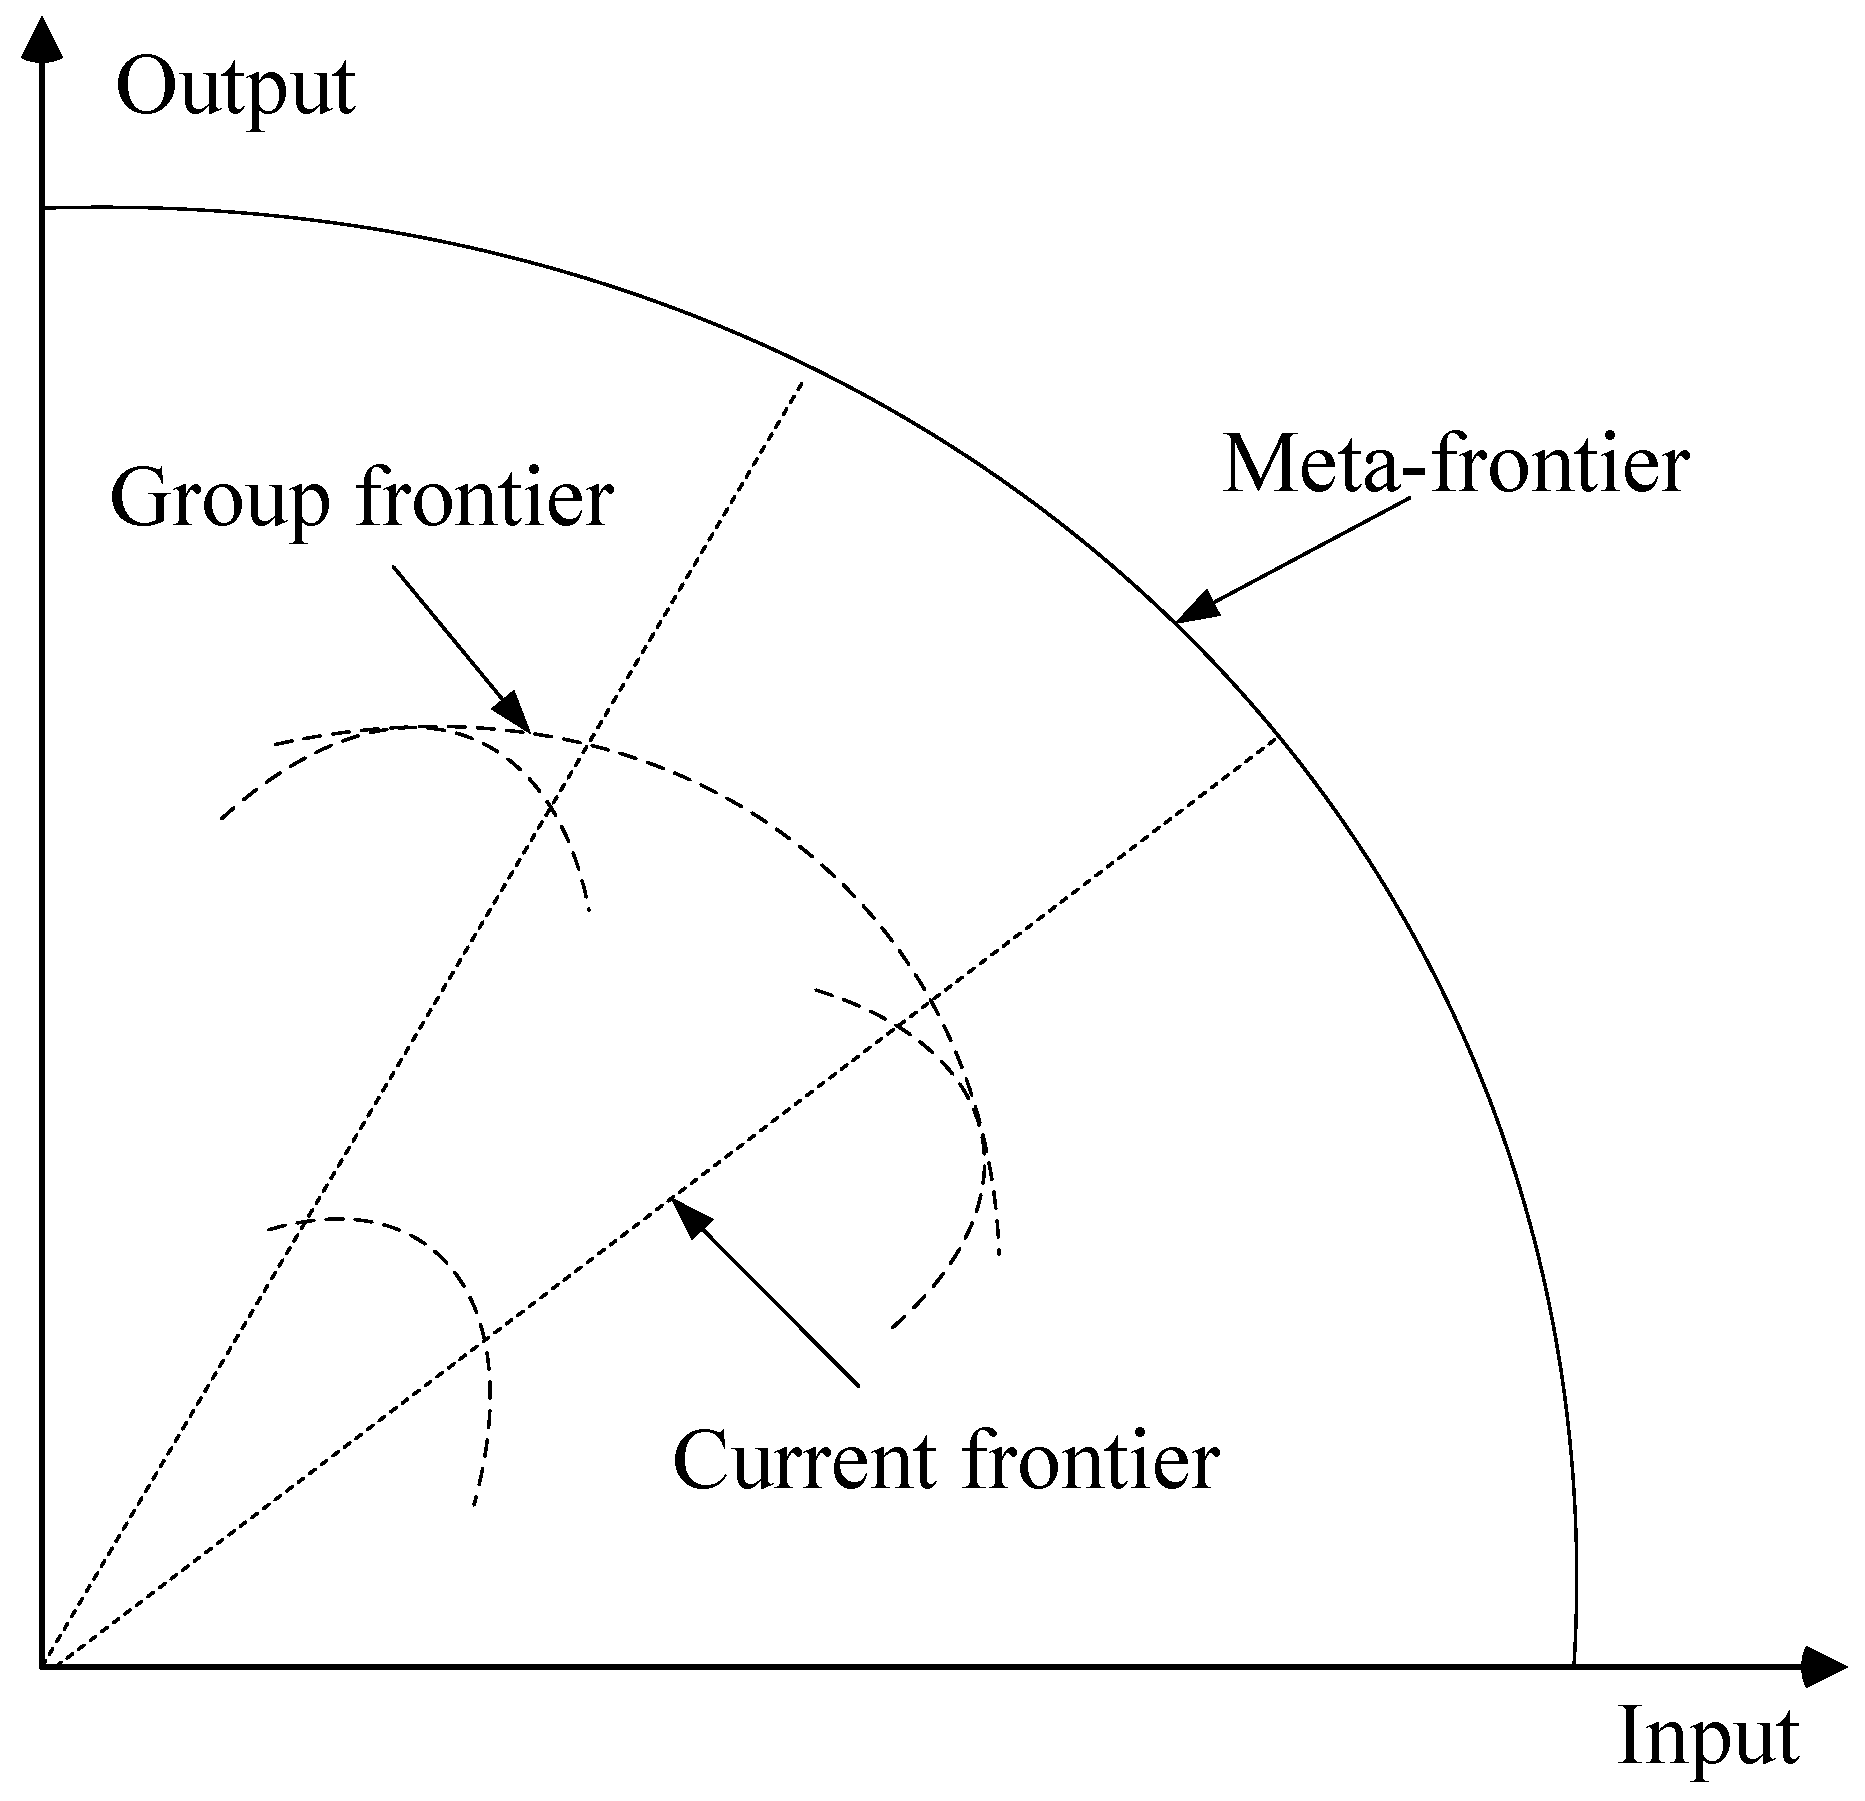
2.1. Production Possibility Set
2.2. Malmquist-Luenberger Index
3. Empirical Results
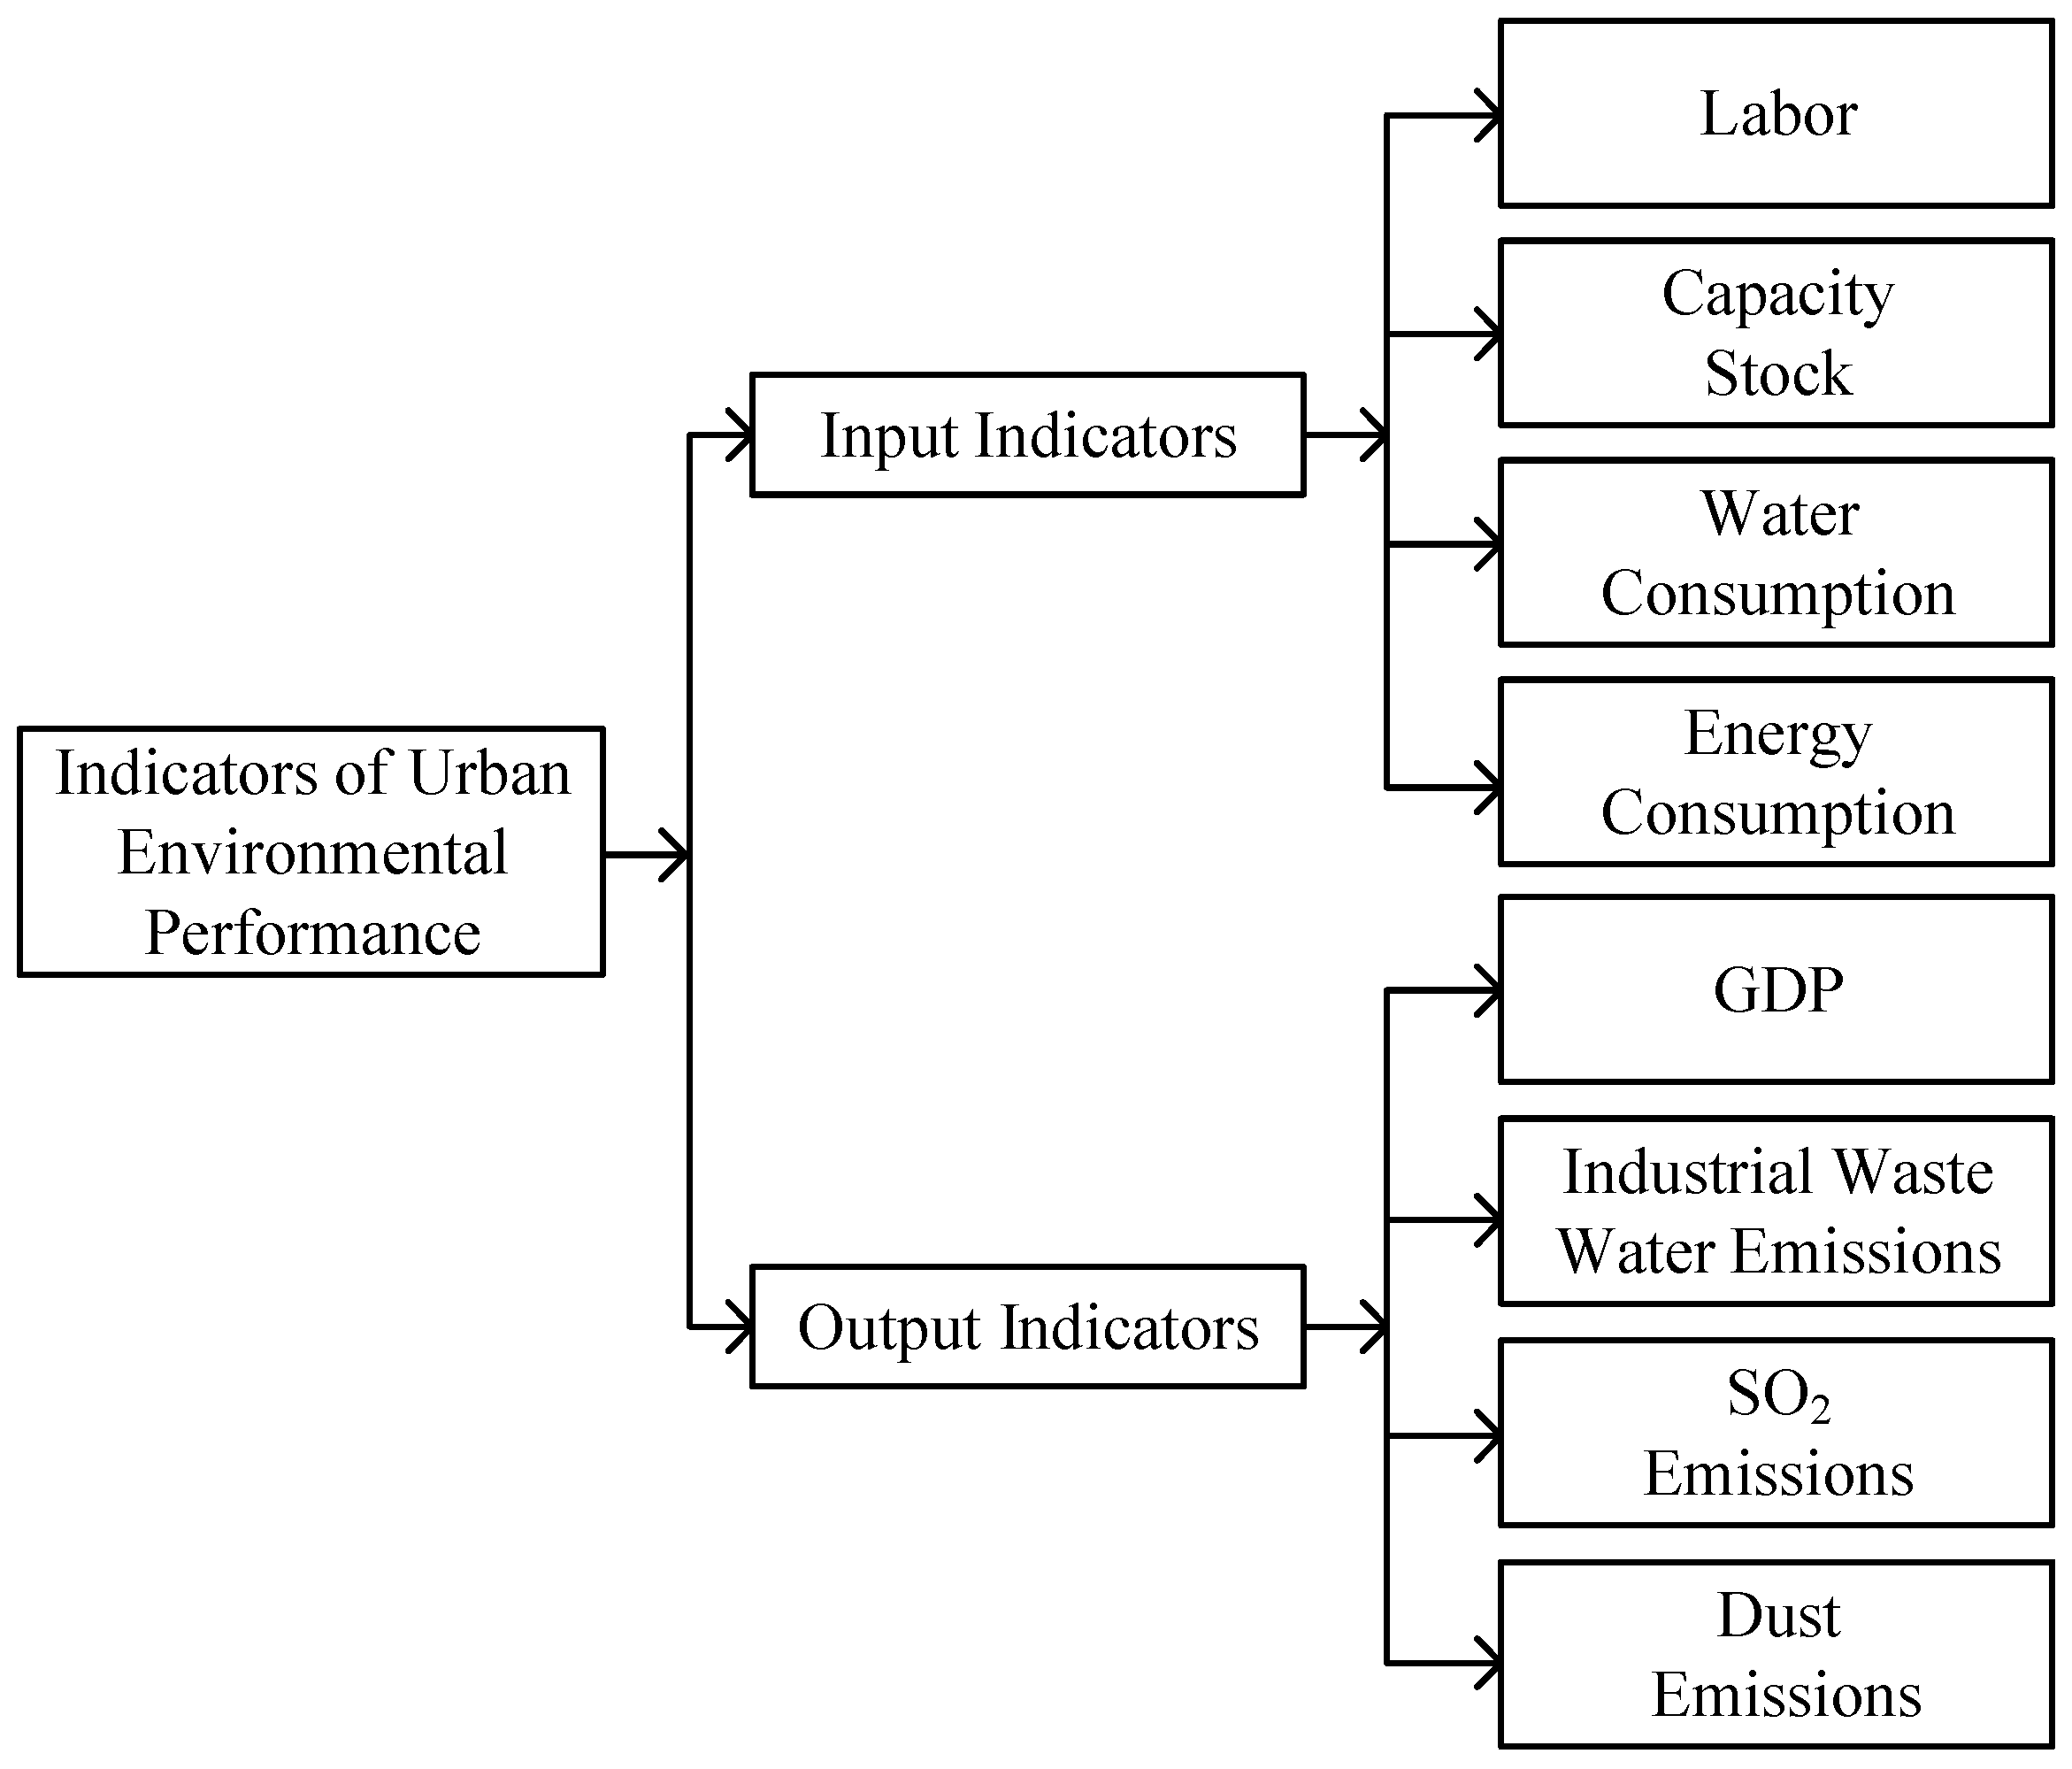
3.1. Data and Sources
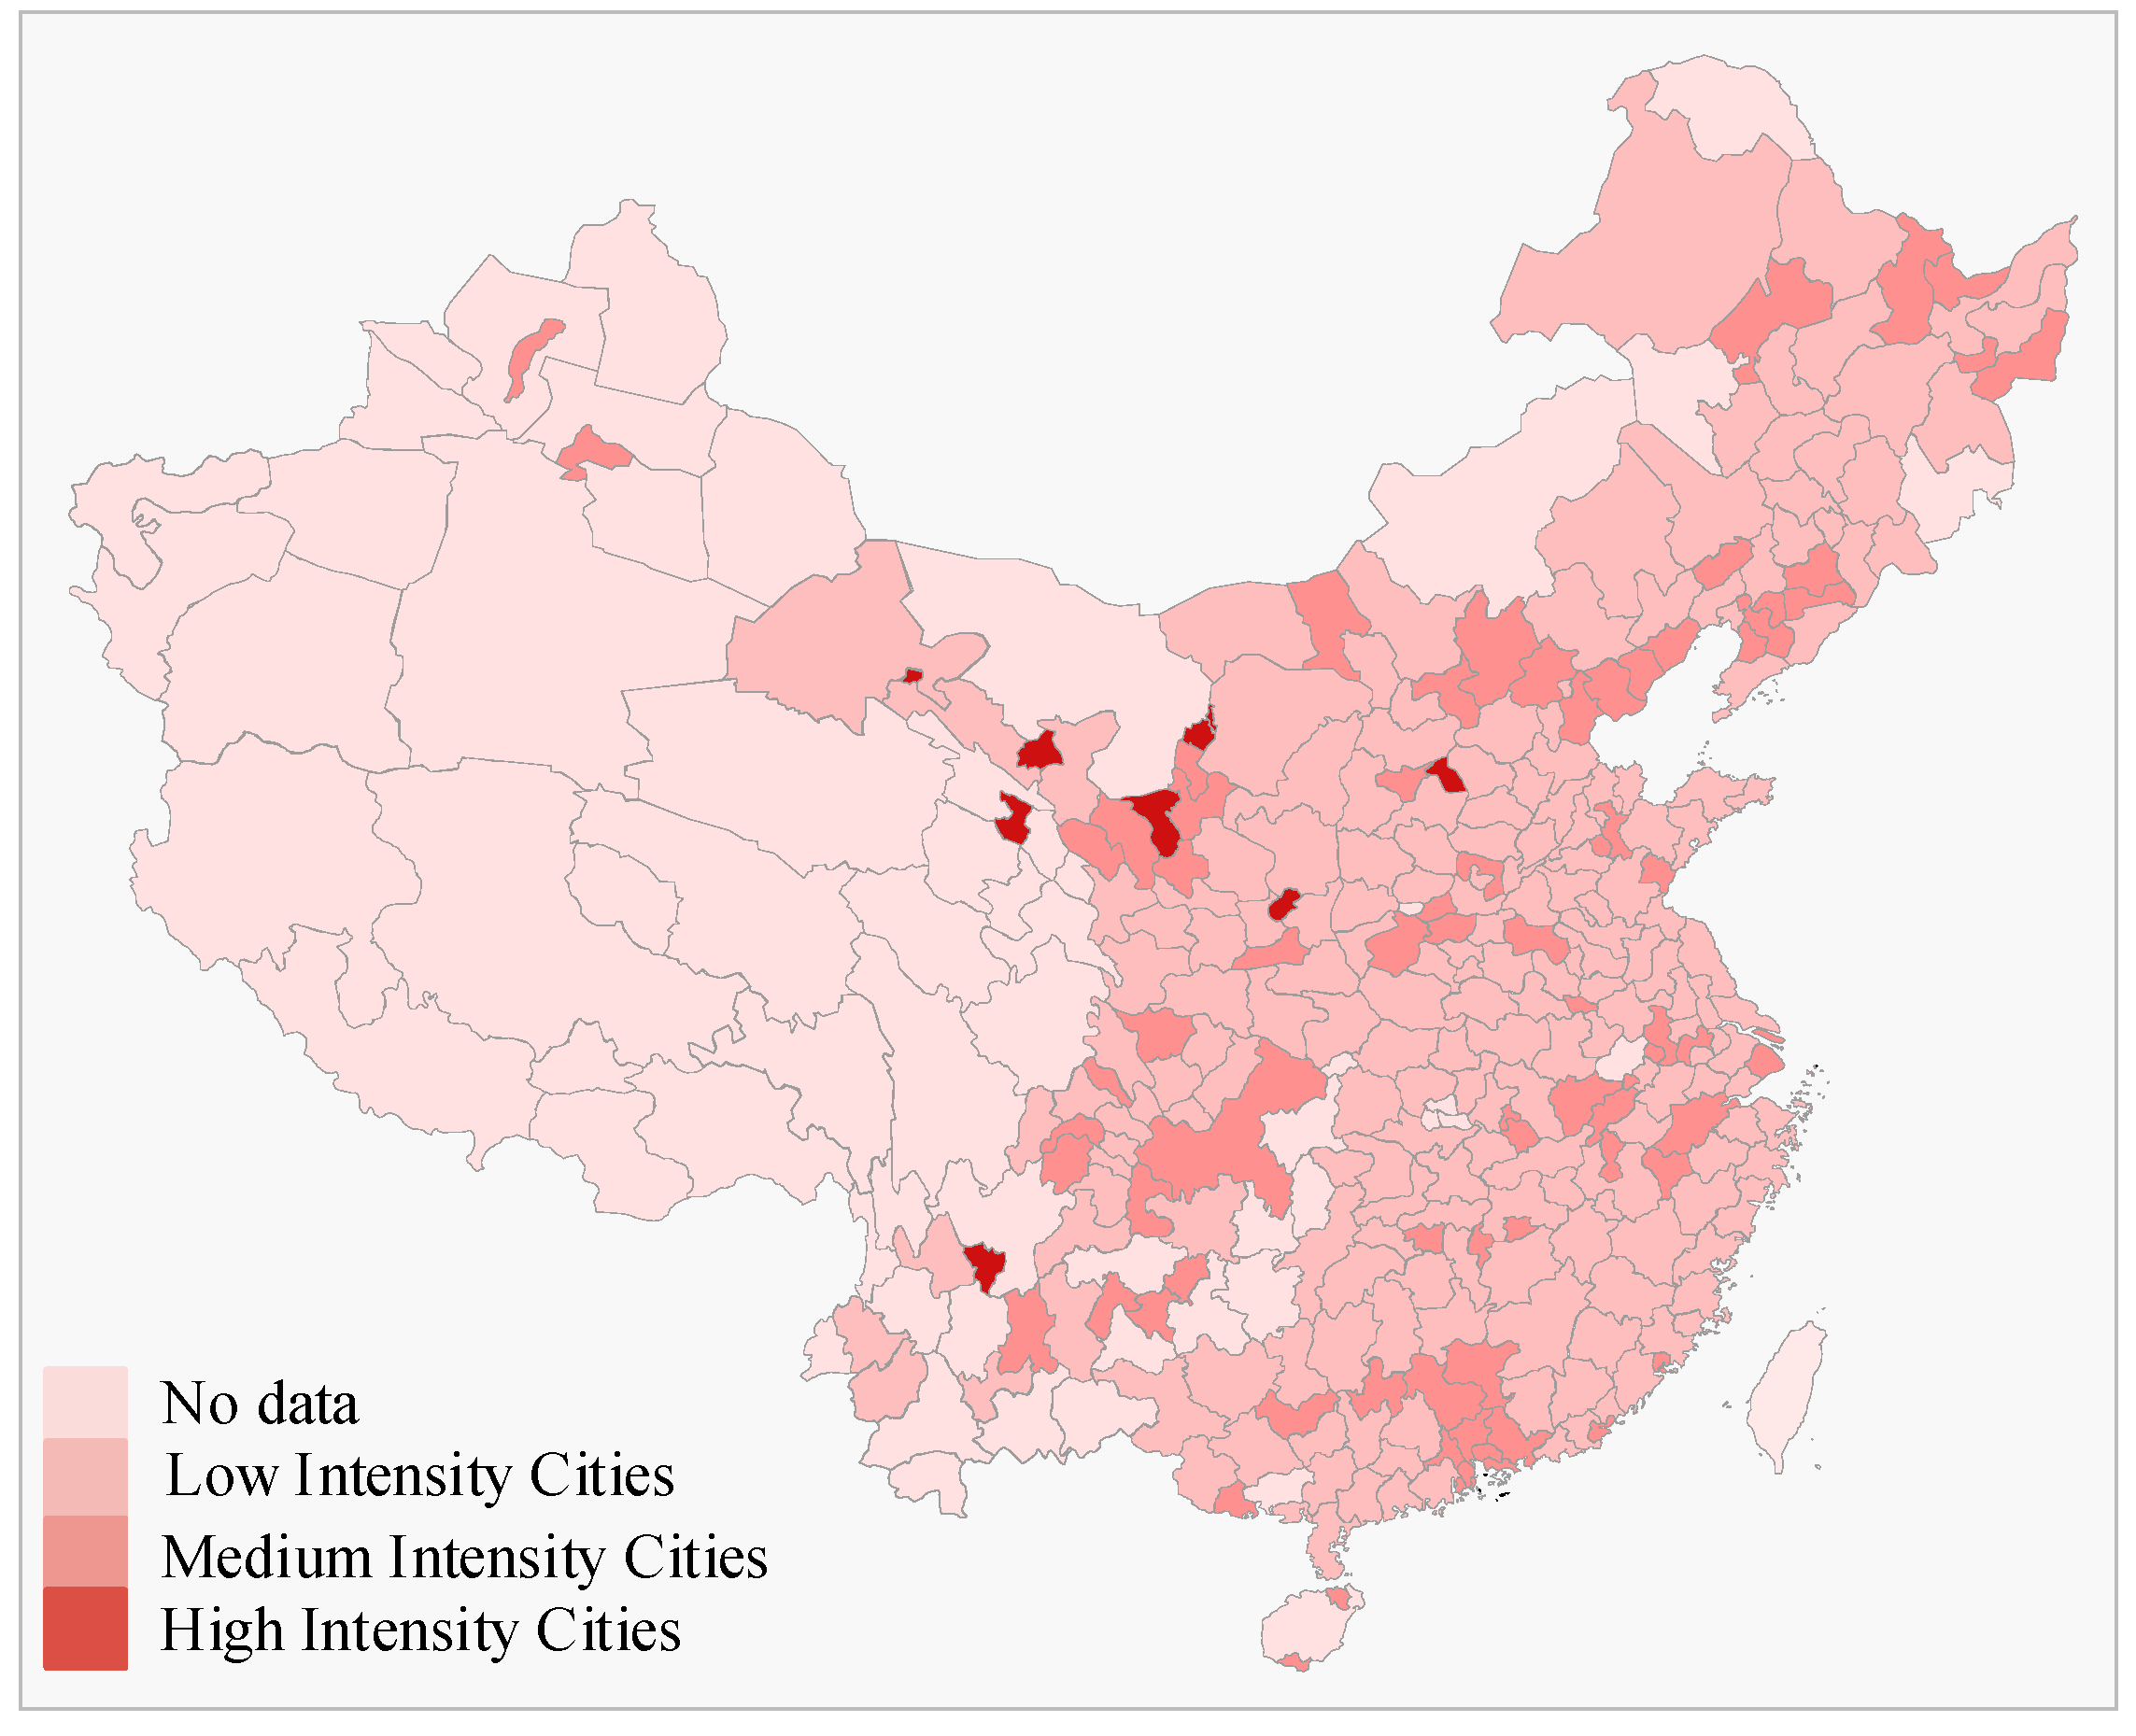
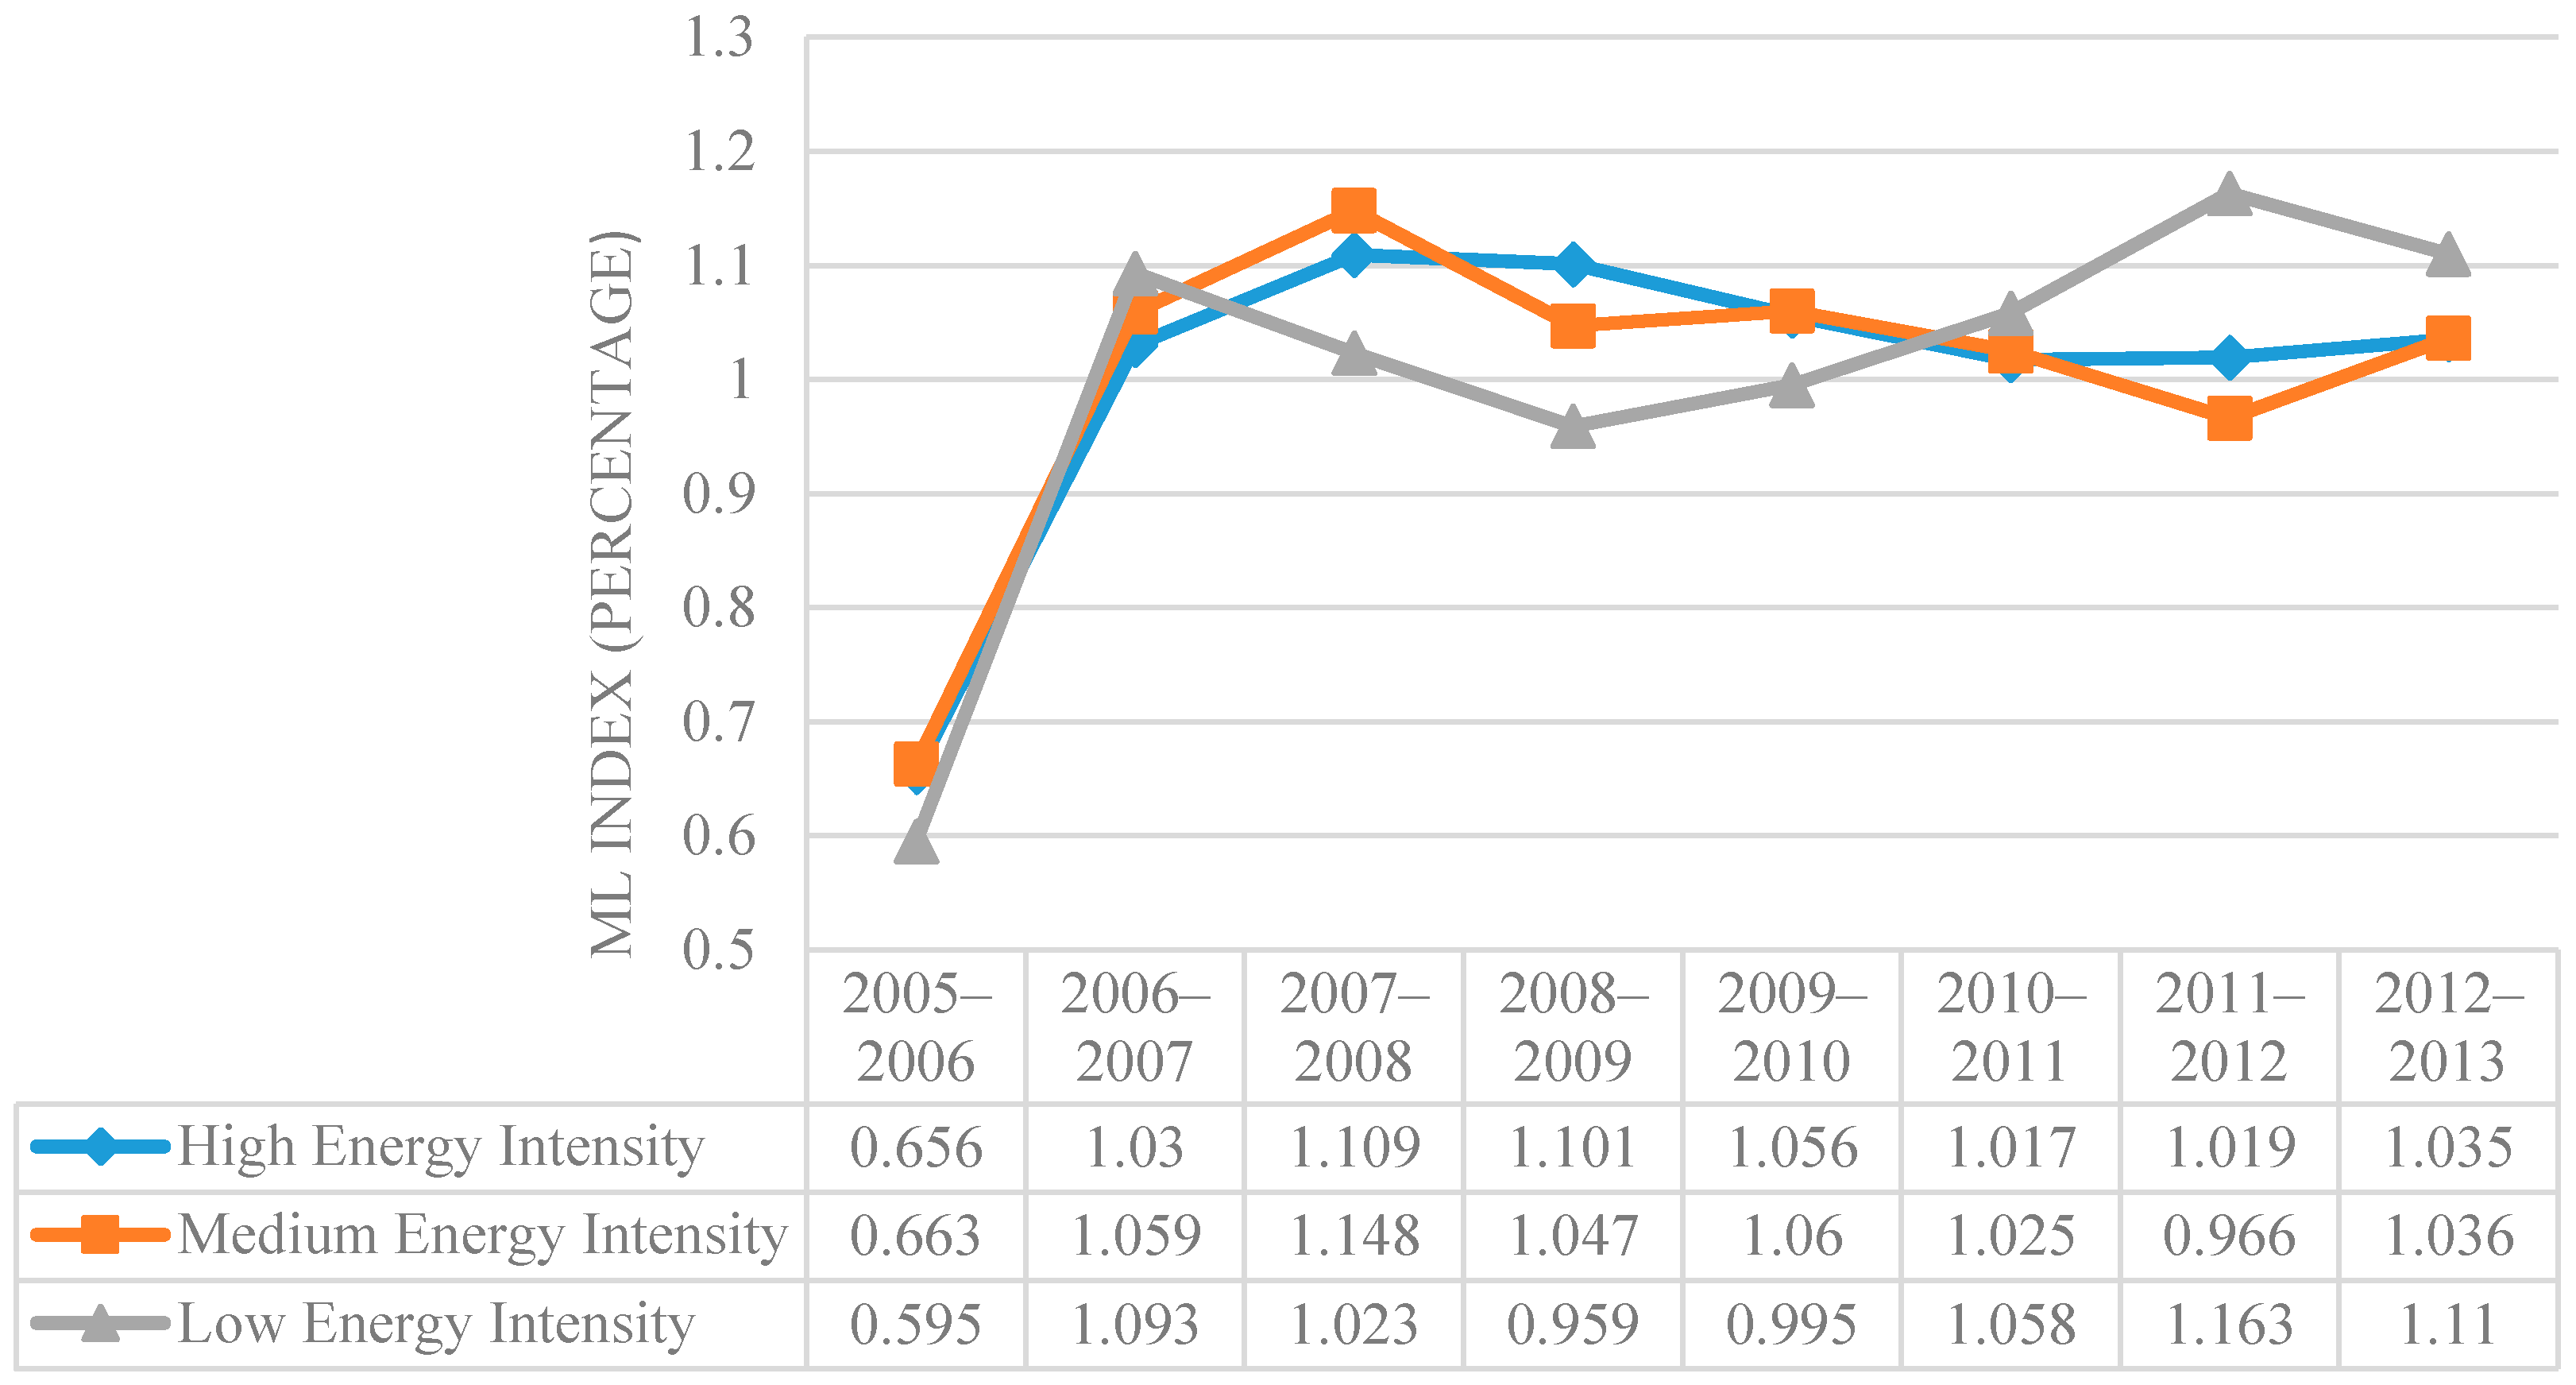
3.2. Environmental Performance under the Meta-Frontier
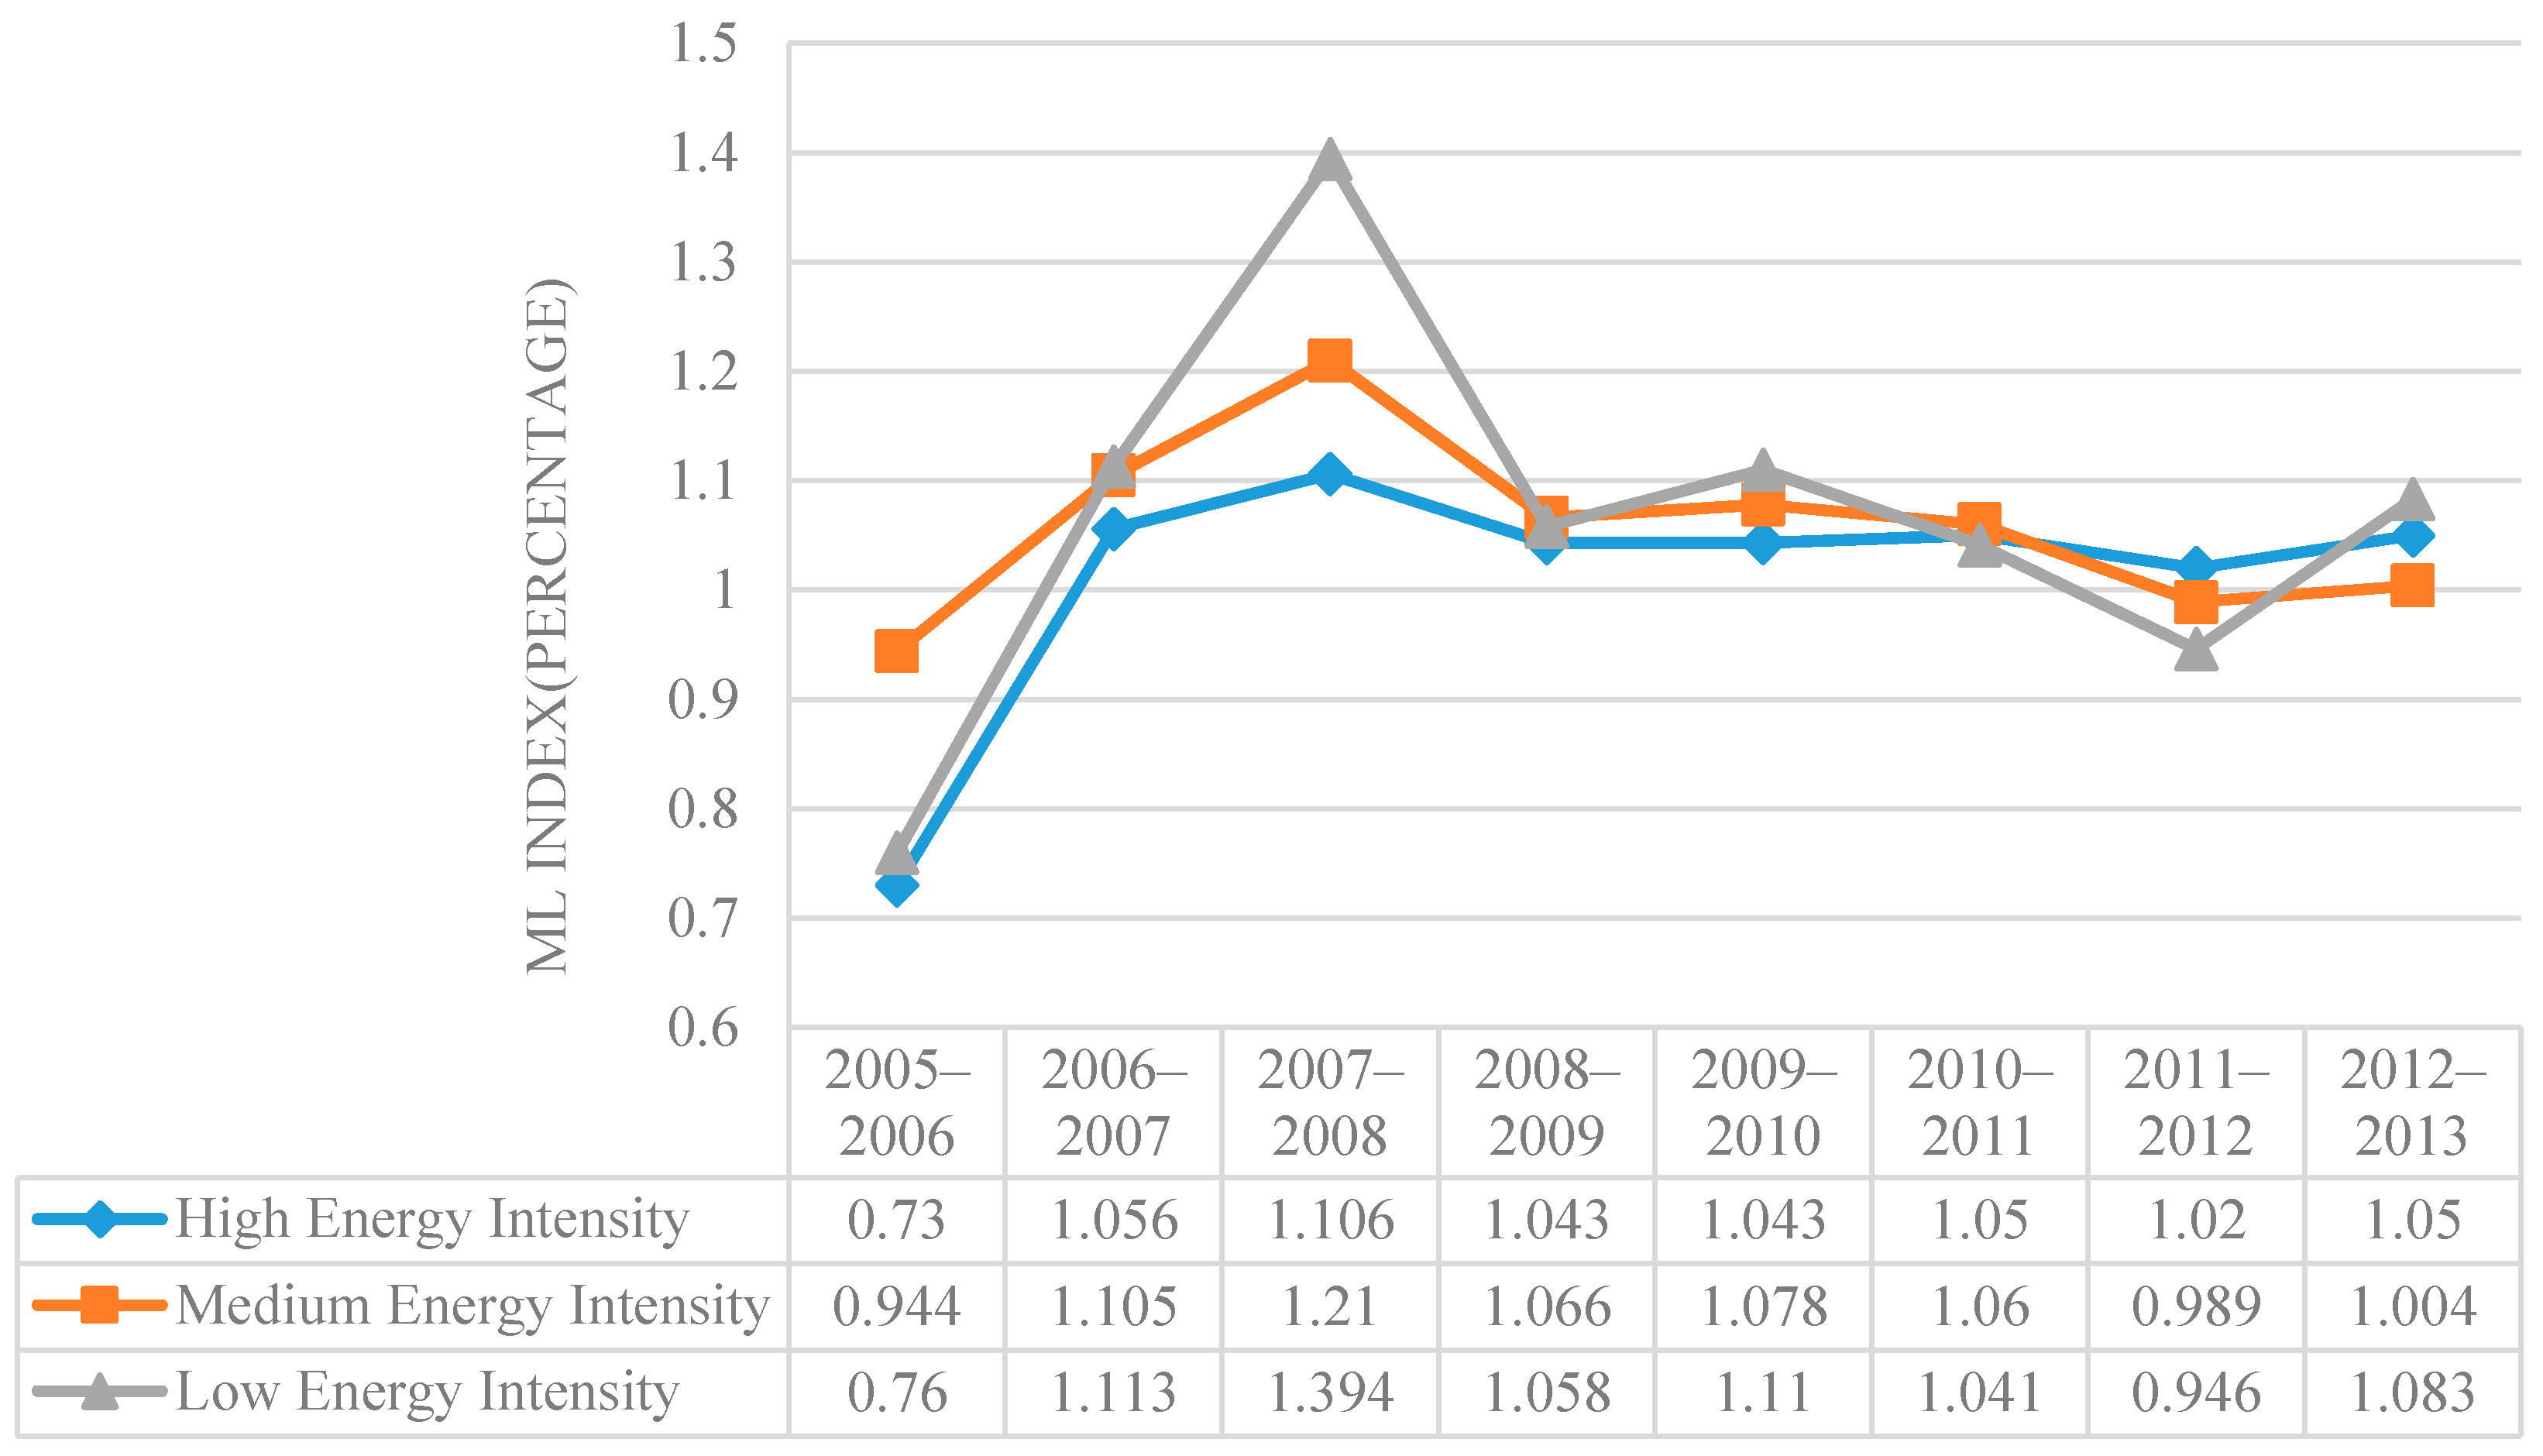
3.3. Environmental Performance under the Group Frontier
3.4. Comparison between Different Frontiers
3.5. Comparison between the ML Index and GDP
4. Discussions
- (1)
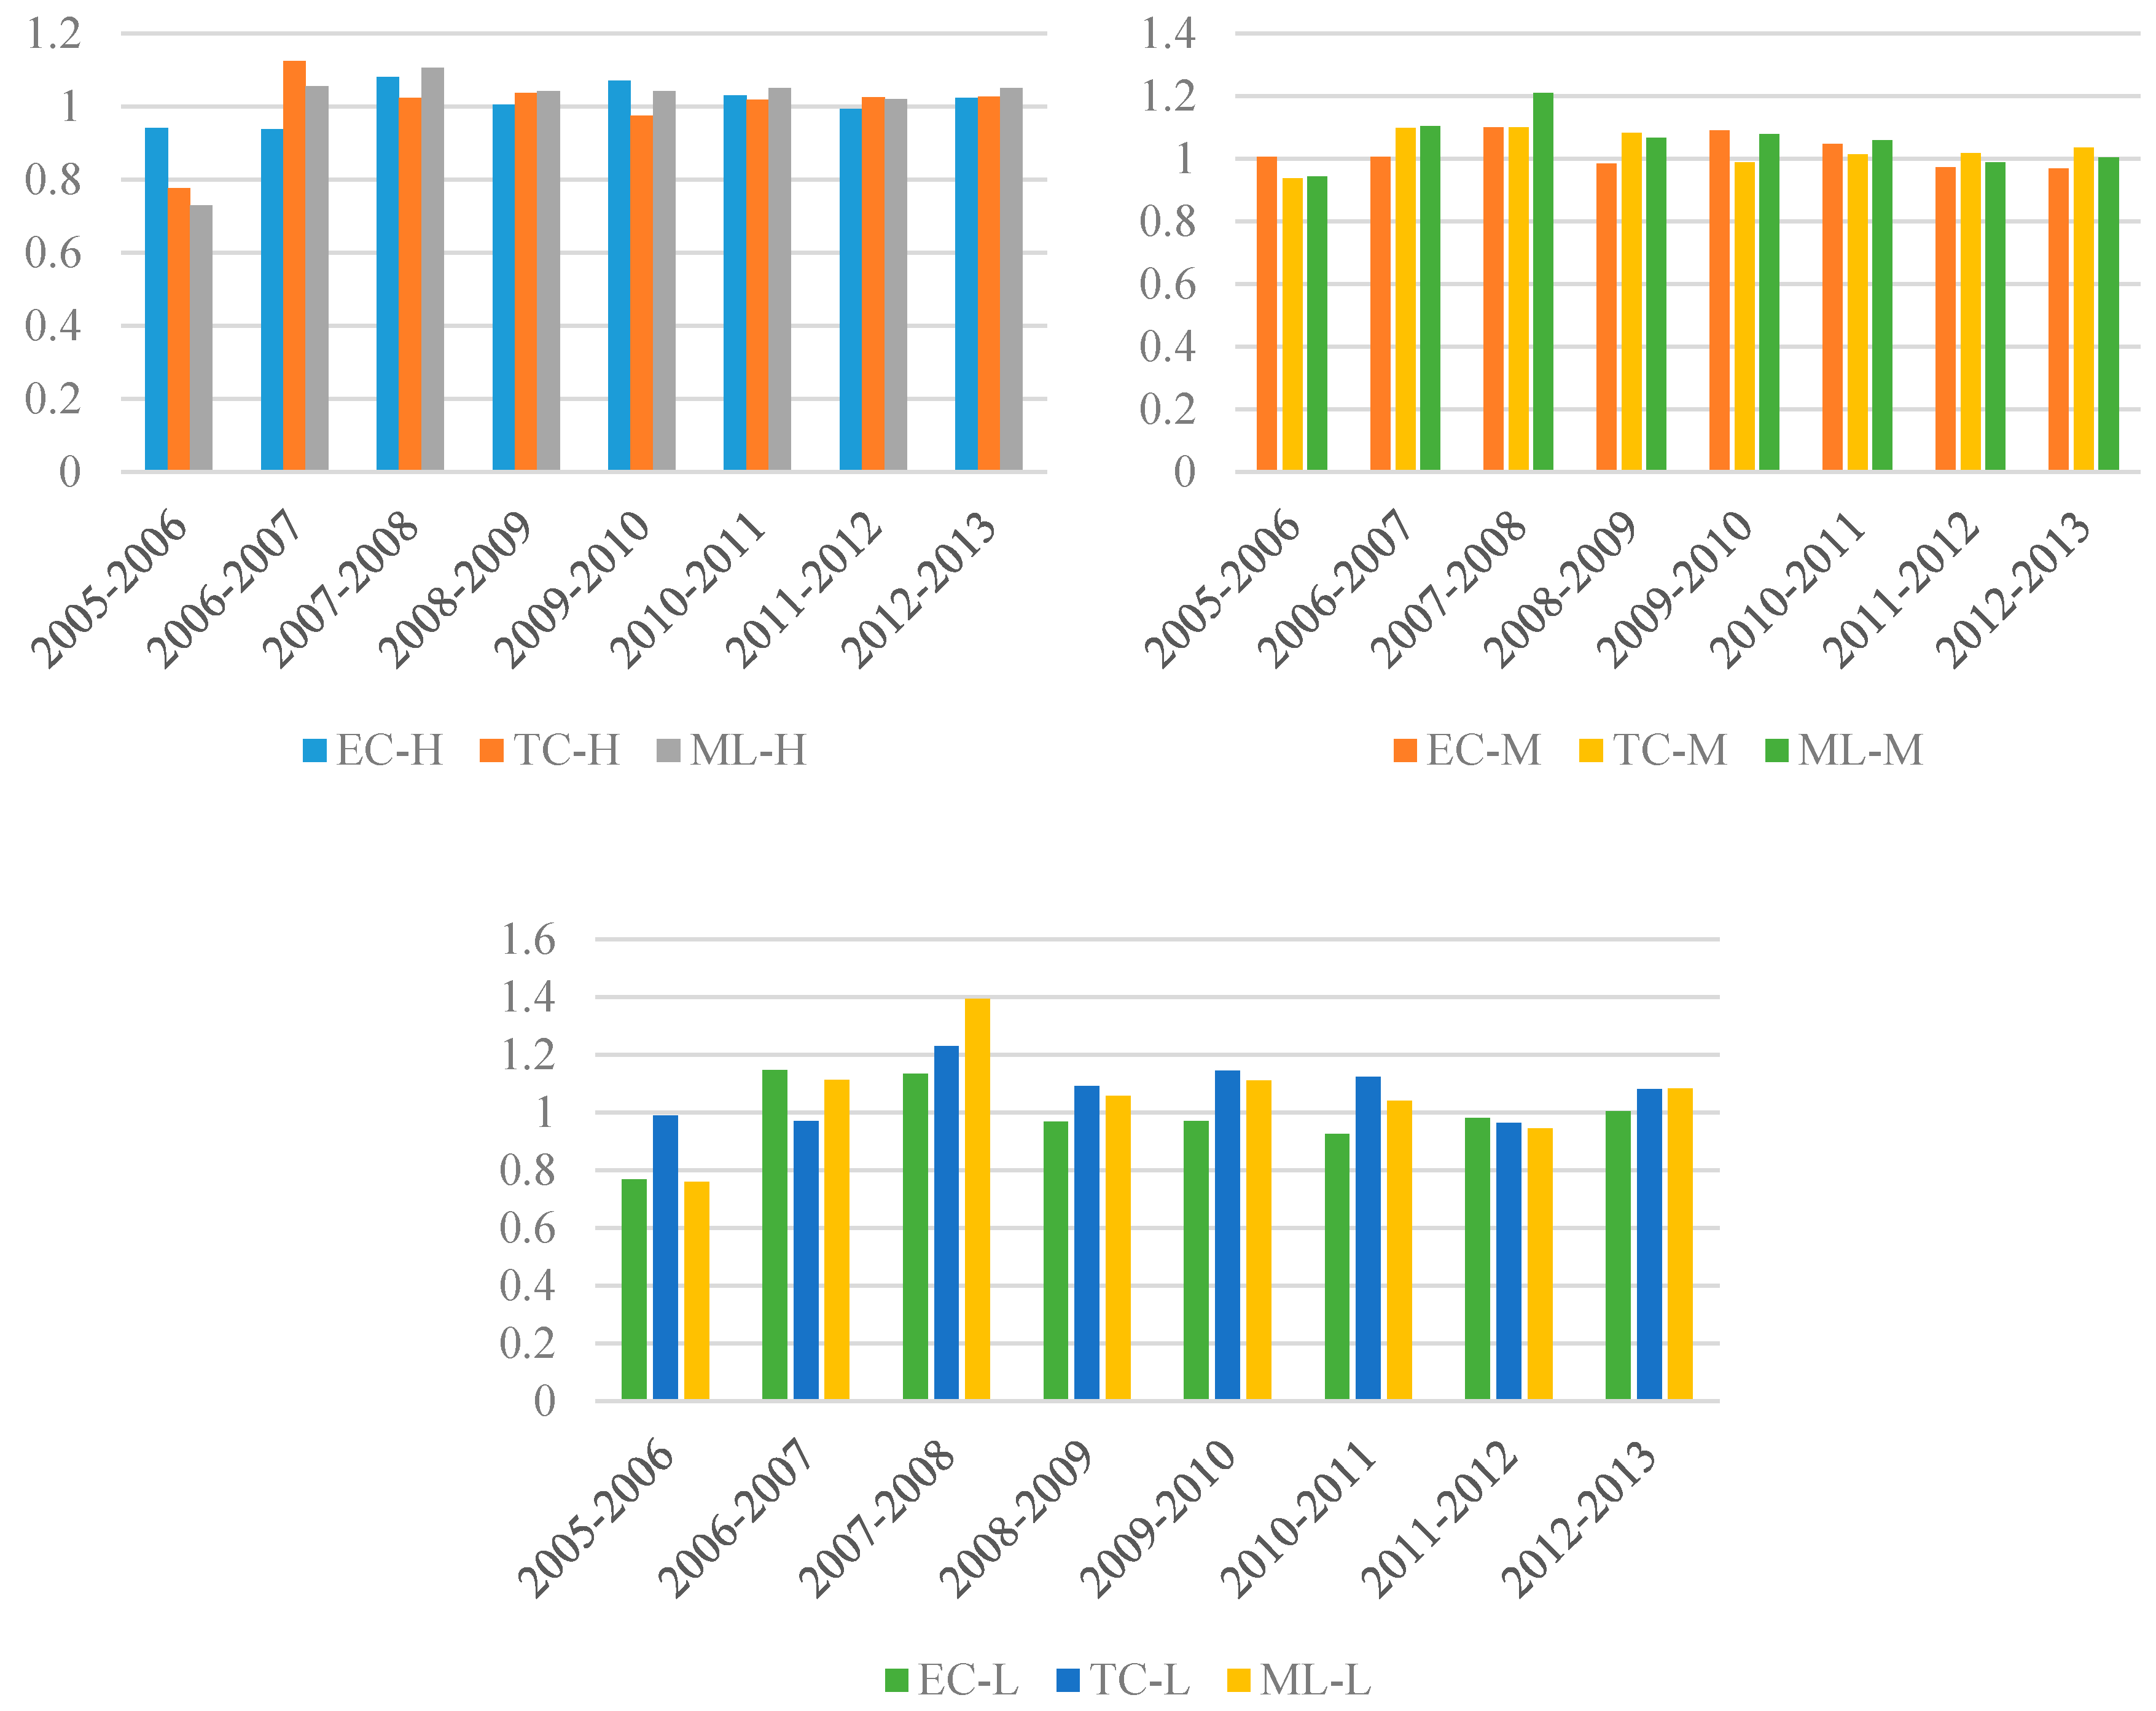
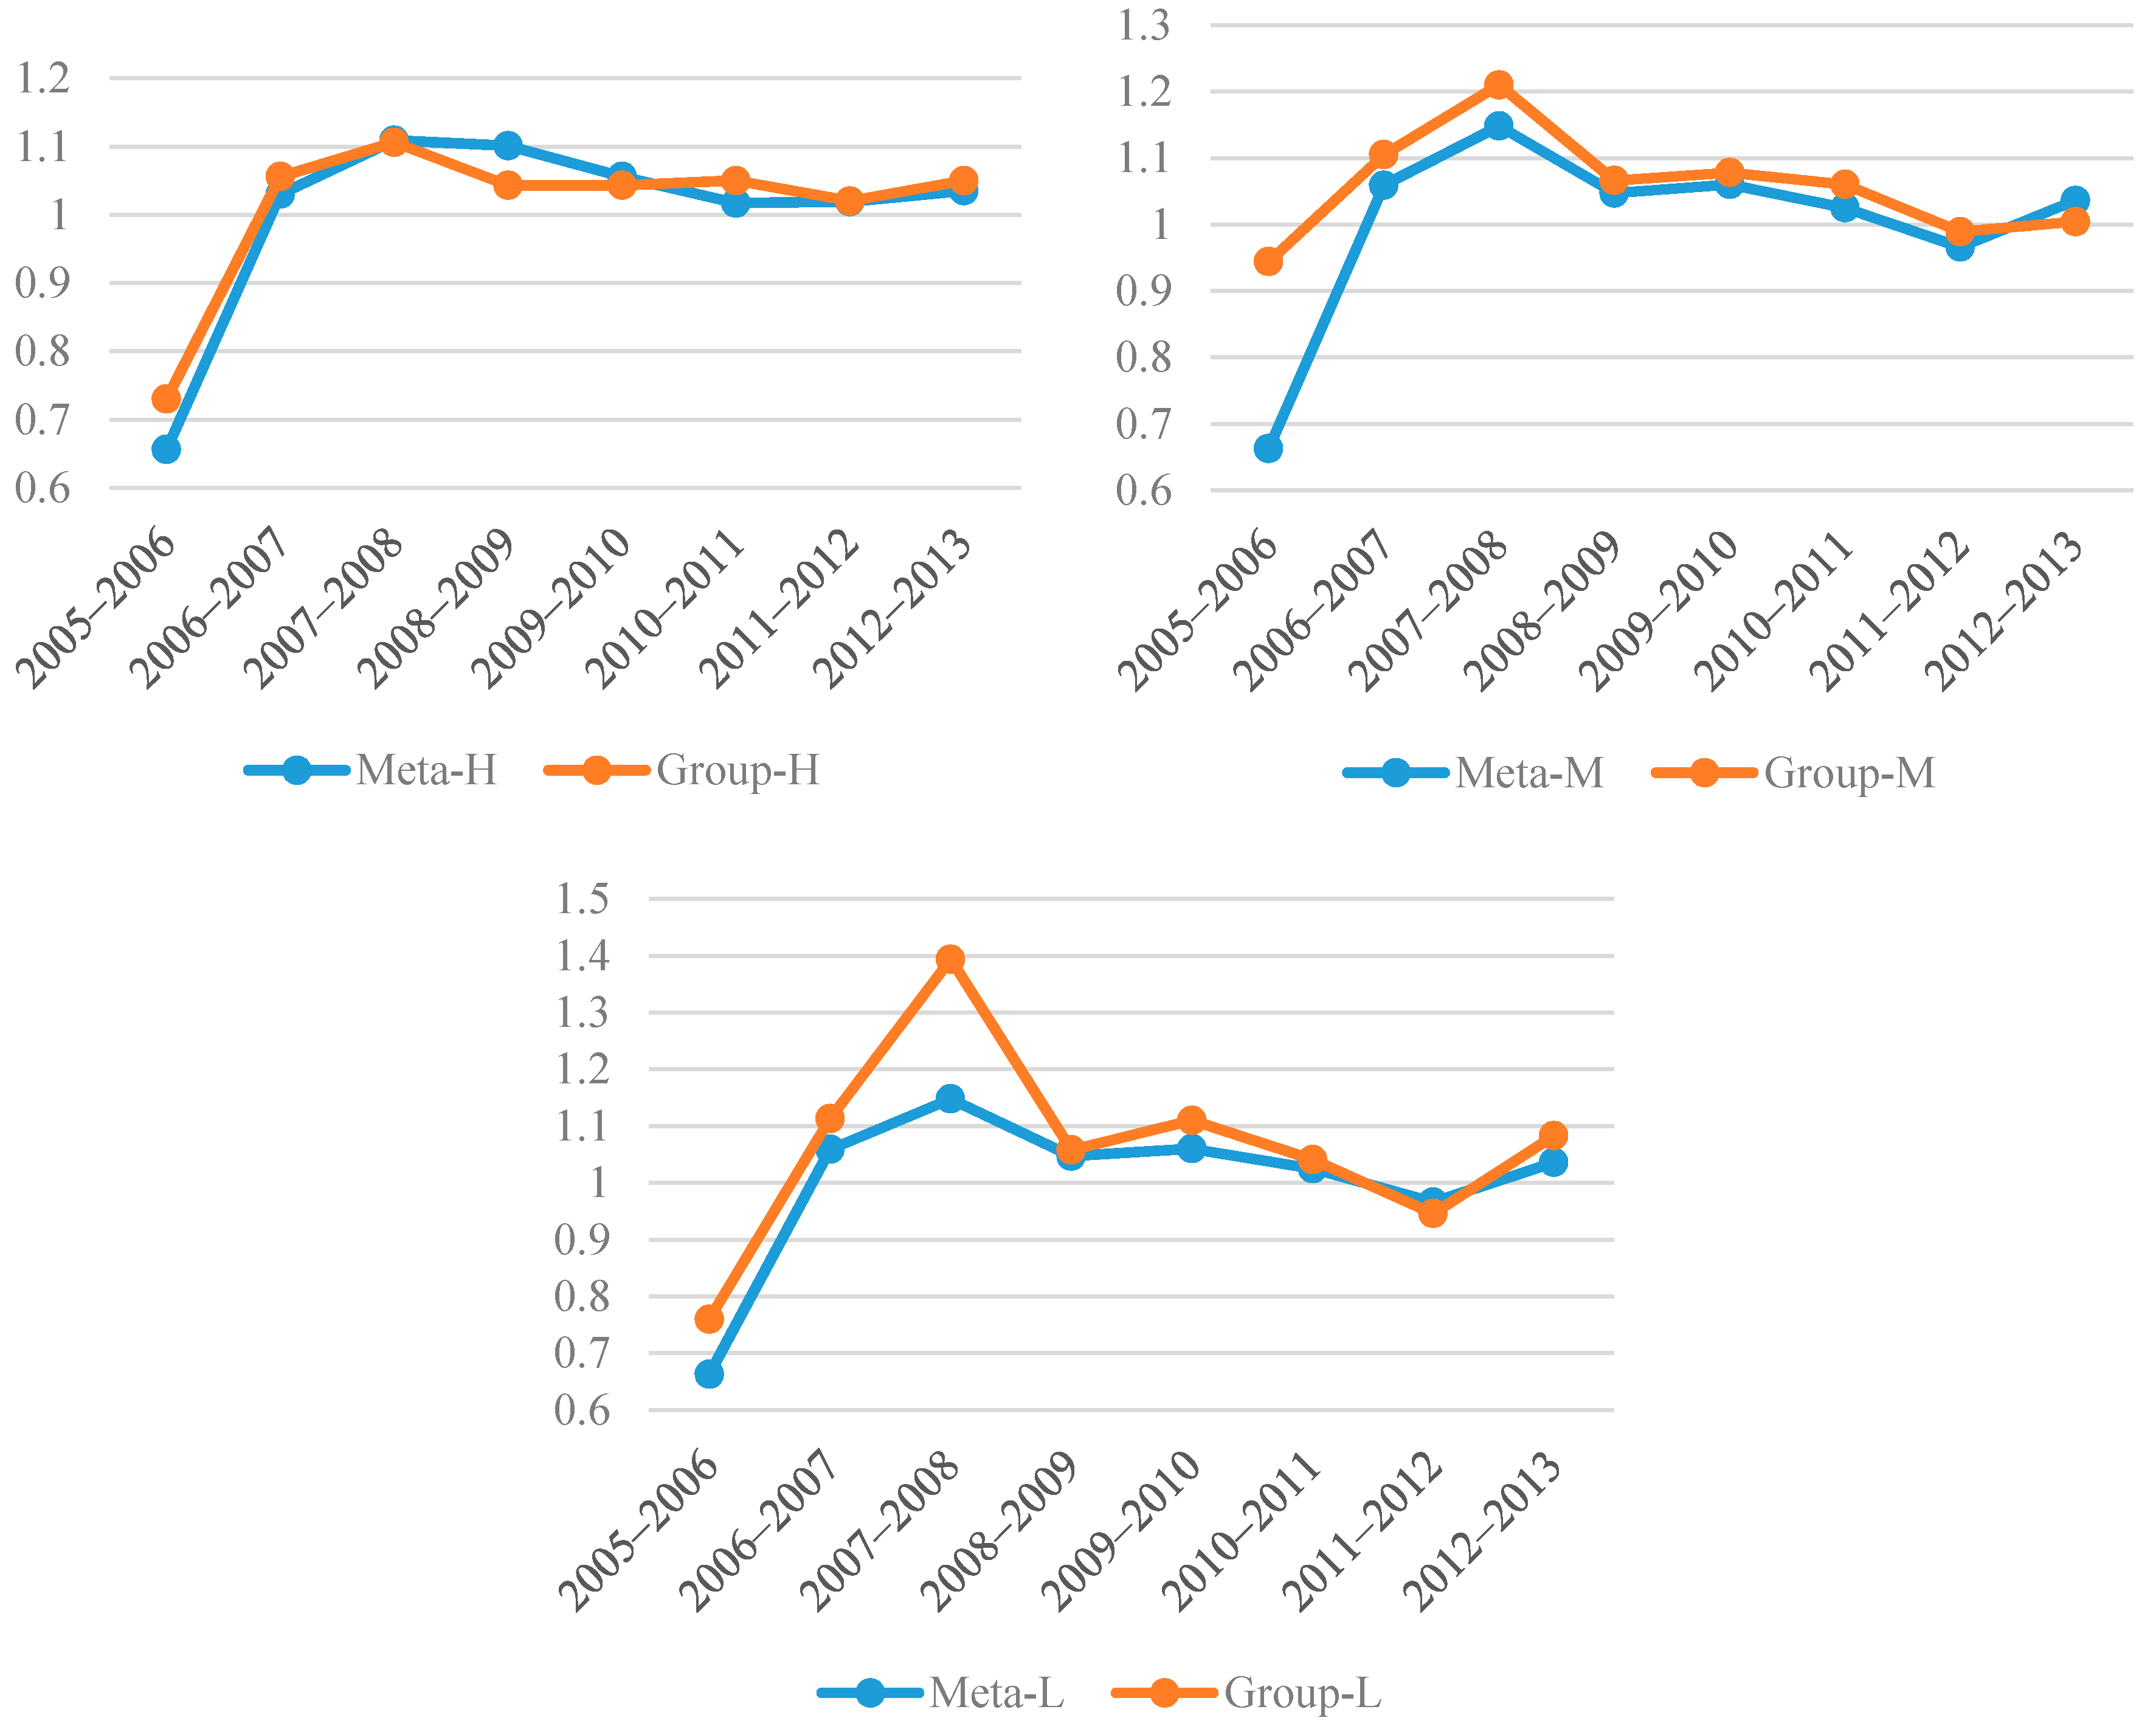
- The ML indexes in 166 cities under the meta-frontier and 185 cities under the group frontier are more than 1, which indicates that the urban environmental performances in these cities were improved during the observation period. In most years the ML indexes under the group frontier were higher than that under the meta-frontier in different types of cities. This overestimation under the group frontier for high energy intensity cities is more obvious. Because production technologies in this type of city were not advanced, they had a lower technological frontier. This also means it is difficult to match the group frontier to the meta-frontier by improving the technological efficiency. However, narrowing the technology gap between different types of cities is a more efficient method to improve the urban environmental performance in China.
- (2)
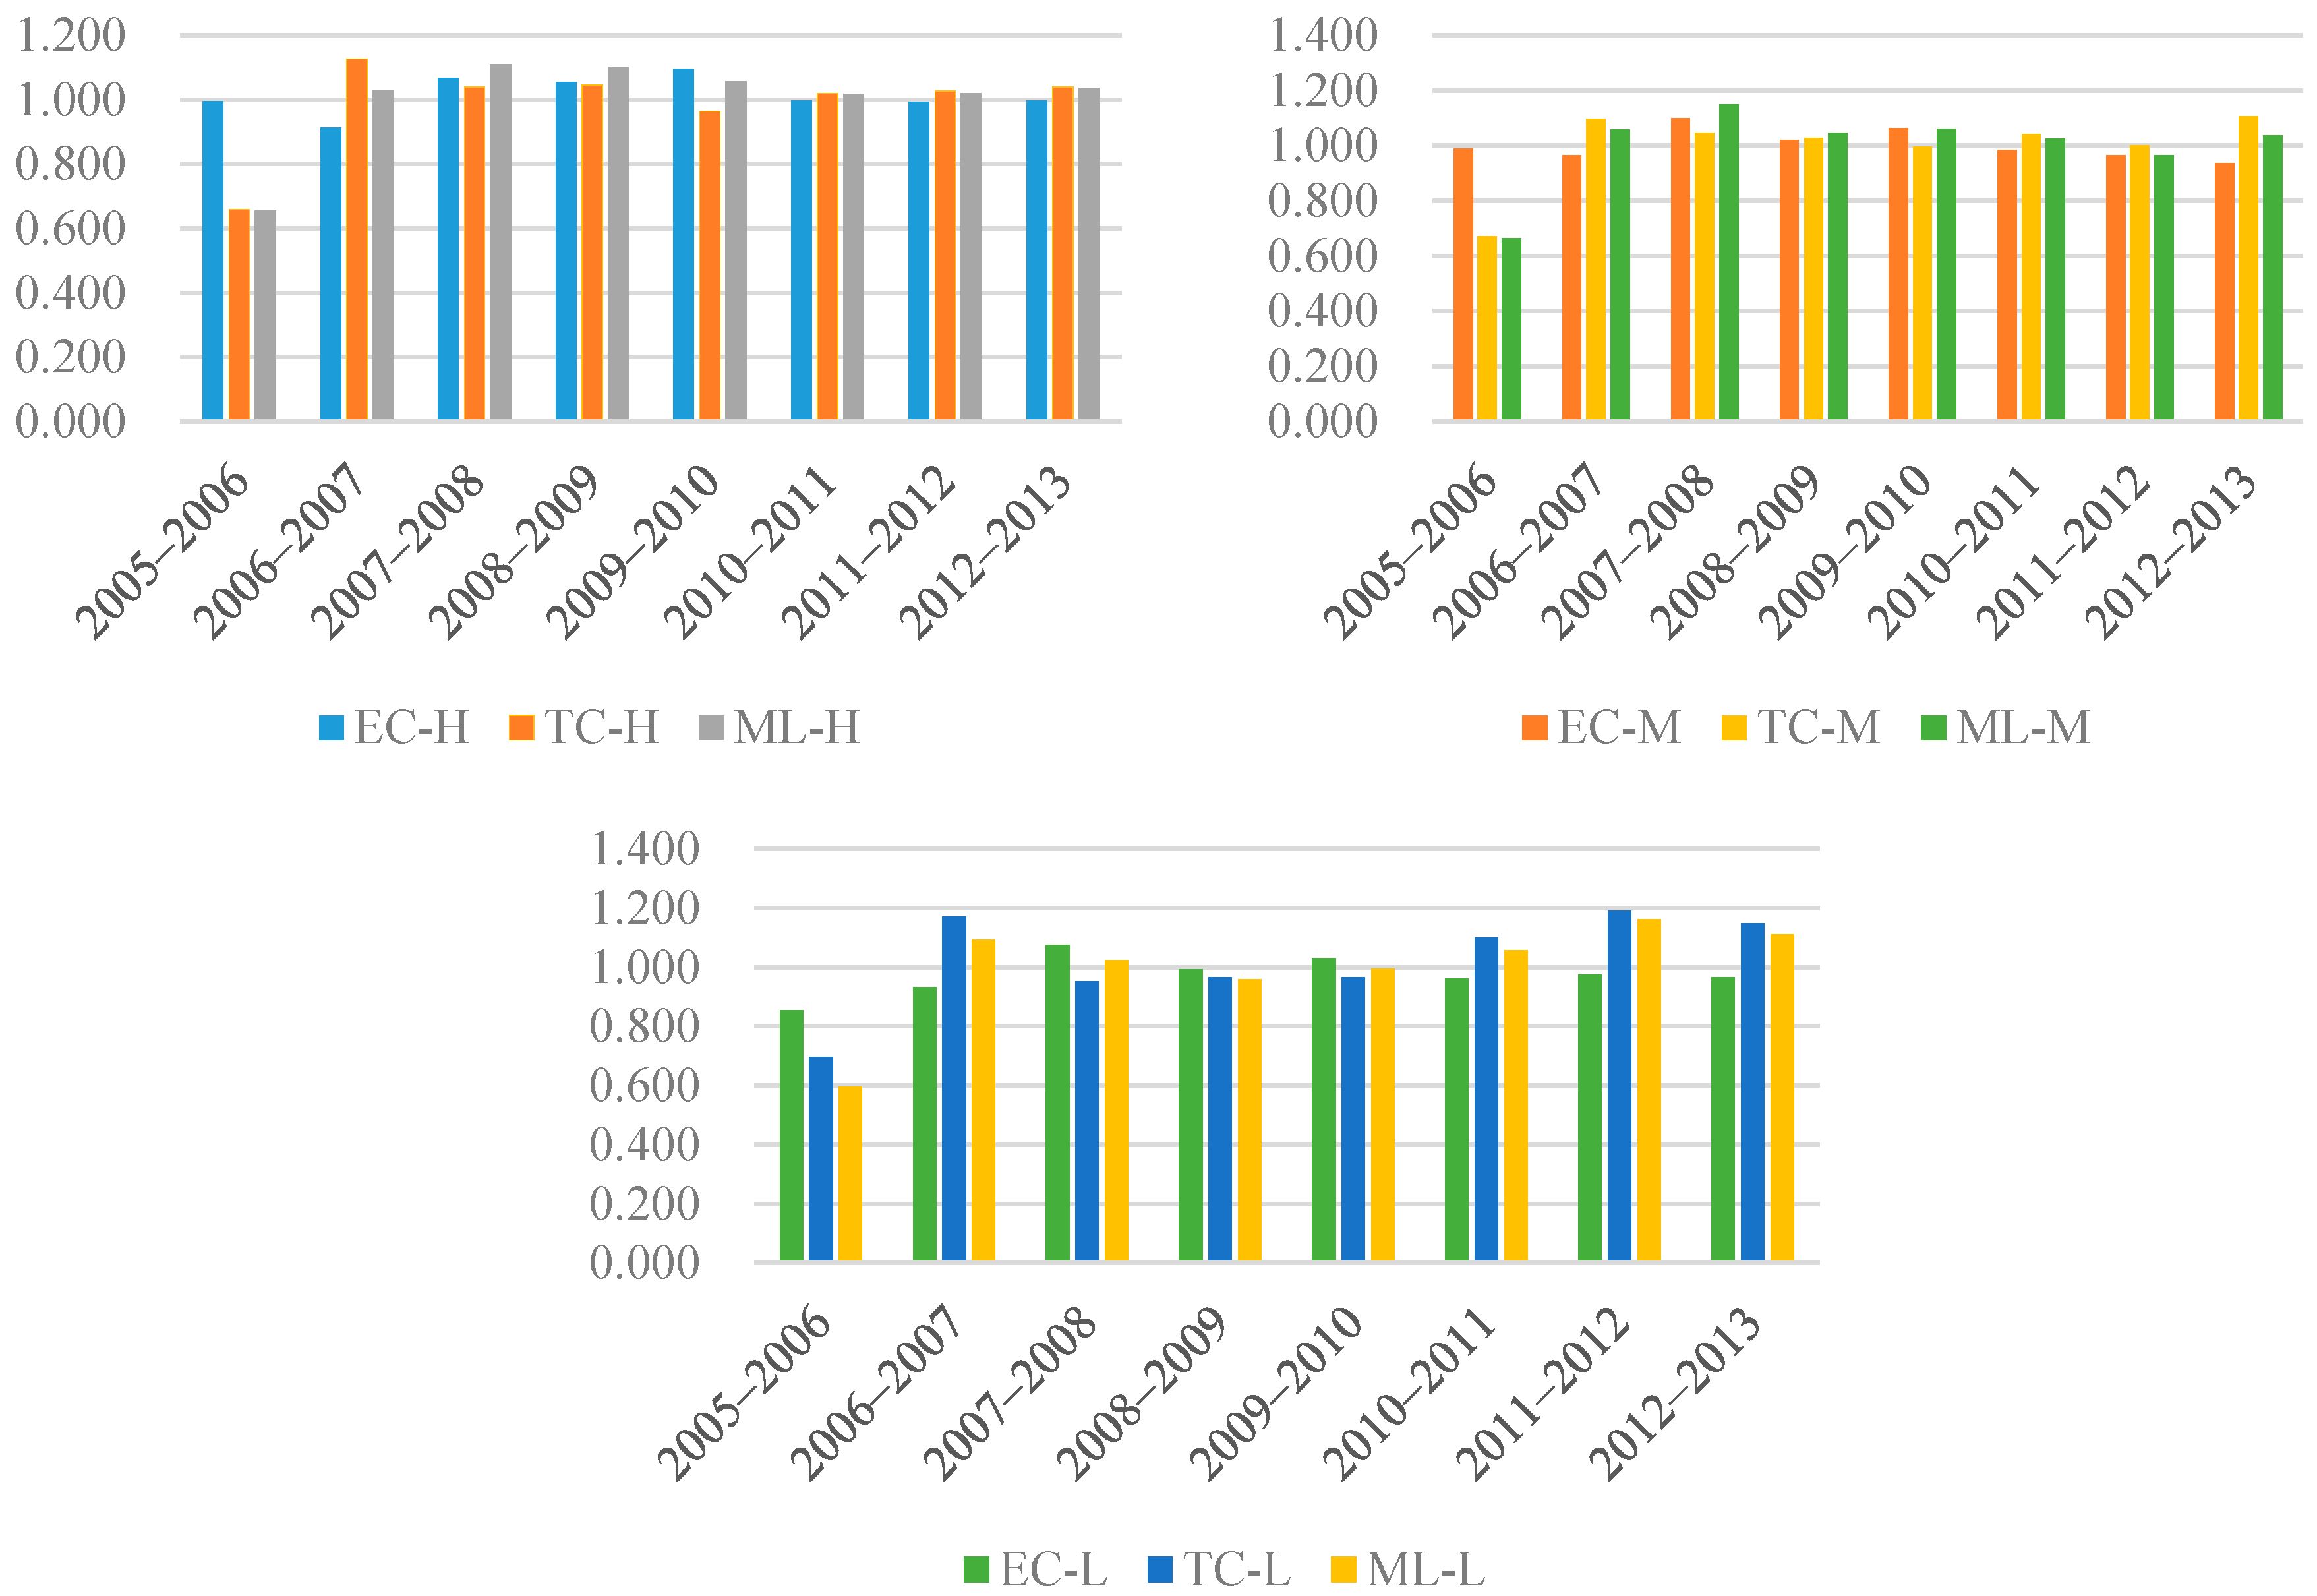
- It is notable that the EC and TC indexes of cities with higher ML growth also remained with an increasing trend basically and the gap between these two indexes was smaller relatively. This indicates in these cities that resource allocation and structure were relatively reasonable, and technological innovation abilities were stronger. However, in these cities with decreasing environmental performances, at least one of its EC or TC index remained at negative growth which means the resource allocation and structure were unreasonable and the technological levels were lower. Thus, the balance between efficient improvement and technological promotion is significant for the overall increase in environmental performance.
- (3)
- Economic policies and crisis have important influences on urban environmental performances. For example, in 2006 and 2012 the ML index had a significant increase. In this period, China published the Chinese eleventh five-year plan (2006–2010) and Environmental government policies such as “Air Pollution Control Action Plan” and “PM2.5 Monitoring”. All of these policies related to industrial structure and resources conservation promoting technological innovation vigorously. The findings are partly in line with previous research [39], government economic plans can lead to a significant change of the environmental situation. Additionally, in 2008 the ML index and its decomposed EC and TC experienced a decreasing trend when the global financial crisis occurred. Thus, strategic policies and huge crises should be considered as external factors when we evaluate environmental performance.
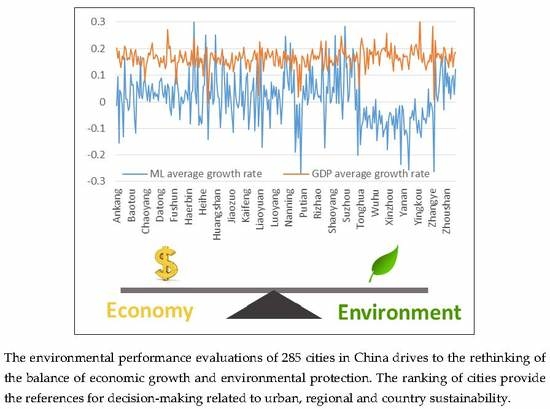
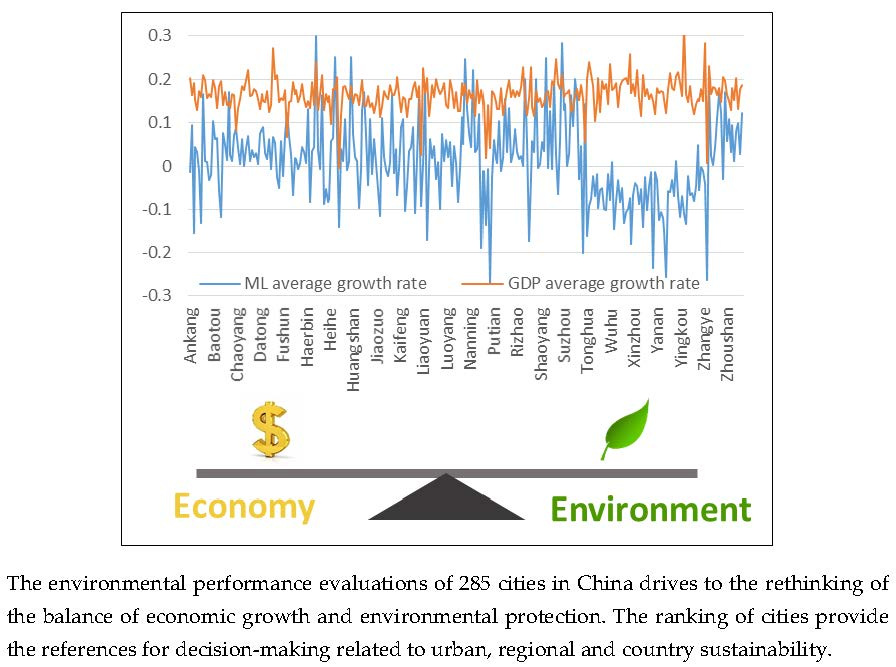
- (4)
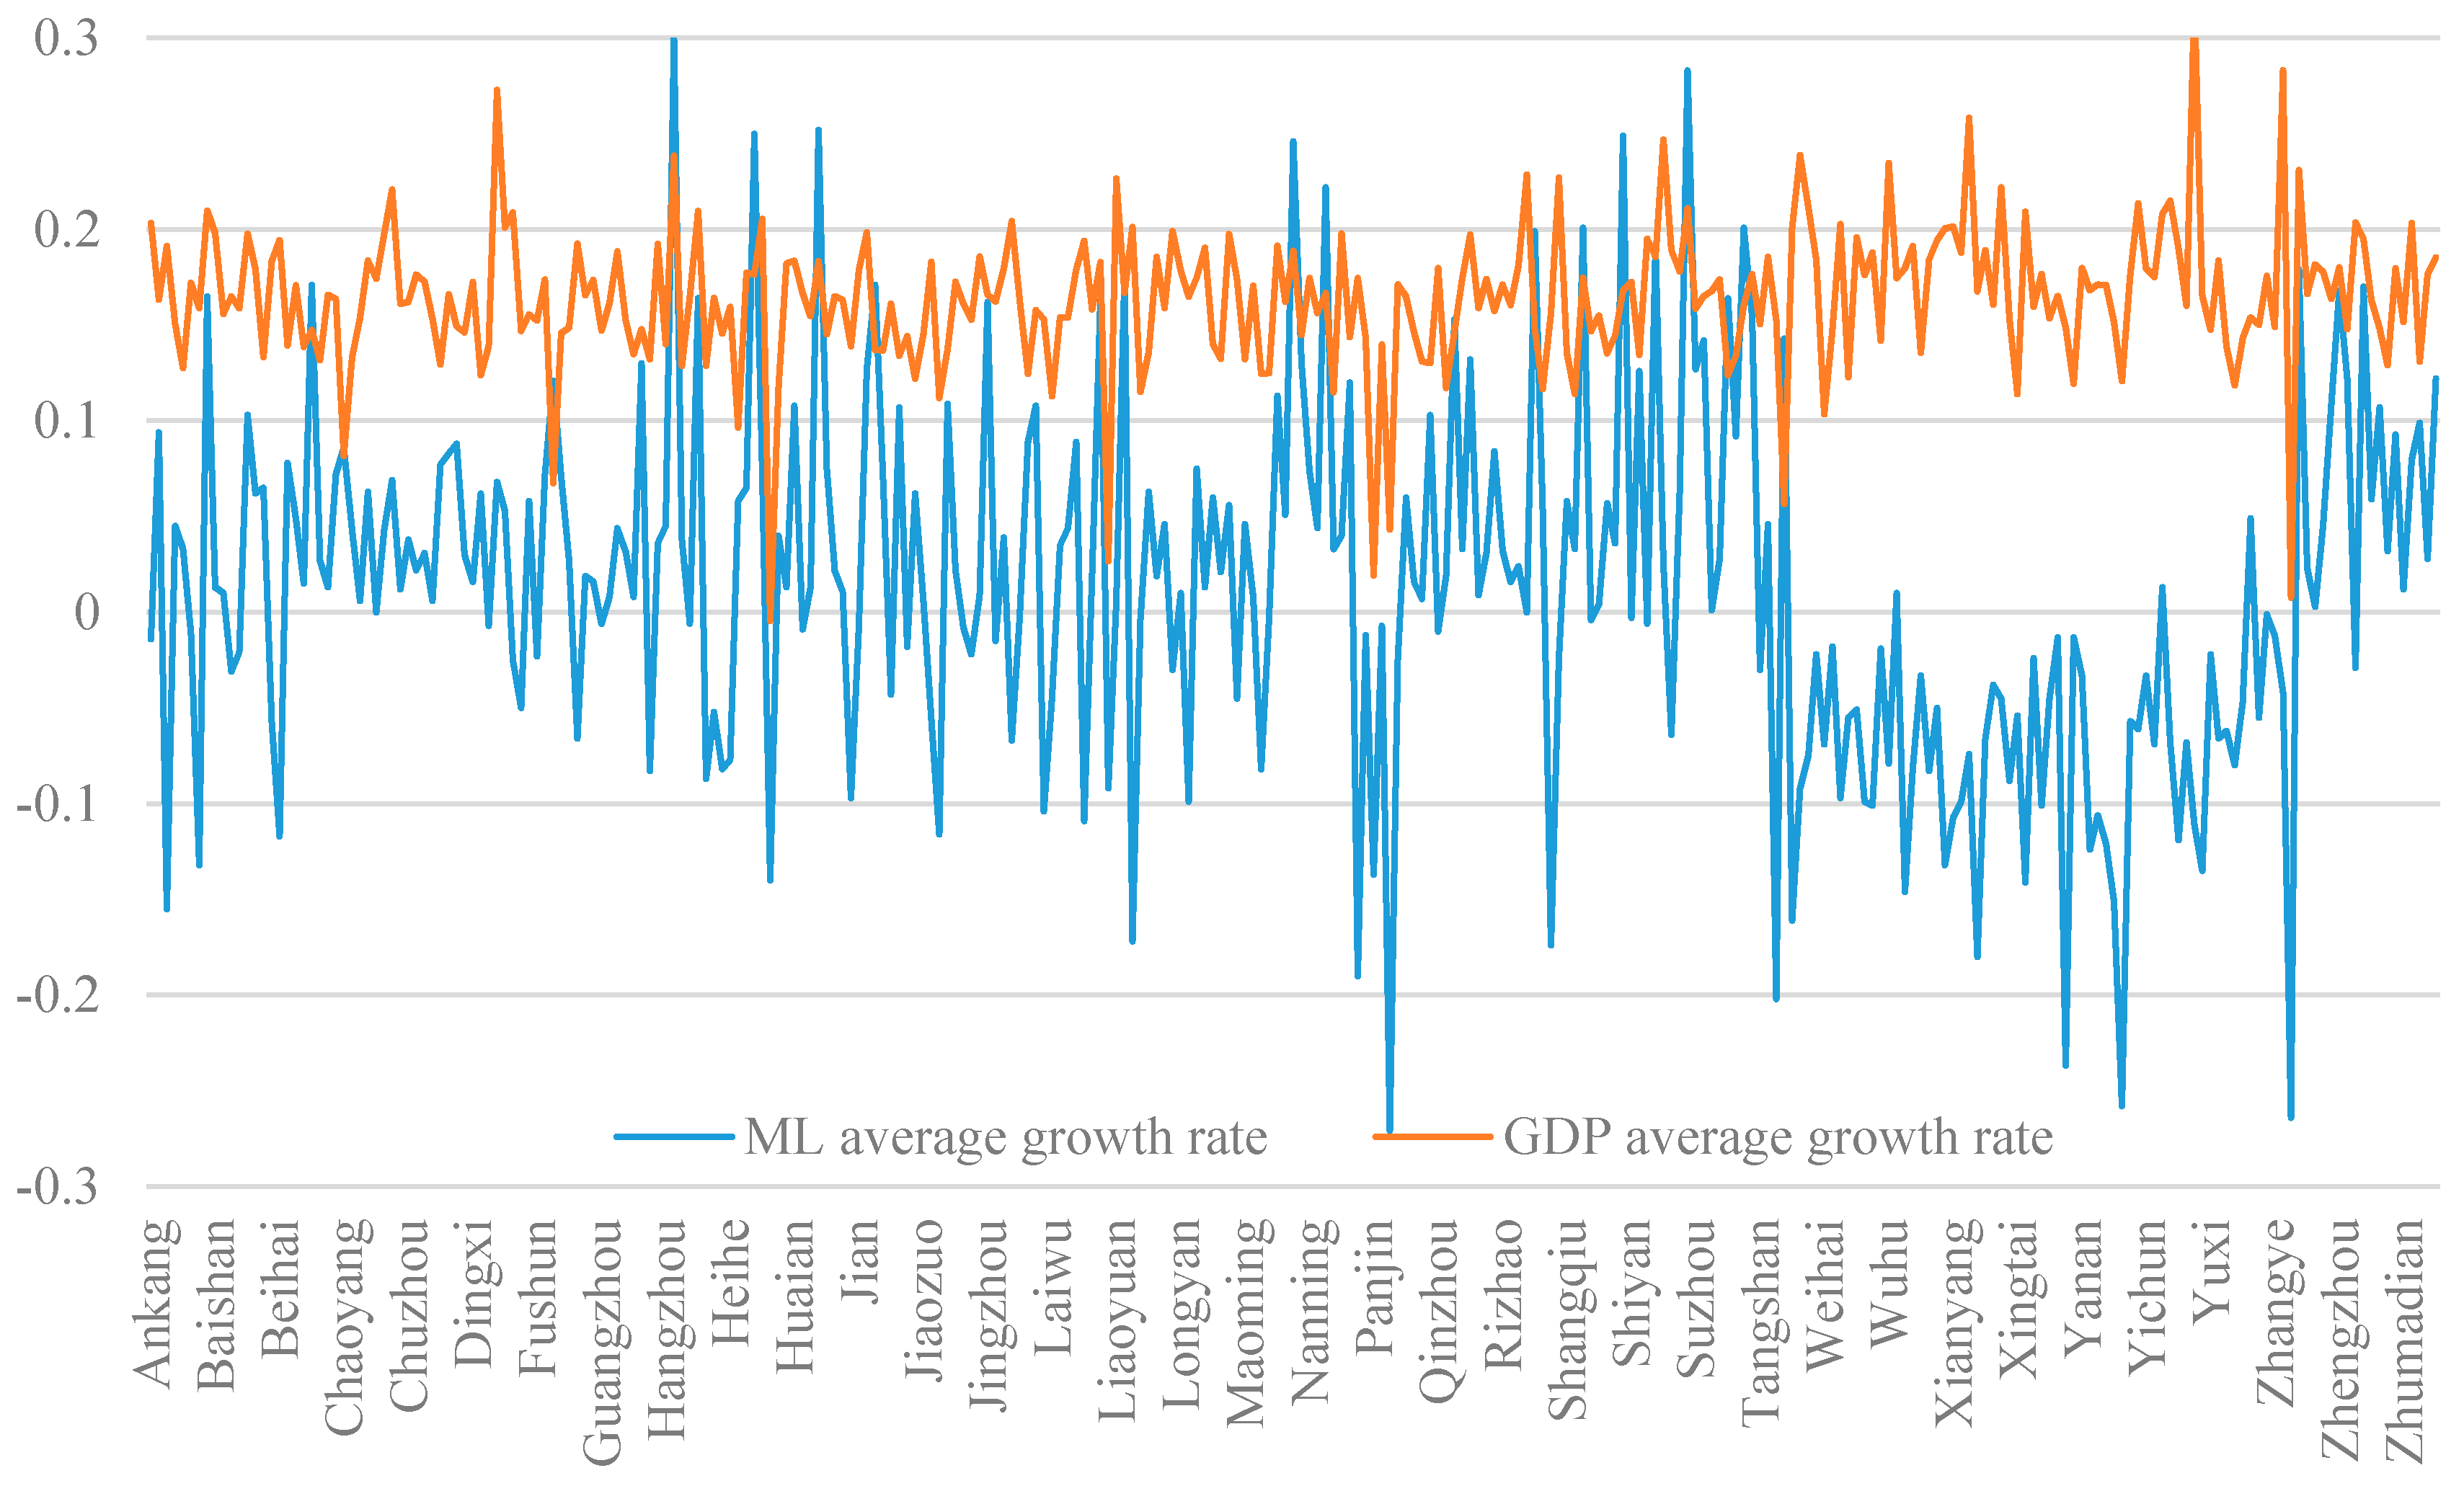
- In most cities, the ML growth rates were significantly smaller than GDP growth rates and even totally opposite trends existed between these two indexes. This indicates it is not enough to evaluate the economic development of a city only by GDP. The energy consumption and the environmental performance are also important indicators to evaluate urban development from the sustainable perspective. So it is necessary to rethink the achievement of urban development by combining economy-related indicators and environment-related indicators.
5. Conclusions
Acknowledgements
Conflicts of Interest
References
- Wigginton, N.S.; Fahrenkamp-Uppenbrink, J.; Wible, B. Cities are the future. Science 2016, 352, 904–905. [Google Scholar] [CrossRef] [PubMed]
- American Association for the Advancement of Science. Rise of the city. Science 2016, 352, 906–907. [Google Scholar] [CrossRef]
- Henderson, J.V.; Venables, A.J.; Regan, T. Building functional cities. Science 2016, 352, 946–947. [Google Scholar] [CrossRef] [PubMed]
- Hartig, T.; Kahn, P.H. Living in cities, naturally. Science 2016, 352, 938–940. [Google Scholar] [CrossRef] [PubMed]
- Färe, R.; Grosskopf, S.; Pasurka, C. The effect of environmental regulations on the efficiency of electric utilities: 1969 versus 1975. Appl. Econ. 1989, 21, 225–235. [Google Scholar] [CrossRef]
- Epstein, M.J.; Wisner, P.S. Using a balanced scorecard to implement sustainability. Environ. Qual. Manag. 2001, 11, 1–10. [Google Scholar] [CrossRef]
- Corbett, C.J.; Pan, J.N. Evaluating environmental performance using statistical process control techniques. Eur. J. Oper. Res. 2002, 139, 68–83. [Google Scholar] [CrossRef]
- Tam, V.W.Y.; Tam, C.M.; Zeng, S.X. Environmental performance measurement indicators in construction. Build. Environ. 2006, 41, 164–173. [Google Scholar] [CrossRef]
- Awasthi, A.; Chauhan, S.S.; Goyal, S.K. A fuzzy multicriteria approach for evaluating environmental performance of suppliers. Int. J. Prod. Econ. 2010, 126, 370–378. [Google Scholar] [CrossRef]
- Hasanali, A.; Abbas, N.A.; Hossein, N. Environmental Performance Evaluation Based on Fuzzy Logic. In Proceedings of the International Conference on Social Science and Humanity, Singapore, 26 February 2011; International Association of Computer Science and Information Technology Press: Singapore, 2011. [Google Scholar]
- Kammen, D.M.; Sunter, D.A. City-integrated renewable energy for urban sustainability. Science 2016, 352, 922–928. [Google Scholar] [CrossRef] [PubMed]
- Zucaro, A.; Ripa, M.; Mellino, S. Urban resource use and environmental performance indicators. An application of decomposition analysis. Ecol. Indic. 2014, 47, 16–25. [Google Scholar] [CrossRef]
- Frank, A.G.; Dalle, M.N.; Gerstlberger, W. An integrative environmental performance index for benchmarking in oil and gas industry. J. Clean. Prod. 2016, 133, 1190–1203. [Google Scholar] [CrossRef]
- Xue, X.L.; Wu, H.Q.; Zhang, X.L. Measuring energy consumption efficiency of the construction industry: The case of China. J. Clean. Prod. 2015, 107, 509–515. [Google Scholar] [CrossRef]
- Aparicio, J.; Barbero, J.; Kapelko, M. Testing the consistency and feasibility of the standard Malmquist-Luenberger index: Environmental productivity in world air emissions. J. Environ. Manag. 2017, 196, 148–160. [Google Scholar] [CrossRef] [PubMed]
- He, Y.; Xie, H.; Fan, Y.; Wang, W.; Xie, X. Forested land use efficiency in China: Spatiotemporal patterns and influencing factors from 1999 to 2010. Sustainability 2016, 8, 772. [Google Scholar] [CrossRef]
- Du, M.; Wang, B.; Wu, Y. Sources of China’s economic growth: An empirical analysis based on the BML index with green growth accounting. Sustainability 2014, 6, 5983–6004. [Google Scholar] [CrossRef]
- Hong, H.; Xie, D.; Liao, H.; Tu, B.; Yang, J. Land use efficiency and total factor productivity—Distribution dynamic evolution of rural living space in Chongqing, China. Sustainability 2017, 9, 444. [Google Scholar] [CrossRef]
- Zhang, J.; Fang, H.; Peng, B.; Wang, X.; Fang, S. Productivity growth-accounting for undesirable outputs and its influencing factors: The case of China. Sustainability 2016, 8, 1166. [Google Scholar] [CrossRef]
- Oh, D. A global Malmquist-Luenberger productivity index. J. Product. Anal. 2010, 34, 183–197. [Google Scholar] [CrossRef]
- Färe, R.; Grosskopf, S.; Pasurka, C.A. Environmental production functions and environmental directional distance functions. Energy 2007, 32, 1055–1066. [Google Scholar] [CrossRef]
- Färe, R.; Grosskopf, S. Theory and application of directional distance functions. J. Product. Anal. 2000, 13, 93–103. [Google Scholar] [CrossRef]
- Chung, Y.H.; Färe, R.; Grosskopf, S. Productivity and undesirable outputs: A directional distance function approach. J. Environ. Manag. 1997, 51, 229–240. [Google Scholar] [CrossRef]
- Hayami, Y. Sources of agricultural productivity gap among selected countries. Am. J. Agric. Econ. 1969, 51, 564–575. [Google Scholar] [CrossRef]
- Färe, R.; Grosskopf, S.; Lindgren, B. Productivity Developments in Swedish Hospitals: A Malmquist Output Index Approach; Springer: Berlin, Germany, 1994; pp. 227–235. [Google Scholar]
- Wang, K.; Yu, S.; Zhang, W. China’s regional energy and environmental efficiency: A DEA window analysis based dynamic evaluation. Math. Comput. Model. 2013, 58, 1117–1127. [Google Scholar] [CrossRef]
- Hu, J.L.; Chang, M.C.; Tsay, H.W. The congestion total-factor energy efficiency of regions in Taiwan. Energy Policy 2017, 110, 710–718. [Google Scholar] [CrossRef]
- Meng, F.Y.; Fan, L.W.; Zhou, P. Measuring environmental performance in China’s industrial sectors with non-radial DEA. Math. Comput. Model. 2013, 58, 1047–1056. [Google Scholar] [CrossRef]
- He, F.; Zhang, Q.; Lei, J. Energy efficiency and productivity change of China’s iron and steel industry: Accounting for undesirable outputs. Energy Policy 2013, 54, 204–213. [Google Scholar] [CrossRef]
- Jin, J.; Zhou, D.; Zhou, P. Measuring environmental performance with stochastic environmental DEA: The case of APEC economies. Econ. Model. 2014, 38, 80–86. [Google Scholar] [CrossRef]
- Chen, S.; Golley, J. Green productivity growth in China’s industrial economy. Energy Econ. 2014, 44, 89–98. [Google Scholar] [CrossRef]
- Genovese, A.; Lenny, K.S.; Kumar, N. Exploring the challenges in implementing supplier environmental performance measurement models: A case study. Prod. Plan. Control 2014, 25, 1198–1211. [Google Scholar] [CrossRef]
- Silva, D.A.L.; Lahr, F.A.R.; Varanda, L.D. Environmental performance assessment of the melamine-urea-formaldehyde (MUF) resin manufacture: A case study in Brazil. J. Clean. Prod. 2015, 96, 299–307. [Google Scholar] [CrossRef]
- BaI, Y.; Deng, X.; Zhang, Q. Measuring environmental performance of industrial sub-sectors in China: A stochastic metafrontier approach. Phys. Chem. Earth 2017, 101, 3–12. [Google Scholar] [CrossRef]
- Li, K.; Lin, B. Impact of energy conservation policies on the green productivity in China’s manufacturing sector: Evidence from a three-stage DEA model. Appl. Energy 2016, 168, 351–363. [Google Scholar] [CrossRef]
- Beltrán-Esteve, M.; Picazo-Tadeo, A.J. Assessing environmental performance in the European Union: Eco-innovation versus catching-up. Energy Policy 2017, 104, 240–252. [Google Scholar] [CrossRef]
- Zuo, X.; Hua, H.; Dong, Z. Environmental Performance Index at the Provincial Level for China 2006–2011. Ecol. Indic. 2017, 75, 48–56. [Google Scholar] [CrossRef]
- Huang, Y.J.; Chen, K.H.; Yang, C.H. Cost efficiency and optimal scale of electricity distribution firms in Taiwan: An application of metafrontier analysis. Energy Econ. 2010, 32, 15–23. [Google Scholar] [CrossRef]
- Zhou, D.; Wang, Q.; Su, B.; Zhou, P.; Yao, L. Industrial energy conservation and emission reduction performance in China: A city-level nonparametric analysis. Appl. Energy 2016, 166, 201–209. [Google Scholar] [CrossRef]


| Literatures | X1 | X2 | X3 | X4 | X5 | X6 | X7 | X8 |
|---|---|---|---|---|---|---|---|---|
| Wang, 2013 [26] | √ | √ | √ | √ | √ | |||
| Meng, 2013 [28] | √ | √ | √ | |||||
| He, 2013 [29] | √ | √ | ||||||
| Jin, 2014 [30] | √ | √ | √ | |||||
| Chen, 2014 [31] | √ | √ | √ | |||||
| Genovese, 2014 [32] | √ | √ | ||||||
| Silva, 2015 [33] | √ | √ | ||||||
| Bai, 2016 [34] | √ | √ | √ | |||||
| Li, 2016 [35] | √ | √ | √ | |||||
| Beltrán-Esteve, 2017 [36] | √ | √ | √ | √ | ||||
| Zuo, 2017 [37] | √ | √ | √ | √ |
| Types | Clusters | Mean | Number | Cities (Partly) |
|---|---|---|---|---|
| Low Energy Intensity | 1 | 0.04 | 198 | Ankang, Baise, Bayanzhuoer, Bengbu, Baicheng, Bazhong, Binzhou, Baoji, Cangzhou, Baoding |
| Medium Energy Intensity | 2 | 0.11 | 78 | Anqing, Baiyin, Anshun, Baotou, Anshan, Anyang, Changzhou, Benxi, Beijing, Quzhou |
| High Energy Intensity | 3 | 0.43 | 9 | Jinchang, Jiayuguan, Panzhihua, Shizuishan, Tongchuan, Wuhai, Xining, Yangquan, Zhongwei |
| City-Meta | Cluster | EC | TC | ML | City-Group | Cluster | EC | TC | ML |
|---|---|---|---|---|---|---|---|---|---|
| Hefei | 1 | 1.142 | 1.138 | 1.300 | Hefei | 1 | 1.142 | 1.157 | 1.321 |
| Songyuan | 1 | 1.199 | 1.071 | 1.283 | Shenyang | 1 | 1.098 | 1.185 | 1.301 |
| Huanggang | 1 | 1.166 | 1.074 | 1.252 | Songyuan | 1 | 1.237 | 1.040 | 1.287 |
| Huhehaote | 1 | 1.172 | 1.067 | 1.250 | Huhehaote | 1 | 1.172 | 1.073 | 1.258 |
| Shenyang | 1 | 1.098 | 1.137 | 1.249 | Huanggang | 1 | 1.166 | 1.072 | 1.250 |
| Pingliang | 1 | 0.797 | 0.915 | 0.729 | Pingliang | 1 | 0.797 | 0.900 | 0.717 |
| Xiamen | 2 | 1.118 | 1.073 | 1.199 | Chongqing | 2 | 1.050 | 1.144 | 1.201 |
| Chongqing | 2 | 1.119 | 1.046 | 1.170 | Anyang | 2 | 1.126 | 1.056 | 1.189 |
| Zhengzhou | 2 | 1.124 | 1.039 | 1.168 | Nanjing | 2 | 1.124 | 1.033 | 1.162 |
| Nanjing | 2 | 1.109 | 1.020 | 1.130 | Leshan | 2 | 1.083 | 1.071 | 1.161 |
| Haikou | 2 | 1.034 | 0.996 | 1.130 | Baotou | 2 | 1.074 | 1.075 | 1.155 |
| Yichun | 2 | 0.992 | 0.748 | 0.742 | Liangyang | 2 | 0.810 | 1.022 | 0.828 |
| Shizuishan | 3 | 1.006 | 0.989 | 0.994 | Shizuishan | 3 | 0.984 | 1.155 | 1.136 |
| Panzhihua | 3 | 1.076 | 0.918 | 0.988 | Wuhai | 3 | 1.021 | 1.072 | 1.095 |
| Jiayuguan | 3 | 0.991 | 0.992 | 0.982 | Panzhihua | 3 | 1.014 | 1.016 | 1.030 |
| Yangquan | 3 | 0.902 | 0.940 | 0.849 | Tongchuan | 3 | 1.000 | 1.000 | 1.000 |
| Jinchang | 3 | 0.947 | 0.934 | 0.884 | Xining | 3 | 1.005 | 0.994 | 0.999 |
| Tongchuan | 3 | 0.999 | 0.926 | 0.925 | Jinchang | 3 | 0.995 | 0.989 | 0.985 |
| City | Index | 2005–2006 | 2006–2007 | 2007–2008 | 2008–2009 | 2009–2010 | 2010–2011 | 2011–2012 | 2012–2013 | Mean |
|---|---|---|---|---|---|---|---|---|---|---|
| HIGH–meta | EC | 0.995 | 0.914 | 1.067 | 1.054 | 1.096 | 0.997 | 0.993 | 0.996 | 1.014 |
| TC | 0.659 | 1.126 | 1.039 | 1.045 | 0.964 | 1.019 | 1.027 | 1.039 | 0.990 | |
| ML | 0.656 | 1.030 | 1.109 | 1.101 | 1.056 | 1.017 | 1.019 | 1.035 | 1.004 | |
| MEDIUM–meta | EC | 0.989 | 0.966 | 1.098 | 1.020 | 1.063 | 0.984 | 0.966 | 0.937 | 1.003 |
| TC | 0.670 | 1.096 | 1.046 | 1.026 | 0.997 | 1.042 | 1.000 | 1.105 | 0.998 | |
| ML | 0.663 | 1.059 | 1.148 | 1.047 | 1.060 | 1.025 | 0.966 | 1.036 | 1.001 | |
| LOW–meta | EC | 0.855 | 0.933 | 1.076 | 0.993 | 1.030 | 0.962 | 0.976 | 0.966 | 0.974 |
| TC | 0.696 | 1.171 | 0.952 | 0.966 | 0.967 | 1.099 | 1.192 | 1.149 | 1.024 | |
| ML | 0.595 | 1.093 | 1.023 | 0.959 | 0.995 | 1.058 | 1.163 | 1.110 | 0.997 | |
| HIGH–group | EC | 0.941 | 0.938 | 1.081 | 1.005 | 1.071 | 1.031 | 0.994 | 1.023 | 1.011 |
| TC | 0.776 | 1.125 | 1.023 | 1.038 | 0.975 | 1.018 | 1.026 | 1.027 | 1.001 | |
| ML | 0.73 | 1.056 | 1.106 | 1.043 | 1.043 | 1.05 | 1.02 | 1.05 | 1.012 | |
| MEDIUM–group | EC | 1.007 | 1.006 | 1.1 | 0.984 | 1.091 | 1.047 | 0.972 | 0.969 | 1.022 |
| TC | 0.937 | 1.098 | 1.1 | 1.083 | 0.989 | 1.013 | 1.018 | 1.036 | 1.034 | |
| ML | 0.944 | 1.105 | 1.21 | 1.066 | 1.078 | 1.06 | 0.989 | 1.004 | 1.057 | |
| LOW–group | EC | 0.768 | 1.147 | 1.134 | 0.968 | 0.97 | 0.927 | 0.982 | 1.003 | 0.987 |
| TC | 0.99 | 0.971 | 1.23 | 1.092 | 1.145 | 1.124 | 0.964 | 1.08 | 1.074 | |
| ML | 0.76 | 1.113 | 1.394 | 1.058 | 1.11 | 1.041 | 0.946 | 1.083 | 1.061 |
© 2018 by the authors. Licensee MDPI, Basel, Switzerland. This article is an open access article distributed under the terms and conditions of the Creative Commons Attribution (CC BY) license (http://creativecommons.org/licenses/by/4.0/).
Share and Cite
Wang, L.; Xue, X.; Shi, Y.; Wang, Z.; Ji, A. A Dynamic Analysis to Evaluate the Environmental Performance of Cities in China. Sustainability 2018, 10, 862. https://doi.org/10.3390/su10030862
Wang L, Xue X, Shi Y, Wang Z, Ji A. A Dynamic Analysis to Evaluate the Environmental Performance of Cities in China. Sustainability. 2018; 10(3):862. https://doi.org/10.3390/su10030862
Chicago/Turabian StyleWang, Luqi, Xiaolong Xue, Yue Shi, Zeyu Wang, and Ankang Ji. 2018. "A Dynamic Analysis to Evaluate the Environmental Performance of Cities in China" Sustainability 10, no. 3: 862. https://doi.org/10.3390/su10030862
APA StyleWang, L., Xue, X., Shi, Y., Wang, Z., & Ji, A. (2018). A Dynamic Analysis to Evaluate the Environmental Performance of Cities in China. Sustainability, 10(3), 862. https://doi.org/10.3390/su10030862