Article

Effects of Recent Climate Change on Hourly Weather Data for HVAC Design: A Case Study of Osaka

1
Department of Architectural Engineering, Graduate School of Engineering, Osaka University, Suita 5650871, Japan
2
Department of Housing and Environmental Design, Graduate School of Human Life Science, Osaka City University, Osaka 5588585, Japan
*
Author to whom correspondence should be addressed.
Sustainability 2018, 10(3), 861; https://doi.org/10.3390/su10030861
Submission received: 3 March 2018 / Revised: 3 March 2018 / Accepted: 15 March 2018 / Published: 18 March 2018
(This article belongs to the Section Energy Sustainability)

Abstract

:
The current design weather data used for heating, ventilation, and air conditioning (HVAC) design in Japan was created using an old data period. New design weather data should be created to reflect recent local climate change. Based on our previous proposal of creating design weather data with two weather indices (dry-bulb temperature and enthalpy) for HVAC design, design weather data for Osaka was created using more recently-measured weather data (period: 2001~2015) from the Japan Meteorological Agency (JMA) in this study. The effect of recent climate change on the design weather data created with eight proposed methods was found. It showed the change in weather elements for cooling design clearly trends to warmer and drier weather, with more solar radiation and lower enthalpy, while the trends in heating design are less clear, mainly showing higher enthalpy. Furthermore, the difference in the peak load for the heating and cooling designs using the new and old design weather data was compared. The comparison showed that the minimum difference in peak load for the heating design was found using the mean daily dry-bulb temperature as the first and second indices; for the cooling design, the minimum difference in peak load was found using mean daily enthalpy as both the first and second indices.

1. Introduction

1.1. Climate Change and Urban Heat Islands

Global climate change and urban heat island (UHI) intensification are making cities hotter places to live [1,2]. Climate change is expected to have noticeable effects, such as a rise in average temperatures, changes in precipitation amounts and seasonal patterns, changes in the intensity and pattern of extreme weather events, and sea level rise [3]. Some of these effects have implications for energy production and use, i.e., a rise in outdoor air temperature can be expected to increase energy requirements for cooling and to reduce the energy requirements for heating. An UHI is an urban area or metropolitan area that is significantly warmer than its surrounding rural areas due to human activities. The temperature difference is usually larger at night than during the day, and is most apparent when winds are weak. UHIs are most noticeable during the summer, and are expected to increase the energy use of buildings for cooling.

1.2. Building Energy Savings and Design Weather Data

The energy use in both residential and commercial buildings has steadily increased to between 20% and 40% in developed countries, and has exceeded the other major sectors, namely industrial and transportation [4]. For instance, the annual electric consumption per person in Japan is more than 7800 kWh, which is three times the world average. The amount of electric consumption for heating, ventilation, and air-conditioning (HVAC) in buildings is particularly large in Japan, at about 1/3 of the electricity consumed [5]. The selection of HVAC systems with appropriate capacity is expected to reduce the energy use of buildings.
Appropriate design hourly weather data for HVAC design is used as a basis to better determine the suitable capacity of building HVAC systems, avoiding inefficient and costly overcapacity that would result by simply choosing the hottest and/or coldest days from the entire historic weather record. The design hourly weather data for HVAC design is determined by taking the weather values over a past period of 10 years or more, and then carrying out statistical processing to extract extreme values (but usually not the most extreme) for each weather element and time category [6], such as the Technical Activities Committee (TAC) method of the American Society of Heating, Refrigerating and Air-conditioning Engineers (ASHRAE). The TAC method is widely used to create the design weather data for HVAC design [7,8]. However, the TAC method uses the excess probability of each hourly weather element, which may not occur on the same day and at the same time, to create the weather data for HVAC design. The simultaneous occurrence and continuous occurrence of each weather element are ignored. Thus, it is possible that the TAC data for HVAC design is not physically realistic. Research on developing a more realistic data set includes a periodic steady-state method proposed by Okuda and Ikezawa to create appropriate outdoor weather data conditions for heating design via a simulated load calculation [9]. A method which uses the mean value for a certain weather elements over a given period of time as an index to create design weather sequences was proposed by Colliver et al. [10]. A method to create the seven-day design weather data that is required to calculate the peak load for matching the human weekly working cycle was proposed by Ishino [11].
Climate change directly affects the change of meteorological parameters, which will greatly influence building energy conservation and HVAC design. A study investigated the impacts of climate change on annual building energy use (heating and cooling) for office buildings located in five U.S. cities using the energy simulation tool “EnergyPlus”, combined with the Typical Meteorological Year 3 (TMY3) weather data and two sets of future climate data [12]. Results showed the overall impact of climate change on buildings varied with climate zones, and indicated that there is high potential that Miami, Phoenix and Los Angeles will experience substantial increases in building energy use due to climate change. Three groups of representative weather data for the future climate were synthesized based on dry-bulb temperature, equivalent temperature and precipitation. The three groups of weather data were then applied to a hydrothermal simulation of buildings, and were compared to the original regional climate model (RCM) weather data [13]. The study confirmed the applicability of the synthesized weather data based on dry-bulb temperature and emphasized the importance of considering extreme scenarios in the calculations. With the aim of explaining the importance of updating more recent weather data files used to predict building performance under microclimate phenomenon such as the UHI phenomenon, a statistical comparison between weather data collected by two urban weather stations in central Italy and the weather data obtained from TMY and test reference year (TRY) weather data files of the same area was implemented [14]. The results showed that the summer UHI phenomenon of +5.5 °C and −3.5 °C in the late afternoon and early morning, respectively in Perugia, Italy. In addition, the comparison of TMY and TRY weather data with those collected by the urban stations showed non-negligible seasonal discrepancies in terms of the main microclimate monitored parameters such as dry-bulb temperature, relative humidity, solar radiation, and wind. A study on finding the optimal cost-effective solutions for buildings by comparing data from six different reference years was carried out, considering a group of simplified building configurations located in Trento, northern Italy [15]. The results showed changes for both Pareto fronts and optimal retrofit solutions.
Considering the simultaneous occurrence and continuous occurrence of each weather element, and making more realistic the weather data for HVAC design, Yuan et al. [16] created a design hourly weather data for HVAC peak thermal load calculation for Osaka, Japan, depending on the measured weather data for 20 years from 1981 to 2000, which was acquired from the Expanded Automated Meteorological Data Acquisition System (Expanded AMeDAS) developed by the Japan Meteorological Agency (JMA) [17]. Eight methods were developed based on various combinations of four weather elements, starting with one of two weather indices in the 97–98 percentile (the extreme high values of dry-bulb temperature or enthalpy for the cooling period) or at the 2–3 percentile (the extreme low values of dry-bulb temperature or enthalpy for the heating period). It was found that the TAC exceeded all eight of these more realistic models, suggesting that the TAC model may overestimate peak thermal loads.

1.3. Aims of this Study

To examine the influence of recent climate change on Yuan et al.’s previous research [16], design hourly weather data for HVAC design was created using the more recent period of 15 years from 2001 to 2015 for Osaka, Japan. The peak outdoor air loads, respectively, for heating and cooling designs calculated by the new design hourly weather data with the eight proposed methods are compared to the old method, which was based on the 20 years from 1981 to 2000.

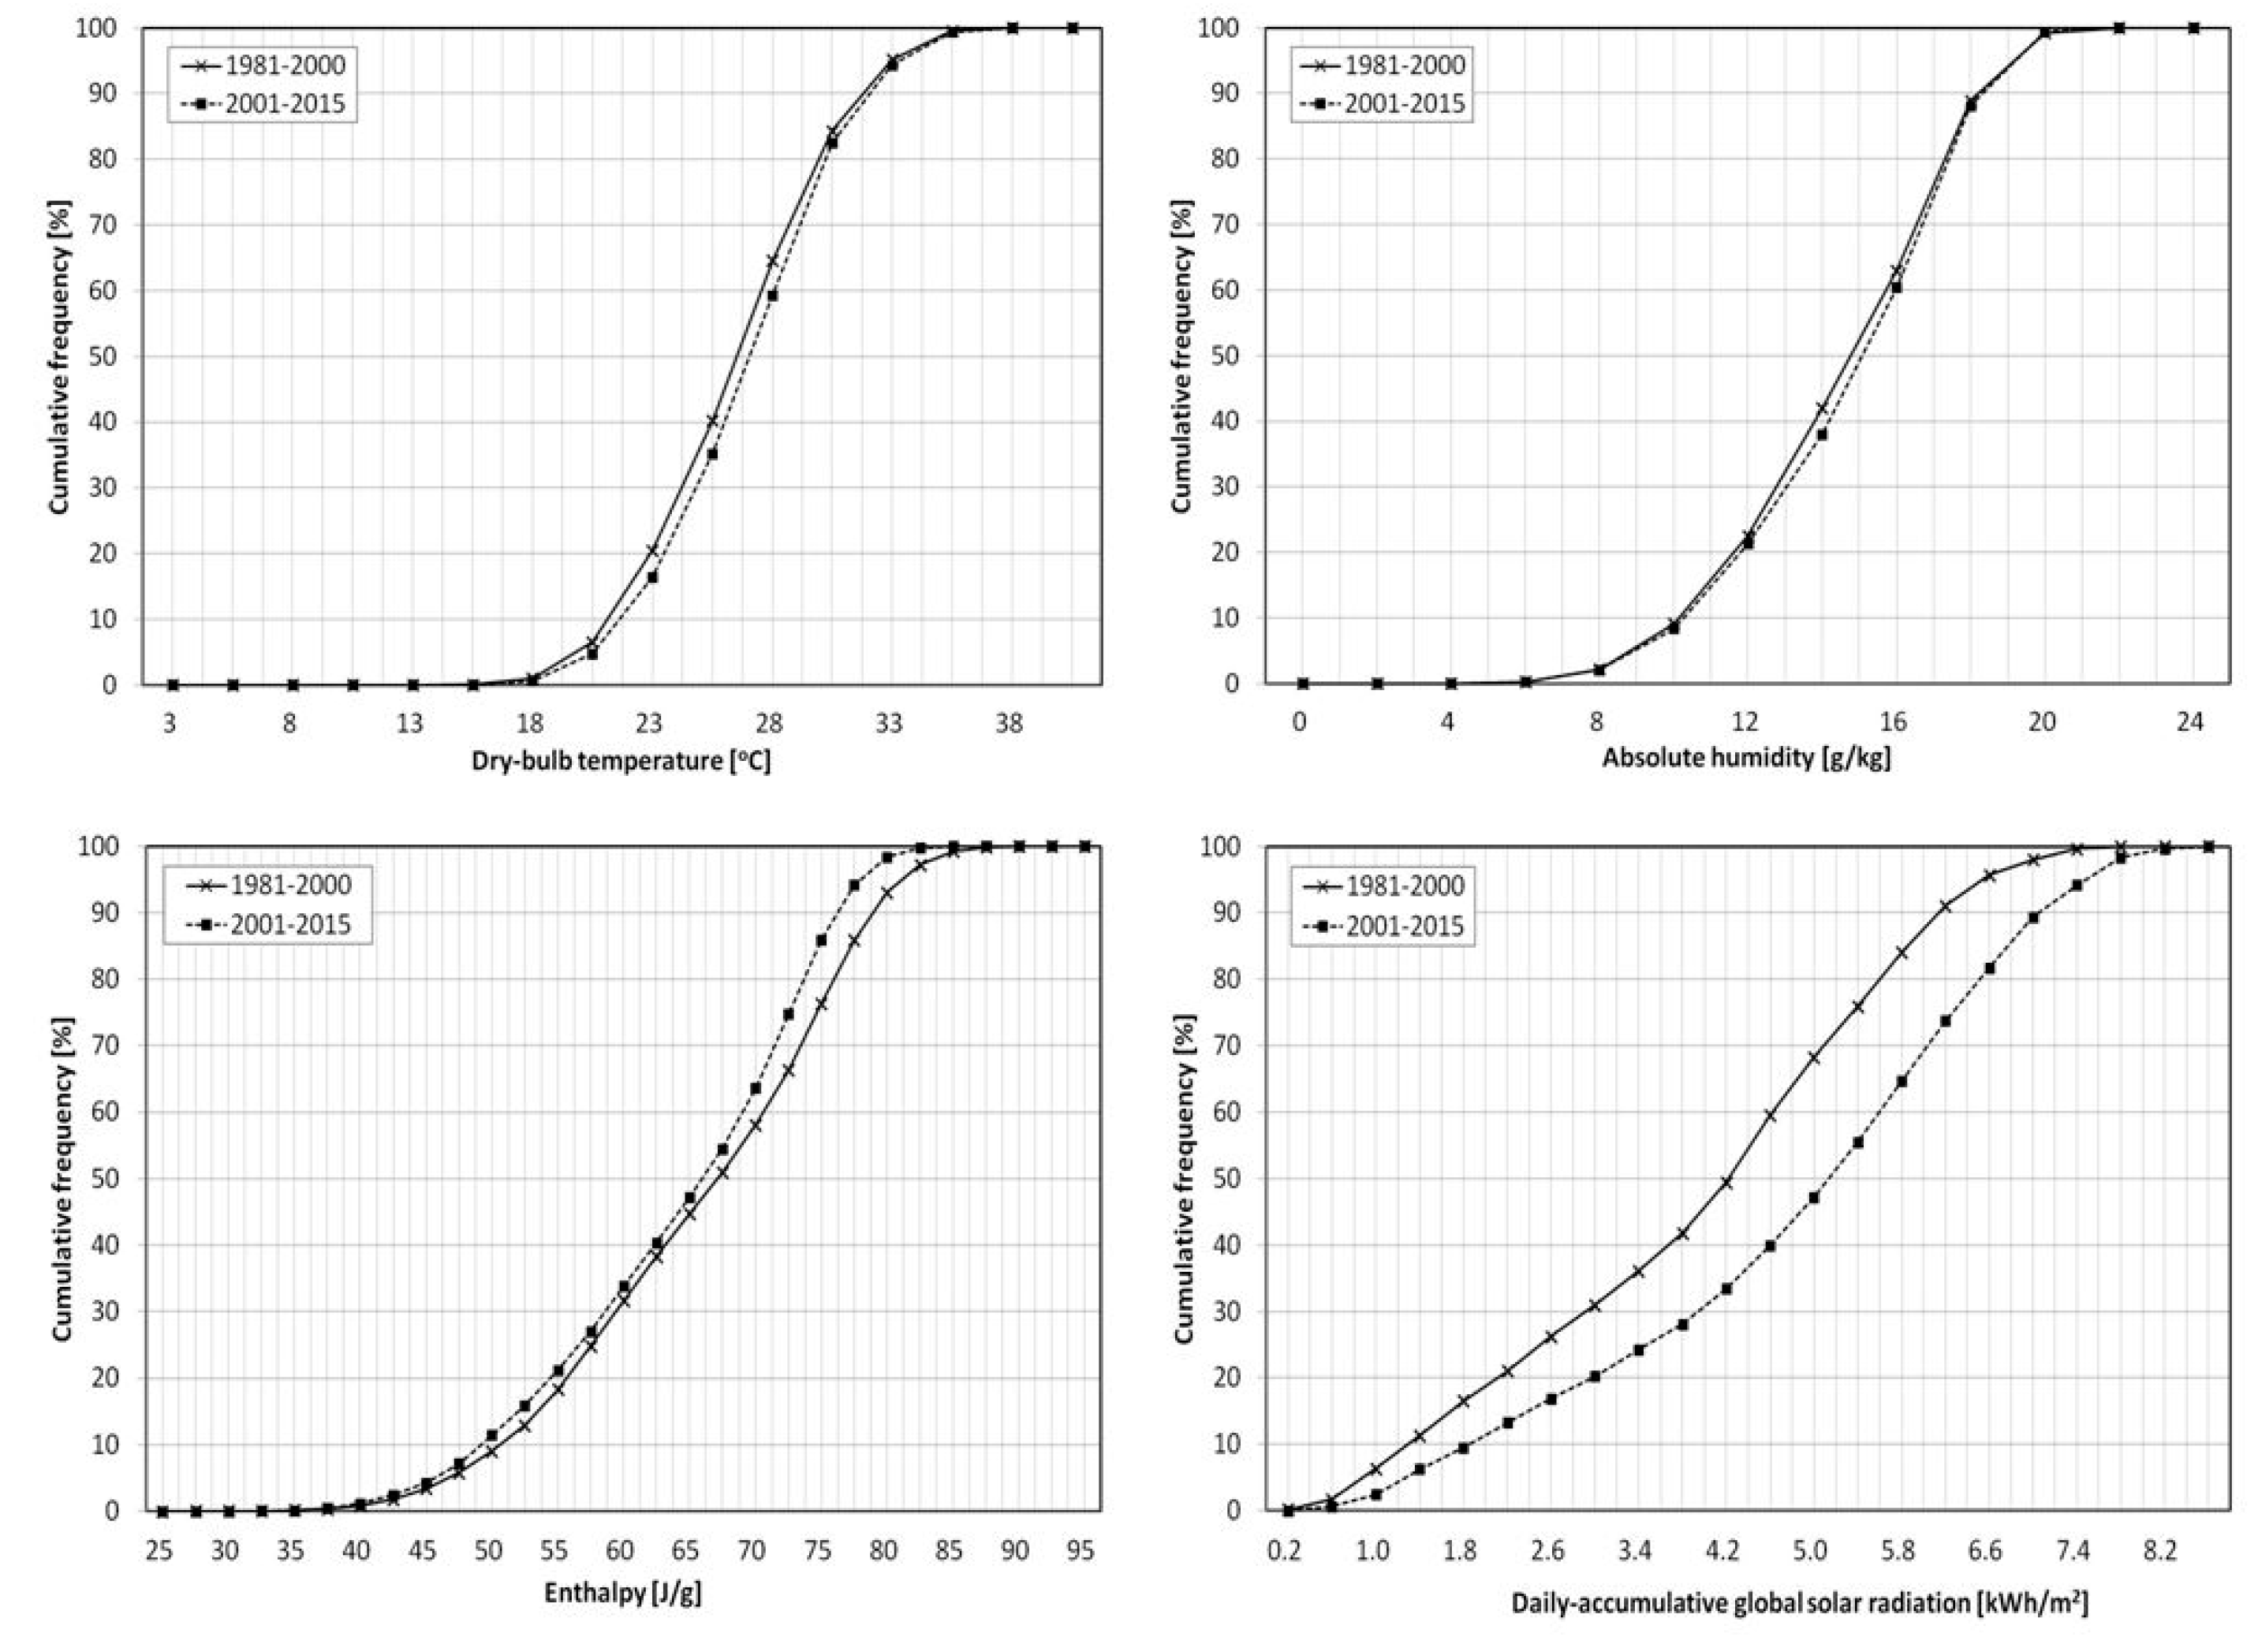
2. Analysis of Change in External Weather Data

External weather elements are changing as climate change continues. Changes in external weather data directly affect the HVAC design of buildings. In order to better understand the climate change effect, this study calculated and compared data from the original, older period (the 20 years from 1981 to 2000) with data from the new period (the 15 years from 2001 to 2015). The weather data used was JMA data for Osaka, Japan. The study examined the cumulative frequency distribution (CFD) of four main weather elements, namely the dry-bulb temperature, absolute humidity, enthalpy and horizontal global solar radiation. The comparison of the CFD analysis for these four main weather elements between the old period and new period for heating design and cooling design are shown in Figure 1 and Figure 2, respectively.
The comparison of the CFD analysis of the four weather elements showed that there is almost no significant difference between the old period and new period in terms of hourly dry-bulb temperature, hourly absolute humidity and hourly enthalpy for the heating period. However, most of the CFD curve for daily accumulative horizontal global solar radiation for the new data period during the heating period was shifted to the right of (greater than) the old data period. There was a maximum difference of about 0.6 kWh/m2 greater at the 79–80 percentile and about 0.1 kWh/m2 lower at the 2–3 percentile, compared to the old period. During the cooling period of the new data period, the maximum difference of the CFD for hourly dry-bulb temperature was about 1.3 °C higher at the 34–35 percentile, with almost no difference at the 97–98 percentile. The maximum difference of the CFD for hourly absolute humidity was about 0.7 g/kg higher at the 39–40 percentile, with almost no difference at the 97–98 percentile. The CFD for hourly enthalpy shifted to the left of (lower than) the old data period, with a maximum difference about 3.8 J/g lower at the 97–98 percentile. The maximum difference of the CFD for daily accumulative horizontal global solar radiation was about 1.0 kWh/m2 greater at the 60–61 percentile and about 0.8 kWh/m2 greater at the 97–98 percentile, compared to the old data period.
The change was larger for the cooling period than for the heating period, especially for the weather elements enthalpy and horizontal global solar radiation. Thus, it may be speculated that the design weather data for cooling design will be changed more than that for heating design, and the methods in which enthalpy and horizontal global solar radiation are used as indices of new design weather data for cooling design will show much larger changes than methods based on the other weather elements.

3. New Design Hourly Weather Data

3.1. Creation Method

Design hourly weather data using a new period of measured JMA weather data from 2001 to 2015 for Osaka, Japan was created in this study, according to the method of creating design weather data for HVAC design elaborated by Yuan et al.’s previous research [16]. This created design hourly weather data for HVAC design uses the hourly weather data for one day respectively for heating and cooling designs; eight methods were developed using two weather indices. In contrast to previous work, where the number of days on the record was 2425 for heating design and 2440 for cooling design over 20 years (1981–2000), the creation of the new design hourly weather data takes the mean daily dry-bulb temperature and the mean daily enthalpy over 15 years (2000–2015) as the first index. For heating design, the number of ranked days was 1818, from December to March for 15 years; for cooling design, the number of ranked days was 1830, from June to September for 15 years. The eight methods are detailed in Table A1 (see Appendix A).

3.2. Comparison with the Old Design Hourly Weather Data

Eight types of design hourly weather data for the old and new periods using two weather indices were created and shown in Figure 3 and Figure 4, respectively. The left side of each figure represents the design hourly weather data for the old period, and the right side of each figure represents the design hourly weather data for the new period.
Figure 3a,b show the four types of design hourly weather data—including hourly dry-bulb temperature, hourly absolute humidity, hourly enthalpy and hourly horizontal global solar radiation—for heating and cooling designs, respectively, using the mean daily dry-bulb temperature as the first index.
Figure 4a,b show the four types of design hourly weather data for heating and cooling designs, respectively, using the mean daily enthalpy as the first index.
Comparing the four weather elements with the old and new weather data for heating design using the two weather indices (see Figure 3a and Figure 4a), it can be seen that:
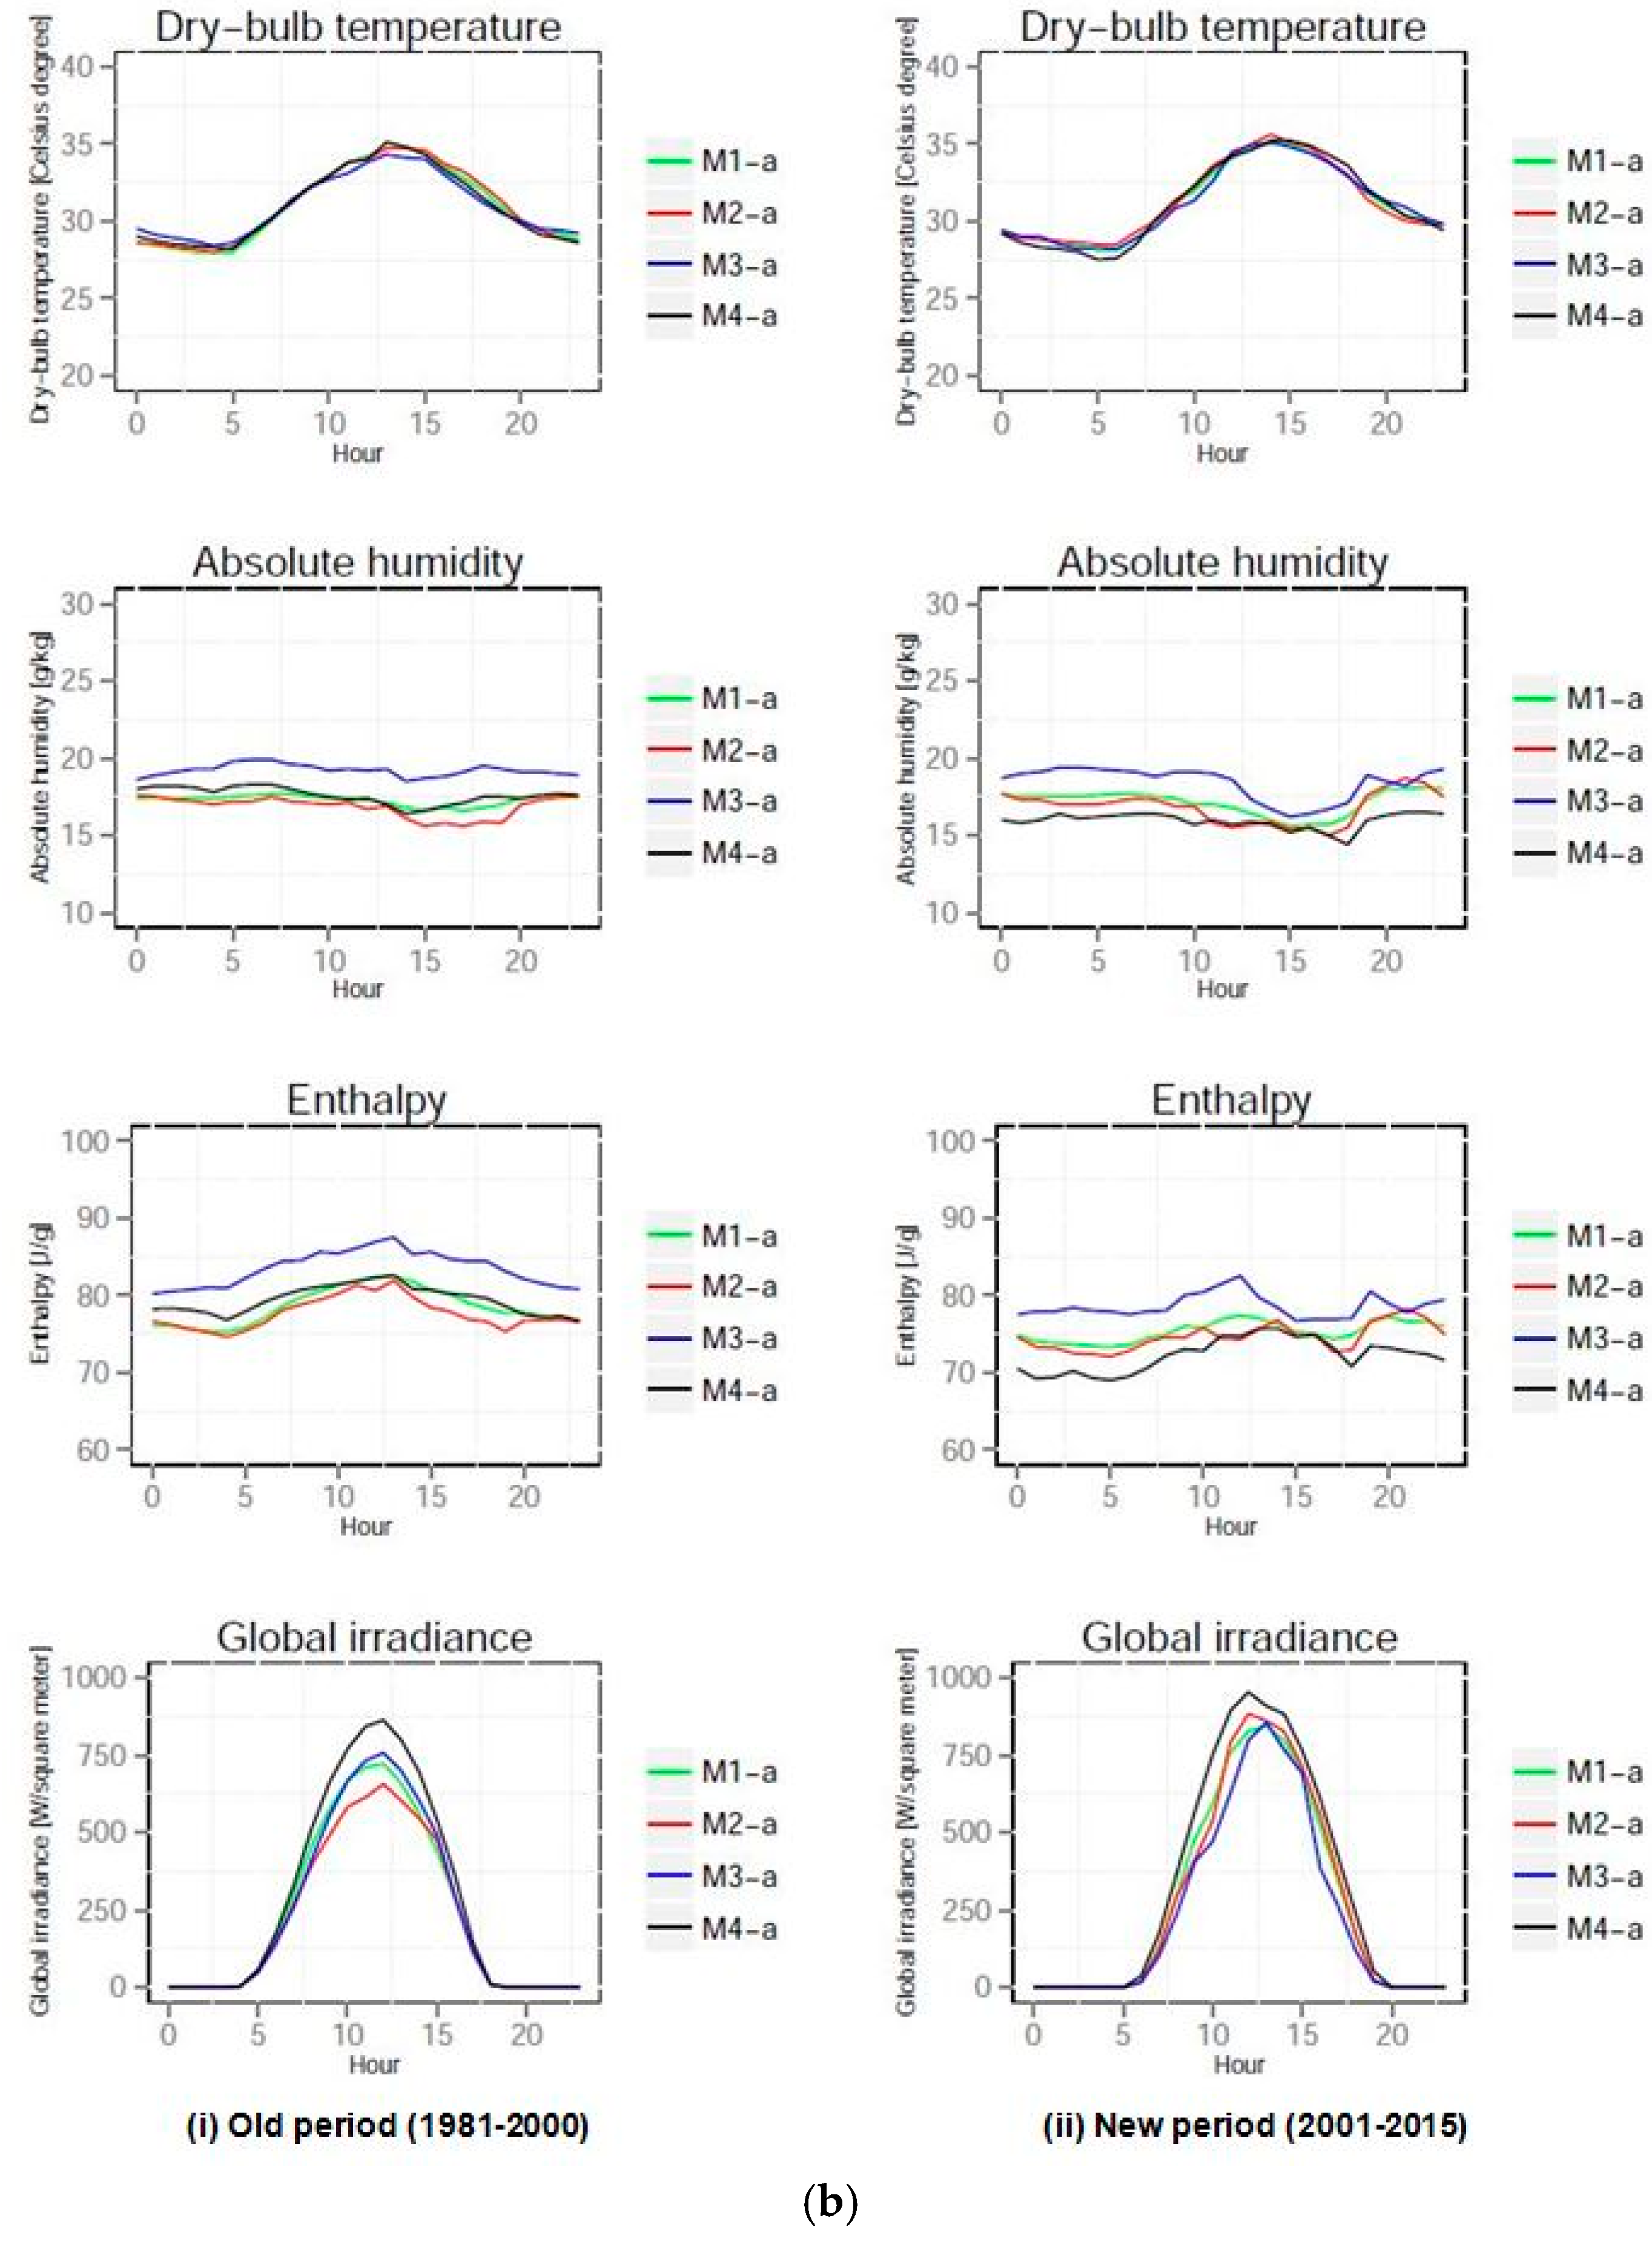
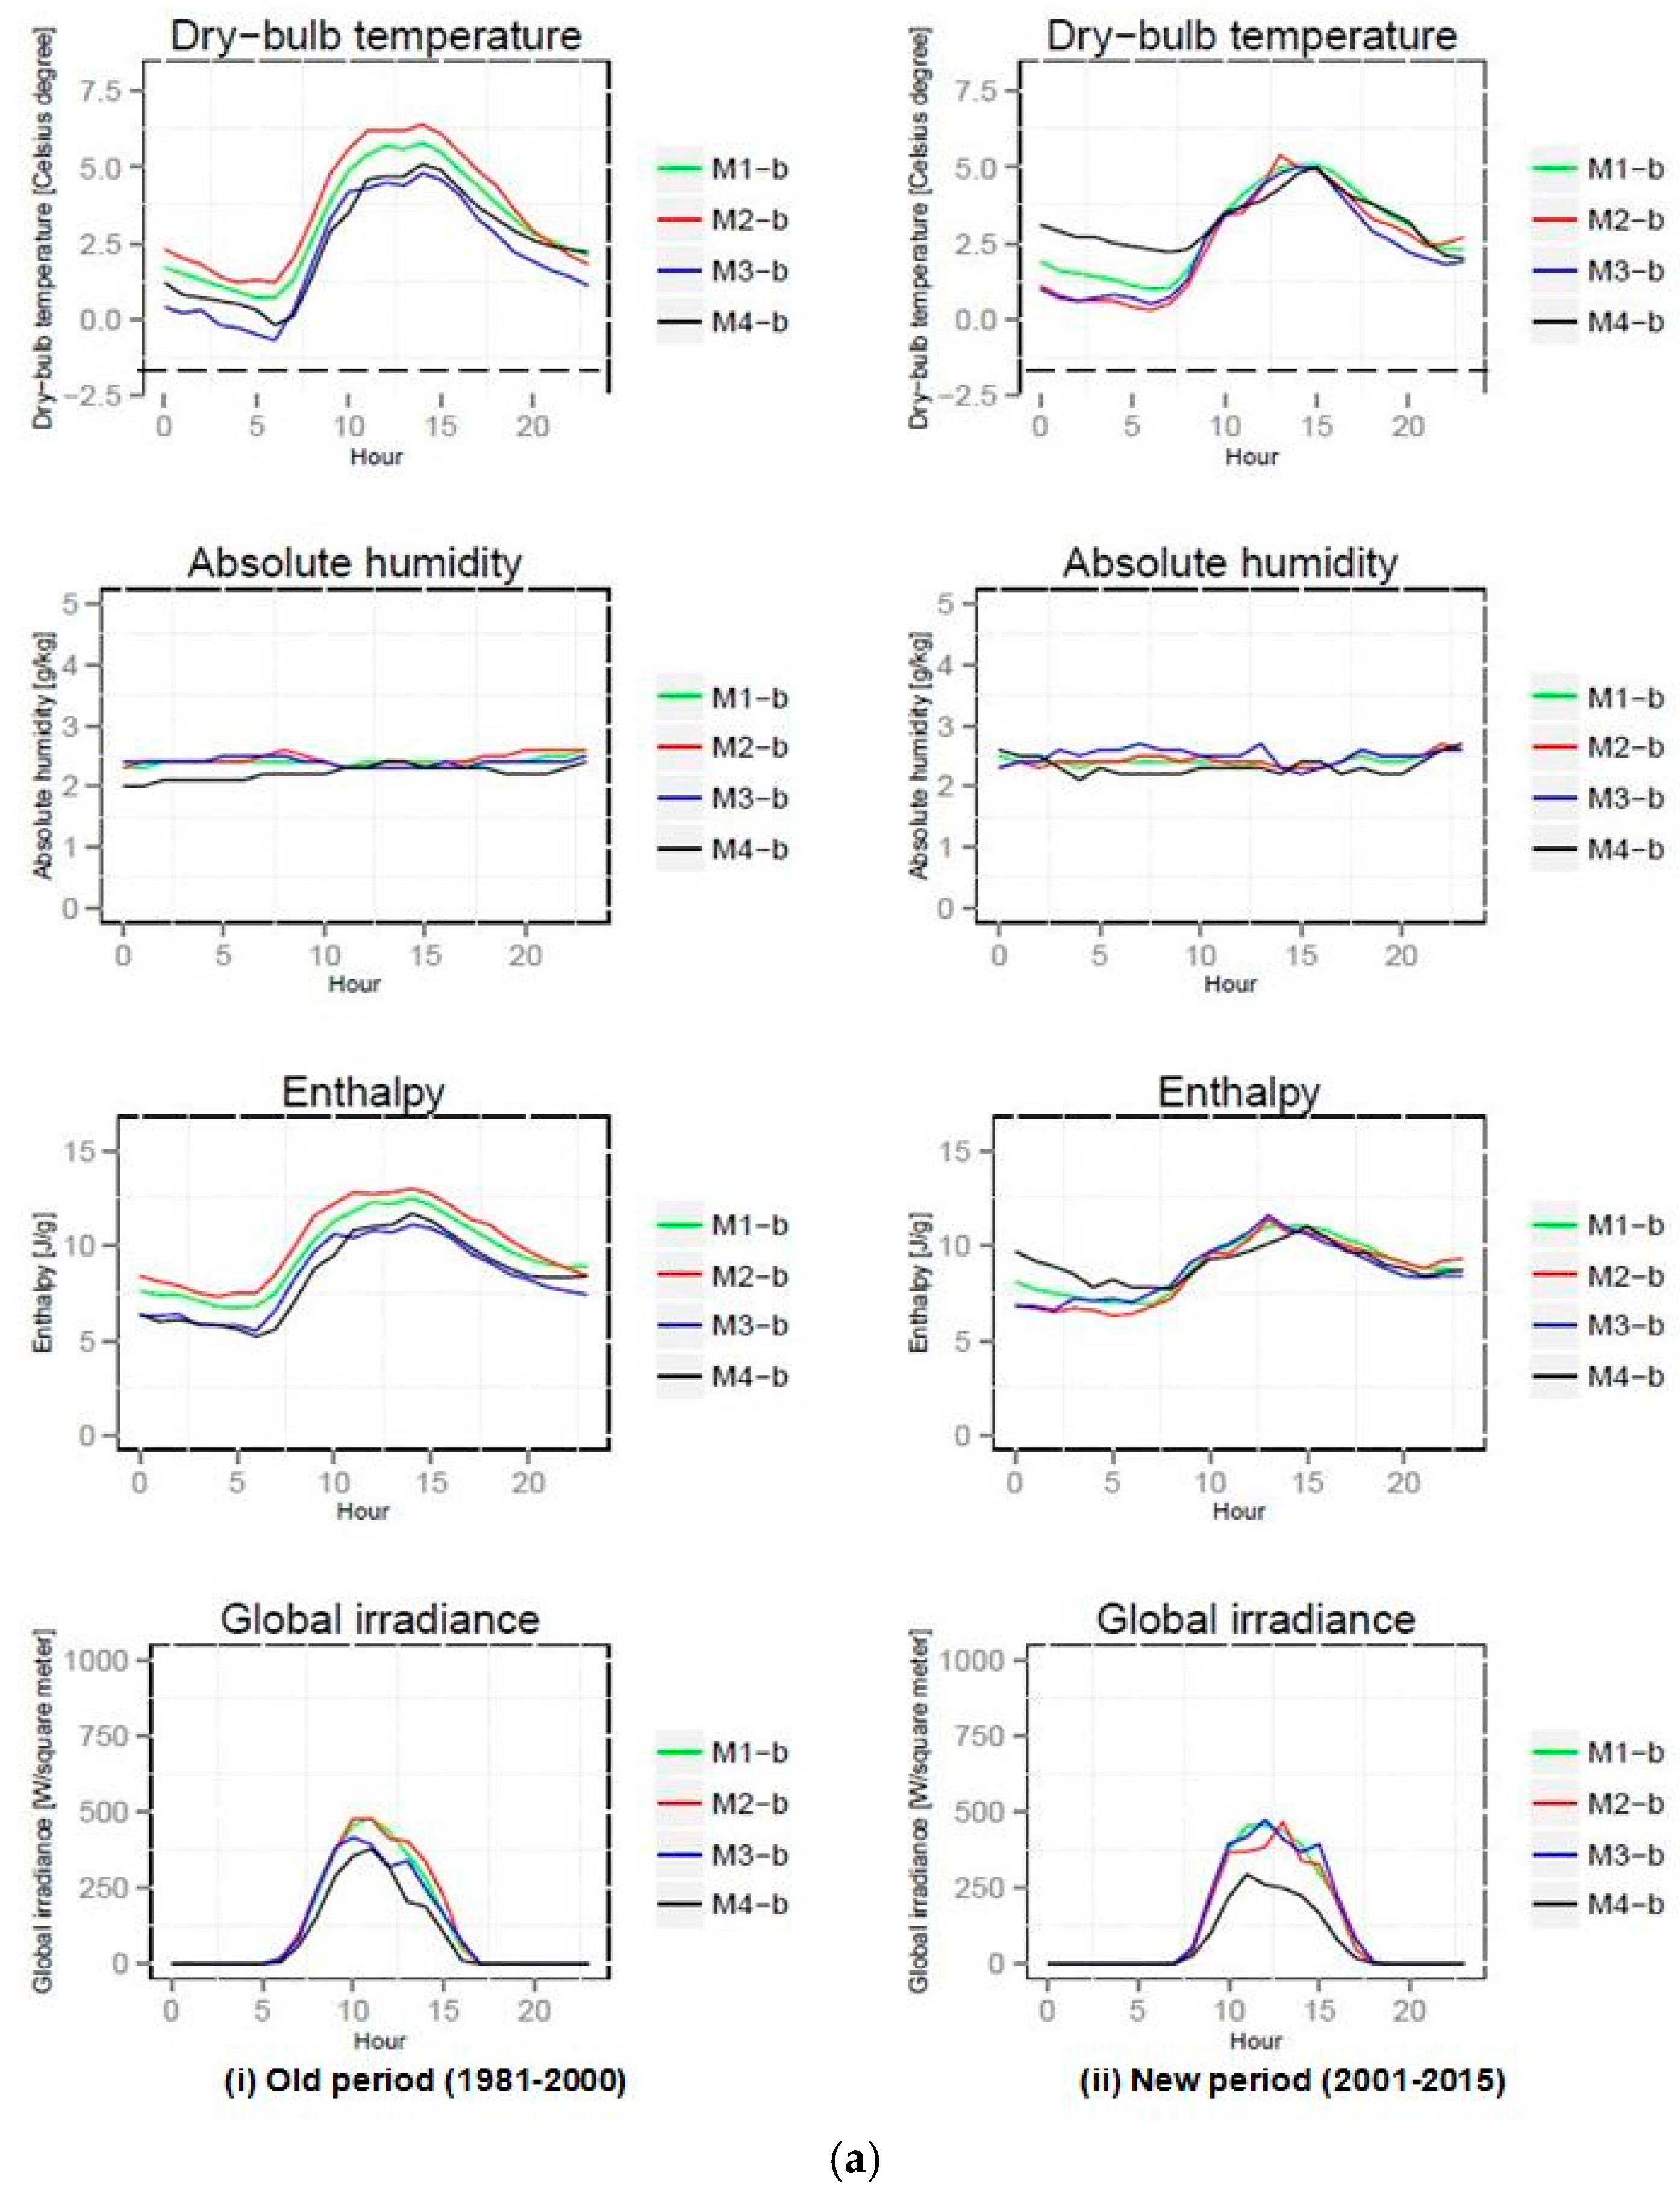
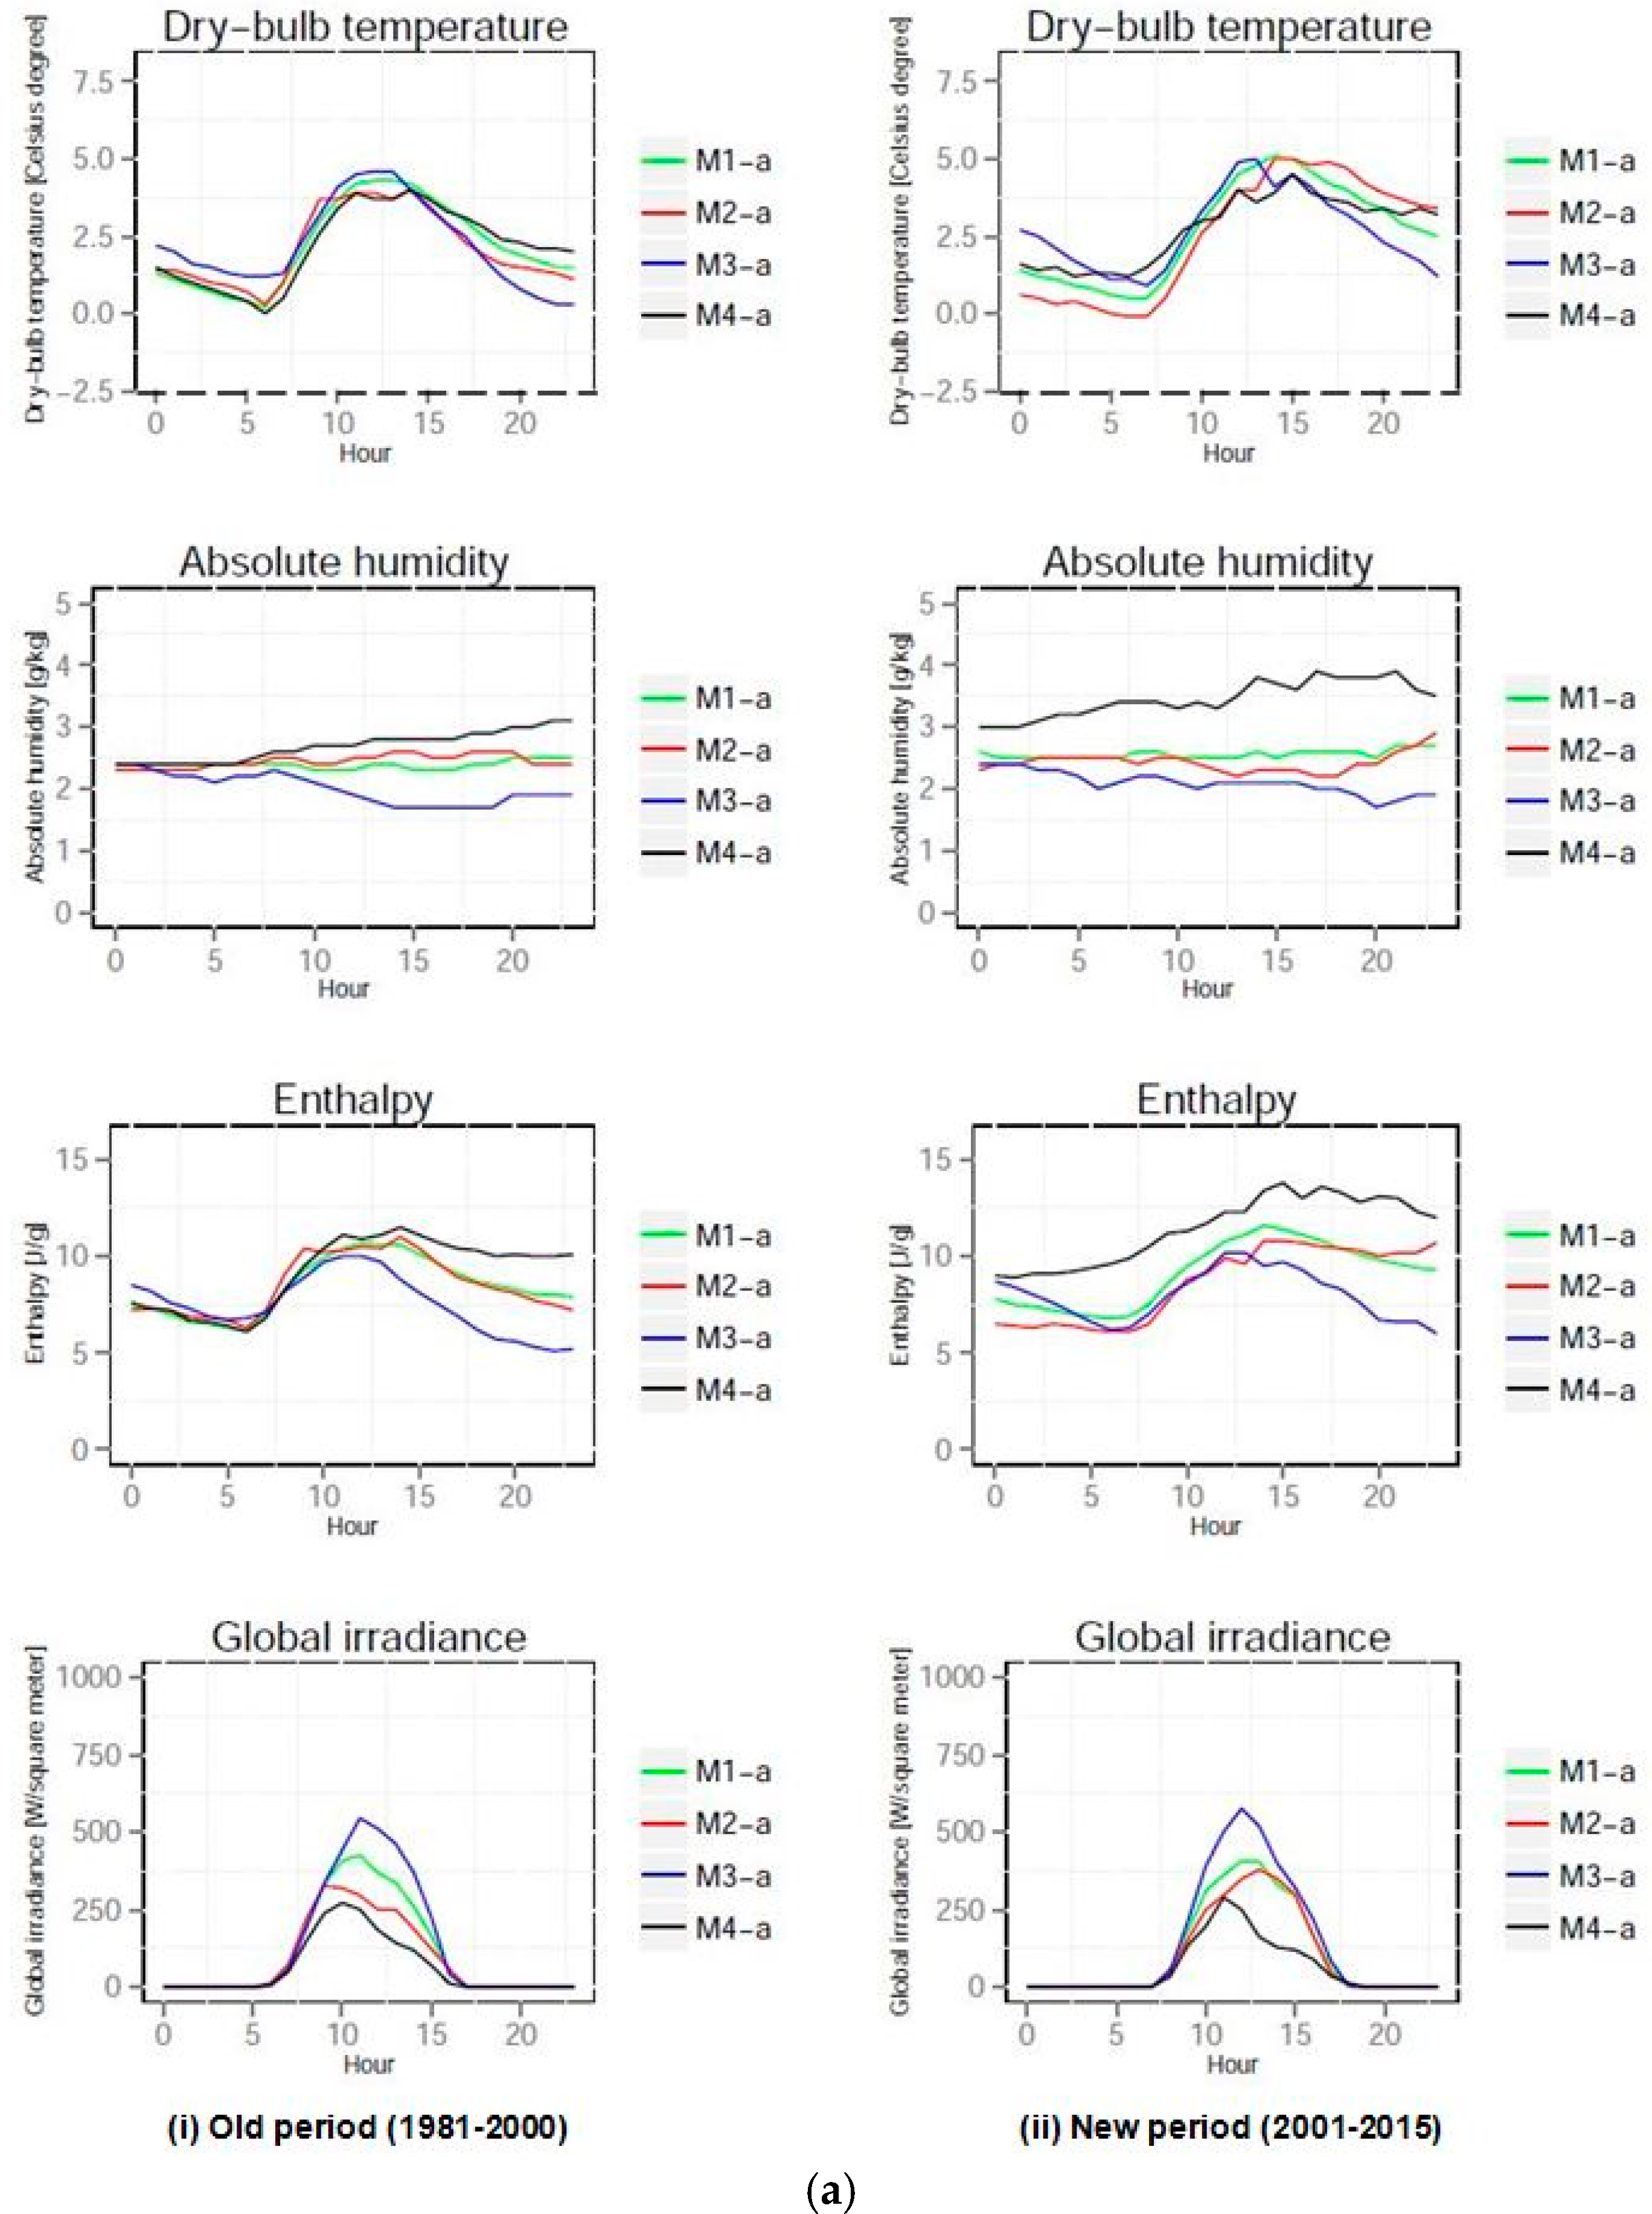
Comparing the new and old hourly dry-bulb temperature, some of the most apparent differences include: (i) the new design hourly weather data using the mean daily dry-bulb temperature as the first and second indices (M2-a in Figure 3a), yields an average of 0.7 °C lower temperature during the time period from 1:00 to 9:00 in the morning (i.e., the cooler winter days are trending towards having cooler nights and early mornings); (ii) the new design hourly weather data in all four methods using the mean daily dry-bulb temperature as the first index (M1-a, M2-a, M3-a, M4-a in Figure 3a), yields an average of 0.8 °C higher temperature during the time period from 15:00 to 24:00 in the afternoon (i.e., the cooler winter days trending towards having warmer evenings); (iii) the new design hourly weather data using the mean daily enthalpy as the first index and the mean daily accumulative horizontal global solar radiation as the second index (M4-b in Figure 4a), yields an average of 2.0 °C higher temperature during the time period from 1:00 to 9:00 in the morning (i.e., the lower enthalpy winter days on which there was less sunshine are trending towards having much warmer nights and early mornings, as clouds likely reduce radiant cooling); (iv) the new design hourly weather data using the mean daily enthalpy both as the first and second indices (M1-b, M2-b in Figure 4a), yields an average of 1.0 °C lower temperature throughout the day (i.e., the lower enthalpy winter days without considering sunshine or temperature are trending towards being cooler).
Comparing the new and old hourly absolute humidity: (i) the new design hourly weather data using the mean daily dry-bulb temperature as the first index and the mean daily accumulative horizontal global solar radiation as the second index (M4-a in Figure 3a), yields an average of 0.7 g/kg higher humidity throughout the day (i.e., the cooler winter days with less sunshine are trending towards being more humid); (ii) the new design hourly weather data using the mean daily enthalpy as the first index (M1-b, M2-b, M3-b, M4-b in Figure 4a), showed no significant change.
Comparing the new and old hourly enthalpy: (i) the new design hourly weather data using the mean daily dry-bulb temperature as the first index and the mean daily accumulative horizontal global solar radiation as the second index (M4-a in Figure 3a), yields an average of 1.3 J/g higher enthalpy throughout the day (i.e., the cooler winter days with less sunshine are trending towards having higher enthalpy); (ii) the new design hourly weather data using the mean daily enthalpy as the first index and the mean daily accumulative horizontal global solar radiation as the second index (M4-b in Figure 4a), yields an average of 2.0 J/g higher enthalpy during the time period from 1:00 to 9:00 in the morning (i.e., the winter days of lower enthalpy and less sunshine are trending towards having much higher enthalpy in the nights and early mornings); (iii) the new design hourly weather data using the mean daily enthalpy as the first and second indices (M1-b, M2-b in Figure 4a), yields an average of 2.0 J/g lower enthalpy throughout the day (i.e., the winter days of lower enthalpy without considering sunshine or temperature are trending towards having much lower enthalpy).
Comparing the new and old hourly horizontal global solar radiation: (i) the new design hourly weather data using the mean daily dry-bulb temperature as the first index and the mean daily enthalpy as the second index (M3-a in Figure 3a), yields an average of about 30 W/m2 higher global solar radiation at the daily peak value (i.e., the daily peak sunshine is trending towards being higher on the cooler, low enthalpy winter days); (ii) the new design hourly weather data using the mean daily enthalpy as the first index and the mean daily accumulative horizontal global solar radiation as the second index (M4-b in Figure 4a), yields an average of about 70 W/m2 lower global solar radiation at the daily peak value (i.e., the daily peak sunshine is trending towards being much lower on the low enthalpy, low sunshine winter days).
Comparing the four weather elements of the old and new design hourly weather data for cooling design using the two weather indices (see Figure 3b and Figure 4b), it can be seen that:
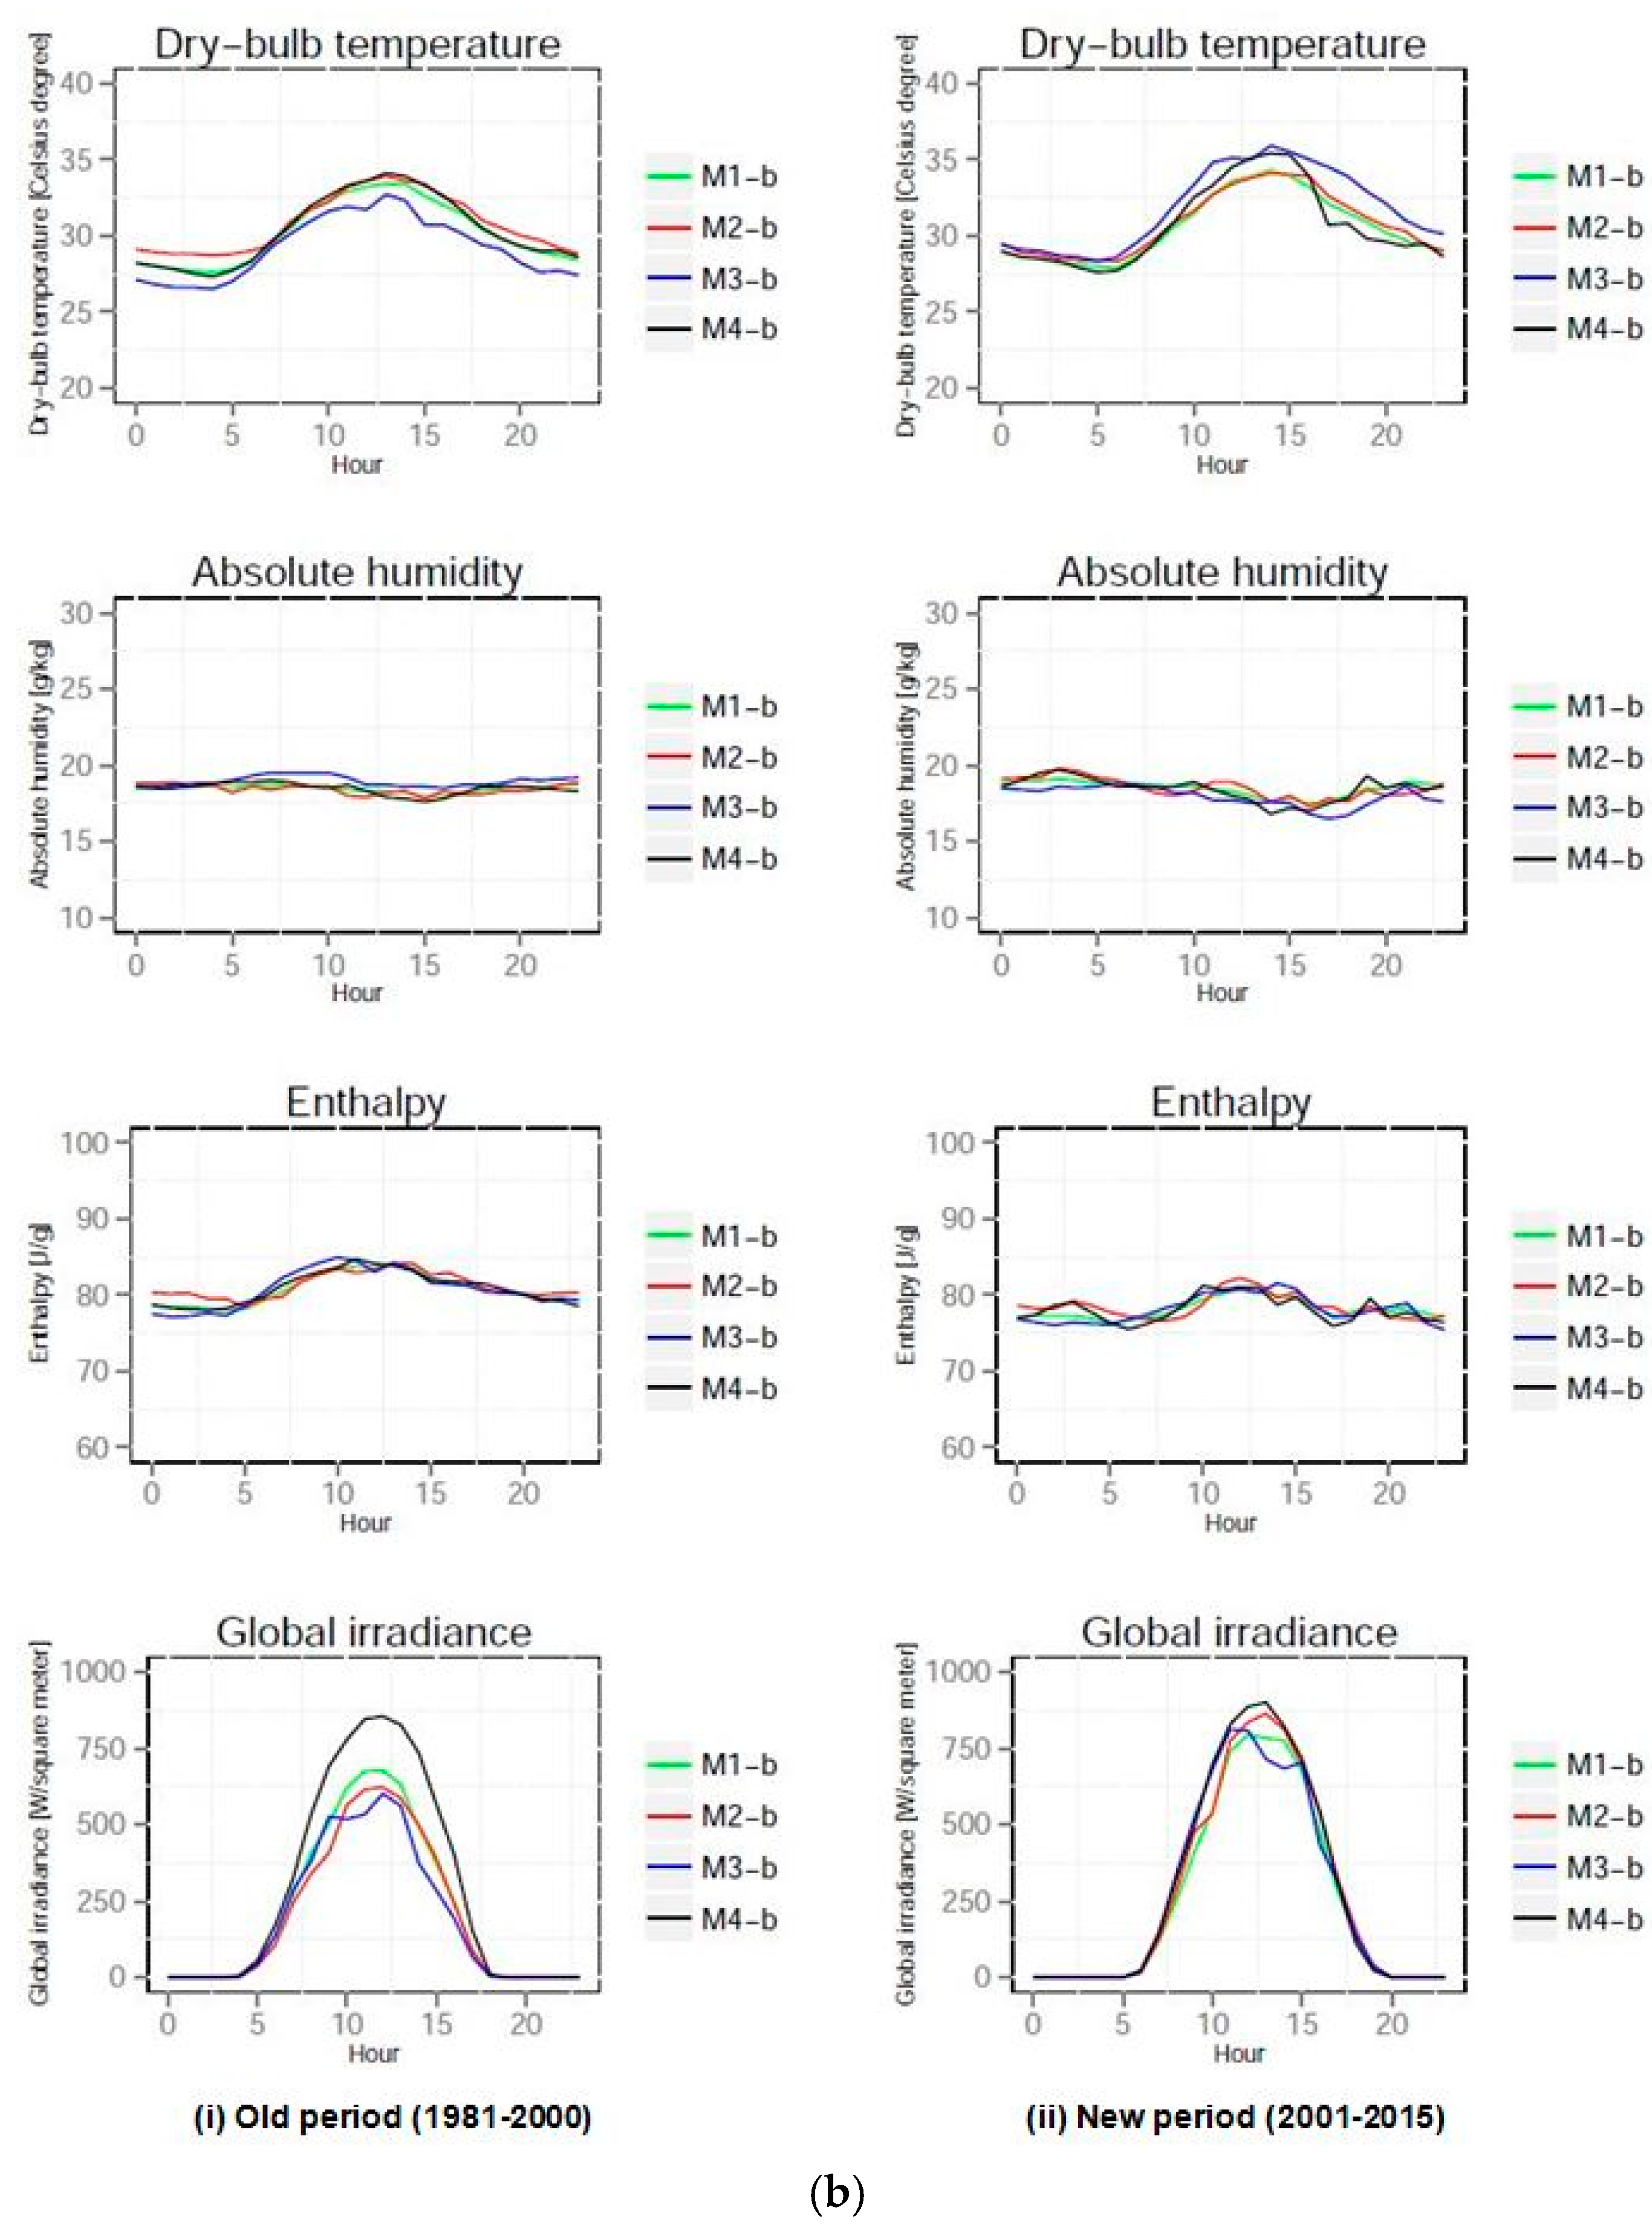
Comparing the new and old hourly dry-bulb temperature: (i) the new design hourly weather data using the mean daily dry-bulb temperature as the first index (M1-a, M2-a, M3-a, M4-a in Figure 3b), yields an average of about 0.8 °C higher temperature throughout the day (i.e., the hotter summer days without considering sunshine or enthalpy are trending towards being much hotter); (ii) the new design hourly weather data using the mean daily enthalpy as the first index (M1-b, M2-b, M3-b, M4-b in Figure 4b), yields an average of about 2.0 °C higher temperature throughout the day (i.e., the higher enthalpy summer days without considering sunshine or temperature are trending towards being much hotter).
Comparing the new and old hourly absolute humidity: (i) the new design hourly weather data using the mean daily dry-bulb temperature as the first index and the mean daily accumulative horizontal global solar radiation as the second index (M4-a in Figure 3b), yields an average of about 2.0 g/kg lower humidity throughout the day (i.e., the hotter summer days with greater sunshine are trending towards being less humid); (ii) the new design hourly weather data using the mean daily enthalpy as the first index (M1-b, M2-b, M3-b, M4-b in Figure 4b), has no significant change.
Comparing the new and old hourly enthalpy: (i) the new design hourly weather data using the mean daily dry-bulb temperature as the first index (M1-a, M2-a, M3-a, M4-a in Figure 3b), yields an average of about 5.0 J/g lower enthalpy throughout the day (i.e., the hotter summer days without considering sunshine or enthalpy are trending towards having much lower enthalpy); (ii) the new design hourly weather data using the mean daily enthalpy as the first index (M1-b, M2-b, M3-b, M4-b in Figure 4b), yields an average of about 3.0 J/g lower enthalpy throughout the day (i.e., the higher enthalpy summer days without considering sunshine or temperature are trending towards having much lower enthalpy).
Comparing the new and old hourly horizontal global solar radiation: (i) the new design hourly weather data using the mean daily dry-bulb temperature as the first index (M1-a, M2-a, M3-a, M4-a in Figure 3b), yields an average of about 100 W/m2 higher global solar radiation at the daily peak value (i.e., the daily peak sunshine is trending towards being much higher on the hot summer days); (ii) the new design hourly weather data using the mean daily enthalpy as the first index (M1-b, M2-b, M3-b, M4-b in Figure 4b), yields an average of about 120 W/m2 higher global solar radiation at the daily peak value (i.e., the daily peak sunshine is trending towards being much higher on the high enthalpy summer days).
From the analyzed results above, it was found that the change in weather elements for the cooling design showed a clear trend towards higher temperature, lower absolute humidity, lower enthalpy and stronger solar radiation, while the trends for the heating design are less clear. There is a fairly uniform trend towards higher enthalpy, while temperature trends vary by time of day, and solar radiation trends vary by index.
As the methods use only the dry-bulb temperature or enthalpy for the first index, by ranking the mean daily dry-bulb temperature and mean daily enthalpy of the heating and cooling periods with a frequency of occurrence between 2% to 3% (for heating) and between 97% and 98% (for cooling), the 2–3% and 97–98% data for the absolute humidity and horizontal global solar radiation CFDs are not necessarily being used here. The absolute humidity and horizontal global solar radiation data are taken from the historic data that match the 2–3% or 97–98% of the dry-bulb temperature or enthalpy.
To better understand the distribution of the actually-used data, we analyzed the averages and standard deviations of all four weather elements at the 2–3% and 97–98% levels of the two first indices. These are shown in Figure 5. It can be seen that:
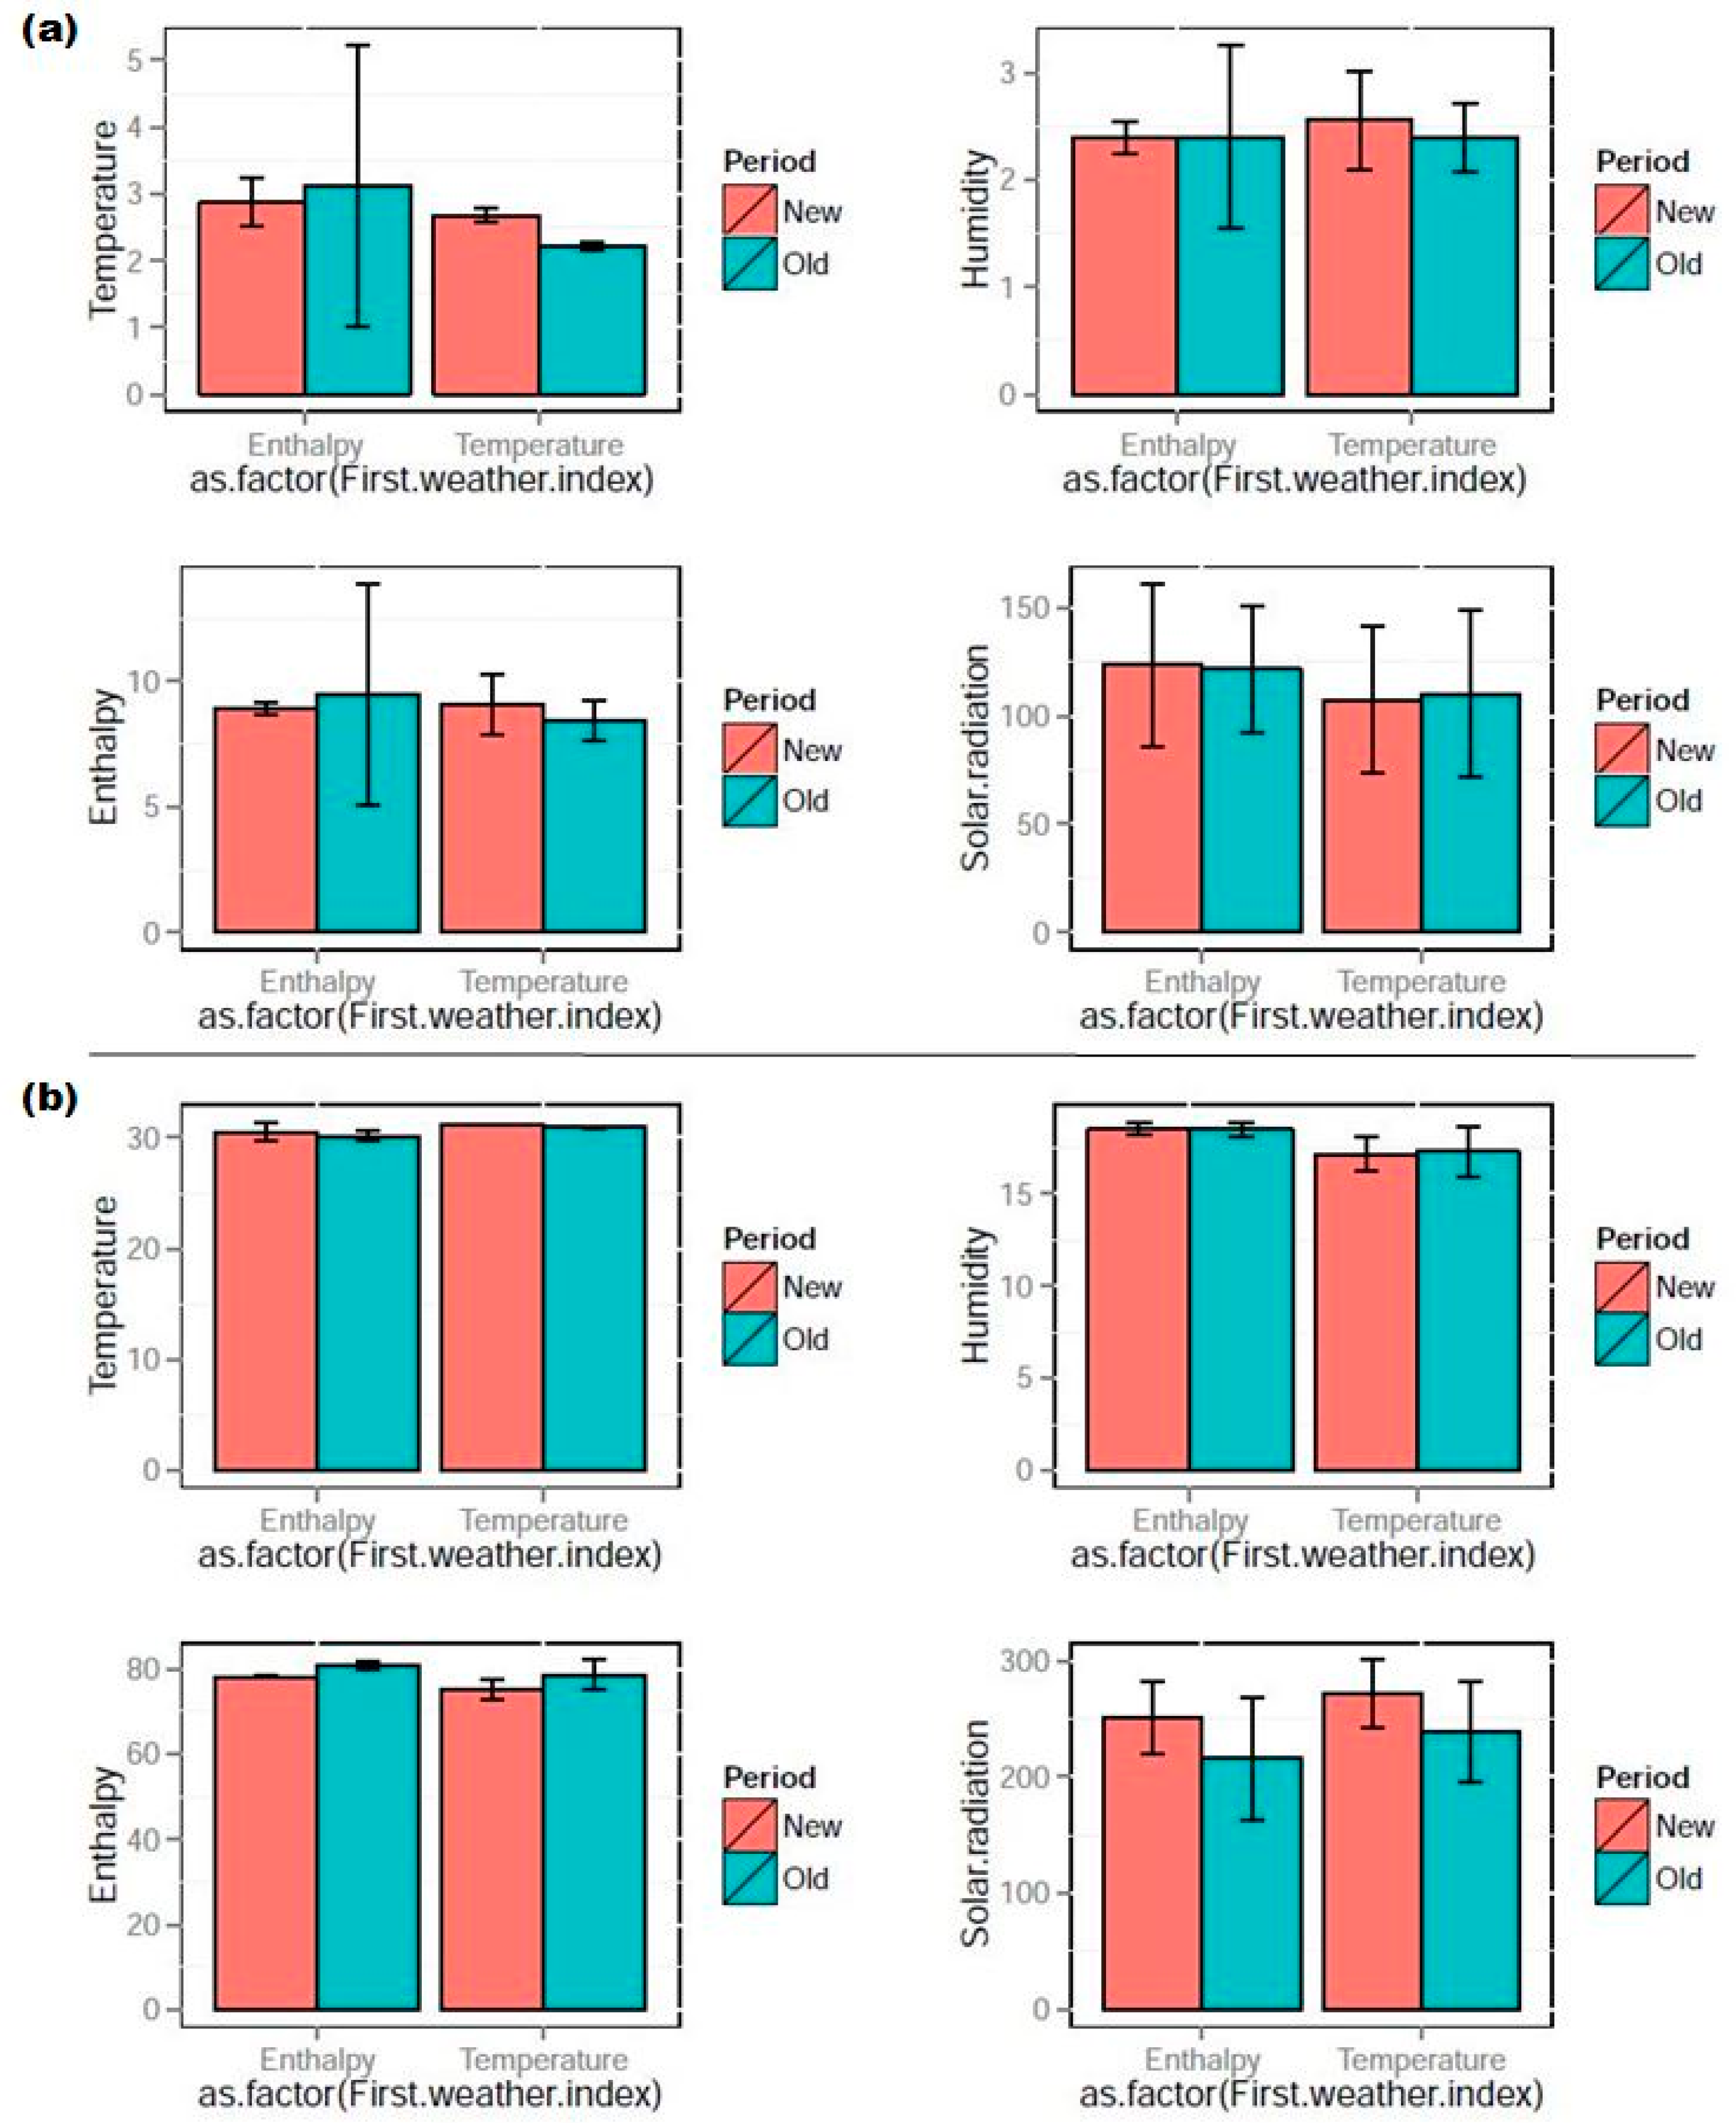
The variance among design hourly weather data with various methods for each weather element for heating design tends to be larger than that for cooling design.
The greater the standard deviation, the greater the difference among the design hourly weather data using the various methods. For example, the enthalpy showed much more variation in the old design weather data set for the heating period.

4. Calculation of Peak Thermal Loads Using Design Data

In order to determine the effect of recent climate change on this design hourly weather data, this study calculates the difference of peak outdoor air loads, which is directly related to the building thermal loads and the HVAC equipment capacity by inputting the old and new design hourly weather data.

4.1. Simulation

The simulation was carried out for a typical floor of an office building in Osaka, Japan with an air-conditioned area of 605 m2. The outdoor air load calculation is for a mid-level floor, not a ground floor or at roof level. Details of the simulated building and conditions of the outdoor air load calculation are shown in Table 1.

4.2. Outdoor Air Load Calculation

The outdoor air load for the heating design can be calculated depending on the dry-bulb temperature difference between the intake and exhaust of the external conditioner system, and the outdoor air load for the cooling design can be calculated depending on the enthalpy difference between the intake and exhaust of the external conditioner system.
Equations to derive the outdoor air loads of the simulated building for the heating and cooling designs are shown in the following,
Q h = 0.34 × A f a × | t a t s e t | / 1000
Q c = A f a × ρ 3600 × | h a h s e t |
where Qh is the heating load [kW], Qc is the cooling load [kW], Afa is the amount of fresh air [m3/h], ta is the outdoor dry-bulb temperature [°C], tset is the setting indoor dry-bulb temperature [°C], ha is the outdoor enthalpy [kJ/kg(DA)], hset is the setting indoor enthalpy [kJ/kg(DA)] and ρ is the air density [kg/m3], here held constant at 1.2 kg(DA)/m3.
In addition to using the above formula to calculate the outdoor air load of buildings, a commercial software “Heating, Air-Conditioning, and Sanitary Engineers Program for Education and Experience (HASPEE_1.0.3)”, which is commonly used to calculate the hourly thermal load of buildings in Japan, was also used to calculate the outdoor air load of the simulated building in this study [16,18].

4.3. Results and Discussion

The peak outdoor air loads for the heating and cooling designs calculated using the old and new design hourly weather data are shown in Figure 6 and Figure 7, respectively. They show that the peak outdoor air loads calculated by the normal formula and HASPEE_1.0.3 are almost the same. The difference between them is within 1.0 W/m2.
The difference of peak outdoor air load for the heating design between the old and new design hourly weather data (Figure 6) varied from an increase of 0.8 W/m2 to a decrease of 1.9 W/m2. The maximum difference of peak outdoor air load for the heating design, a decrease of about 1.9 W/m2, was found by means of the method using the mean daily enthalpy as the first index and the mean daily accumulative global solar radiation as the second index (M4-b). The design hourly weather data using M4-b showed a trend to much warmer nights and early mornings. The minimum absolute difference of peak outdoor air load for heating design was a decrease of about 0.2 W/m2, by means of the method using the mean daily dry-bulb temperature both as the first and second indices (M1-a). The design hourly weather data using M1-a showed a trend towards warmer evenings, but much of this would be later than the time at which the model heating hours shut off, namely at 18:00.
The peak outdoor air load for the cooling design between the old and new design hourly weather data (Figure 7) all decreased, varying from 1.8 to 6.0 W/m2. The maximum decrease of peak outdoor air load for the cooling design of about 6.0 W/m2 was found by means of the method using the mean daily dry-bulb temperature as the first index and the mean daily accumulative global solar radiation as the second index (M4-a). The design hourly weather data trend was towards higher temperatures and peak solar radiation, but lower absolute humidity and enthalpy. The minimum decrease of the peak outdoor air load for the cooling design of about 1.8 W/m2 was found by means of the method using the mean daily enthalpy both as the first and second indices (M2-b). The design hourly weather data trend was towards lower enthalpy.
From the results above, we can see that the difference in peak outdoor air load between the old and new design hourly weather data for the cooling design was a larger absolute change, with a greater variance than that for the heating design. The cooling peak loads trended lower for all eight methods, while the heating peak loads increased in two cases and decreased in six cases.
The two heating design results that showed increasing load used the methods M2-a and M2-b. Both of these methods are based on averaging the three most extreme days from the first weather index (of 2–3%). As opposed to M1-a and M1-b, which use the average of all 19 days in the 2–3% set. The smallest set of three days is more likely to yield greater variation than the set based on 19 days. The greatest change in the heating design results was for methods M4-a and M4-b, both using solar radiation as the second weather index. Solar radiation showed a relatively large increase in the old and new climate data, which should reduce the heating load. Despite this, M2-a and M2-b show an increase, suggesting they may not be realistic, or that enthalpy and other trends outweigh the solar radiation trends in this model, which was for a mid-level floor of a building, and thus did not include roof thermal exchange.

5. Conclusions and Future Research

To examine the influence of recent climate change on the design hourly weather data for HVAC design, new design hourly weather data was created using more recently measured JMA weather data (the 15 years from 2001 to 2015) and compared this data to the old data created using the period from 1981 to 2000. Furthermore, the difference of peak outdoor air loads—which is directly related to the building thermal loads and the HVAC equipment capacity—were compared using the old and new design hourly weather data for eight methods. The obtained knowledge is summarized as follows.
Comparing the change in CFD for the four main weather elements, including dry-bulb temperature, absolute humidity, enthalpy and horizontal global solar radiation between the old (1981–2000) and new (2001–2015) periods, showed that the change in the weather elements was larger in magnitude and variance in the cooling period than in the heating period, especially for hourly enthalpy and daily accumulative horizontal global solar radiation.
Comparing the old and new design hourly weather data for HVAC design, we can see that the change in the weather elements for the cooling design was clearly towards warmer and drier weather, with lower enthalpy and stronger solar radiation. The trend for the heating design was less clear, but mainly showed higher enthalpy.
Among all the methods for creating design hourly weather data proposed in our study, we found that the method M4-b—using mean daily enthalpy as the first index and mean daily accumulative global solar radiation as the second index—yielded the maximum difference of peak outdoor air load. The method M1-a—using mean daily dry-bulb temperature both as the first and second indices—yielded the minimum difference of peak outdoor air load for the heating design. The method M4-a—using mean daily dry-bulb temperature as the first index and the mean daily accumulative global solar radiation as the second index—yielded the maximum difference in peak outdoor air load. The method M2-b—using mean daily enthalpy both as the first and second indices—yielded the minimum difference in peak outdoor air load for the cooling design.
The findings of this study demonstrate the need for a continuous update of the existing design hourly weather data files that are used in dynamic simulations or for the prediction of the peak thermal loads of buildings, as this affects the capacity of HVAC equipment to respond to current climate change.
Future research will be focused on: (i) the continuous updating of the newly developed design hourly weather data for building energy conservation and HVAC design as the climate changes; (ii) the application of the newly developed design hourly weather data to actual building energy conservation and HVAC design, and comparison with existing methods; (iii) the worldwide extension of the newly developed design hourly weather data; (iv) the clarification of what kind of HVAC equipment selection best matches each kind of design hourly weather data; (v) the creation of a seven-day weather day set for HVAC design and the examination of its suitability.

Author Contributions

Jihui Yuan designed this research and collected the data for the analysis; Jihui Yuan, Kazuo Emura and Craig Farnham proposed the analysis method; Jihui Yuan computed the design weather data and wrote the paper; Craig Farnham (native English speaker) checked the content.

Conflicts of Interest

The authors declare that there is no conflict of interest with respect to the research, authorship, and/or publication of this article.

Appendix A

8 Methods to create new design hourly weather data for HVAC design (heating and cooling designs) are from previous research [16].
Table A1. Methods to create new design hourly weather data for HVAC design.
Data Source: EA data for Osaka, Japan of 15 years (2001–2015)
Heating Period: December-March; Cooling Period: June-September
The First IndexMethods (the Second Index)
▪ First index: Mean daily dry-bulb temperature of 15 years (1830 days for summer period; 1818 days for winter period)
▪ Selected day: The 19 days with frequency of occurrence between the top 2% to 3% were selected by ranking the value of the first index
M1-a: The 19 days with frequency of occurrence between 2% to 3% for heating(h*) and between 97% to 98% for cooling(c*) were selected by ranking the value of the first index
M2-a: Three days with the lowest h* and highest c* mean daily dry-bulb temperature are selected from the 19 days of the first index
M3-a: Three days with the lowest h* and highest c* mean daily enthalpy selected from the 19 days of the first index
M4-a: Three days with the lowest h* and highest c* mean daily cumulative horizontal global solar radiation are selected from the 19 days of the first index
▪ First index: Mean daily enthalpy of 15 years (1830 days for summer period; 1818 days for winter period)
▪ Selected day: The 19 days with frequency of occurrence between the top 2% to 3% were selected by ranking the value of the first index
M1-b: The 19 days with frequency of occurrence between the top 2% to 3% h* and between 97% to 98%c* were selected by ranking the value of the first index
M2-b: Three days with the lowest h* and highest c* mean daily enthalpy are selected from the 19 days of the first index
M3-b: Three days with the lowest h* and highest c* mean daily dry-bulb temperature are selected from the 19 days of the first index
M4-b: Three days with the lowest h* and highest c* mean daily cumulative horizontal global solar radiation are selected from the 19 days of the first index
(M: Method).

References

  1. Loeb, N.G.; Lyman, J.M.; Johnson, G.C.; Allan, R.P.; Doelling, D.R.; Wong, T.; Soden, B.J.; Stephens, G.L. Observed changes in top-of-the-atmosphere radiation and upper-ocean heating consistent within uncertainty. Nat. Geosci. 2012, 5, 110–113. [Google Scholar] [CrossRef]
  2. Stephens, G.L.; Li, J.; Wild, M.; Clayson, C.A.; Loeb, N.; Kato, S.; L’Ecuyer, S.; Stackhouse, P.E., Jr.; Lebsock, M.; Andrews, T. An update on Earth’s energy balance in light of the latest global observations. Nat. Geosci. 2012, 5, 691–696. [Google Scholar] [CrossRef]
  3. National Science and Technology Council, the U.S. Climate Change Science Program (CCSP). Effects of Climate Change on Energy Production and Use in the United States. Part of a Series of Synthesis and Assessment Products Produced by the CCSP; January 2008. Available online: https://science.energy.gov/~/media/ber/pdf/Sap_4_5_final_all.pdf (accessed on 15 June 2017).
  4. Pérez-Lombard, L.; Ortiz, J.; Pout, C. A review on buildings energy consumption information. Energy Build. 2008, 40, 394–398. [Google Scholar] [CrossRef]
  5. Agency for Natural Resources and Energy. Energy in Japan. 2013. Available online: http://www.enecho.meti.go.jp/en/ (accessed on 17 June 2017).
  6. The Society of Heating, Air-conditioning and Sanitary Engineers (SHASE). Handbook of Heating, AC and Sanitary; Version 13; SHASE: Tokyo, Japan, 2016; Volume 3. (In Japanese) [Google Scholar]
  7. Takeda, H. Tokyo weather data for air-conditioning: Part 1-outdoor design conditions for heating and cooling loads by T.A.C. method. Trans. Soc. Heat. Air-Cond. Sanit. Eng. Japan 1989, 41, 105–115. (In Japanese) [Google Scholar] [CrossRef]
  8. Takizawa, H. Micro-peak program. In SHASE Symposium ‘Thermal Load and Software’; SHASE: Tokyo, Japan, 1989; pp. 13–24. (In Japanese) [Google Scholar]
  9. Okuda, Y.; Ikezawa, H. Simulation analysis of outdoor conditions for heating design. Trans. Soc. Heat. Air-Cond. Sanit. Eng. Japan 1978, 8, 11–22. (In Japanese) [Google Scholar]
  10. Colliver, D.G.; Gates, R.S.; Zhang, H.; Priddy, K.T. Sequences of extreme temperature and humidity for design calculations. ASHRAE Trans. 1998, 104, 133. [Google Scholar]
  11. Ishino, H. Proposal of Seven-Day Design Weather Data for HVAC Peak Load Calculation. In Proceedings of the 9th International Building Performance Simulation Association Conference, Montreal, QC, Canada, 15–18 August 2005; pp. 451–458. [Google Scholar]
  12. Wang, L.; Liu, X.; Brown, H. Prediction of the impacts of climate change on energy consumption for a medium-size office building with two climate models. Energy Build. 2017, 157, 218–226. [Google Scholar] [CrossRef]
  13. Nik, V.M. Application of typical and extreme weather data sets in the hygrothermal simulation of building components for future climate—A case study for a wooden frame wall. Energy Build. 2017, 154, 30–45. [Google Scholar] [CrossRef]
  14. Pyrgou, A.; Castaldo, V.L.; Pisello, A.L.; Cotana, F.; Santamouris, M. Differentiating responses of weather files and local climate change to explain variations in building thermal-energy performance simulations. Solar Energy 2017, 153, 224–237. [Google Scholar] [CrossRef]
  15. Pernigotto, G.; Prada, A.; Cappelletti, F.; Gasparella, A. Influence of the Representativeness of Reference Weather Data in Multi-objective Optimization of Building Refurbishment. In Proceedings of the 14th International Conference of the International Building Performance Simulation Association, Hyderabad, India, 7–9 December 2015; pp. 2857–2864. [Google Scholar]
  16. Yuan, J.; Emura, K.; Farnham, C.; Lu, S.; He, C. The creation of weather data for AC design using two weather indices for Osaka. Energy Build. 2017, 134, 248–258. [Google Scholar] [CrossRef]
  17. Japan Weather Agency. Expanded AMeDAS Weather Data. 2013. Available online: http://www.jma.go.jp/amedas/ (accessed on 17 June 2017).
  18. The Society of Heating, Air-Conditioning and Sanitary Engineers of Japan (SHASEJ). HASPEE_1.0.3. Manual. 2013. Available online: http://www.shasej.org/ (accessed on 13 September 2016).
Figure 1. Comparison of the CFD of hourly dry-bulb temperature, hourly absolute humidity, hourly enthalpy and daily accumulative horizontal global solar radiation for the heating period (December to March) between the old period (1981–2000) and the new period (2001–2015).
Sustainability 10 00861 g001
Figure 2. Comparison of the CFD of hourly dry-bulb temperature, hourly absolute humidity, hourly enthalpy and daily accumulative horizontal global solar radiation for the cooling period (June to September) between the old period (1981–2000) and the new period (2001–2015).
Sustainability 10 00861 g002
Figure 3. (a) Design hourly weather data of the old (left); and new (right) periods for heating design, using the mean daily dry-bulb temperature as the first index. (b) Design hourly weather data of the old (left); and new (right) periods for cooling design, using the mean daily dry-bulb temperature as the first index.
Sustainability 10 00861 g003aSustainability 10 00861 g003b
Figure 4. (a) Design hourly weather data of the old (left) and new (right) periods for heating design, using the mean daily enthalpy as the first index. (b) Design hourly weather data of the old (left) and new (right) periods for cooling design, using the mean daily enthalpy as the first index.
Sustainability 10 00861 g004aSustainability 10 00861 g004b
Figure 5. The averages and standard deviations of all four weather elements at (a) the 2–3% level for the heating design; (b) the 97–98% level for the cooling design.
Sustainability 10 00861 g005
Figure 6. Peak outdoor air load for heating design calculated using the old and new design hourly weather data.
Sustainability 10 00861 g006
Figure 7. Peak outdoor air load for cooling design calculated using the old and new design hourly weather data.
Sustainability 10 00861 g007
Table 1. Outdoor air load calculation conditions of simulated building.
Simulated building information:
•East–West Road (South and North-facing wall)
•Air-conditioned area of the mid-level floor (A): 605 m2
•Floor height (Hf)/Ceiling height (Hc): 3.6 m/2.6 m
•Building exterior wall structure (in order from indoor to outdoor):
  Wood (0.02 m) + Insulation (0.03 m) + Air layer (0.02 m) + Heavy concrete blocks (0.15 m)
  + Cement mortar (0.02 m) + Tile (0.008 m)
Dry-bulb temperature, relative humidity and enthalpy settings:
•26 °C, 60% and 58 kJ/kg in summer period from June to September
•22 °C, 40% and 39 kJ/kg in winter period from December to March
•24 °C, 50% and 48 kJ/kg in middle period from April to May, October to November
Heating and Cooling hours:
•From 8:00 to 18:00
  (Warming-up hours in winter: 8:00-9:00; Cooling-down hours in summer: 8:00–9:00)
Internal heat generation:
•Occupants: 0.2 person/m2
•Lighting: 20 W/m2
•OA equipment: 24 W/m2
Ventilation:
•Ventilation frequency of fresh air (n): 0.8/h
•Amount of fresh air (Afa): Afa = n × A × Hc
•Ventilation hours: 9:00-18:00

