Article

Mitigation Potential of Sanitation Infrastructure on Groundwater Contamination by Nitrate in Maputo

by
André Marques Arsénio
1,2,*,
Iana Câmara Salim
3,
Mingming Hu
3,
Nelson Pedro Matsinhe
2,
Ruth Scheidegger
4 and
Luuk Rietveld
1
1
Faculty of Civil Engineering and Geosciences, Department of Water Management, Delft University of Technology, 2628 CN, Delft, The Netherlands
2
Faculty of Engineering, Eduardo Mondlane University, 1100 Maputo, Mozambique
3
Leiden University, Institute of Environmental Science (CML), 2300 RA, Leiden, The Netherlands
4
Eawag, Department Systems Analysis, Integrated Assessment and Modelling, CH-8600 Dübendorf, Switzerland
*
Author to whom correspondence should be addressed.
Sustainability 2018, 10(3), 858; https://doi.org/10.3390/su10030858
Submission received: 14 February 2018 / Revised: 15 March 2018 / Accepted: 16 March 2018 / Published: 18 March 2018
(This article belongs to the Section Sustainable Engineering and Science)

Abstract

:
In Maputo, the capital of Mozambique, nitrate concentrations above 250 mg L−1 in groundwater have been reported. This happens due to the widespread use of latrines and septic tanks that allow for constant infiltration of its content into the soil and eventually to groundwater sources, a situation that is widespread in the Global South and represents a serious threat for human health and for the environment. This is a reflection of limited access to safe and adequate sanitation services, which the local authorities have set to improve in the forthcoming decades with a recently commissioned city-wide sanitation masterplan serving as a basis for the works. In this article, we aimed at understanding whether the infrastructure projected in the masterplan would lead to a reduction of nitrogen reaching groundwater. Currently, according to our calculations, almost 500 tonnes of nitrogen reach the city’s groundwater sources each year, with the masterplan potentially resulting in a 14% reduction, a small reduction due to its reliance on maintaining and expanding fecal sludge services, without considering investments to improve domestic systems (e.g., construction of contained systems). An alternative, not presented in the Masterplan and put forward by the authors, could be the construction of simplified sewers in two of the city’s most densely populated neighborhoods, with a potential 29% reduction in nitrogen reaching groundwater.

1. Introduction

Nitrate is a compound of nitrogen that occurs naturally in moderate concentrations, in many natural environments [1]. In higher concentrations, nitrate becomes a water contaminant that can affect humans and ecosystems alike: high levels of nitrate in drinking water have been linked to health problems, such as blue-baby syndrome, blood disorders, hypertension, and cancer, with WHO recommending 50 mg L−1 as the absolute maximum nitrate concentration in water for human consumption [2]. Nitrate concentrations, above WHO’s limit, in surface water can also lead to eutrophication and aquatic biodiversity loss [3].
For the particular case of groundwater contamination, nitrate sources include agriculture fertilizers [4,5,6];, animal waste from farming [7,8,9], and human fecal sludge, urine, and feces, deposited into on-site sanitation systems [1], henceforth defined as OSS systems. The particular impact of inefficient OSS, such as latrines and septic tanks, on groundwater sources in the Global South, has been thoroughly studied, and examples cover the whole African continent [10], Mali and Mozambique [11], Cameroon [12], Uganda [13], Kenya [14], Tanzania [15], Indonesia [16], and Vietnam [17], with much documentation available for India [18,19,20,21]. These studies have shown that the contamination risk is aggravated in densely urban areas where unconfined and semiconfined aquifers are exploited for water supply to populations that rely on OSS [21].
The effluent of OSS systems contains nitrogen (25–60 mg L−1) mostly in the form of ammonium ions (20–55 mg L−1), which are then oxidized to nitrate that is transported in the subsoil, finally reaching groundwater [1]. It has been estimated that of the total nitrogen transported to the subsoil, 2% to 20% reaches groundwater [13] and is closely connected to the geological and hydrological characteristics of the area [22,23]. Sanitation infrastructure is a necessary investment for the governments in the Global South to reduce groundwater contamination and to improve the health of city dwellers. However, such infrastructure is also expensive and it is essential to understand its potential impact to reduce nitrate fluxes to groundwater in order to invest in the most cost-effective solutions. One option to study such complex interactions is by using Material Flow Analysis (MFA), “a systematic assessment of flows and stocks of materials within a system defined in space and time” [24]. The key principle is the law of mass and energy conservation based on which inputs entering a system have to equal the outputs plus the variations in stocks [25]. MFA is considered to be a powerful and attractive instrument to study complex systems and can serve as a decision support tool since it offers a comprehensive and analytical account of a defined system boundary, in which processes—transport, storage, or transformation of material(s)—and flows—goods or/and substances—are interlinked in time and space [26]. In developed countries, MFA has been exploited to detect early environmental problems and to study the influences of possible actions on the environment [27]; examples are studies on resource management [28,29], assessment of environmental policies [30,31,32], and wastewater treatment [33]. In the context of the Global South, several studies have been performed in the field of sanitation [26,27,34,35,36,37,38]. These typically focus on the flows of water and/or nutrients in a politically defined region, the access to reliable input data an often-mentioned limitation [26,39]. Data scarcity in the Global South is a shortcoming that has to be addressed while carrying out an MFA study, with the uncertainty of the parameters and variables being evaluated, e.g., through Monte Carlo simulation.
Mozambique is located in the southeastern part of Africa and has its complete eastern boundary embracing the Indian Ocean. Despite a Gross Domestic Product growth of 7% over the last two decades [40], Mozambique is one of the poorest countries in the world, and ranked 180 out of 188 countries according to the Human Development Index of 2015 [41]. Due to climatic, economic, and security reasons, and in particular, war [42], many people have been migrating to the cities, especially to Maputo [43], the country’s capital. This exodus has overextended the capacity of the existing urban infrastructure [44]. Greater Maputo, henceforth simply defined as Maputo, groups the cities of Maputo, Matola, Marracuene, and the village of Boane [43]. With more than 2 million dwellers, it is projected to grow by 3.35% per year until 2040 [45] to more than double the current population. It is located at the extreme south of the country in the Incomati Delta and, similar to other urban settlements in the Global South, faces a chronic lack of adequate sanitation services and limited access to safe water supply.
It is estimated that only 5% of the city’s inhabitants have access to the existing sewage system, which was built in the 1940s and later expanded in the 1980s. The largest amount—around 75% of the total volume—of the collected wastewater is discharged by gravity through the existing network, untreated, into Maputo Bay, with the remaining 25% being conveyed to the existing wastewater treatment plant [46]. The remaining city’s population makes use of OSS. Of the fraction of the population that uses OSS, people typically rely on septic tanks (37%) and latrines (53%) [47]. Most of these OSS systems (72%) were estimated to never fill up [47], due to the (i) collapse of the infrastructure caused by poor construction standards and high water table, and (ii) design flaws that allow the content of such facilities to continuously infiltrate the ground [48]. If a system is reported to not fill up, it can be assumed that there is no driving force for the household to request an emptying service which means that the fecal sludge is lost and that nitrate will continuously reach groundwater. Of the facilities reported to fill up, most (54%) are unsafely emptied by informal operators, with fecal sludge being assumed to be discharged, untreated, into the environment. According to estimates, only 3% of the systems that fill up are safely emptied by formal operators while 43% are considered to be “safely abandoned after use” [47]. For contextualization, it is important to mention that the existing wastewater treatment plant is composed of two anaerobic ponds and two facultative ponds operating in parallel. However, the system is currently overloaded. On the one hand, both anaerobic ponds are full of sludge as these are the discharge points for formal fecal sludge operators. On the other hand, the facultative ponds are 80–90% covered in water hyacinths. Unpublished work made by the authors has shown that the treatment capacity of the plant, as BOD and COD removal rates, is limited. Thus, it is clear that the largest percentage of wastewater and fecal sludge produced in the city is not adequately treated, which leads to serious environmental and health issues [44,46].
Regarding water supply, while half of Maputo’s population gets its drinking water from the large, public water provider (Águas da Região de Maputo, ARM), the rest, mainly in the peri-urban areas which are the most densely populated [49] and where the dwellers mostly rely on OSS [47], are supplied by small-scale, independent water providers (SSIPs). These providers depend entirely [50] on a superficial, semiconfined aquifer that has a maximum width of 15 m, and depths ranging from 20 to 40 m [49,51,52]. This aquifer has been reported to have high nitrate concentrations, with many boreholes throughout the city displaying concentrations above 50 mg   L 1 , sometimes reaching 250 mg   L 1 [50], especially in the neighborhoods where the population mostly relies on OSS [53]. An up-to-date and extensive description of the geo-hydrology of the area, including nitrate concentrations, can be found elsewhere [51].
This situation clearly demonstrates the link between inadequate sanitations infrastructure and services, environmental contamination, and urban health and wellbeing. Therefore, having in mind the needed improvements to the existing sanitation infrastructure in Maputo, the National Water and Sanitation Infrastructure Board (AIAS, in Portuguese), the primary agency responsible for ensuring both water supply in small towns and sanitation in all urban areas in Mozambique [54], commissioned a city-wide sanitation masterplan. This document proposes improvements to the existing sewer network, its expansion, and the construction of new wastewater treatment plants, together with a network of fecal sludge transfer stations and fecal sludge treatment plants. Based on the data collected for Maputo city, the potential effect of the implementation of the City-Wide Sanitation Masterplan (henceforth defined as Masterplan) was evaluated with MFA. The implementation of the Masterplan was evaluated as the baseline scenario for the Maputo case. Additionally, two other options were studied: whereas one assumed the further expansion of sewer infrastructure, the other assumed improvements of domestic sanitation systems and of fecal sludge services in the city. These two optional solutions were not budgeted or projected by the authorities, and were devised by the authors for the purpose of exploring the possible alternatives to improve the effectiveness of the Masterplan. To the knowledge of the authors, it is the first time that MFA is used to assess the environmental impact of planned sanitation infrastructure in the Global South.

2. Materials and Methods

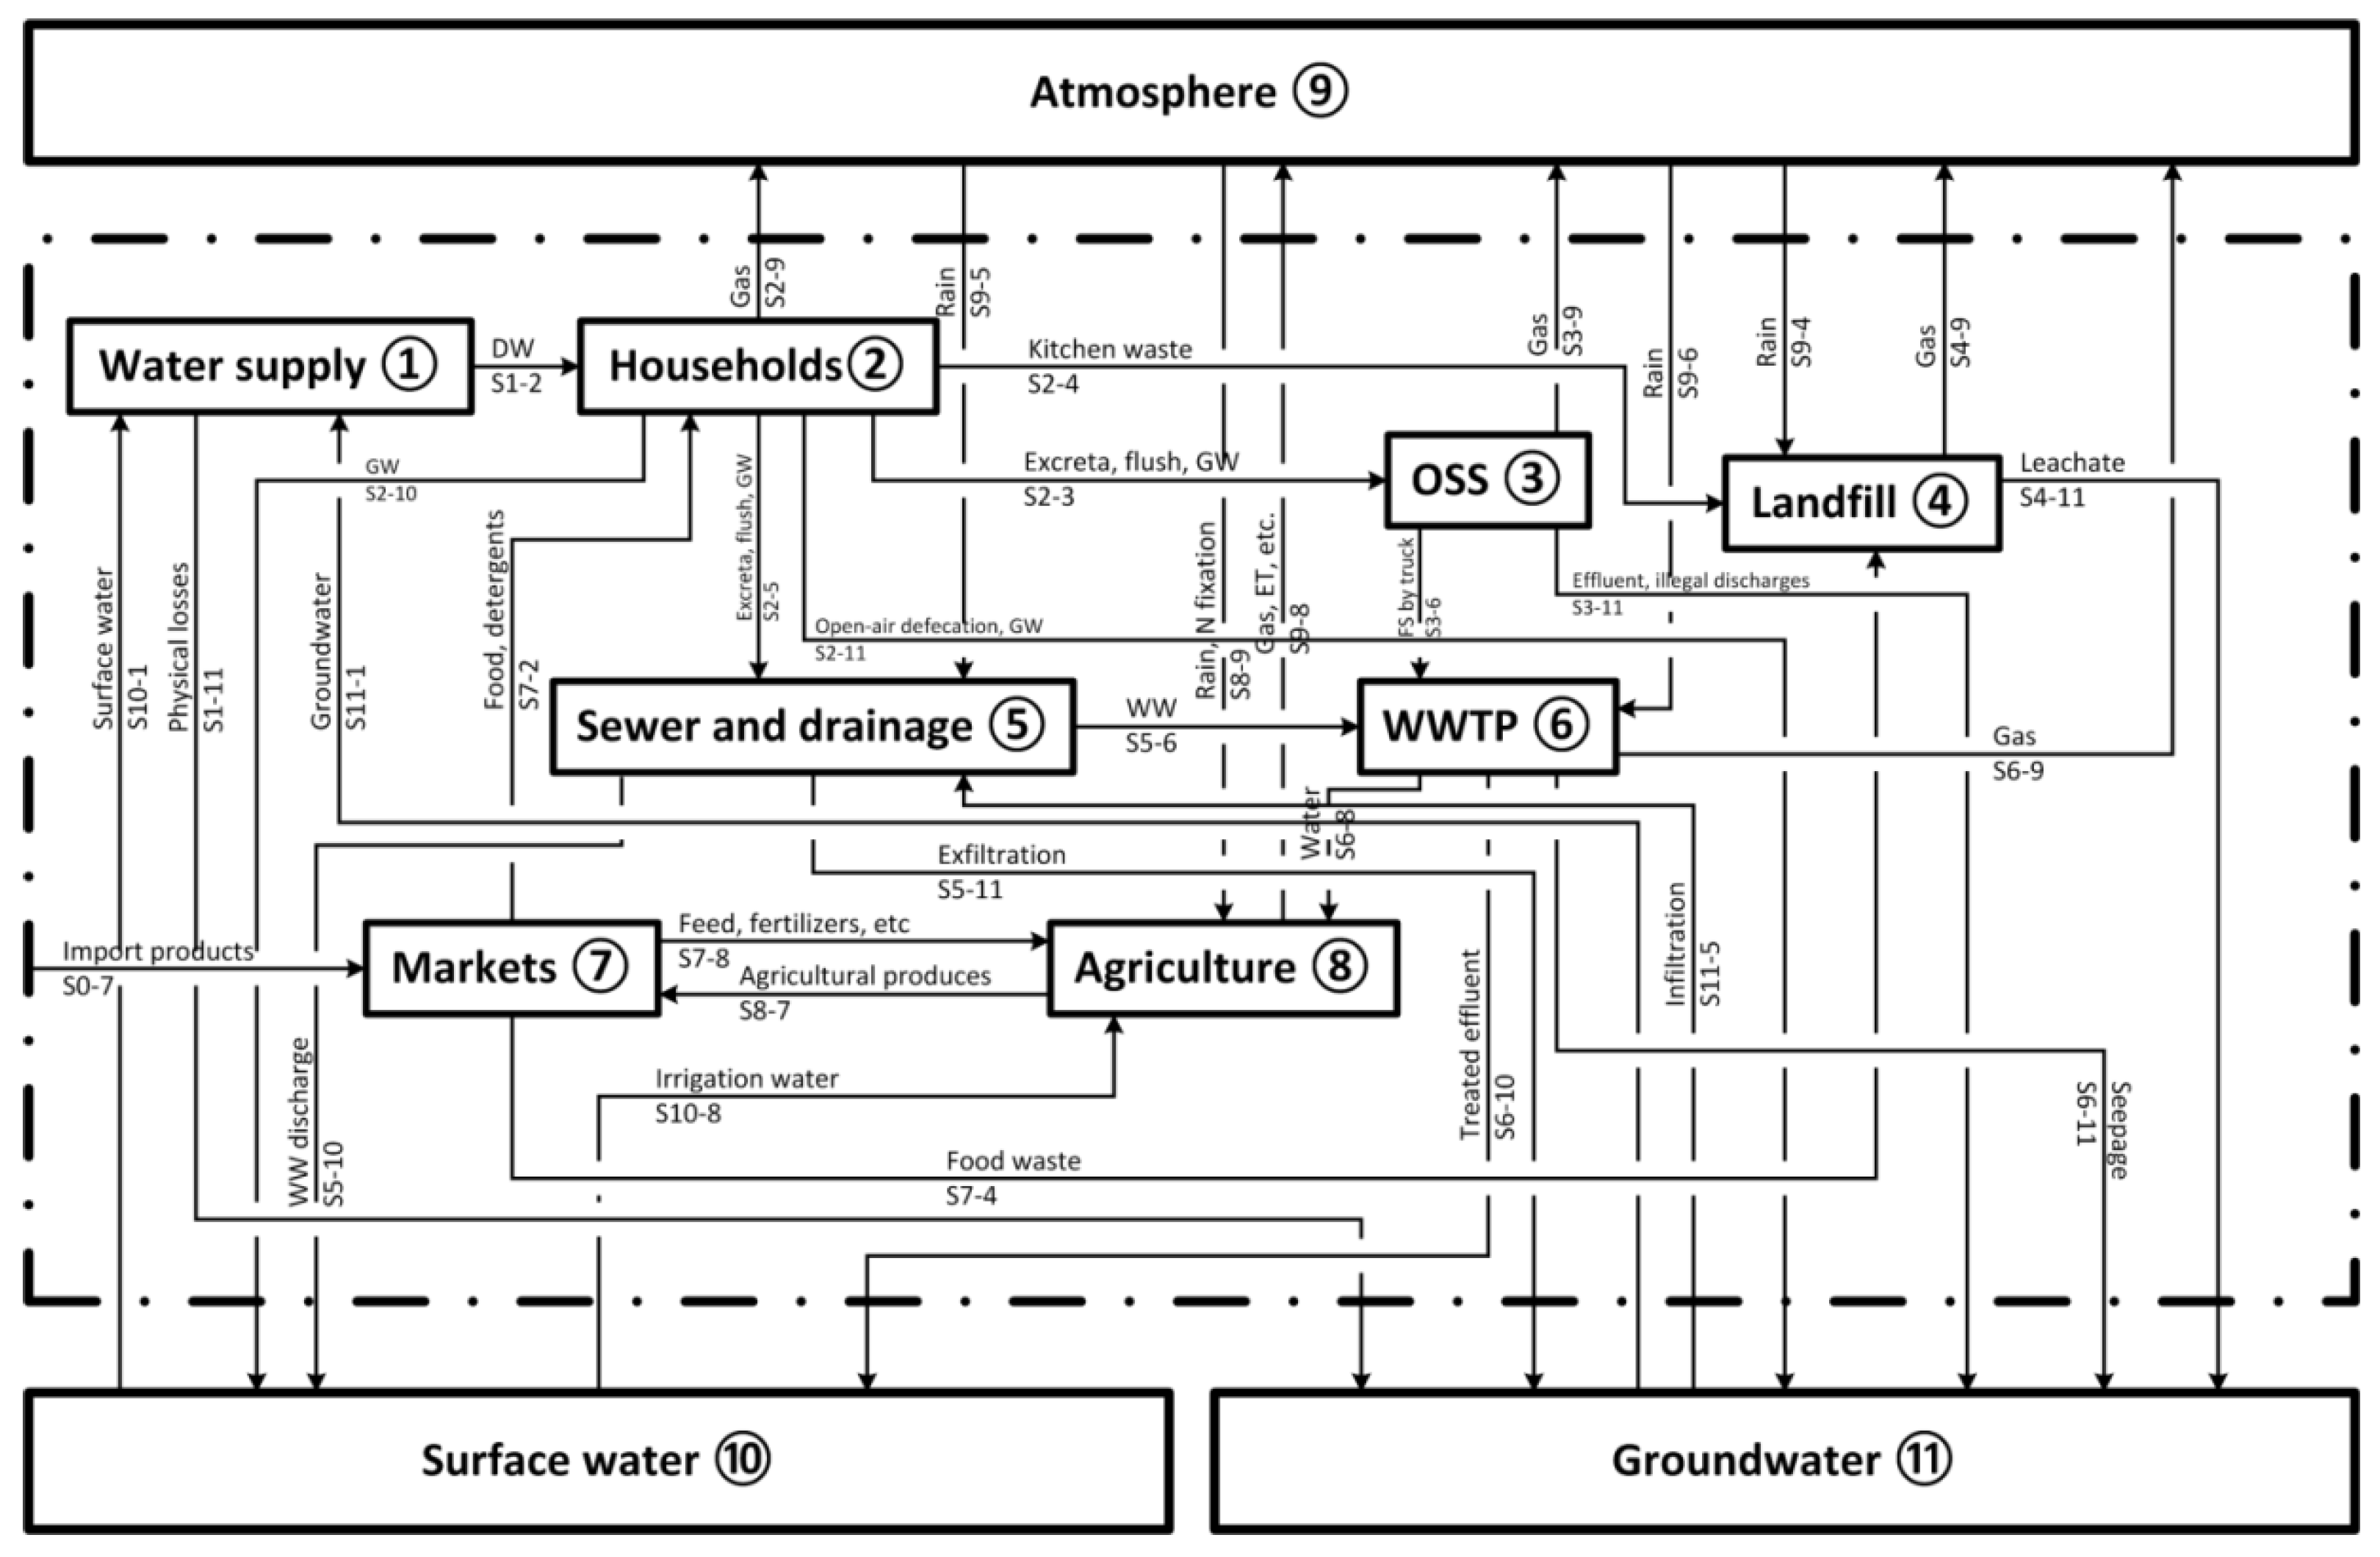
2.1. Material Flow Analysis Model Development

The system boundary was defined to cover Maputo, for which the flows of water and nitrogen were modelled for the year 2015. In MFA, flows can be represented as substances, such as nitrogen, which, in this model, is classified as a pollution indicator, or goods, which can have a positive (drinking water) or negative (wastewater) economic value for society. The conceptual MFA model is depicted in Figure 1. The model includes a network of 11 processes, representing the most relevant activities for the transformation, storage, and/or transport of water and nitrogen within the system boundary and the 33 flows that connect them. Within the modelled processes, three are natural sinks (Atmosphere (9), Surface water (10), and Groundwater (11)), representing where the water and associated nitrogen will finally settle; nitrogen ending up in (10) and (11) indicates pollution. These three processes were considered sinks and were not balanced, meaning that the total inputs and outputs of these processes were not determined. The other eight processes are the main social–economic processes in the study area that mobilize and transform water and nitrogen. For instance, Agriculture (8) transfers nitrogen, from fertilizers that are imported to the system, to fresh food produce. Water supply (1) and Markets (7) provide drinking water and fresh produce to the city dwellers. These, represented as Households (2), then transform drinking water and food into wastewater and fecal sludge. While wastewater reaches Sewer and drainage (5) and is partially conveyed to the wastewater treatment plant (6), fecal sludge is discharged into OSS (3) and then either infiltrates the groundwater or is transported via truck to (6). Finally, the Landfill (4) receives all solid waste produced in the system.
To characterize the flows of nitrogen in the city, it is important to first calculate the flows of wastewater ( WW WWTP ) and fecal sludge ( FS WWTP ) that are treated at the wastewater treatment plant (WWTP). Both flows will be directly influenced by infrastructure projected in the Masterplan and are the main sources of nitrogen. This is done using Equations (1) and (2).
WW WWTP = f WW WWTP × ( WW wet + WW dry )
where f WW WWTP is the fraction [-] of wastewater that is conveyed to the WWTP; WW wet and WW dry are, respectively, the volumes of wastewater flowing in the sewer network during the wet and dry periods of the year [ m 3   year 1 ] .
FS WWTP = FS OSS × f OSS Fill × f OSS Emptied × f OSS Formal × f FS WWTP
where FS OSS is the volume of fecal sludge that reaches OSS [ m 3   year 1 ] ; and f OSS Fill , f OSS Emptied , f OSS Formal are, respectively, the fraction of OSS that fill up, are emptied, and are emptied by formal operators [-]. Finally, f FS WWTP is the fraction of fecal sludge that is transported to the WWTP [-].
Then, to quantify the amount of nitrogen reaching groundwater ( N GW ) , Equation (3) was used.
N GW = f N GW × ( N GrW + N LF + N OAD + N OSS + N PL + N WWTP )
where f N GW is the fraction of N sourced from the different sources that reaches groundwater [-]; N GrW is the amount of nitrogen sourced from greywater (Equation (4)); N LF is the amount of nitrogen in the city’s landfill leachate (Equation (5)); N OAD is sourced from open-air defecation (Equation (6)), N OSS is the amount of nitrogen originating in OSS (Equation (7)); N Leak is the amount of nitrogen in the drinking water lost due to leakage (Equation (8)); and N WWTP is the amount of nitrogen originating in wastewater exfiltrated from the sewer infrastructure (Equation (9)). All these variables have units of [kg year−1].
N GrW = N GrW conc × Pop × [ ( GR GrW OSS × f Pop OSS ) + ( GR GrW Sewer × f Pop Sewer ) × f seep ] × 365 × 10 6
where N GrW conc is the nitrogen concentration in greywater [ mg   N   L 1 ] ; Pop is the city’s population [capita]; GR GrW OSS is the greywater generation rate for the population with OSS, and GR GrW Sewer is the greywater generation rate for the population covered by the sewer network, both in [ L   capita 1   day 1 ] ; f Pop OSS is the fraction of the population with OSS; f Pop Sewer is the fraction of the population served by the sewer network [-]; and f seep is the fraction of wastewater that seeps for the sewer network [-].
N LF = N LF conc × A LF × PP Maputo × f rain leachate × 10 6
where N LF conc is the nitrogen concentration in the landfill’s leachate [ mg   N   L 1 ] , A LF is the area of the landfill [ m 2 ] , PP Maputo is the average annual precipitation in Maputo [ mm   year 1 L · m 2   year 1 ] , and f rain leachate is the fraction of the rain that becomes leachate [-].
N OAD = N Excreta conc × Excreta × Pop × ( 1 f Pop Sewer f Pop OSS ) × 365 × 10 6
where N Excreta cont is the nitrogen concentration in human excreta [ mg   N   kg   Excreta 1 ] , Excreta is the daily excreta production [ kg   Excreta   capita 1   day 1 ] .
N OSS = N FS conc × FS I , A , NF × 365 × 10 6
where N FS cont is the nitrogen concentration in fecal sludge [ mg   N   kg   FS 1 ] ; and FS I , A , NF is the mass of fecal sludge in OSS that is informally emptied, abandoned, or that does not fill up [ kg   FS   day 1 ] . Please note that the nitrogen sourced from OSS, as defined in Equation (7), takes only into consideration nitrogen content in fecal sludge; nitrogen reaching groundwater and sourced from greywater discharged into OSS is calculated using Equation (4).
N Leak = N DW conc × Leak × 10 3
where N DW cont is the nitrogen concentration in drinking water [ mg   N   L 1 ] ; and Leak is the leakage in the water supply network [ m 3   year 1 ] .
N WWTP = N Eff conc × Eff × f seep × 10 3
where N Eff cont is the nitrogen concentration in the WWTP’s effluent [ mg   N   L 1 ] ; Eff is the effluent flow at the wastewater treatment plant [ m 3   year 1 ] . This component was modelled as a best-case scenario: the nitrogen concentration from seepage is the same as the nitrogen concentration at the WWTP outlet.
For all calculations, SIMBOX, a program developed at Eawag, was used. SIMBOX can partially overcome the problems of limited data availability and uncertainty by defining the value of input parameters as probability distributions instead of point values [55]. With SIMBOX, each input parameter has a set of attributes, average, standard deviation, and distribution. These parameters are used to calculate output variables using the aforementioned equations.
In the program there are five options for parameter distribution: normal, truncated normal, lognormal, truncated lognormal, or uniform [36,56]. Uniform distribution was adopted for parameters for which little information was available; this included authors’ assumptions, validated through discussions with local experts, and secondary data obtained from other geographical regions (e.g., dietary data obtained for other African countries). Truncated normal distribution was used for all fractions used in the calculations, with the exception of the ones that were assigned a uniform distribution; the use of truncated normal distributions avoids obtaining negative values for calculated output variables that cannot be negative (e.g., flows). Lognormal distribution was used for parameter concentrations, as these have the tendency to be non-negative and positively skewed [57]. All other parameters were assumed to follow normal distribution. A list with the most relevant input parameters is given in Table 1.
Once the uncertainties of input parameter values were defined, the uncertainties in output variables were calculated using Monte Carlo simulation [70]. Monte Carlo simulation uses random parameter values that are within the error margin previously defined for the input parameter values to calculate a distribution of probable output values [52]. For this work, each scenario was run 1000 times.
Sensitivity analysis, which consists in quantifying the effect of a defined input parameter change on an output variable [57], was also evaluated. This analysis enables identifying which input parameters exert a significant influence on a given output variable. To determine the sensitivity of a certain variable, this variable’s value was calculated based on an initial set of input parameter values; afterwards, the value of one of the parameters was altered by 100%, with all other parameters being kept unaltered. The difference between the initial variable mean value and the value obtained after changing the input parameter was then analyzed. The procedure was repeated for all parameters influencing the variable of interest [57]. SIMBOX also displays the ranking of parameter knowledge, which consists of a list of ranked input parameters with respect to their impact on the uncertainty of the variable calculated.
Based on this model, the flows of water and nitrogen in Maputo for the year of 2015 were calculated. Most input data was obtained from interviews with local water and sanitation experts and extracted from city-wide surveys that covered around 1200 households each [47,48]. It is important to underline that the survey [48] was specifically designed to provide input data for this model, in particular, fecal sludge flows in the city. While the first survey aimed at characterizing the spatial distribution of OSS systems in Maputo, the second studied attitudes and practices regarding the management of such systems. Data that could not be collected was calculated from surrogate parameters; e.g., the amount of fecal sludge that is not transported to the WWTP (6) was calculated considering the Mozambican diet, the average excreta generation in developing countries, and the rate of filled-up, replaced, or OSS systems that are (informally) emptied in Maputo. The sources for the most relevant parameters are given in Table 1.
In this manuscript, data are presented as box plots depicting median (middle of the data set), upper and lower quartiles (25% of data greater/lower), and minimum and maximum values; outliers are presented as circles.

2.2. Scenarios

2.2.1. Current Situation

According to recent surveys [47], the sewer system covers around 5% of Maputo’s population, with most of the collected wastewater being discharged untreated into the sea. In addition, about 1% of the population practice open-air defecation, which happens throughout the city [47,48]. In the model, the overarching assumptions were:
  • Only fecal sludge that is emptied by formal operators is transported to the wastewater treatment plant,
  • Fecal sludge is homogeneously produced throughout the city, and
  • The fraction of nitrogen that infiltrates the ground and reaches groundwater sources is the same, irrespective of the source.

2.2.2. Development Scenarios

Three development scenarios were formulated for this study. All scenarios represent improvements to the status quo and the impact of each scenario was quantified through the variation of input parameters that are related to the access to sanitation services and to its usage (Table 2). The underlying assumptions regarding behavioral changes and management practices made for each scenario were discussed with local water and sanitation experts.
Scenario MP (from Masterplan) was formulated based on the Masterplan. Firstly, it aims at expanding the existing sewer system to reach around 14% of the population. This scenario includes the installation of more than 250 km of new sewers and the construction of five pumping stations and six WWTPs. Secondly, there is a focus on improving the quality of the actual fecal sludge management services (projected 86% of the population), with the construction of four fecal sludge treatment plants and 24 fecal sludge transfer stations [71]. Under this scenario, the Masterplan does not include plans for improvements to the domestic systems, therefore we assumed that its breakdown among the city’s population will not change. Furthermore, we assumed that the construction and improvement of fecal sludge infrastructures and the increased access to efficient fecal sludge management services along the supply chain will allow more affordable fecal sludge management services and consequently raise the fraction of OSS systems that are emptied by formal operators by 25% (Table 2).
Scenario MPS (from Masterplan plus sewer) consists of the (unplanned) expansion of the sewer network to about 40% of the population, which would allow also covering two of the poorest urban districts of Maputo, Nhlamankulo, and KaMaxaquene, which are the districts with the highest population density in the city (almost 200 hab   km 2 ). These are also the urban districts with the highest demand for emptying services where, currently, more than 40% is done unsafely (by hand with buckets) by informal operators [47]. For this scenario we have also assumed a 25% increase in the number of OSS systems that will be emptied and emptied by formal operators (Table 2).
Scenario MPO (from Masterplan plus OSS) consists of the (not yet planned) improvement of OSS. Over 72% of the OSS systems in Maputo are reported not to fill up [47], which means that currently only a small fraction of these systems work properly and are (formally) emptied (Table 2). A possible path for development could be to partially replace the existing systems (e.g., various types of latrines that represent more than 50% of the total [47]) with contained systems that require emptying. For this scenario we assumed that this replacement will occur homogenously throughout the city and that there will be an increase of 25% in the amount of systems that fill up, which will lead to an increase in the fractions of systems (formally) emptied (Table 2).

3. Results

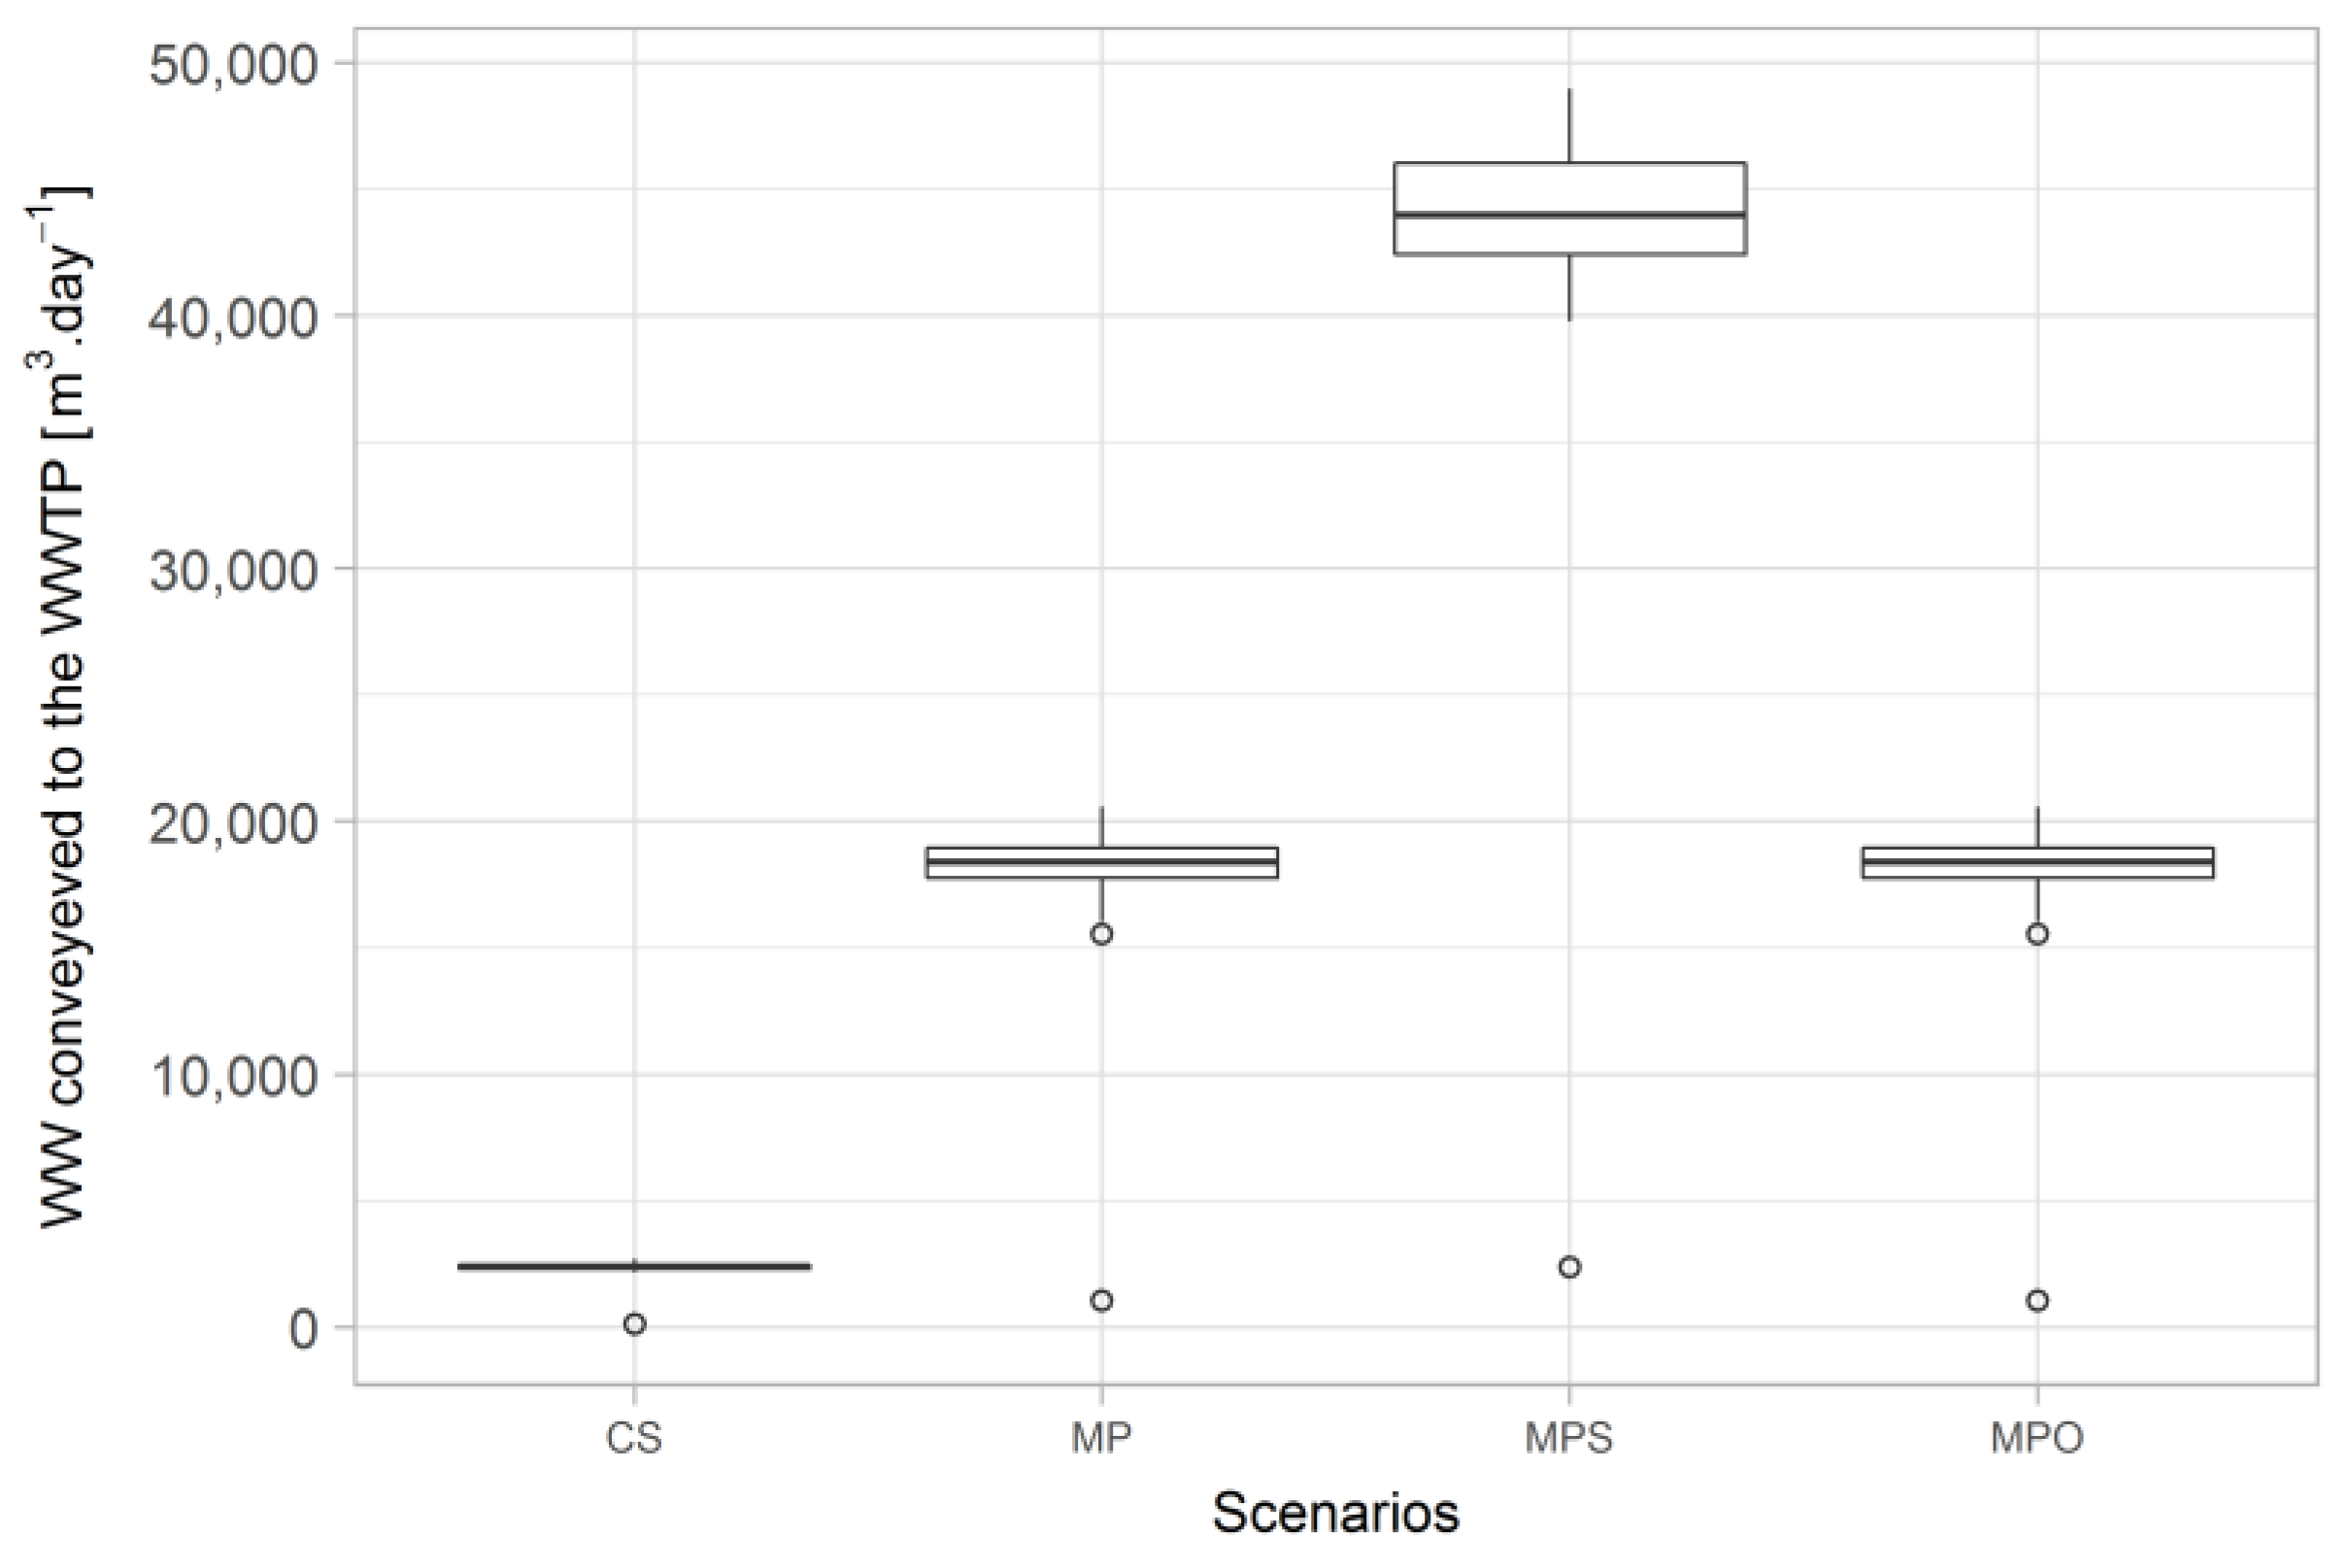
3.1. Fecal Sludge and Wastewater Flows
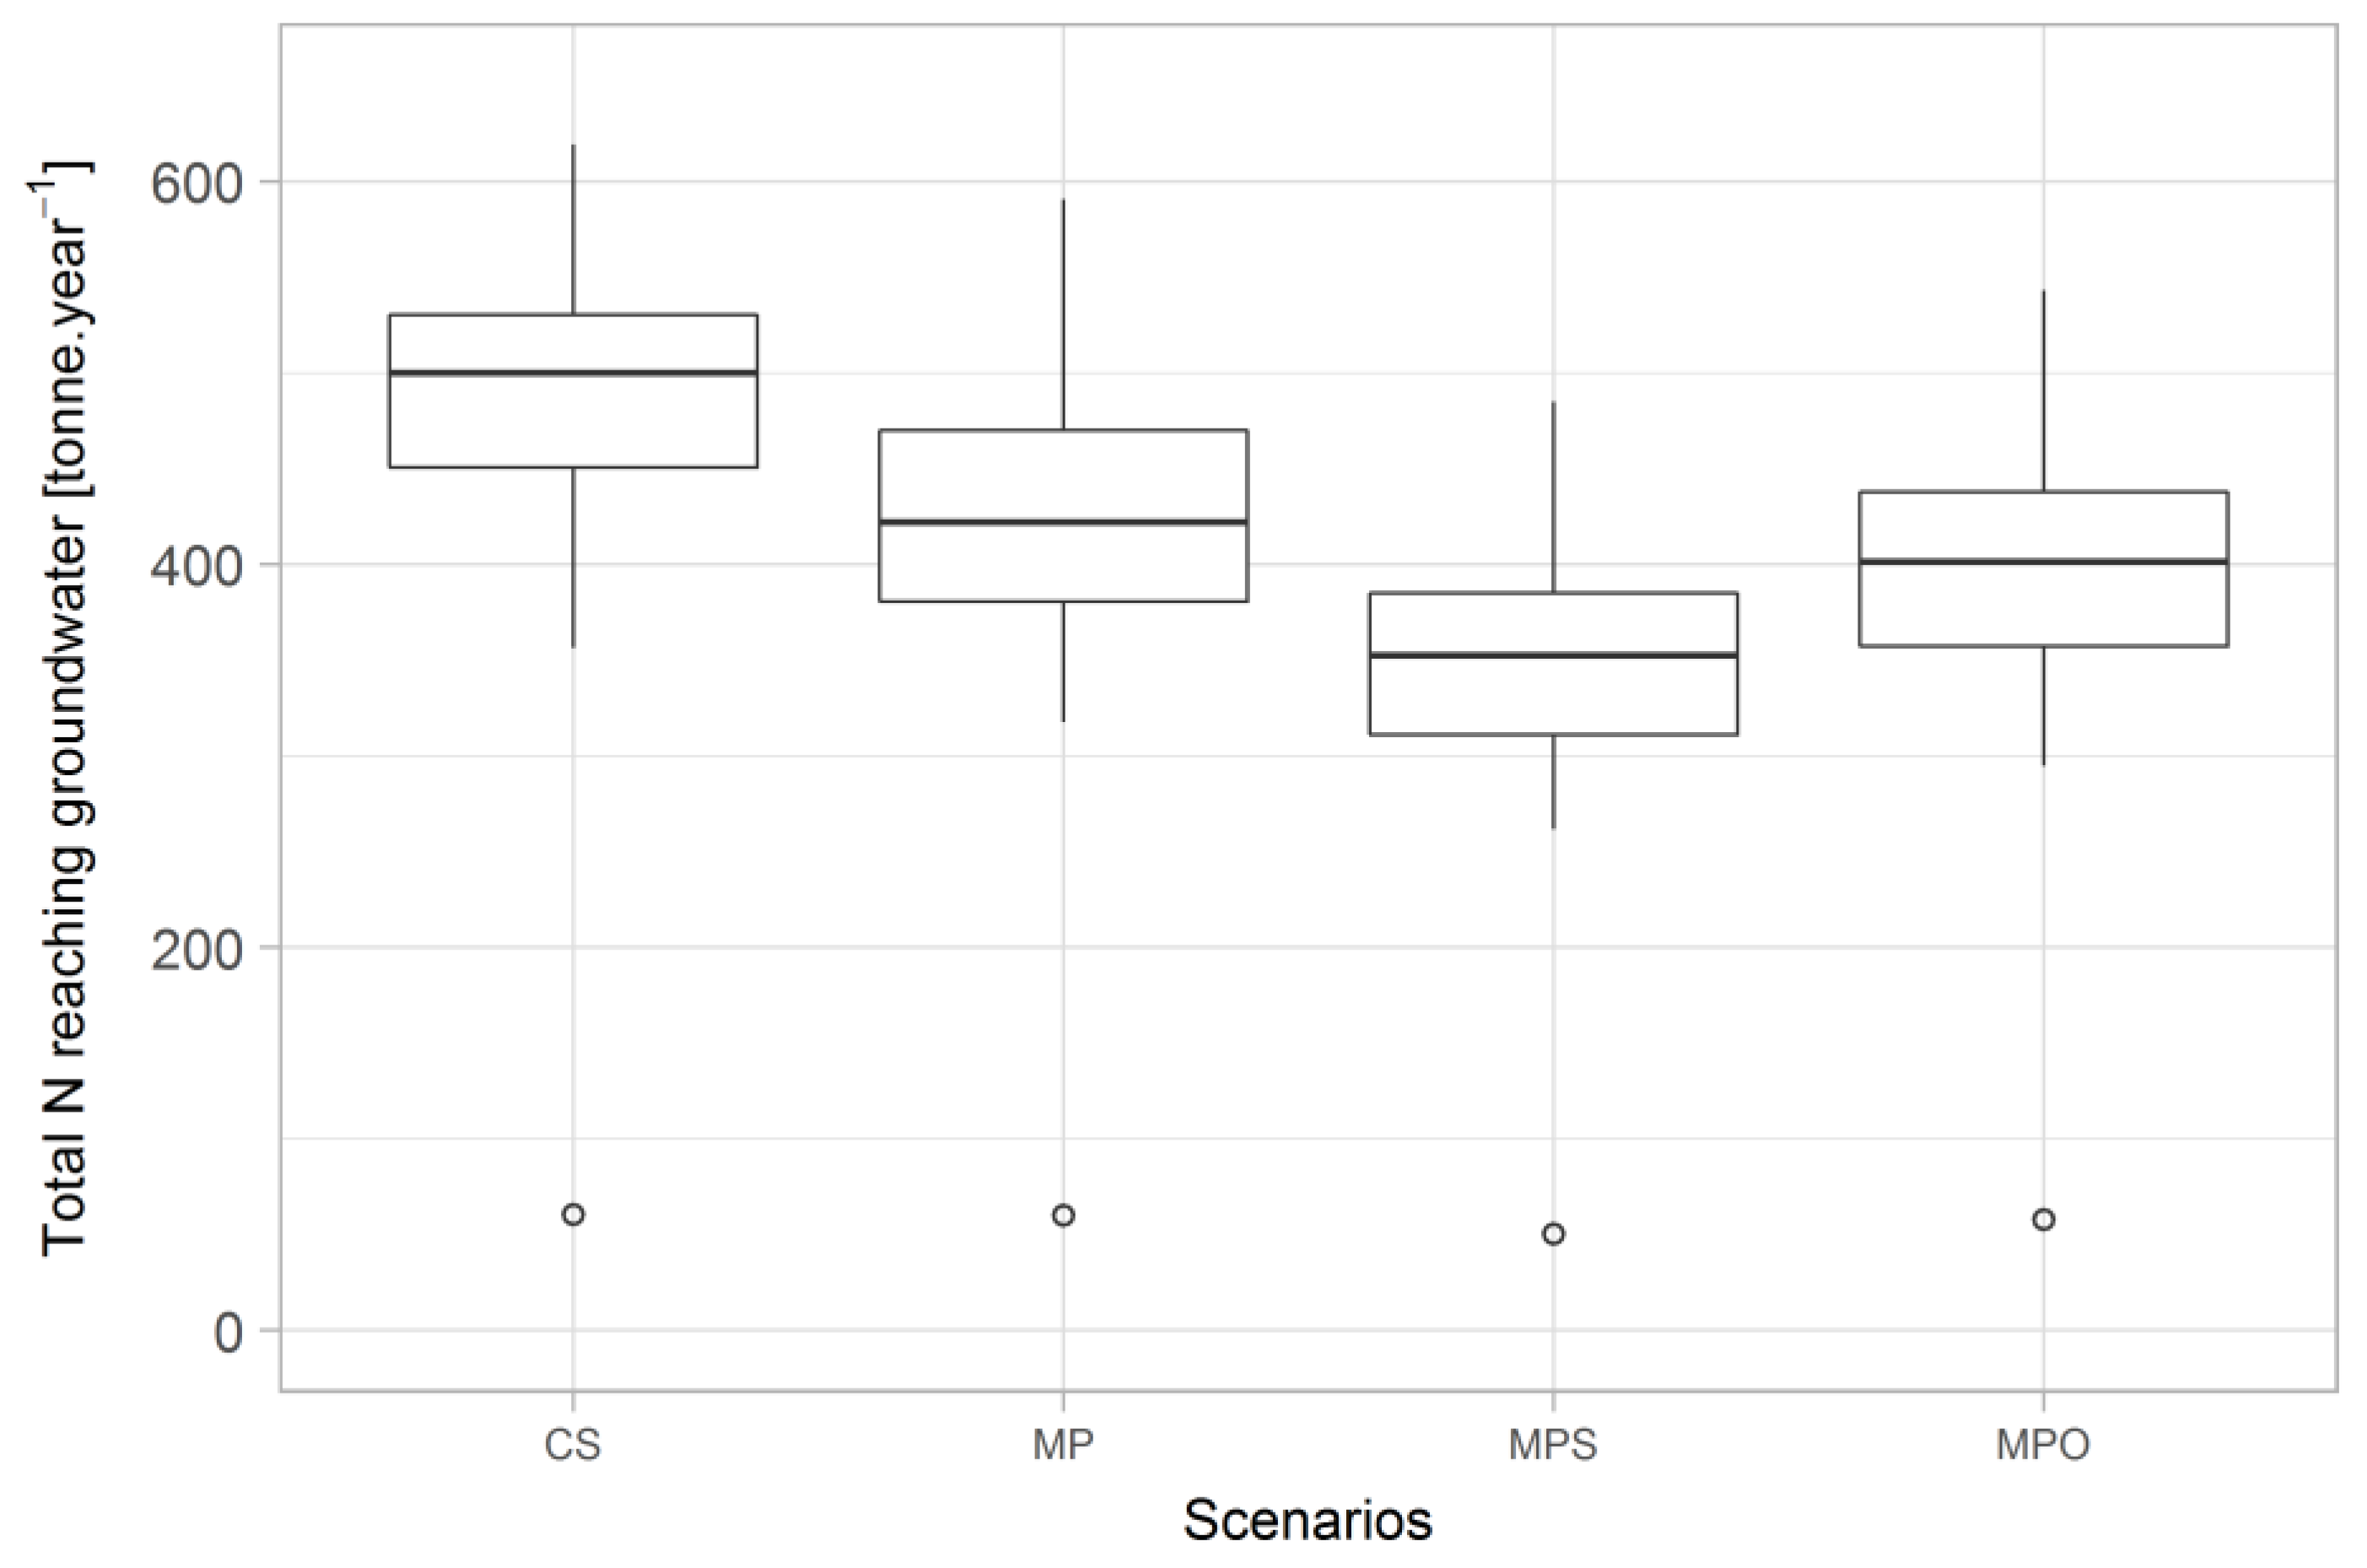
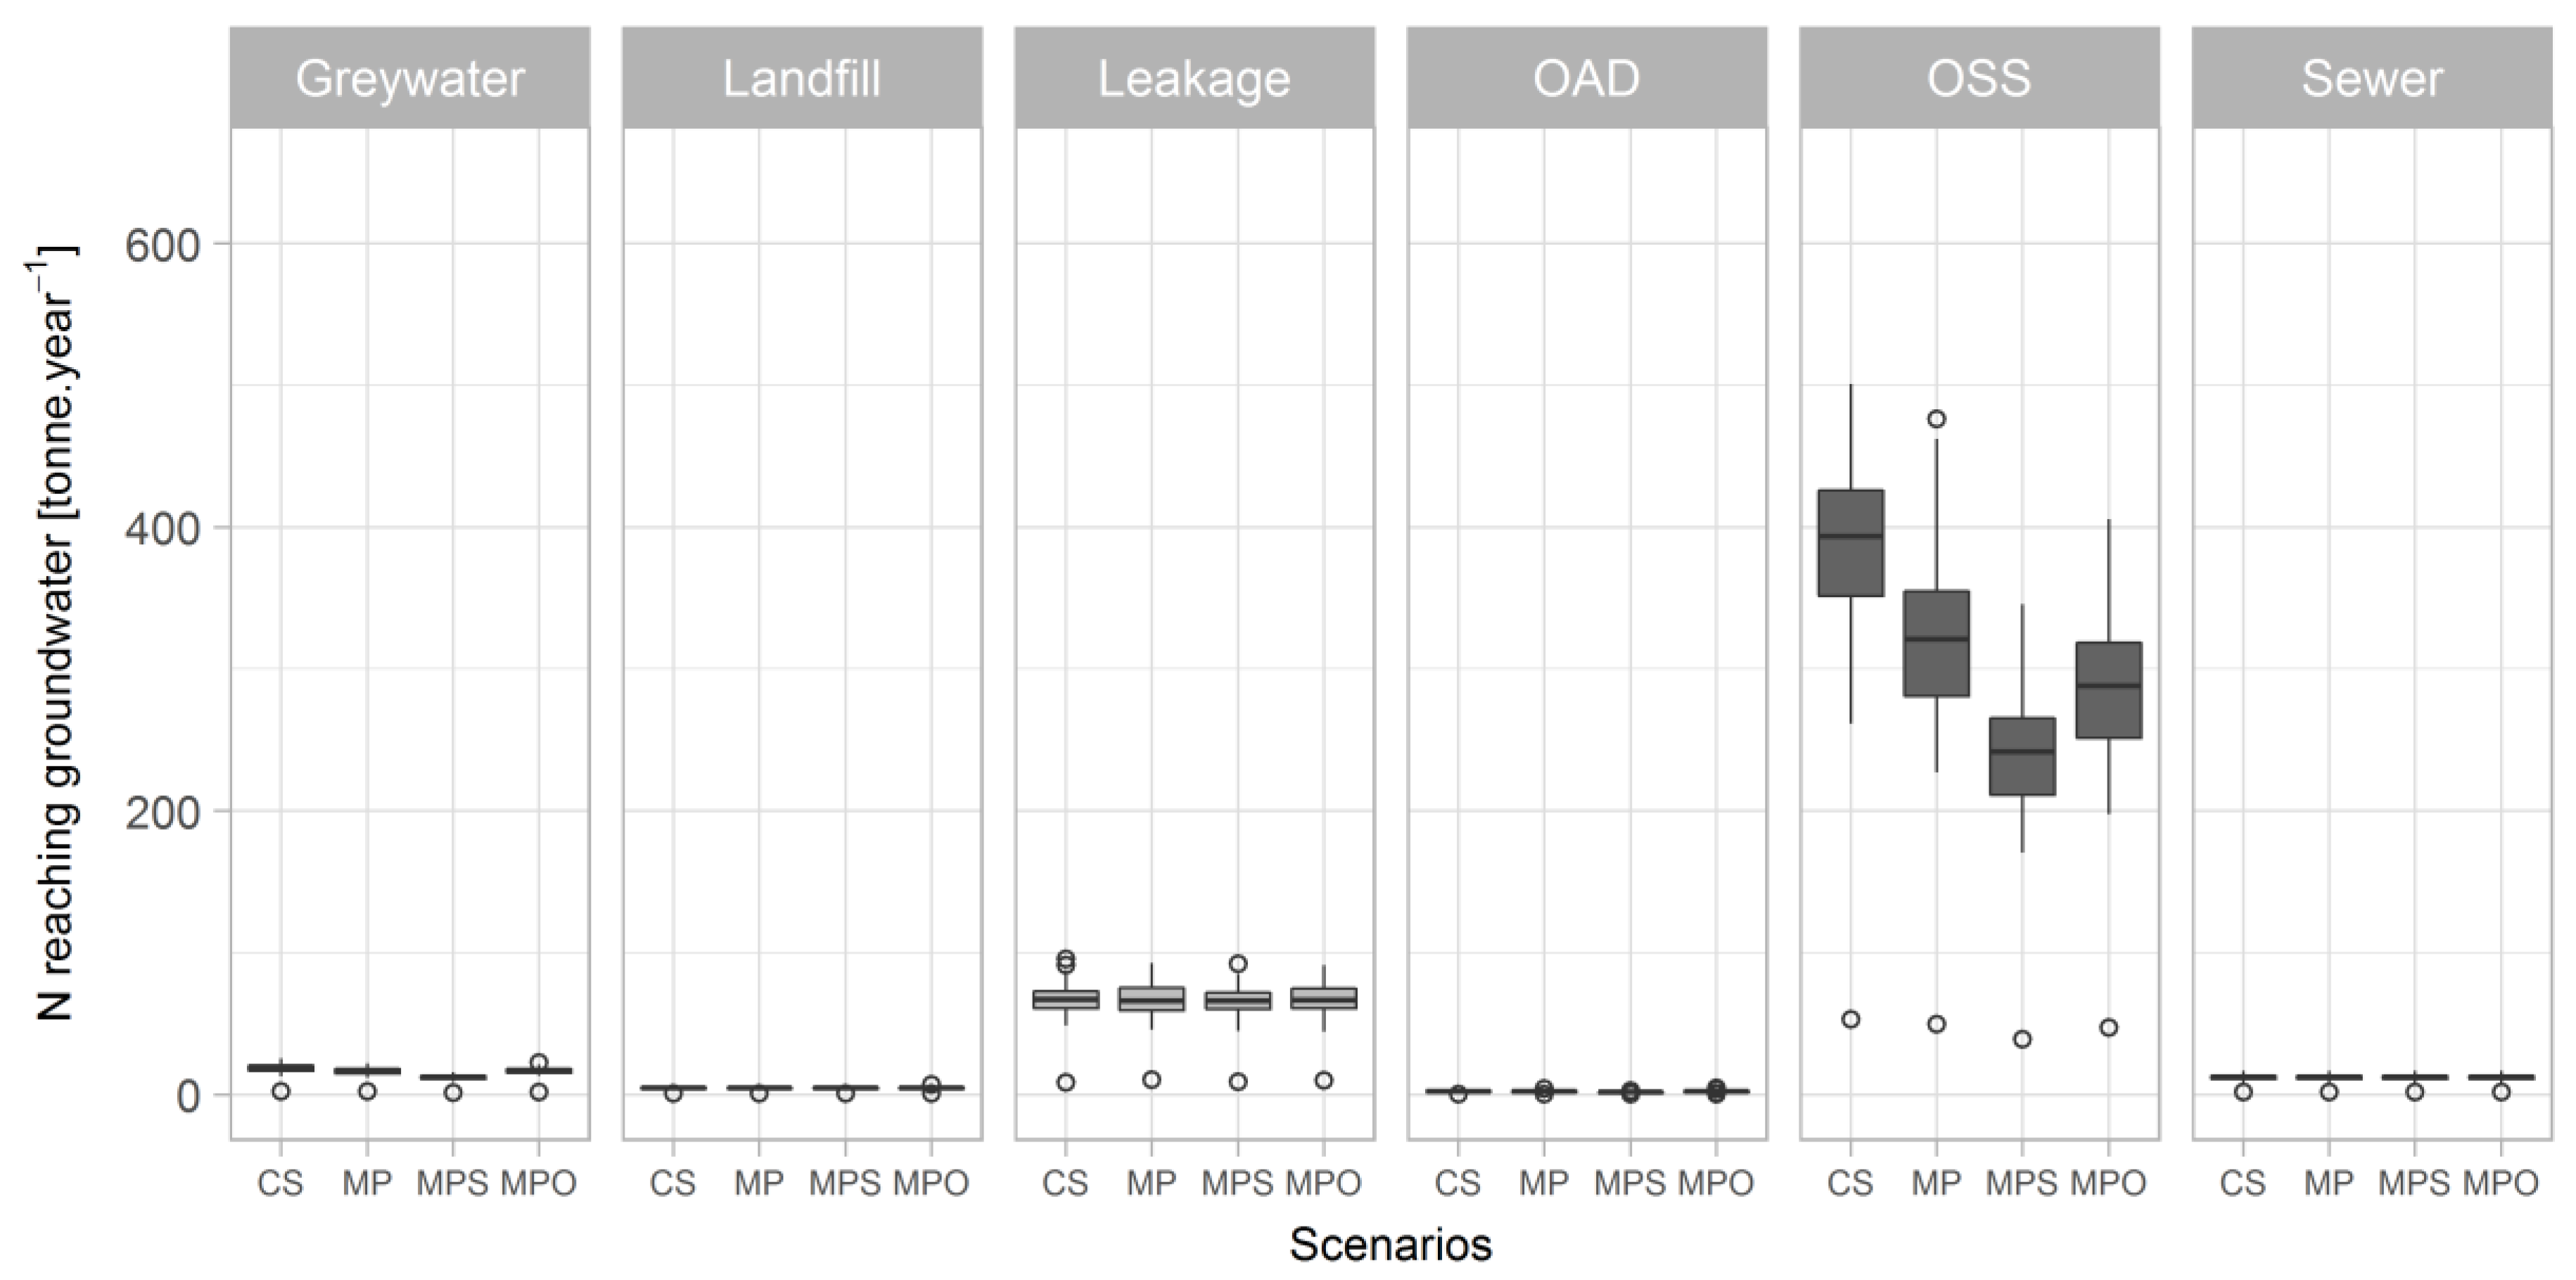
All three development scenarios will lead to an increased volume of wastewater (Figure 2) and fecal sludge (Figure 3) conveyed to the WWTP (Table 3), when compared to the current situation.

3.2. Nitrogen Flows

3.2.1. Mass Flows

Currently, almost 500 tonnes of nitrogen reach groundwater each year (Figure 4). According to our results, Scenario MP could potentially result in a slight reduction (14%) of the nitrogen flow into the groundwater, Scenario MPS allows a 29% reduction, and Scenario MPO, a 19% reduction (Table 2).
The sources of nitrogen reaching groundwater, as calculated by the model, are depicted in Figure 5. These include greywater discharged unsafely onto streets, a common practice among households relying on OSS [47,48], and directly into OSS systems, common among septic tank owners; the leachate from the city’s landfill; leakage from the drinking water supply systems; open-air defecation; fecal sludge disposed of into OSS systems; and exfiltration from the sewer infrastructure, including network and WWTP. OSS infiltration is for all scenarios the largest source of nitrogen reaching groundwater, followed by nitrogen by leakage from the city’s drinking water networks. The impact of nitrogen in leakage is related to large volumes of water lost each day in the city’s network (around 50% of 200,000 m3).

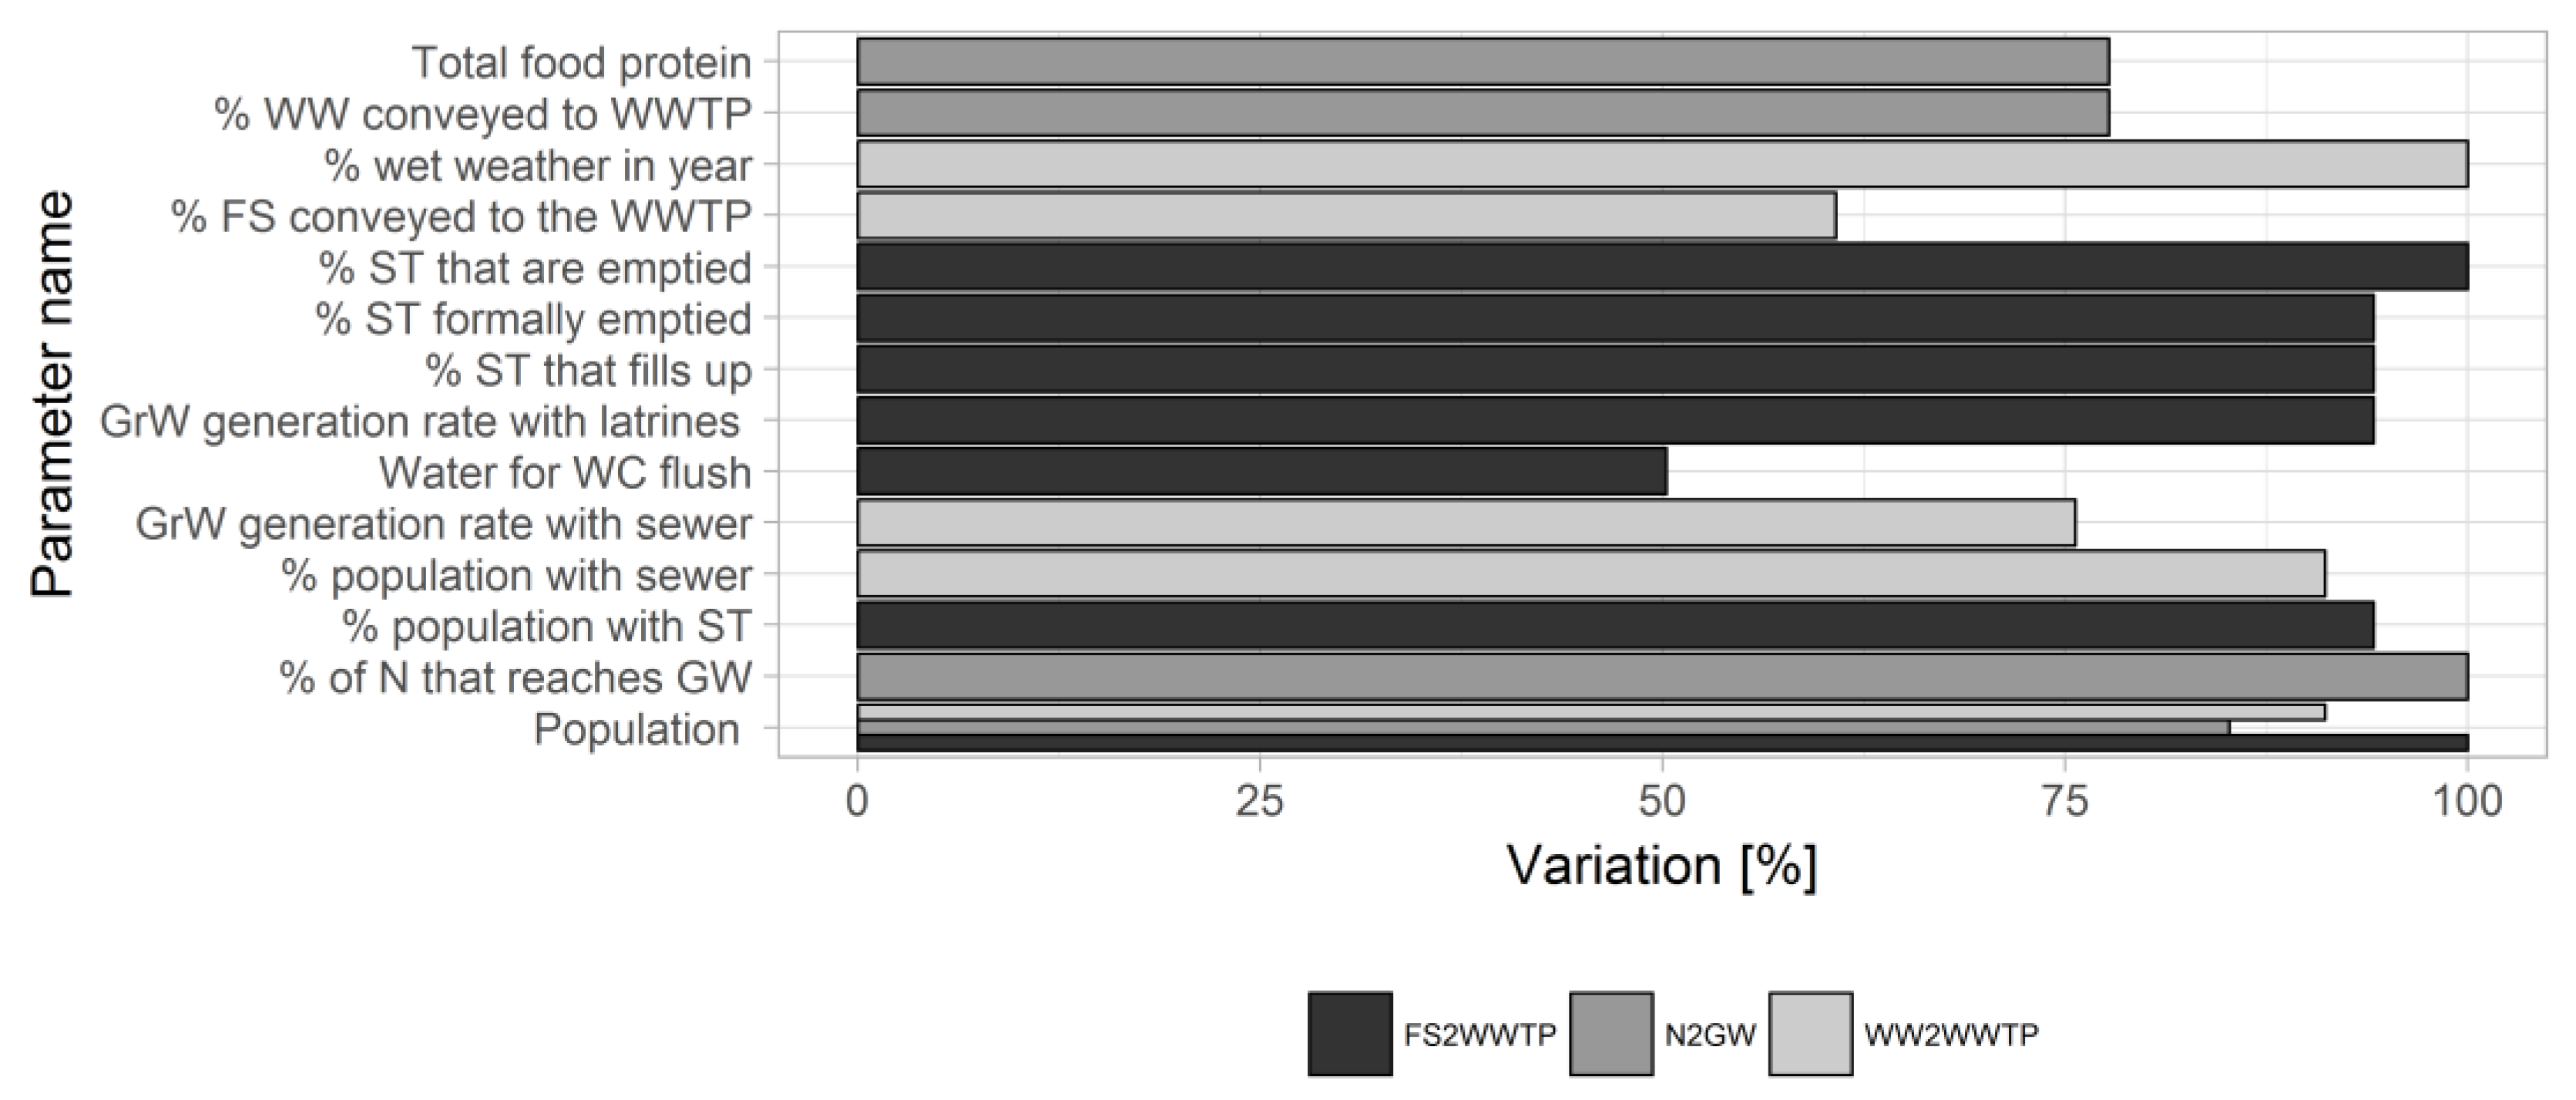
3.2.2. Sensitivity Analysis and Parameter Knowledge Ranking

The sensitivity analysis for nitrogen reaching groundwater, fecal sludge transported, and wastewater conveyed to the WWTP is depicted in Figure 6. The corresponding change for each variable’s output value is given for a 100% increase in several input parameters. Only parameters that lead to a variation of at least 30% are presented.
Regarding fecal sludge, this variable is most sensitive to the household practices regarding septic tank management, in particular the selection of formal or informal operators. The volume of wastewater conveyed to the treatment plant is most sensitive to the number of city dwellers and to the amount of rain that reaches the network, given by the fraction of the year that is dry or wet. Finally, the amount of nitrogen that reaches groundwater is most sensitive to the fraction of nitrogen that reaches groundwater from all nitrogen discharged into the soil, to the size of the population and the food consumed by the population which will influence the content of nitrogen in fecal sludge. Population size is the only parameter that has a significant impact on the output of the three variables.
Regarding parameter knowledge and consequent uncertainty of the output results, when the uncertainty of a certain variable is too large, the analysis shows which parameter uncertainties would have to be reduced (knowledge gathering) in order to achieve a lower uncertainty [72]. For both fecal sludge and wastewater, most uncertainty is explained by population size, emptying practices of septic tanks, the amount of water used for flushing, and greywater generation rate. Finally, for nitrogen reaching groundwater, most uncertainty comes from the percentage of nitrogen that reaches the soil and finally groundwater sources and from the type of food used by the city’s population. These parameters will thus have to be studied in detail in order to refine the model’s output—produce less output uncertainty. It should also be mentioned that despite “nitrogen reaching groundwater” being very sensitive to Population, this parameter explains very little uncertainty on the output (approximately 8%; Table 4). In fact, Population is one of the best known input parameters to the model as this comes from a recent house-to-house census. This means that this parameter has little uncertainty and has little impact on the total uncertainty of “nitrogen reaching groundwater”.

4. Discussion

The flow of fecal sludge that could reach the WWTP, calculated with our model, has been overestimated (2000 m 3   day 1 , Figure 3). In fact, truck-counting campaigns at the WWTP set the actual transported fecal sludge to approximately four times less, about 500 m 3   day 1 [47,48]. We hypothesize one possible reason for this discrepancy: in the surveys [47,48], the households were asked “Did you select a formal or informal operator to empty your OSS?”, with the subsequent assumption that formal operators always legally discharge at the WWTP, which might not be the case. On the other hand, estimations of wastewater conveyed to the WWTP (2300 m 3   day 1 ) were in the same order of magnitude of field measurements done by the authors 4000–5000 m 3   day 1 .
All three development scenarios could result in an improvement when compared to the current situation, with almost all wastewater produced in the city being conveyed to the WWTP, adequately treated, consequently reducing the levels of pollution in Maputo Bay. Also, the volumes of fecal sludge transported to the treatment plants would greatly increase. We expect that the increase in wastewater and fecal sludge, adequately treated, would translate into improved urban health and wellbeing for the city dwellers [46].
According to our calculations, OSS is the largest source of nitrogen reaching groundwater, a conclusion similar to that of other authors [35,36]. In the current situation, throughout the city, almost 500 tonnes of nitrogen reach the groundwater sources each year, a situation that leads to groundwater contamination by nitrate. We assume that this flow will have larger impacts in neighborhoods with higher population densities and where the population mostly relies on OSS [53]. Nevertheless, a comment is due to be made regarding a few of the underlying assumptions made in this manuscript and, in particular, the fraction of nitrogen that reaches groundwater from OSS. Nevertheless, it has been shown that groundwater recharge rate and hydraulic head have a significant influence on nitrate concentrations in aquifers [22]. The aquifer around Maputo shows a recharge rate of around 0.0002 to 0.0003 m 3   m 2   day 1 and a hydraulic head gradient in the range of 0.0015 to 0.002 [51]. Both parameters are an order of magnitude lower than the values assumed by [22] as “best case condition”—lower potential for nitrogen reaching groundwater sources. Finally, according to [51], no information concerning hydraulic conductivity of the aquitard unit is currently available for the area. Despite the lack of data, we argue that from a hydrology perspective, the potential for groundwater contamination by nitrate in the city of Maputo is high.
According to our results, Scenario MP would have the smallest impact on nitrogen reaching groundwater (14% reduction when compared to the current situation). Scenario MPS, on the other hand, which encompasses the expansion of the existing sewer network to a restricted and densely populated area, could potentially yield better results (29% reduction). Classic sewer network construction/expansion is often considered prohibitively expensive in the context of countries in the Global South [73]. However, an option for expanding the sewer network in peri-urban Maputo are simplified sewers. [74] argues that “values for sanitation technologies can vary widely and should be treated with caution and costs are always site specific depending on topography, housing layout, customer choice, materials used and population density”. However, the author continues, “on-site sanitation and simplified sewerage are invariably cheaper than conventional sewerage”. Finally, the author goes on stating that “for peri-urban areas, economies of scale can make simplified sewerage cheaper than even on-site sanitation technologies, in terms of total annual costs per household, at population densities greater than 160 hab   km 2 ”, giving the example of a case study in Brazil. In Maputo, the urban districts, Nhlamankulo and KaMaxaquene, both with almost 200 hab   km 2 , are the only districts in the city above that threshold and also the ones with the highest demand of emptying services [47].
A second alternative development scenario (Scenario MPO) includes improvements on domestic OSS, an approach that is mostly based on fecal sludge management services and with potential for a 19% reduction in nitrogen reaching groundwater. Scenario MPO assumes the replacement of part of the existing OSS systems that are reported not to fill- up with systems that fill up and allow emptying.
The true impact of the baseline improvements in the three Scenarios, which are connected to the expansion of fecal sludge infrastructure and services, is not only difficult to make, but might have been overestimated. One of the underlying assumptions in all three scenarios is that there will be an increased request of formal operators due to the construction of decentralized fecal sludge infrastructure, which would translate into more fecal sludge being transported to the treatment plant and adequately treated. However, the impact of fecal sludge infrastructure depends greatly on behavioral changes and subsidization schemes [75] that were not planned or budgeted in the existing version of the Masterplan.

5. Conclusions

Cities throughout the Global South struggle to offer its dwellers safe and inclusive sanitation services. This is also the case in Maputo, capital of Mozambique, where most of the fecal sludge generated is not treated [47,48]. In part due to this situation, more than half of the city’s population is supplied with groundwater where nitrate concentrations as high as 250 mg   L 1 have been reported [50]. To change this situation, a city-wide sanitation Masterplan, proposing improvements to sanitation and storm water drainage infrastructure, was commissioned.
In this work, we quantified the amount of nitrogen reaching groundwater each year, and up to which extent the Masterplan would be an improvement. Using Material Flow Analysis (MFA), we concluded that each year more than 500 tonnes of nitrogen, mostly from OSS systems, reach the city’s groundwater sources.
We demonstrated that the current version of the Masterplan falls short on improving the ongoing groundwater contamination by nitrate and proposed simplified sewer networks instead of only relying on OSS. Such approach not only demonstrates the added value of MFA as a planning and decision support tool, proving that such tools should be exploited more often to characterize the impact of planned urban sanitation in the Global South, but also adds to the argument of [76], according to whom “more attention is needed to how the planning process of sanitation infrastructure in cities across the Global South is designed and conducted”. In preliminary studies for such city-wide plans, when sanitation infrastructure is absent, external factors, such as environmental and health indicators, should also be taken into consideration.
These results will be the starting point for a cost–benefit analysis that will take into consideration not only the costs of initial investments and the costs of maintenance, but also direct health benefits through improved sanitation, and external factors such as environment protection and indirect health risk, through groundwater consumption, to further support local decision-making. Furthermore, a better characterization of the area, including more geo-hydrological data, and bringing together the results of our simulations and climatological, soil, and land-use information [77] could further lead to insightful conclusions about the situation in Maputo.

Acknowledgments

The authors would like to acknowledge the insightful comments made by the three anonymous reviewers to improve this manuscript.

Author Contributions

A.M.A. and I.C.S. collected the data, developed the mathematical model and implemented the code in SIMBOX. A.M.A. analyzed the data and wrote the paper. R.S. supported the development of the mathematical model and the implementation of the code in SIMBOX. I.C.S., R.S., M.H., N.P.M. and L.R. proofread the paper, contributed to the data analysis, scenario development and discussion. All authors read and approved the final manuscript.

Conflicts of Interest

The authors declare no conflict of interest.

References

  1. Wakida, F.T.; Lerner, D.N. Non-agricultural sources of groundwater nitrate: A review and case study. Water Res. 2005, 39, 3–16. [Google Scholar] [CrossRef] [PubMed]
  2. World Health Organization (WHO). Guidelines for Drinking-Water Quality—First Addendum to Third Edition—Volume 1—Recomendations; WHO: Geneva, Switzerland, 2006. [Google Scholar]
  3. Sajil Kumar, P.J.; Jegathambal, P.; James, E.J. Chemometric evaluation of nitrate contamination in the groundwater of a hard rock area in Dharapuram, South India. Appl. Water Sci. 2014, 4, 397–405. [Google Scholar] [CrossRef]
  4. Bernard, P.-Y.; Benoît, M.; Roger-Estrade, J.; Plantureux, S. Using biophysical models to manage nitrogen pollution from agricultural sources: Utopic or realistic approach for non-scientist users? Case study of a drinking water catchment area in Lorraine, France. J. Environ. Manag. 2016, 183, 260–274. [Google Scholar] [CrossRef] [PubMed]
  5. Malki, M.; Bouchaou, L.; Hirich, A.; Ait Brahim, Y.; Choukr-Allah, R. Impact of agricultural practices on groundwater quality in intensive irrigated area of Chtouka-Massa, Morocco. Sci. Total Environ. 2017, 574, 760–770. [Google Scholar] [CrossRef] [PubMed]
  6. Slabe-Erker, R.; Bartolj, T.; Ogorevc, M.; Kavaš, D.; Koman, K. The impacts of agricultural payments on groundwater quality: Spatial analysis on the case of Slovenia. Ecol. Indic. 2017, 73, 338–344. [Google Scholar] [CrossRef]
  7. Lockhart, K.M.; King, A.M.; Harter, T. Identifying sources of groundwater nitrate contamination in a large alluvial groundwater basin with highly diversified intensive agricultural production. J. Contam. Hydrol. 2013, 151, 140–154. [Google Scholar] [CrossRef] [PubMed]
  8. Pastén-Zapata, E.; Ledesma-Ruiz, R.; Harter, T.; Ramírez, A.I.; Mahlknecht, J. Assessment of sources and fate of nitrate in shallow groundwater of an agricultural area by using a multi-tracer approach. Sci. Total Environ. 2014, 470–471, 855–864. [Google Scholar] [CrossRef]
  9. Stuart, M.E.; Lapworth, D.J. Macronutrient status of UK groundwater: Nitrogen, phosphorus and organic carbon. Sci. Total Environ. 2015, 572, 1543–1560. [Google Scholar] [CrossRef] [PubMed]
  10. Ouedraogo, I.; Defourny, P.; Vanclooster, M. Mapping the groundwater vulnerability for pollution at the pan African scale. Sci. Total Environ. 2016, 544, 939–953. [Google Scholar] [CrossRef] [PubMed]
  11. Cronin, A.A.; Pedley, S.; Hoadley, A.W.; Kouonto Komou, F.; Haldin, L.; Gibson, J.; Breslin, N. Urbanisation effects on groundwater chemical quality: Findings focusing on the nitrate problem from 2 African cities reliant on on-site sanitation. J. Water Health 2007, 5, 441–454. [Google Scholar] [CrossRef] [PubMed]
  12. Kringel, R.; Rechenburg, A.; Kuitcha, D.; Fouépé, A.; Bellenberg, S.; Kengne, I.M.; Fomo, M.A. Mass balance of nitrogen and potassium in urban groundwater in Central Africa, Yaounde/Cameroon. Sci. Total Environ. 2016, 547, 382–395. [Google Scholar] [CrossRef] [PubMed]
  13. Nyenje, P.M.; Foppen, J.W.; Kulabako, R.; Muwanga, A.; Uhlenbrook, S. Nutrient pollution in shallow aquifers underlying pit latrines and domestic solid waste dumps in urban slums. J. Environ. Manag. 2013, 122, 15–24. [Google Scholar] [CrossRef] [PubMed]
  14. Wright, J.A.; Cronin, A.; Okotto-Okotto, J.; Yang, H.; Pedley, S.; Gundry, S.W. A spatial analysis of pit latrine density and groundwater source contamination. Environ. Monit. Assess. 2013, 185, 4261–4272. [Google Scholar] [CrossRef] [PubMed]
  15. Walraevens, K.; Mjemah, I.C.; Mtoni, Y.; Van Camp, M. Sources of salinity and urban pollution in the Quaternary sand aquifers of Dar es Salaam, Tanzania. J. Afr. Earth Sci. 2015, 102, 149–165. [Google Scholar] [CrossRef]
  16. Sadler, R.; Maetam, B.; Edokpolo, B.; Connell, D.; Yu, J.; Stewart, D.; Park, M.-J.; Gray, D.; Laksono, B. Health risk assessment for exposure to nitrate in drinking water from village wells in Semarang, Indonesia. Environ. Pollut. 2016, 216, 738–745. [Google Scholar] [CrossRef] [PubMed]
  17. Nga, D.T.; Thao, T.T.; Van Tu, V.; Phuc, P.D.; Nguyen-Viet, H. Development of nutrient cycle through agricultural activities of a rural area in the North of Vietnam. J. Mater. Cycles Waste Manag. 2016. [Google Scholar] [CrossRef]
  18. Suthar, S.; Bishnoi, P.; Singh, S.; Mutiyar, P.K.; Nema, A.K.; Patil, N.S. Nitrate contamination in groundwater of some rural areas of Rajasthan, India. J. Hazard. Mater. 2009, 171, 189–199. [Google Scholar] [CrossRef] [PubMed]
  19. Rajmohan, N.; Amarasinghe, U.A. Groundwater quality issues and management in Ramganga Sub-Basin. Environ. Earth Sci. 2016, 75, 1030. [Google Scholar] [CrossRef]
  20. Pujari, P.R.; Padmakar, C.; Labhasetwar, P.K.; Mahore, P.; Ganguly, A.K. Assessment of the impact of on-site sanitation systems on groundwater pollution in two diverse geological settings-a case study from India. Environ. Monit. Assess. 2012, 184, 251–263. [Google Scholar] [CrossRef] [PubMed]
  21. Shivendra, B.T.; Ramaraju, H.K. Impact of Onsite Sanitation System on Groundwater in Different Geological Settings of Peri Urban Areas. Aquat. Procedia 2015, 4, 1162–1172. [Google Scholar] [CrossRef]
  22. Templeton, M.R.; Hammoud, A.S.; Butler, A.P.; Braun, L.; Foucher, J.-A.; Grossmann, J.; Boukari, M.; Faye, S.; Patrice Jourda, J. Nitrate pollution of groundwater by pit latrines in developing countries. AIMS Environ. Sci. 2015, 2, 302–313. [Google Scholar] [CrossRef]
  23. Tindall, J.A.; Petrusak, R.L.; Mcmahon, P.B. Nitrate Transport and Transformation Processes in Unsaturated Porous-Media. J. Hydrol. 1995, 169, 51–94. [Google Scholar] [CrossRef]
  24. Brunner, P.H.; Rechberger, H. Practical Handbook of Material Flow Analysis; CRC Press: Boca Raton, FL, USA, 2003. [Google Scholar]
  25. Allesch, A.; Brunner, P.H. Material flow analysis as a decision support tool forwaste management: A literature review. J. Ind. Ecol. 2015, 19, 753–764. [Google Scholar] [CrossRef]
  26. Meinzinger, F.; Kröger, K.; Otterpohl, R. Material flow analysis as a tool for sustainable sanitation planning in developing countries: Case study of Arba Minch, Ethiopia. Water Sci. Technol. 2009, 59, 1911–1920. [Google Scholar] [CrossRef] [PubMed]
  27. Yiougo, L.; Koanda, H.; Luethi, C.; Wéthé, J. Application of the material flow analysis method for evaluating strategic sanitation plan in Sub-Saharan Africa: The case of Fada N’Gourma-Burkina Faso. Water Sci. Technol. 2011, 63, 2498–2504. [Google Scholar] [CrossRef] [PubMed]
  28. Buchner, H.; Laner, D.; Rechberger, H.; Fellner, J. Material flow analysis as basis for efficient resource management—The case of aluminium flows in Austria. Metall. Res. Technol. 2014, 111, 351–357. [Google Scholar] [CrossRef]
  29. Palm, V.; Östlund, C. Lead and zinc flows from technosphere to biosphere in a city region. Sci. Total Environ. 1996, 192, 95–109. [Google Scholar] [CrossRef]
  30. Baccini, P. Understanding regional metabolism for a sustainable development of urban systems. Environ. Sci. Pollut. Res. 1996, 3, 108–111. [Google Scholar] [CrossRef] [PubMed]
  31. Roy, M.; Curry, R.; Ellis, G. Spatial allocation of material flow analysis in residential developments: A case study of Kildare County, Ireland. J. Environ. Plan. Manag. 2014, 0568, 1–21. [Google Scholar] [CrossRef] [Green Version]
  32. Hendriks, C.; Obernosterer, R.; Müller, D.; Kytzia, S.; Baccini, P.; Brunner, P.H. Material Flow Analysis: A tool to support environmental policy decision making. Case-studies on the city of Vienna and the Swiss lowlands. Local Environ. 2000, 5, 311–328. [Google Scholar] [CrossRef]
  33. Van der Hoek, J.P.; de Fooij, H.; Struker, A. Wastewater as a resource: Strategies to recover resources from Amsterdam’s wastewater. Resour. Conserv. Recycl. 2016, 113, 53–64. [Google Scholar] [CrossRef]
  34. Buathong, T.; Boontanon, S.K.; Boontanon, N.; Surinkul, N.; Harada, H.; Fujii, S. Nitrogen Flow Analysis in Bangkok City, Thailand: Area Zoning and Questionnaire Investigation Approach. Procedia Environ. Sci. 2013, 17, 586–595. [Google Scholar] [CrossRef]
  35. Do-Thu, N.; Morel, A.; Nguyen-Viet, H.; Pham-Duc, P.; Nishida, K.; Kootattep, T. Assessing nutrient fluxes in a Vietnamese rural area despite limited and highly uncertain data. Resour. Conserv. Recycl. 2011, 55, 849–856. [Google Scholar] [CrossRef]
  36. Erni, M.; Bader, H.-P.; Drechsel, P.; Scheidegger, R.; Zurbrügg, C.; Kipfer, R. Urban water and nutrient flows in Kumasi, Ghana. Urban Water J. 2011, 8, 135–153. [Google Scholar] [CrossRef]
  37. Montangero, A.; Le, C.N.; Nguyen, V.A.; Vu, D.T.; Pham, T.N.; Belevi, H. Optimising water and phosphorus management in the urban environmental sanitation system of Hanoi, Vietnam. Sci. Total Environ. 2007, 384, 55–66. [Google Scholar] [CrossRef] [PubMed]
  38. Woltersdorf, L.; Scheidegger, R.; Liehr, S.; Döll, P. Municipal water reuse for urban agriculture in Namibia: Modeling nutrient and salt flows as impacted by sanitation user behavior. J. Environ. Manag. 2016, 169, 272–284. [Google Scholar] [CrossRef] [PubMed]
  39. Firmansyah, I.; Spiller, M.; de Ruijter, F.J.; Carsjens, G.J.; Zeeman, G. Assessment of nitrogen and phosphorus flows in agricultural and urban systems in a small island under limited data availability. Sci. Total Environ. 2016, 574, 1521–1532. [Google Scholar] [CrossRef] [PubMed]
  40. The World Bank World Bank Supports Mozambique in Harnessing the Transformative Potential of Its Growth through Smart Reforms. Available online: http://www.worldbank.org/en/news/press-release/2015/12/22/world-bank-supports-mozambique-in-harnessing-the-transformative-potential-of-its-growth-through-smart-reforms (accessed on 15 March 2016).
  41. United Nations Development Programme (UNDP). Human Development Report 2015—Work for Human Development; UNDP: New York, NY, USA, 2015. [Google Scholar]
  42. Jenkins, P. City profile: Maputo. Cities 2000, 17, 207–218. [Google Scholar] [CrossRef]
  43. Kemp, L.; Fairhurst, L.; Rowswell, P.; Quayle, T. Sub-Saharan African Cities: A Five-City Network to Pioneer Climate Adaptation through Participatory Research & Local Action—Maputo Baseline Study. Available online: http://resilientafrica.org/Resources/Final%20Resources/ICLEI%20Africa_5%20City%20Adaptation%20Network_Maputo%20Downscaled%20Climate%20Report.pdf(accessed on 15 March 2018).
  44. UN-HABITAT. Global Atlas of Excreta, Wastewater Sludge, and Biosolids Management: Moving forward the Sustainable and Welcome Uses of a Global Resource; LeBlanc, R.J., Matthews, P., Richard, R.P., Eds.; UN-HABITAT: Nairobi, Kenya, 2008. [Google Scholar]
  45. Instituto Nacional de Estadística (INE). III Recenseamento Geral da População e Habitação em 2007. Indicadores Socio-demográficos Distritais. Maputo Província; INE: Madrid, Spain, 2011. [Google Scholar]
  46. Rietveld, L.C.; Siri, J.G.; Chakravarty, I.; Arsénio, A.M.; Biswas, R.; Chatterjee, A. Improving health in cities through systems approaches for urban water management. Environ. Health 2016, 15 (Suppl. 1), S31. [Google Scholar] [CrossRef] [PubMed]
  47. Water and Sanitation Programme (WSP). Caracterização do Saneamento em Maputo; WSP: Maputo, Mozambique, 2014. (In Portuguese) [Google Scholar]
  48. Bäuerl, M.; Muximpua, O.; Arsénio, A.M.; Zimba, E. Attitudes and practises with regard to emptying of onsite systems in Maputo, Mozambique. In Proceedings of the 38th WEDC International Conference, Loughborough, UK, 27–31 July 2015; Volume 1, pp. 1–5. [Google Scholar]
  49. Hydroconseil-WEConsult. Sustainable Management of the Groundwater Resources in the Maputo Metropolitan Areas—Main Report; Hydroconseil-WEConsult: Maputo, Mozambique, 2011. [Google Scholar]
  50. Bhatt, J. Comparison of small-scale providers’ and utility performance in urban water supply: The case of Maputo, Mozambique. Water Policy 2014, 16, 102–123. [Google Scholar] [CrossRef]
  51. Nogueira, G.E.H. Tracing the Hydrochemical Water Types and Salinization Mechanisms in the Great Maputo Area as a Function of Groundwater Recharge, Hydrogeological Properties and Human Activities; IHE: Delft, The Netherlands, 2017. [Google Scholar]
  52. Vicente, E.M.; Jermy, C.A.; Schreiner, H.D. Urban geology of Maputo, Mocambique. In Proceedings of the 10th IAEG International Congress, Nottingham, UK, 6–10 September 2006. [Google Scholar]
  53. Matsinhe, N.P.; Juízo, D.; Rietveld, L.C.; Persson, K.M. Water services with independent providers in peri-urban Maputo: Challenges and opportunities for long-term development. Water SA 2008, 34, 411–420. [Google Scholar]
  54. Muxímpua, O.; Hawkins, P. Building Blocks for Effective Faecal Sludge Management in Per-Urban Areas: The Role of Small-Scale Service Providers in Maputo. In Proceedings of the 2nd International Feacal Sludge Management Conference, Durban, South Africa, 29–31 October 2012. [Google Scholar]
  55. Montangero, A. Material Flow Analysis—A Tool to Assess Material Flows for Environmental Sanitation Planning in Developing Countries; Eawag: Dübendorf, Switzerland, 2007. [Google Scholar]
  56. Woltersdorf, L.; Liehr, S.; Scheidegger, R.; Döll, P. Small-scale water reuse for urban agriculture in Namibia: Modeling water flows and productivity. Urban Water J. 2015, 12, 414–429. [Google Scholar] [CrossRef]
  57. Montangero, A.; Belevi, H. An approach to optimise nutrient management in environmental sanitation systems despite limited data. J. Environ. Manag. 2008, 88, 1538–1551. [Google Scholar] [CrossRef] [PubMed]
  58. INAM. Instituto Nacional de Metereologia. Available online: http://www.inam.gov.mz (accessed on 9 May 2016).
  59. Tadross, M.; Johnston, P. Climate Change Projections for Walvis Bay: Adding Value through Downscaling; IDRC: Cape Town, South Africa, 2011. [Google Scholar]
  60. FAOSTAT Food Balance Sheets for Mozambique. Available online: http://www.fao.org/faostat/en/#data/FBS (accessed on 10 February 2017).
  61. Food and Agriculture Organization (FAO); World Health Organization (WHO). Codex Alimentarius—Cereals, Pulses, Legumes and Vegetable Proteins, 1st ed.; WHO: Geneva, Switzerland, 2007. [Google Scholar]
  62. Gustavsson, J.; Cederberg, C.; Sonesson, U.; van Otterdijk, R.; Meybeck, A. Global Food Losses and Food Waste—Extent, Causes and Prevention; FAO: Rome, Italy, 2011. [Google Scholar]
  63. Tas, A.; Belon, A. A Comprehensive Review of the Municipal Solid Waste Sector in Mozambique—Background Documentation for the Formulation of Nationally Appropriate Mitigation Actions in the Waste Sector in Mozambique; Carbon Africa Limited: Nairobi, Kenya, 2014. [Google Scholar]
  64. Baucom, I.K.; Ruhl, C.H. CCP Landfill Leachate Generation and Leachate Management. In Proceedings of the 2013 World of Coal Ash (WOCA) Conference, Lexington, Kentuck, 22–25 April 2013. [Google Scholar]
  65. American Institute of Architecture Students (AIAS). Sanitation and Drainage Master Plan for the Greater Maputo Metropolitan Area; AIAS: Maputo, Mozambique, 2015. [Google Scholar]
  66. Montangero, A.; Belevi, H. Assessing nutrient flows in septic tanks by eliciting expert judgement: A promising method in the context of developing countries. Water Res. 2007, 41, 1052–1064. [Google Scholar] [CrossRef] [PubMed]
  67. Muiuane, E. The Quality of Groundwater in and around Maputo City, Mozambique, Universidade Eduardo Mondlane; Universidade Eduardo Mondlane: Maputo, Mozambique, 2007. [Google Scholar]
  68. Food and Agriculture Organization (FAO). Food Composition Table for Use in Africa; FAO: Rome, Italy, 1968. [Google Scholar]
  69. Korkalo, L.; Hauta-alus, H.; Mutanen, M. Food Composition Tables for Zambia; Department of Food and Environmental Sciences University of Helsinki: Helsinki, Finland, 2011. [Google Scholar]
  70. Landau, D.P.; Binder, K. A Guide to Monte Carlo Simulations in Statistical Physics; Cambridge University Press: Cambridge, UK, 2014; ISBN 978-1-107-07402-6. [Google Scholar]
  71. Boot, N.L.D. The use of transfer stations for faecal sludge management in Accra, Ghana. Waterlines 2008, 27, 71–81. [Google Scholar] [CrossRef]
  72. Schaffner, M.; Bader, H.P.; Scheidegger, R. Modeling the contribution of point sources and non-point sources to Thachin River water pollution. Sci. Total Environ. 2009, 407, 4902–4915. [Google Scholar] [CrossRef] [PubMed]
  73. Dodane, P.-H.; Mbéguéré, M.; Sow, O.; Strande, L. Capital and Operating Costs of Full-Scale Faecal Sludge Management and Wastewater Treatment Systems in Dakar, Senegal. Environ. Sci. Technol. 2012, 46, 3705–3711. [Google Scholar] [CrossRef] [PubMed]
  74. Paterson, C.; Mara, D.; Curtis, T. Pro-poor sanitation technologies. Geoforum 2007, 38, 901–907. [Google Scholar] [CrossRef]
  75. Jenkins, M.; Cumming, O.; Cairncross, S. Pit Latrine Emptying Behavior and Demand for Sanitation Services in Dar Es Salaam, Tanzania. Int. J. Environ. Res. Public Health 2015, 12, 2588–2611. [Google Scholar] [CrossRef] [PubMed]
  76. McConville, J.R. Unpacking Sanitation Planning—Comparing Theory and Practice; Chalmers University of Technology: Gothenburg, Sweden, 2010. [Google Scholar]
  77. Neitsch, S.; Arnold, J.; Kiniry, J.; Williams, J. Soil and Water Assessment Tool, Theoretical Documentation, Version 2009; Technical Report No. 406; Texas Water Resources Institute: College Station, TX, USA, 2011. [Google Scholar]
Figure 1. System description of water and nutrient flows in Maputo. OSS = on-site sanitation. WWTP = wastewater treatment plant. GW = greywater. WW = wastewater. DW = drinking water. ET = evapotranspiration. Boxes denote processes and arrows represent water and nitrogen flows. Adapted from [57].
Sustainability 10 00858 g001
Figure 2. Daily volume of wastewater (WW) conveyed to the wastewater treatment plant (WWTP) for the current situation and for the three development scenarios. This plot depicts median, upper and lower quartiles, minimum and maximum; outliers are presented as circles.
Sustainability 10 00858 g002
Figure 3. Daily volume of fecal sludge (FS) conveyed to the wastewater treatment plant (WWTP) for the current situation and for three development scenarios. This plot depicts median, upper and lower quartiles, minimum and maximum; outliers are presented as circles.
Sustainability 10 00858 g003
Figure 4. Nitrogen reaching groundwater each year for the current situation and for three improvement scenarios. This plot depicts median, upper and lower quartiles, minimum and maximum; outliers are presented as circles.
Sustainability 10 00858 g004
Figure 5. Origin of nitrogen reaching groundwater for the current situation (CS) and for three development scenarios. Greywater = Landfill = leachate from landfill; Leakage = leakage from the drinking water distribution networks; OAD = open-air defecation; OSS = infiltration from OSS; and Sewer = exfiltration from sewer infrastructure. These plots depict median, upper and lower quartiles, minimum and maximum; outliers are shown as circles.
Sustainability 10 00858 g005
Figure 6. The corresponding change in value for three variables, Fecal sludge transported to the WWTP (FS2WWTP), Nitrogen reaching groundwater (N2GW), and wastewater conveyed to WWTP (WW2WWTP), are given for a 100% increase of the parameter’s value. Only parameters that produce more than 50% change are depicted. GrW = greywater. GW = groundwater. N = nitrogen. ST = septic tank. WW = wastewater. WWTP = wastewater treatment plant.
Sustainability 10 00858 g006
Table 1. List of input parameters for the MFA model. For uniform distributions Mean and Standard deviation depict, respectively, minimum and maximum values.
UnitsProbability DistributionMeanStandard DeviationReference(s)
PopulationCapTruncated normal1,980,26399013[45]
Precipitationmm year−1Normal81141[58]
Evapotranspirationmm year−1Normal130065[59]
Area of MaputohaNormal108,5000Local experts
% N that reaches GW[-]Uniform812[13]
% the population supplied by SSIPs[-]Truncated normal372Local experts
% the population supplied by ARM from SW[-]Truncated normal995Local experts
Total water supplied by ARMm3 year−1Normal39,773,1501,988,658Local experts
Total water supplied SSIPsm3 year−1Normal23,691,4721,184,574Local experts
% leakage by ARM from GW[-]Truncated normal281Local experts
% leakage by ARM from SW[-]Truncated normal412Local experts
% leakage by SSIPs from GW[-]Truncated normal201Local experts
% water supplied by SSIPs to households[-]Truncated normal955Local experts
% water supplied by ARM to households[-]Truncated normal714Local experts
Pulses consumptionKg cap−1 year−1Normal141[60]
Fish, seafood consumptionKg cap−1 year−1Normal80.81[61]
Fruits consumptionKg cap−1 year−1Normal263[60]
% population with ST[-]Truncated normal390.39[47]
% population with pour-flush latrines[-]Truncated normal130.13[47]
% population with improved latrine[-]Truncated normal320.32[47]
% population with traditional latrine[-]Truncated normal100.1[47]
% population with sewer[-]Truncated normal50.06[47]
GrW generation rate with STL.cap−1 day−1Normal503Local experts
GrW generation rate with pour-flush latrineL.cap−1 day−1Normal352Local experts
GrW generation rate with sewerL.cap−1 day−1Normal503Local experts
Excreta generation rateKg cap−1 day−1Normal0.250.03[57]
Water for WC flushL.cap−1 day−1Normal100.5Local experts
Water for pour-flushL.cap−1 day−1Normal101Local experts
Kitchen waste production at householdKg cap−1 year−1Normal80.8[62]
% kitchen waste that is collected and transported to landfill[-]Uniform74100[63]
% water in kitchen waste[-]Uniform3763Authors’ assumption
% of water in detergent[-]Uniform70100Authors’ assumption
GrW generation rate with latrinesL.cap−1 year−1Uniform261Authors’ assumption
% GrW to OSS (with ST)[-]Truncated normal170.85[47,48]
% GrW to OSS (with latrines)[-]Truncated normal170.85[47,48]
% ST that fills up[-]Truncated normal412[47,48]
% pour-flush latrine that fill up[-]Truncated normal150.75[47,48]
% improved latrine that fill up[-]Truncated normal251[47,48]
% traditional latrine that fill up[-]Truncated normal130.65[47,48]
% ST formally emptied[-]Truncated normal563[47,48]
% pour-flush latrines formally emptied[-]Truncated normal372[47,48]
% improved latrines formally emptied[-]Truncated normal140.7[47,48]
% traditional latrines formally emptied[-]Truncated normal60.3[47,48]
% ST that are emptied[-]Truncated normal573[47,48]
% pour-flush latrines that are emptied[-]Truncated normal513[47,48]
% improved latrines that are emptied[-]Truncated normal332[47,48]
% traditional latrines that are emptied[-]Truncated normal201[47,48]
% FS conveyed to the WWTP[-]Truncated normal1005[47,48]
Area of landfillhaTruncated normal170.85[63]
% rain becoming leachate[-]Truncated normal303[64]
% impervious area in the city[-]Truncated normal70.35[65]
% dry weather in year[-]Truncated normal402[58]
% GW infiltration to sewer network[-]Truncated normal202[66]
% exfiltration from sewer network[-]Truncated normal101[66]
% WW conveyed to WWTP[-]Truncated normal302Local experts
% area occupied by sewer network[-]Truncated normal0.690.03[65]
Area of the lagoon systemHaNormal40.19Local experts
% losses due to seepage in the lagoon system[-]Truncated normal202[66]
N concentration in GW abstracted by SSIPsmg L−1Lognormal927[50,67]
N concentration in GW abstracted by ARMmg L−1Lognormal557[50,67]
N concentration in surface water abstracted by ARMmg L−1Lognormal00Local experts
N concentration in pulsesg kg−1Lognormal111[66,68,69]
N concentration in fish, seafoodg kg−1Lognormal303[66,68,69]
N concentration in fruitsg kg−1Lognormal10.11[66,68,69]
N concentration in leachate from landfillmg L−1Lognormal1100110[36,66]
N removal efficiency (%)[-]Truncated normal105Local experts
N removed that turns into biomass (%)[-]Uniform59100Authors’ assumption
Table 2. Change in input parameters for Scenario calculation. ST = septic tanks. PFL = pour–flush latrines. IL = improved latrines. TL = traditional latrines.
% Sewer 1% OSS 2Type of OSSOSS That Fill-Up 3OSS Emptied 4OSS Formally Emptied 5
Current situation5946ST412313
PFL1583
IL2581
TL1330
Scenario MP1486ST412920
PFL15104
IL25102
TL1330
Scenario MPS3763ST412920
PFL15104
IL25102
TL1330
Scenario MPO1486ST513726
PFL19126
IL31132
TL1640
1 % of the total population covered by sewer network; 2 % of the total population covered by onsite sanitation systems; 3 As % of the total; 4 As % of the systems that fill up; 5 As % of the systems that are emptied; 6 In the current situation, 1% of the population practices open-air defecation.
Table 3. Comparison between the current situation and the three development scenarios. The values depicted are averages.
FS Conveyed to TP (m3 Day−1)WW Conveyed to TP (m3 Day−1)N Reaching GW (Tonne Year−1)
Current situation (CS)19772353492
Scenario MP289118214424
Scenario MP/CS1.467.740.86
Scenario MPS210943302350
Scenario MPS/CS1.0718.40.71
Scenario MPO450217983397
Scenario MPO/CS2.287.640.81
Table 4. Ranking of parameter knowledge for variable “nitrogen reaching groundwater”.
Cumulative Ranking (%)
ParameterFecal Sludge Transported to WWTP
Population18.8
% fecal sludge conveyed to WWTP37.5
% of septic tanks that fill up54.2
% of septic tanks that are emptied70.8
% of septic tanks that formally emptied87.4
Water used for flush92.2
Greywater generation rate for population with septic tanks95.6
% greywater into OSS for population with septic tanks99
Wastewater conveyed to WWTP
% of wastewater conveyed to WWTP33.3
Population61
Greywater generation rate for population with sewer80
% wet weather in the year92.3
% dry weather in the year95.4
% of groundwater infiltration into sewer97.2
% of population with sewer98.3
Water used for flush99.1
Nitrogen reaching groundwater
% of nitrogen that reaches groundwater40.9
% of nitrogen in total food protein65.6
Total food protein90.4
Population97.8
% users supplied by ARM from surface water sources98.8
Concentration of nitrogen in GW abstracted by SSIPs99.3

