Review

Identification and Alignment of the Social Aspects of Sustainable Manufacturing with the Theory of Motivation

College of Engineering and Technology, University of Derby, Markeaton Street, Derby DE22 3AW, UK
*
Author to whom correspondence should be addressed.
Sustainability 2018, 10(3), 852; https://doi.org/10.3390/su10030852
Submission received: 12 February 2018 / Revised: 9 March 2018 / Accepted: 10 March 2018 / Published: 17 March 2018
(This article belongs to the Section Economic and Business Aspects of Sustainability)

Abstract

:
The relevance of adopting environmentally friendly manufacturing process to economic development has been studied and established in many research. Empirical studies have also confirmed that organisations adopting green technology or clean production are benefiting from increasing economic growth and job creation. However, the studies of the benefits of social development to economic growth and manufacturing sustainability have not been adequately captured or itemised in the literature. With the aim of contributing to this research streams, this paper applied the principles of social economy and reciprocity, and the theories of motivation and social exchange to guide the integration of social aspects into sustainability analytical equations. The Herzberg two-factor theory of motivation was adopted to classify the negative and positive social impacts of the workers’ stakeholder category. Further, the approach aligns the Herzberg extrinsic factors with the negative and regulated social aspects and intrinsic factors with the positive and unregulated social aspects. This contribution provides an initial theoretical framework that will enable practitioners to capture and calculate the social impact coefficient of an organisation. The result can be used to assess the social impacts on productivity, and corporate social responsibility towards the employees. It will also provide an input for analytical or simulation models to assess the consequential effects of social aspects on other sustainability dimensions.

1. Introduction

Sustainable development has been posited by various researchers to anchor on the three sustainability pillars: environmental, economic and social. It is worth mentioning that the three pillars are equally important in the current competitive and sustainability-driven markets [1,2,3]. In the past the industries had focused more on the economic aspects in gaining and sustaining their competitive positions, this has changed in the recent years following the Brundtland report which centered on incorporating the sustainability of the future generations into our decision for meeting today’s needs [2]. The legislation and government regulations coupled with the changes in consumers’ preference for ethical and environmentally friendly products are other factors that are changing the way companies and organisations perceive and drive their competitive goals [4]. Another challenge is the dynamism of the manufacturing environment and the need to balance the business competitive goal with sustainability requirements. Currently, there are tools capable of capturing the economic and environmental aspects for performance analysis, and research has shown the economic benefits of adopting environmentally friendly production. However, due to the challenge of capturing the qualitative social impacts, the performance of social aspects has not been interdependently analysed in the balanced sustainability equation. According to [5], the performance of social, economic and environmental dimensions must be interdependently assessed in an analytical equation for effective decision-making [1]. Hence, the approach of analysing social aspects separately from other sustainability aspects is deemed segmented and does not support effective sustainability decision. The inability of corporate organisations to evaluate the economic importance of incorporating social initiatives into businesses is revealed in the level of focus given to social issues [6]. Various studies have demonstrated the importance of integrating the three sustainability dimensions into the product, process and system levels of sustainability [7,8]. The recent publications of the international organisations further emphasised the need for the integration and analysis of the interdependencies of the three dimensions for effective decision-making and control of unintended negative consequences [1].
Whereas, while the evidence of economic benefits of integrating environmental protection strategies such as lean-green and design for remanufacturing in the classical manufacturing process has been captured in the literature [4,9,10], the implications of integrating social aspects of sustainability remain unclear. The translation of the qualitative aspects of social dimension into corresponding quantitative indicators also remains challenging to the practitioners as well as researchers. Thus, often leave the social aspects out of the sustainability analytical equations. To support effective sustainability decision-making, analytical tools such as data envelopment analysis, mathematical models and simulation models have been used to assess the interdependency of one dimension over the other [11,12,13]. According to [14], the interdependency of various social aspects on other dimensions needs to be studied in order to deduce appropriate indicators. Similarly, the UNEP/SETAC guidelines for Social Life Cycle Assessment (S-LCA) framework [15], advised the identification of the categories of affected stakeholders and their associated impacts subcategories across a product lifecycle. The Global Reporting Initiatives framework [16] also stated in the background of most of the employees’ related social disclosures, the importance of the social initiatives in boosting employee morale and productivity. Hence, social impact assessment of a product/process needs to reflect both the intrinsic and extrinsic social aspects in order to support effective assessment and improvement decisions [16,17].
In this research, the authors examined some theories and principles such as the social economy principles, social exchange theory, and motivational theory that are related to management and organisational psychology in order to establish a viewpoint then, combined motivational and commitment models into an integrated framework. First, the study used Herzberg motivational theory to explain the motivational model and sustainability social aspects to explain the commitment model before aligning the models into a single framework. The Herzberg’s two-factor theory of motivation is most relevant to this study because it establishes the study of motivation in the workplace and provides a framework to understand the mutual relationships between employer and employee, and the implications of social initiatives on work-force [18]. This study establishes the fact that organisational social development can lead to employees’ commitment to work and improve productivity without the “KITA” (Kick In The A**) approach to employees’ motivation [19,20]. Thus, social development is driven by the ethical duties and moral obligations of corporate organisations to ensure the social well-being of their employees.
The next section of this study covers the importance of social impacts assessment and identifies the stakeholders’ categories and subcategories in a product lifecycle, followed by section three which covers the relationships between social impacts and motivations at workplace, section four describes the theory of reciprocity as related to employees’ productivity, section five details the alignment of social impacts assessment with Herzberg two-factor theory and the process of calculating the social impacts coefficient. Section 6 demonstrates how social impact coefficient is calculated in a hypothetical scenario and section seven summarises the study and conclude.

2. The Importance of Social Impacts Assessment in a Product Lifecycle

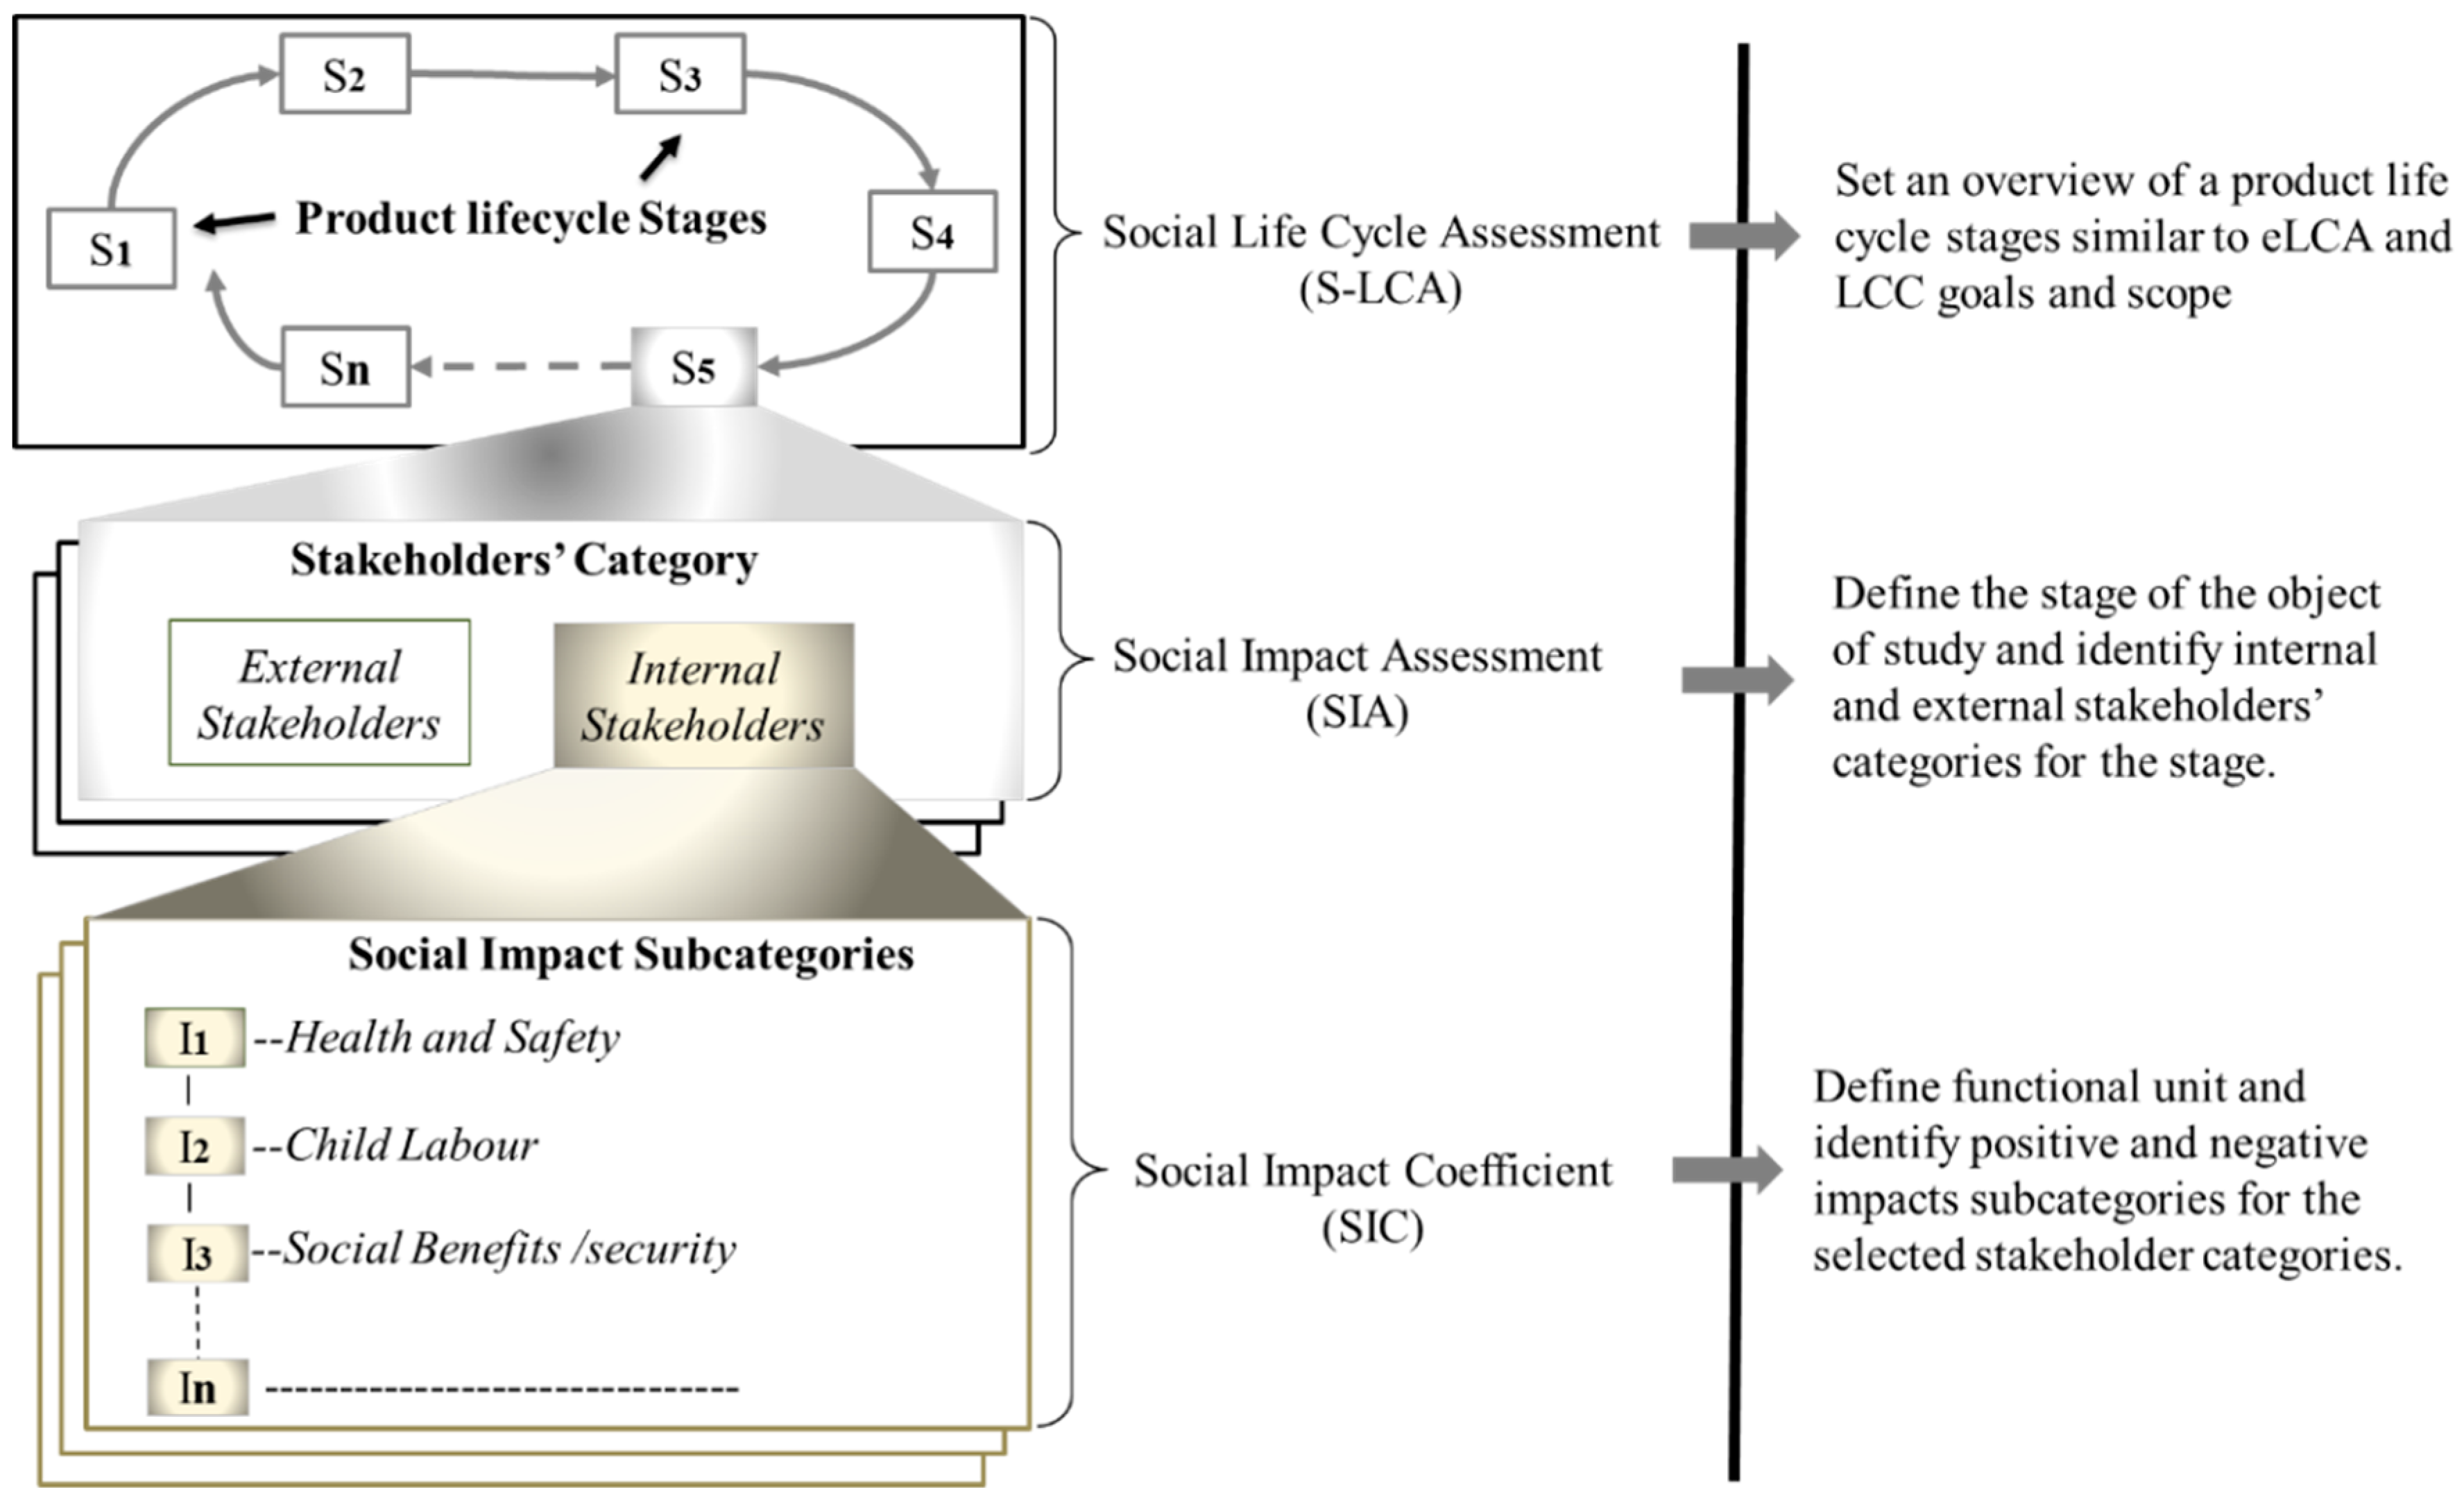
The manufacturing production processes have been identified as social hotspots which are associated with both high risks of negative social impacts and high opportunities for positive social impacts. Depending on the stakeholders’ category in the product lifecycle, the assessment and remedial actions of the impacts are critical to sustainable product development. Research on Social Life Cycle Assessment (S-LCA) are prevalent, however, the translation and effects of the negative and positive social impacts on economic and environmental dimensions are yet to be harnessed in the research. Similarly, there are acknowledged challenges associated with the development and application of social and socio-economic life cycle assessment [17,21]. In the early development stages and research of environmental Life Cycle Assessment (eLCA), social aspects were included in the methodology [21]. This was due to various environmental impacts identified to directly or indirectly give rise to social impacts and many social activities that resulted in environmental impacts [21]. The difficulty of capturing and integrating the qualitative social aspects into the quantitative environmental aspects, however, increased the complexity of the LCA framework [17,21]. Amongst the three sustainability dimensions, the social indicators are often classified as positive indicators due to their positive contribution [22]. The S-LCA guidelines, however, grouped the social impacts into positive and negative impacts. The positive social impacts are defined as the “social performances that go beyond compliance”; hence, any social aspect or benefits that are provided and protected by appropriate laws may not be seen as a positive social impact [23]. Other challenges with this classification are the effects and response provoked by social impacts as soon as there are changes in the social conditions of certain stakeholders [24]. The function of S-LCA is, however, to allow identification and assessment of key social issues and detail their impacts on the production, use and through the product end of life choices [17,21]. Fontes [17] defines S-LCA as the evaluation of the potential social impacts of a product or a service throughout its lifecycle stages. According to Fontes [17], an aligned social impact can improve the economic performance of an organisation. Figure 1 depicts an example of product lifecycle stages covered by S-LCA. At each of the stages, Social Impact Assessment (SIA) is conducted to assess the social performance of the stage. The aggregation of the SIA of a product lifecycle stages, therefore, represents the S-LCA.

2.1. Social Life Cycle Assessment

In consensus with the international group of experts leading research in the field of social, economic and environmental impacts of a product lifecycle, the UNEP/SETAC in 2009 published the guidelines to clarify the impact of a product S-LCA, and compliment the guidelines for eLCA and Life Cycle Costing (LCC). The ISO 14040 LCA framework [25] has been standardised and is used by various practitioners to assess the environmental impacts of their processes throughout a product lifecycle [26]. Though the approach has been criticised by many authors for its overwhelming data collection process, time-consuming and environmental centric, the principles and procedures remain indubitable. According to Benoît et al. [21], a different level of assessments is often applied along the supply chain due to political and cultural differences across the chain. For instance, a developed country may have legislation and laws in place to cover workers right whereas this might not be so in a developing country. The functions of Social Life Cycle Assessment (S-LCA) are, therefore, to identify and assess the key social issues at every stage of the product lifecycle and detail their impacts through to the use and product end of life stages. S-LCA spans internal and external stakeholders across a product lifecycle [21]. There are five major stakeholders’ categories: the workers, local communities, customers, suppliers, and national and global societies (see Table 1) which are related to the geographical locations such as factories, roads, mines, shops, recycling firms, disposal sites and warehouses where processes are carried out [12,21]. The government and non-government agencies, future generations and the businesses are other stakeholders’ categories relevant to S-LCA [21].

2.2. Social Impacts Assessment and Social Impact Subcategories

The Social Impact Assessment (SIA) is an approach for assessing the social impacts occurring at a single process and or facility level [15,17,21]. For example; the social impact assessment of a project site, product lifecycle stage, jobbing or batch process. Fontes [17] suggested that since social impact assessment is consistent with the principles of environmental and economic assessments, it should be integrated into the entire sustainability assessment of a product (see Figure 2). However, the author encouraged the documentation of social issues and benefits associated with a product at every identified social hotspot in order to drive programmes for performance improvements [17,21]. Social hotspots as defined by Benoît et al. [21], is the “unit processes that are within a sector and region that has high risks of negative impact or high opportunities for positive impact”. Table 2 shows an example of impact subcategories of workers’ stakeholder category with the corresponding positive and negative impacts types. The positive social impacts present high opportunities for workers wellbeing and performance improvement, while the negative social impacts present high risks both to the worker’s’ well-being and the business economic growth. The government regulations and legislation provide instruments to enforce Corporate Social Responsibility (CSR), and its compliance is a starting point for organisation’s social sustainability. However, while CSR uses management information to address social impacts mostly at the enterprise level [21]; SIA concentrates on the social impacts occurring at a specific phase of the organisation. Figure 2 represents the process of breaking down a product lifecycle into social impact assessment stages and impact subcategories.

3. Social Impacts and Motivations at Workplace

The object of study for eLCA, LCC and S-LCA is the entire product lifecycle; from cradle to grave [15,21]. However, because of the challenges and associated complexity of data collection, this research adopts the gate-to-gate approach [26,29]. The objective is to assess the social impacts and its influence on the productivity within the manufacturing production domain. Hence, the object of study, in this case, is the manufacturing stage of a product lifecycle and the focus are the workers’ stakeholders’ category. Research in workers’ behaviour has posited that negative social impacts can lead to high employees’ turnover rate, social instability and downturn in productivity. While identification of positive social impacts can be enhanced to promote improvement programmes that would lead to employees commitments and increase in performances [17,21,30,31].
The relationships between employees’ motivation and commitment have long been an interesting field of study for organisations and manufacturing practitioners. This is due to the notion that motivation influences workers’ commitments or behaviour to work and, leads to increase in productivity [20,30,31]. According to Afful-Broni [31], motivation is the driving force that makes persons stay focus and determined to achieve their set goals irrespective of any opposing challenge. However, while motivational theories have to do with the organisational strategy or goal-setting for increasing task performance [20], commitment according to research, has to do with sociology and social psychology and a potential tool to predict employee turnover. According to Meyer et al. [30], commitments can take the form of “effective attachment to the organization, obligation to remain, and the perceived cost of leaving”. Commitment can also be directed towards a target such as an organisation to the employee. Motivation, in the other hand, which has to do with the organisation goal-setting, may lead to job and work avoidance, protest, vengeance, and defiance depending on whether the employees are satisfied or dissatisfied.

4. The Theory of Reciprocity and Employees’ Productivity

Relating social development and its benefits to other sustainability dimensions especially, economic growth is an on-going study. Currently, there is a shift from the economic theory that considers principles of cooperation as something obscure or marginal [32]. According to the author, “human beings are not to be considered as self-centred individuals but ‘gift exchanging animals’, naturally, capable of cooperating for mutual benefits”. According to Ryan and Deci [33], “Human beings can be proactive and engaged or, alternatively, passive and alienated, largely as a function of the social conditions in which they develop and function”. These statements expressly explain the strong links between an individual performance and his social wellbeing or environments. The recent result of an American research firm, Gallup, shows that “only 33% of US employees are practically engaged in their work, while others are just marking time or actively undermining their companies” [34]. It is certain that having a great number of workers for a task is not tantamount to higher productivity, human workers are cognitive and social beings: they are sensitive, respond to their environmental stimuli, undergo stress and depression, have expectations and responsibilities. Thus, neglecting the investment in the social wellbeing of the workers does not only hamper their productivity but the goal of sustainable development.

4.1. Social Economy and Social Exchange Theory

The adoption of principles such as the social economy and Social Exchange Theory (SET), which are based on reciprocity and mutual cooperation establishes the connection between the society and economy and tends to meet the social needs often neglected by the public and private economy. Social economy emphasises on the animate behaviour of human beings, establishes the links between society and economy, and promotes the needs for collective mutual benefits and cooperation. [32]. According to the author, it inserts social goals such as welfare for workers and consumers, introduces reciprocity and environmental protection into economic thinking and decision-making. OCED [35] asserts it is paramount for social economy to seek to capture all elements related to the social and economic dimensions.
The Social Exchange Theory (SET) is mostly used by researchers to explain the reciprocity and relationship between perceived organisational investment in employee development and the employees’ commitments to work [14,36,37,38]. SET involves series of interactions that lead to employees’ citizenship behaviour thus; it explains the rule of reciprocity that results in a mutual and complementary transaction between two parties. According to Konovsky and Pugh [37], Citizenship behaviour is an employee behaviour that exceeds the call of duty and this is driven by the organisation’s development of the employee’s trust. Thibaut and Kelley [36] refer to this behaviour as a comparison level or threshold at which an employee perceives an offer to be attractive and results in motivation to work. Various organisations such as cooperatives, credit unions, religious organisations, not-for-profit organisations and recreational groups are examples of social enterprises that adopt these principles for building healthy and sustainable communities through cooperation, solidarity and reciprocity [32,35]. According to Magzan [32], “social economy would enable the market economy to become socially accountable, and self-reliant while remaining competitive, productive and profitable”. Corporate Social Responsibility (CSR) is an example of this concept which has gained considerable attention of market economy. It has become a useful tool to promote ethics and moral obligations of the organisations towards their workers, local communities and global society [39]. Organisations that promote social wellbeing make its employees feel a sense of belonging and inclusive, more healthy, focus and effective at work.

4.2. Job Satisfaction and Productivity

Studies in the field of human behaviour believe that a dissatisfied employee will negatively affect productivity and a motivated worker would be dedicated to his work and thus improve productivity [40]. Job satisfaction is linked to motivation to work and it is the measure of an individual attitude or response in relation to his work. The response can be measured by the increase in productivity of that worker, devotion to his tasks, less absent from work or workers turnover rate [40]. It is, therefore; imperative to understand the factors which lead to jobs satisfaction in order to drive productivity and competitiveness. This is, however, a complex subject as job satisfaction could be subjective and varied based on situation and circumstances [40]. For example; while salaries are most important to job satisfaction to some people, it is not a motivating factor to others. According to Kuvaas and Dysvik [38], employee dedication to work and good organisational citizenship behaviour is driven by high level of intrinsic motivation. Theories such as Locke’s theory of value, for example, described job satisfaction as the extent to which a worker is satisfied with the outcome of the job itself. Further, the theory suggests that job satisfaction is a function of organisational factors such as reward system, pleasant working environment, and organisational structure, and personal factors such as balance between personal interest and work, status, training and overall life satisfaction [40], Herzberg two-factor theory of motivation described job satisfaction within actions beyond the factors that brings dissatisfaction.

4.3. Herzberg Two-Factor Motivational Theory and the Social Aspects

Prior to the declaration of the Brundtland report in 1987, the subject of social responsibility of employers to provide a workplace that is safe, conducive, and enables self-actualisation of employees has been discussed as anchored on the theory of motivation [36,41,42]. In this context, employees are considered as one of the most important resources of an organisation, and their motivation and commitments are critical determinants of any business success [20]. Motivation influences human behaviour and organisational performance, explicitly; the level of workers commitment to work is driven by their level of motivation. In 1940–1950’s, Abraham Maslow developed the five-stage Hierarchy of Needs Model to understand and explain human motivation, promote management training, and personal development (see full model description in [42]). According to Maslow, “human beings are naturally trustworthy, self-protecting and self-governing, can grow and capable of love”. Laziness, selfishness, indolence, cheating, and lack of commitment are not what human nature is thought to be [42]. Maslow postulates that there are four types of needs called deficiency needs; these needs must be met before a person can become unselfish. Maslow stated that the first and most basic drives are physiological needs which include craves for food, water, oxygen, sex, sleep, and freedom of movement. This is followed by the need for safety such as personal protection, security, and religion, then comes the desire for love and belongingness, and then the quest for self-esteem which is the product of a person’s competency or mastery of a task. According to Griffin (1998), lack of these needs create tensions within a person.
However, in 1959, Freerick Herzberg expounded on Maslow theory to establish a two-factor theory of motivation. Herzberg two-factor theory of motivation is most relevant to this study because it establishes the study of motivation in the workplace and provides the understanding of the mutual relationships between employer and employee, and alignments within the psychological contracts [43]. Herzberg theory indicates that satisfaction and dissatisfaction at work do not arise from the same factors, and are not opposing in reaction to each other. That is; the factors that cause workers dissatisfaction are not the same and simply the opposite of the factors that give rise to satisfaction. Putting it in a clear statement, Ryan [33], explained; supplying the low-level needs (hygiene or extrinsic factors), such as give rise to dissatisfaction does not mean there will be satisfaction but, “no dissatisfaction”, and lack of high-level needs (motivational or intrinsic factors) that give rise to satisfaction does not imply dissatisfaction but, “no satisfaction”.

5. Alignment of Social Impacts Assessment (SIA) with Herzberg Two-Factor Theory

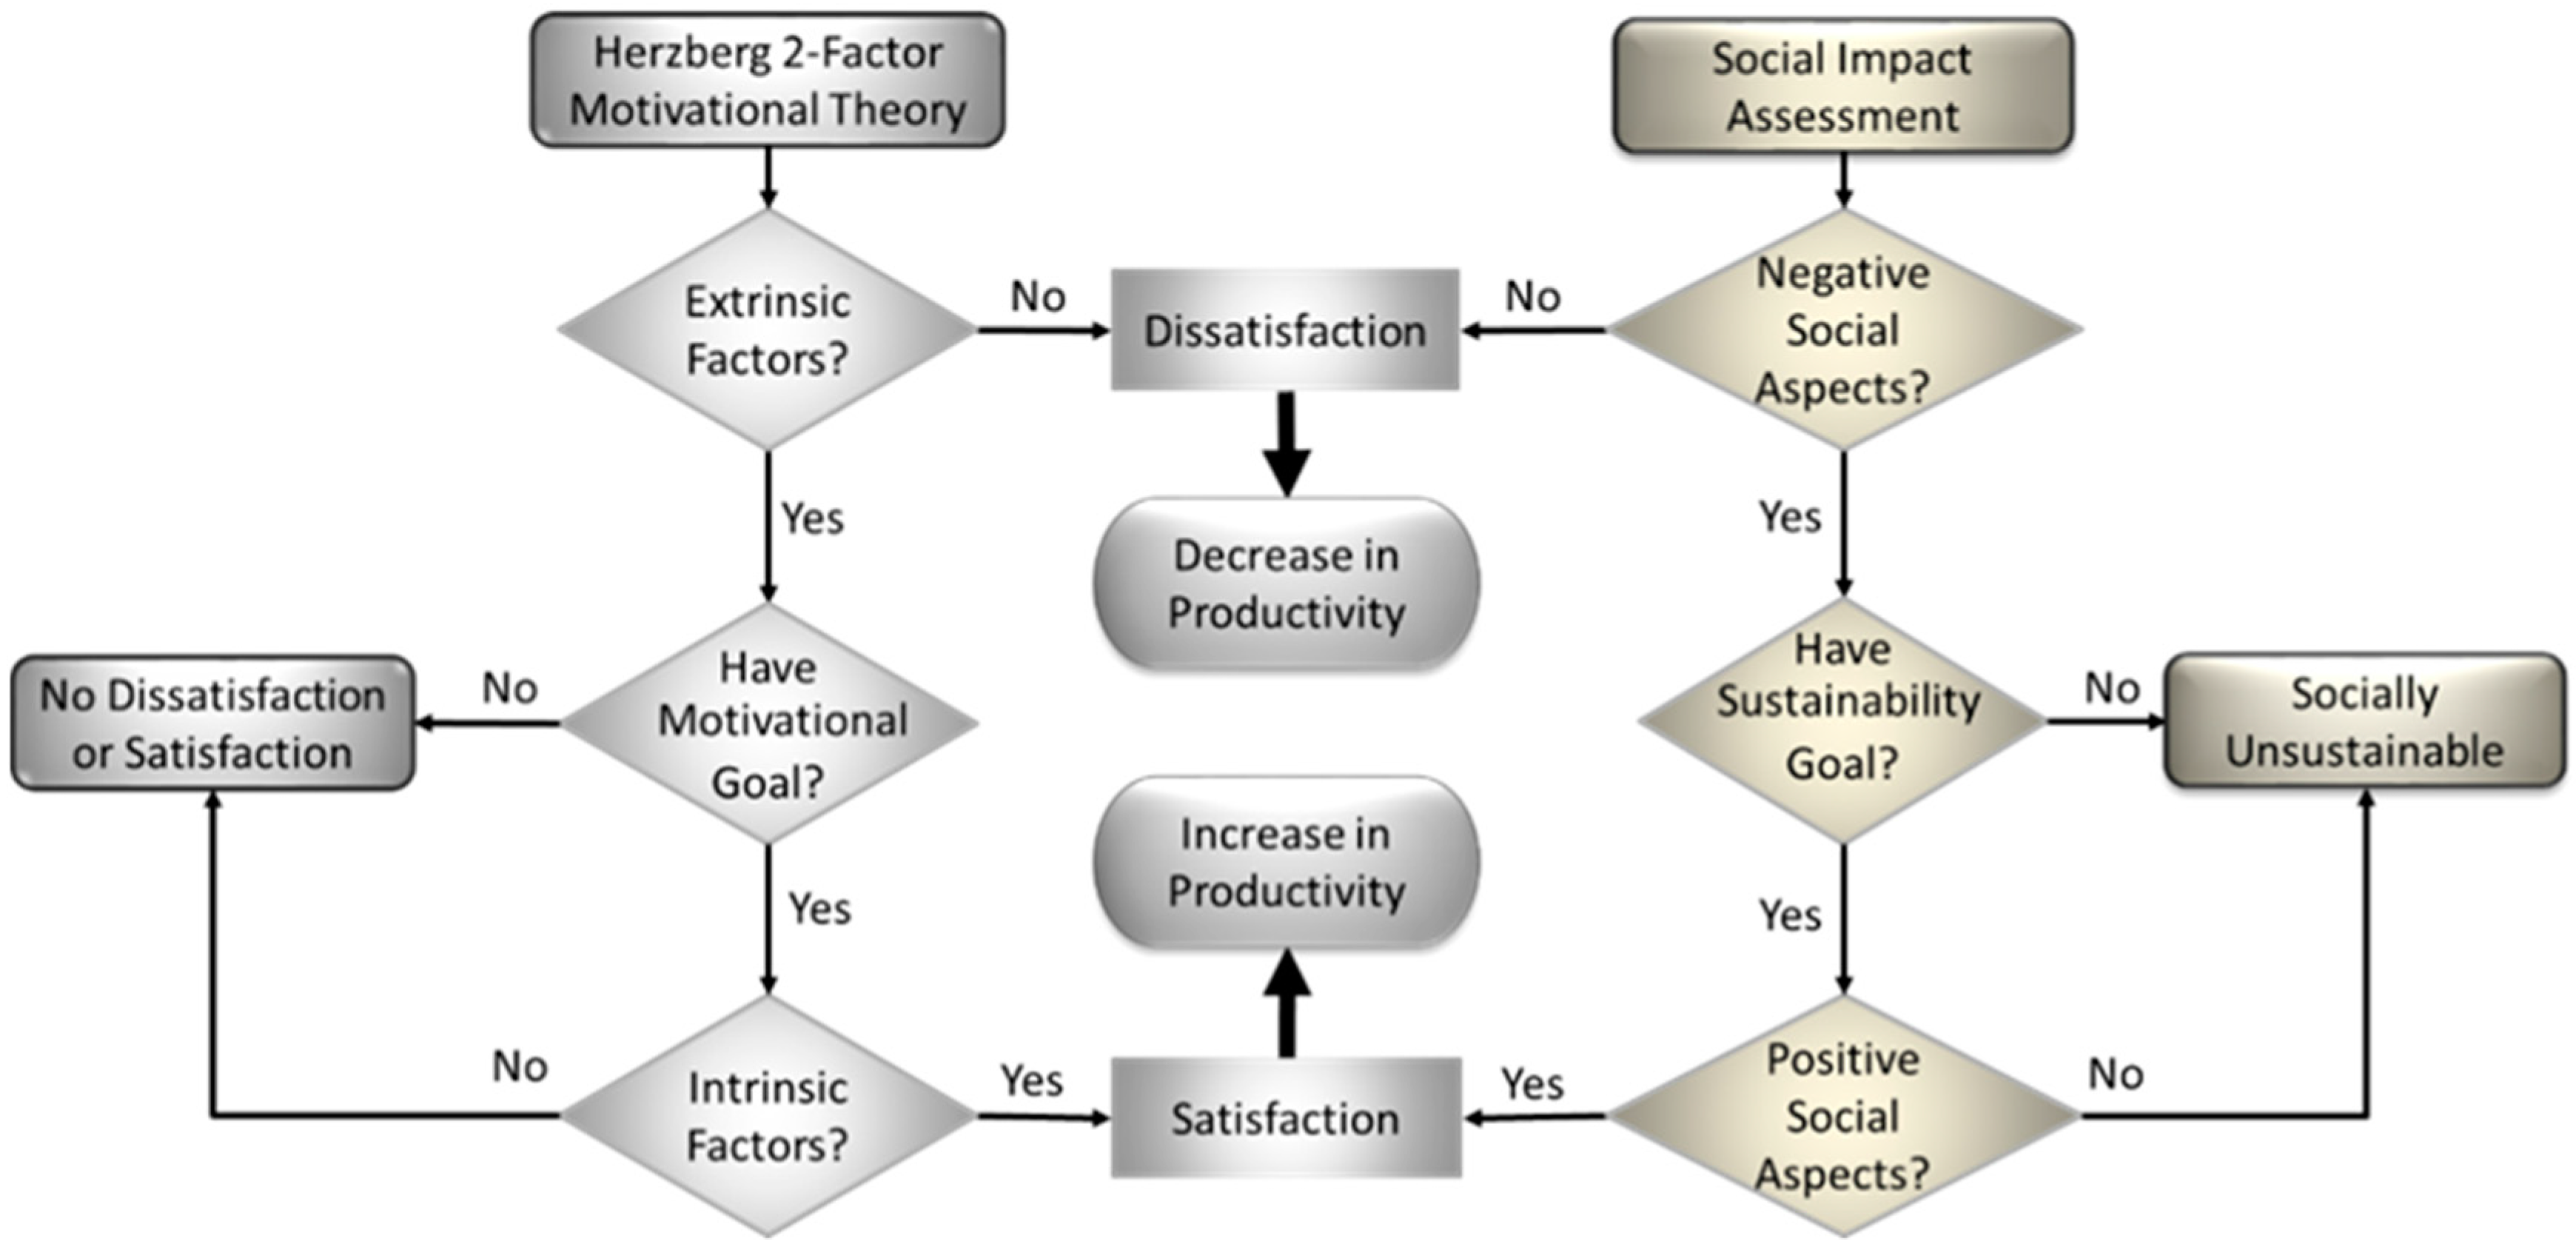
The hygiene or extrinsic factors are considered to have high risks of negative impacts on the employees and the organisation [44]. This is because the absence of extrinsic factors gives rise to employees’ dissatisfaction and eventual high employees’ turnover rate or low productivity [20]. These factors are often called the “maintenance factors” and their existence is paramount to create a safe and favourable working condition. The presence of the factors is also responsible for the removal of unpleasant feelings or reactions that might give rise to the employees’ dissatisfaction. Though their supply does not bring any sense of satisfaction for the employees [43,45], organisations are unable to stimulate any motivational strategy in the absence of these maintenance factors. In parallel with the SIA, the absence of negative social aspects (i.e., factors which absence impacts negatively on the employees’ safety and well-being) gives rise to dissatisfaction, social instability, and lack of commitments from the employees. In the absence of the negative social impacts, an organisation is unable to stimulate any social initiative or sustainability strategy that could give rise to job satisfaction and productivity. Figure 3 depicts how these two phenomena are aligned in similarities. Organisations with motivational goals will initiate the supplies of intrinsic factors to increase employees’ satisfaction and productivity. Similarly, organisations with social sustainability goals will increase the supplies of positive social aspects to drive social sustainability and increase productivity.

5.1. The Role of Legislation and Regulations in the Alignment Process

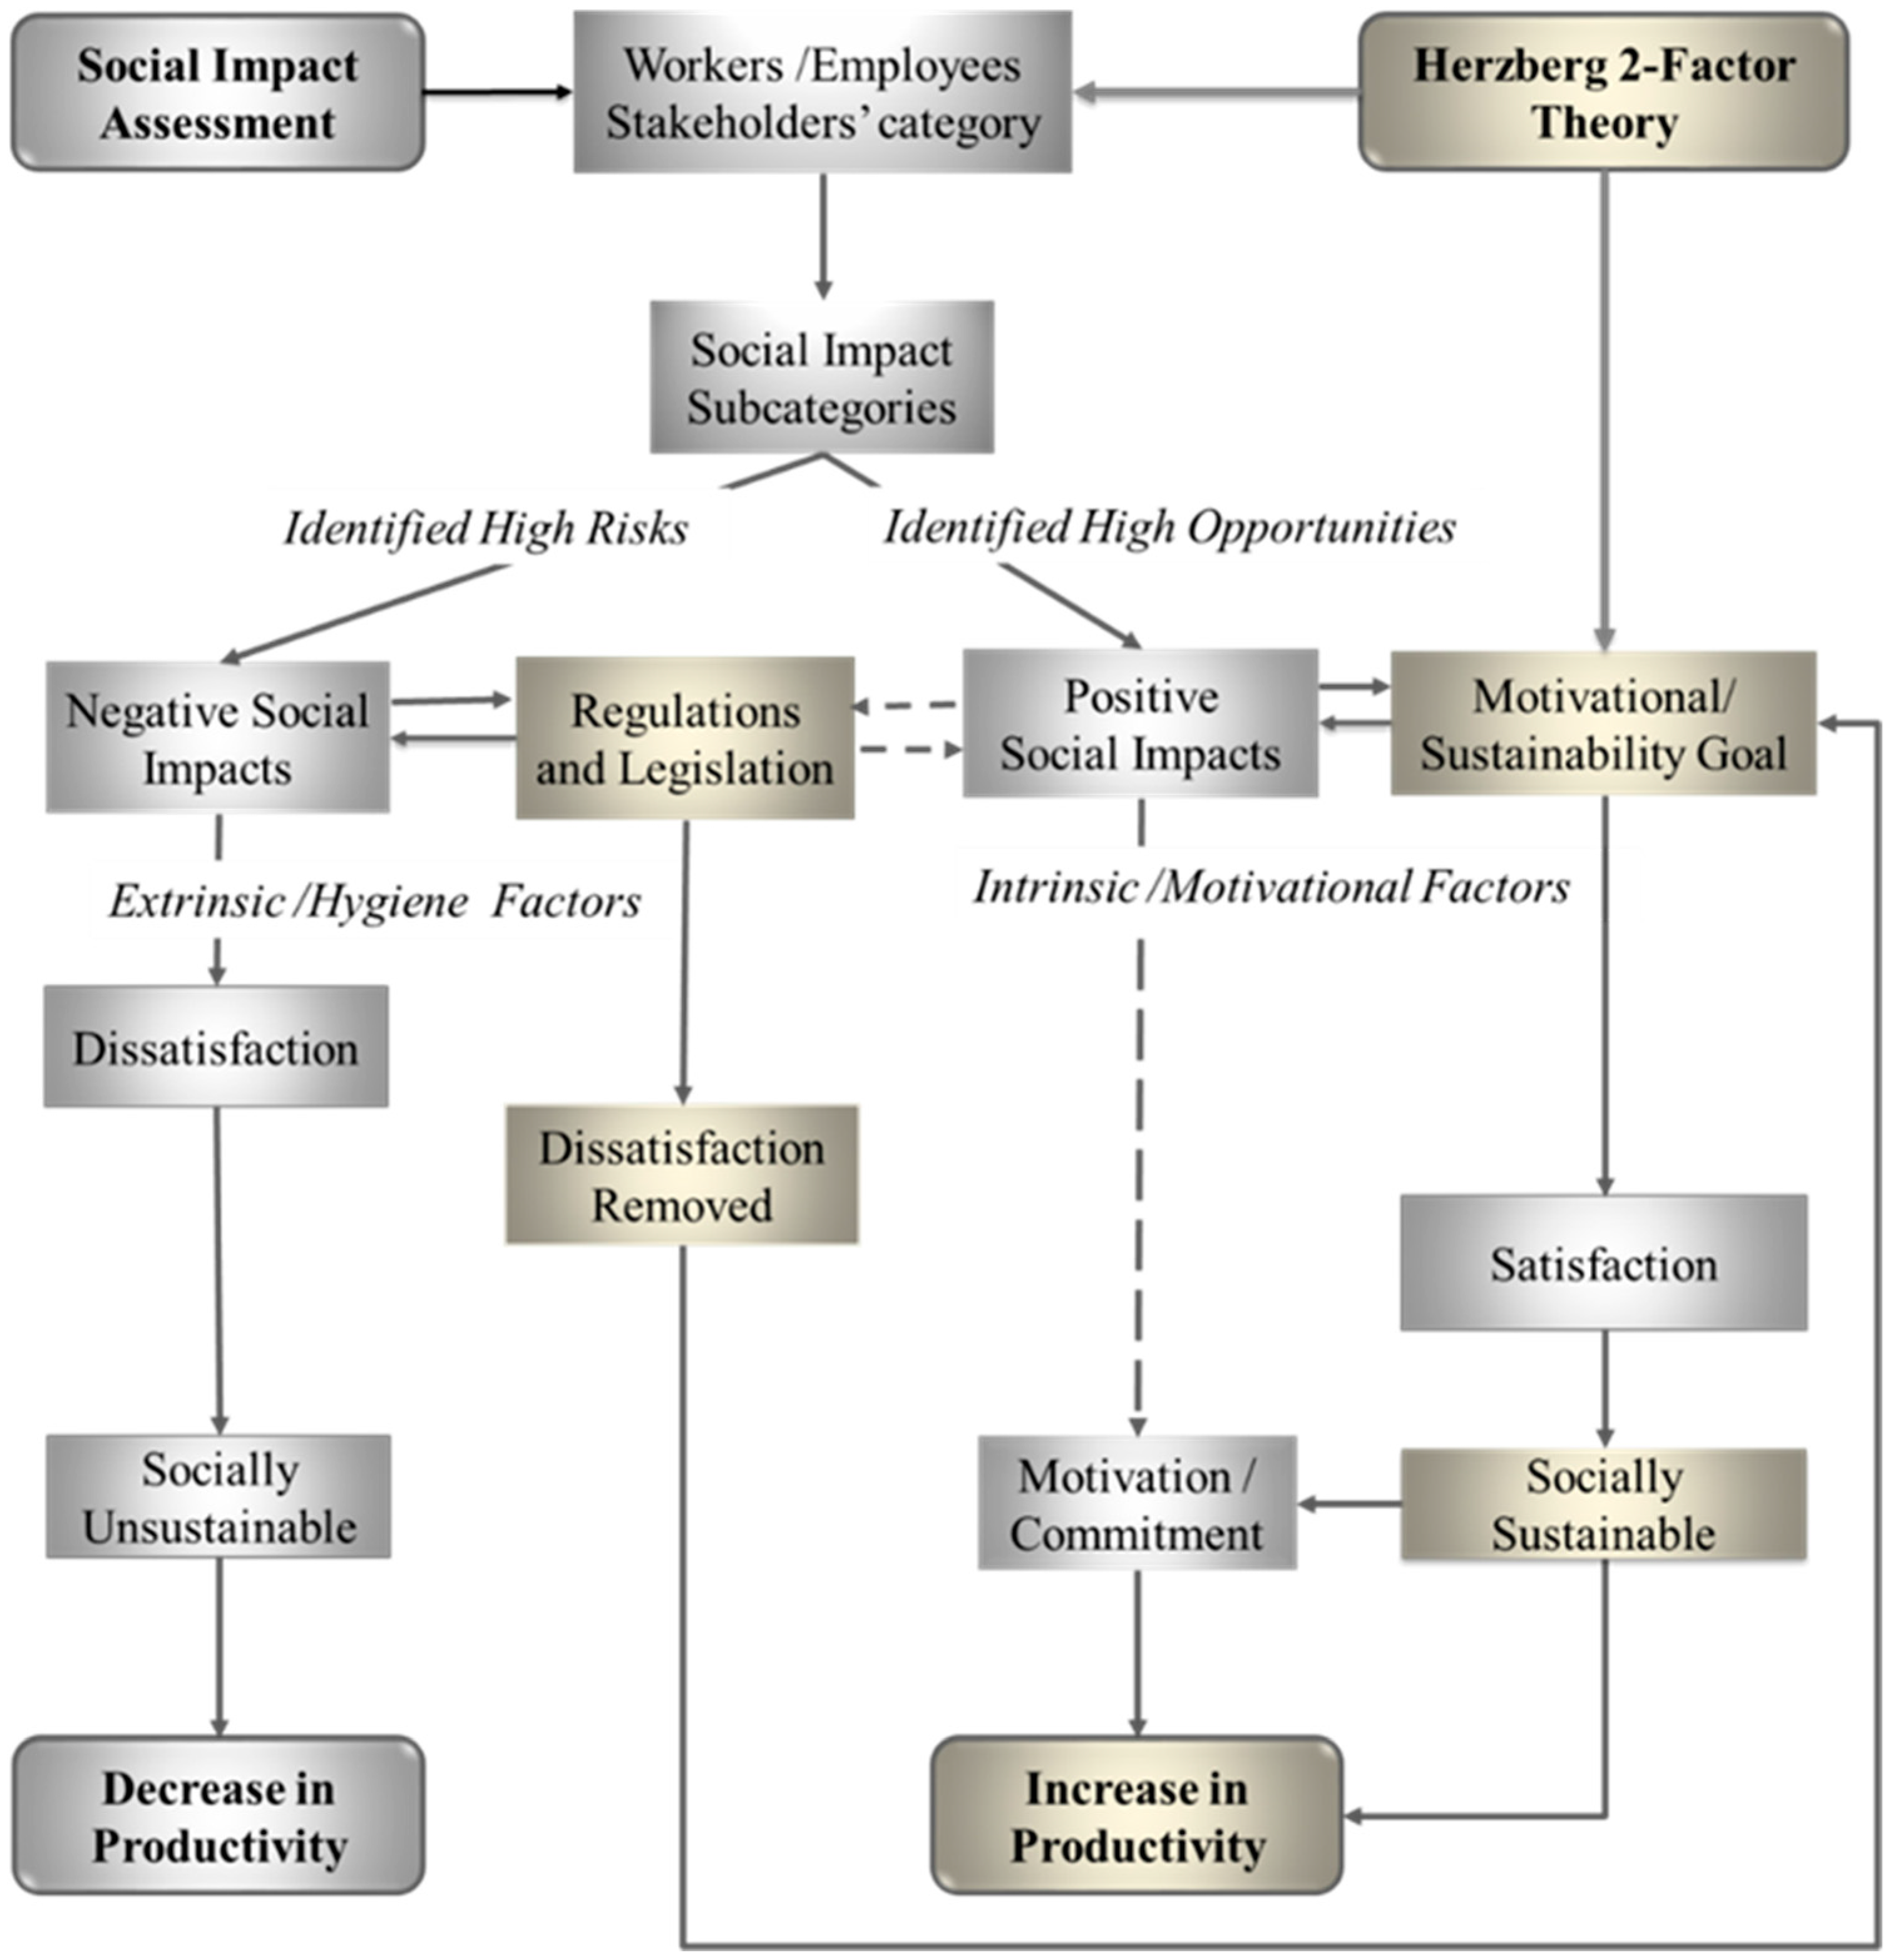
In the social sustainability development parlance, regulations and legislation are enforced on businesses to comply with the supply of the factors which have high risks of negative social impacts such as health and safety, and child labour. The organisation that fails to comply with these regulated factors are considered socially unsustainable and are liable to be penalised hence, organisations are mostly driven by the compliance obligations [39], however, this helps in the removal of factors that may give rise to employees’ dissatisfaction.
In Figure 4, the role of regulations and legislation is demonstrated in the diagram: There is a direct enforcement of government regulations and statutory laws on negative social aspects, though these may vary by geographical locations and markets of interest. The organisations’ compliance with these laws and regulations removes employees’ dissatisfaction and provides the opportunity to initiate motivational or social sustainability strategies that can give rise to economic growth. Some positive social aspects such as “training and study at work” are also under regulations as denoted with the dotted iterative arrows in the diagram. In such cases, the regulations will help in smoothening the identified opportunities in the positive social aspects. One major difference between organisational social development and motivation theories is that while social development focuses on policies and procedures that promote employees development and well-being, the motivation theories focus on the tasks and approaches that induce stimuli in employees for growth and performance. However, the two approaches create a platform for the development of employees’ satisfaction which has a correlation with organisational performance [16,18]. As discussed in the previous sections, social economy principles are linked to the promotion of workers and customers’ well-being in an economic market [32,35]. Thus, organisations that pay attention to the satisfaction or motivation of their employees through a variety of social initiatives will increase workers commitment to work, productivity, and the company profit level [39]. The American global workplace survey company (Great Place to Work) in collaboration with Fortune magazine published the top best 100 companies to work for in 2017 with Google on the top list for the 11th time [46].

5.2. Social Initiatives and Economic Growth

Social initiative in the business context is defined as any program, practice, or policy undertaken by a business firm to benefit society [39]. Corporate philanthropy, onsite well-being amenities, corporate support for training and educating youths and adults in local communities, helping job seekers and welfare recipients get jobs across the nations, and providing charity aids to developing countries across the globe are examples of social initiatives relevant to various stakeholder categories [39]. Google is famous for social initiatives which include onsite amenities such as free gourmet food, gym, laundry, and haircut services. Wegmans Food Markets Inc., which is the second on the list of the “Top Best 100 Companies to Work For” provides onsite free beverages and snacks, birthday cake, health screening services, blood pressure machine, ATM/banking, discount fitness classes, ticket sales, and gym membership. RW Baird & Co Inc., the fourth on the list provides onsite free hair salon, dry cleaning, coffee shop, shower and locker rooms [46]. Other social initiatives seen in these best in class businesses include onsite full service restaurant/catering, health screenings for breast cancer, glucose, cholesterol, and high blood pressure, smoking cessation programme, personal concierge services, subsidised weight watchers, weekly contests for tickets to concerts, plays, sporting events, and musicals [46]. While these social initiatives are not enforced by any regulation or legislation and could be aligned with the motivational or intrinsic factors to drive productivity, businesses ought to be driven by ethical duty and moral obligation to give back to their society [39]. Training of employees and investment in human resources such as social benefits and social securities are other social aspects that are not fully enforced under regulations, organisations that are driven by ethics and moral obligations would invest in their employees and increase their morals and satisfaction level. The question, however, is:
How do we measure the level of a corporate commitment to social values, or the employees’ productivity level as related to social sustainability?

5.3. Productivity Factor and Social Impact Coefficient (β)

The productivity of a manufacturing process is a function of many inputs and how efficient the inputs are utilised in the production process. Resources such as technology, capital assets, and human labour are examples of key inputs to any manufacturing process. Productivity is the measure of the quantity of an output in relation to the inputs (Equation (1)) hence, the quality or efficiency of the inputs determines the level of productivity. For example, in theory, an employee could be seen to be very productive but in an actual sense, producing below capability or creating horrible outputs. Employee level of productivity, therefore, has a huge impact on the economic growth [47]. Productivity factors such as Partial Factor Productivity (PFP), Multi-Factor Productivity (MFP) and Total Factor Productivity (TFP) have been discussed and recognised by both researchers and practitioners as important tools for explaining and improving efficiency and productivity of manufacturing inputs, economic growth, and improvement of income and welfare [48,49,50,51]. According to Comin [49], TFP is “the part of the production output that is not explained by the amount of inputs used during the production process”. Hence, the efficiency and intensity of the utilisation of the inputs are major determinants of economic growth [47,49,50]. Measuring human labour factor of productivity is one of the important requirements in driving improvement. The Social Impact Coefficient (β) represents the labour factor productivity for a socio-economic development. The use of Cobb-Douglas production function has helped in defining the coefficients for PFP, MFP and TFP in a linear equation (see The World Bank [48] for details).
Productivity = Output Input  
The Social Impact Coefficient (SIC), β, is that factor which determines the intensity of the utilisation of an employee. In an ideal situation, a fully utilised employee will work at 100% of his capability when all the necessary tools and skills are available. For example, suppose the Output (Y) of a process is produced using two factors of human labour: (1) Machine Setup and Teardown Time (M); and (2) Manual Operation Time (N).
Using Cobb-Douglas production function:
Y = β ( M ,   N )  
where Y is the output of the production, M and N are the inputs/capabilities of the human resources and β is the Social Impact Coefficient. The coefficient β is the multiplier of employee’s capability and determinant of the efficiency or degree of utilisation of the employee’s capability. The factor β is a calculated weighting factor of the organisations’ social impacts and a function of an organisation aggregated social performances (Equation (3)). Where α is the aggregated negative social impacts, and γ is the aggregated positive social impacts.
β = f ( α , γ )  
In reference to the employee productivity, the β has the highest value of “1” which implies 100% level of motivation and commitment state of an employee, and the lowest value of “0” implying the lowest state of an employee. The higher the value of β, the higher the employee’s productivity, and organisations’ economic growth: For example, if in an ideal situation (when β = 1), 200 working hours of an employee is required to produce £5000 worth of product, but the actual number of working time for the employee is 250 working hours. Then the employee productivity can be calculated as follows:
When   β = 1 :   Employee   Productivity = £ 5000 200   h   = £ 25   per   hour   of   work
Using   the   above   information   to   calculate   β :   β = 200 250   = 0.8
When   β = 0.8 :   Employee   Productivity   = β   ( £ 25 ) = £ 20   per   hour   of   work
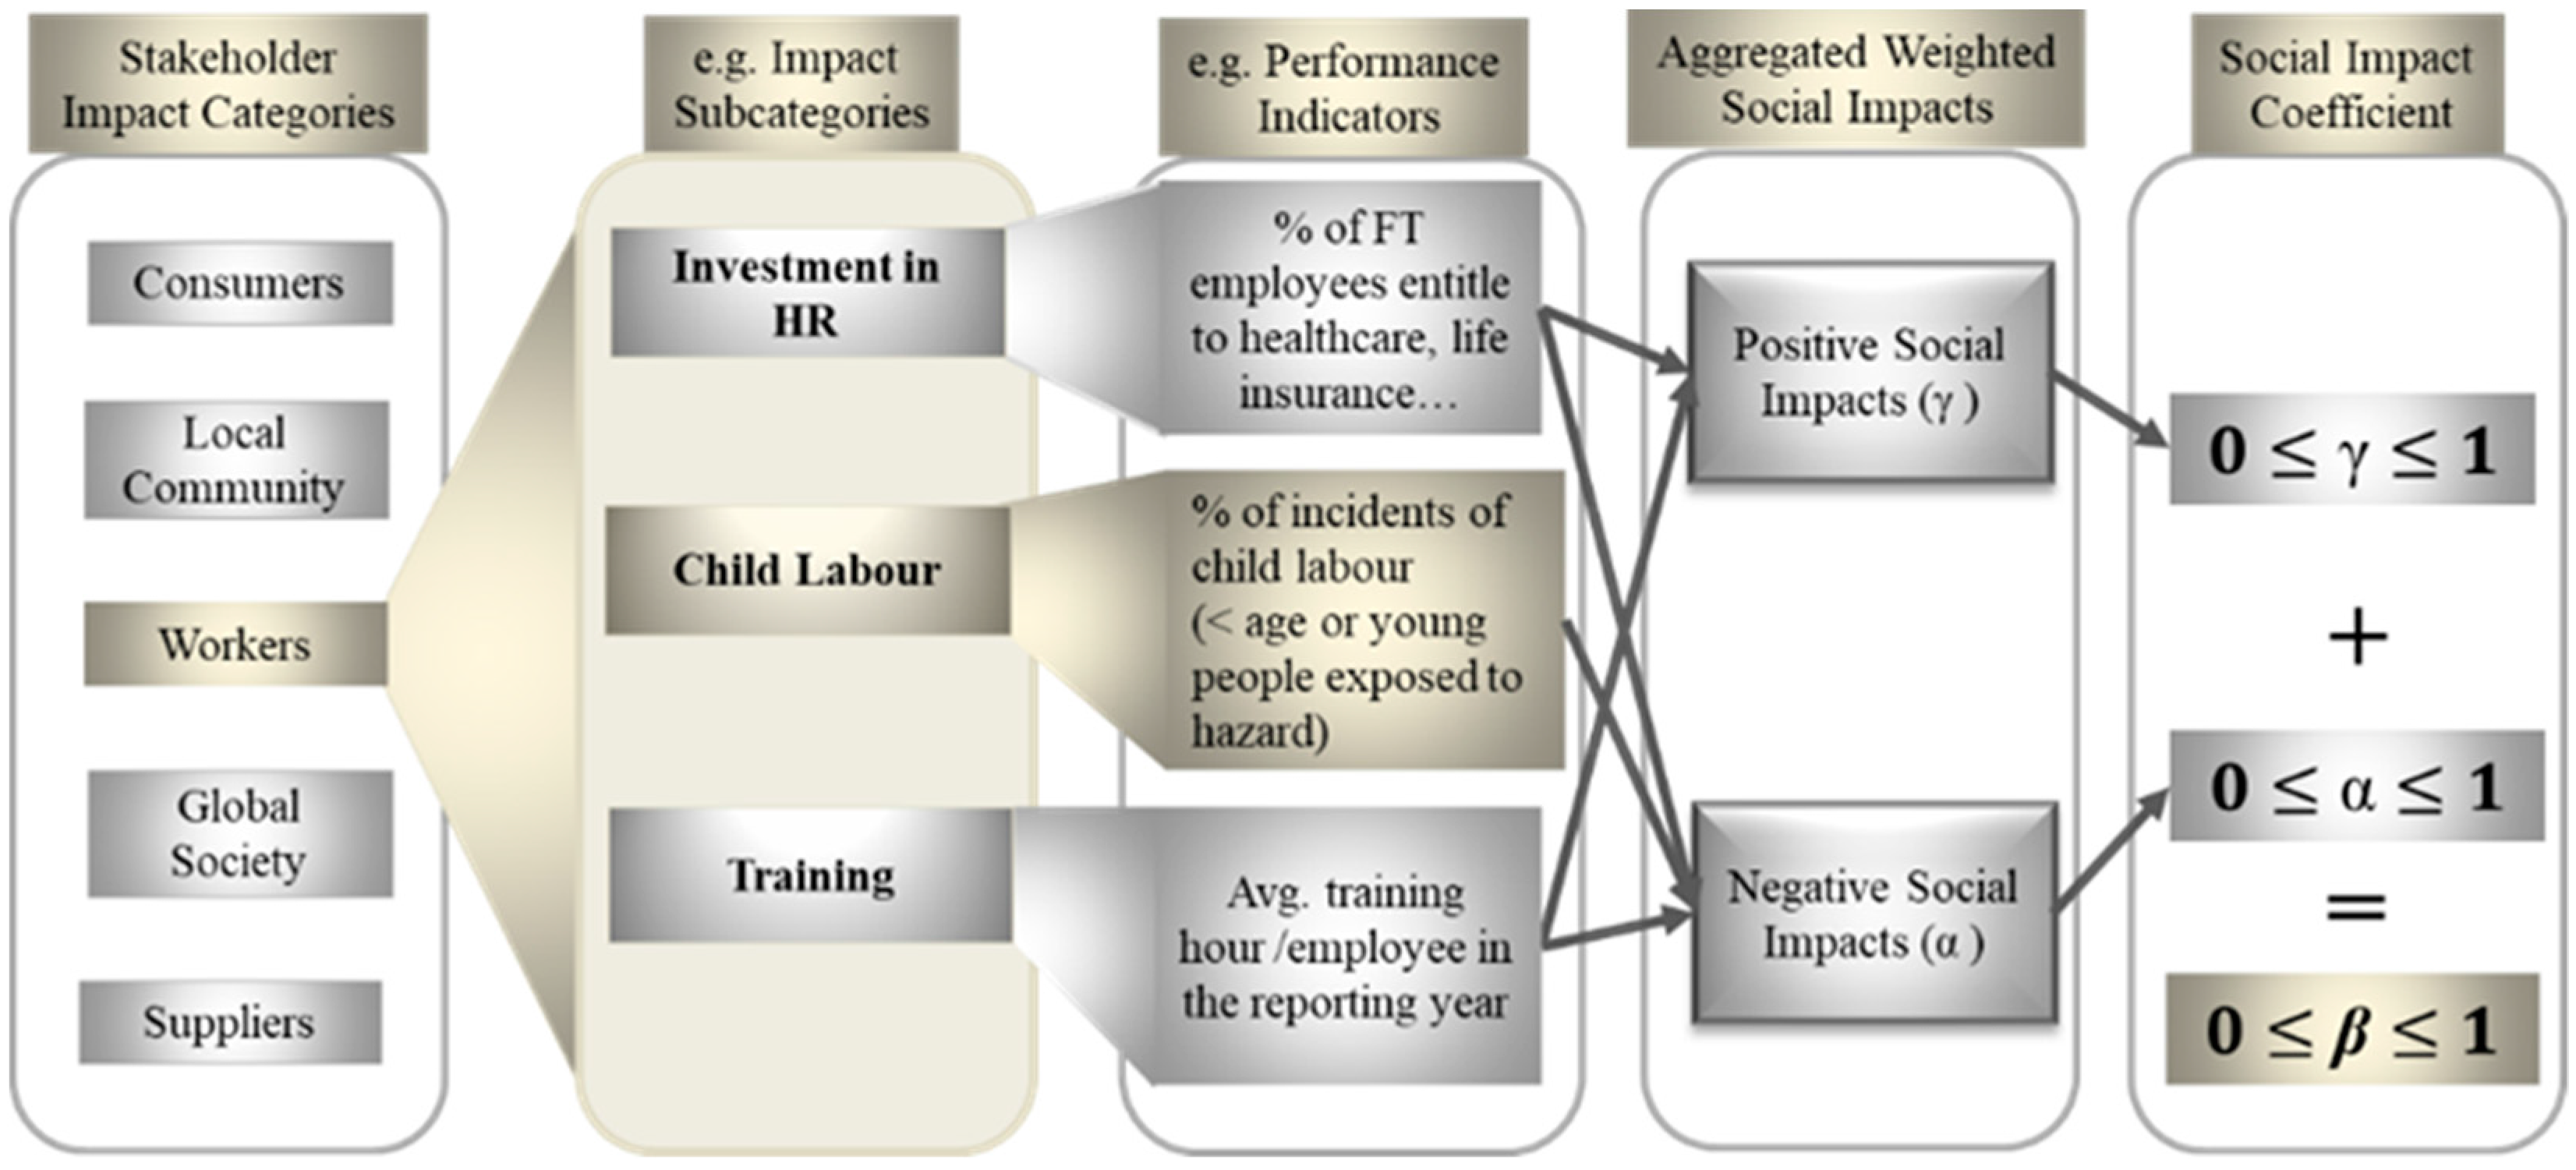
In this case, the ideal situation represents a benchmark for which employee productivity can be compared against, and to obtain the β. The closer the β to “1”, the more the organisation becomes socially-sustainable. However, the employees’ social aspects which negatively or positively influence workers’ productivity need to be identified, assessed and managed in order to drive economic growth. Figure 5 is a description of the components and process for calculating the β of an organisation from social aspects. The process requires setting a base index based on the organisation best-ranked social performance of each social aspect or the use of social performance indexes of the Best-In-Class (BIC) industry within the understudying industrial sector. A scaled based approach can be used to calculate the weighting value or the use of multi-criteria decision analysis to capture the qualitative aspects of the social aspects [52,53]. For example, the safety of an organisation is measured by groups of indicators such as the number of months without accident, near-miss and recorded incidents or by following the procedures of Reporting of Injuries, Diseases and Dangerous Occurrences Regulations (RIDDOR). The job creation measured by variables such as the employees’ turnover and retention rates. This research proposed the use of weighted-scale based approach, and the Global Reporting Initiatives [16] formulas to model social aspects data for the workers’ stakeholder category.
Among the vast social indicators, the decisions to choose and use certain social aspects (impact subcategories) are based on the business’ sustainability goal and the context in which the assessing organisation operates [17,23]. Hence the social aspects are not necessarily applicable in all context or company. According to Hunkeler [28], social indicators are very large ranging over 200 indicators which are related to regulated and unregulated factors. Hence, the selection of the social aspects to be analysed is based on the company’s sustainability goal, however, compliance to government regulatory and legislative controlled social aspects take priority in initiating any sustainability or motivational goal.

6. Application of the Aligned Framework to Calculate Social Impact Coefficient

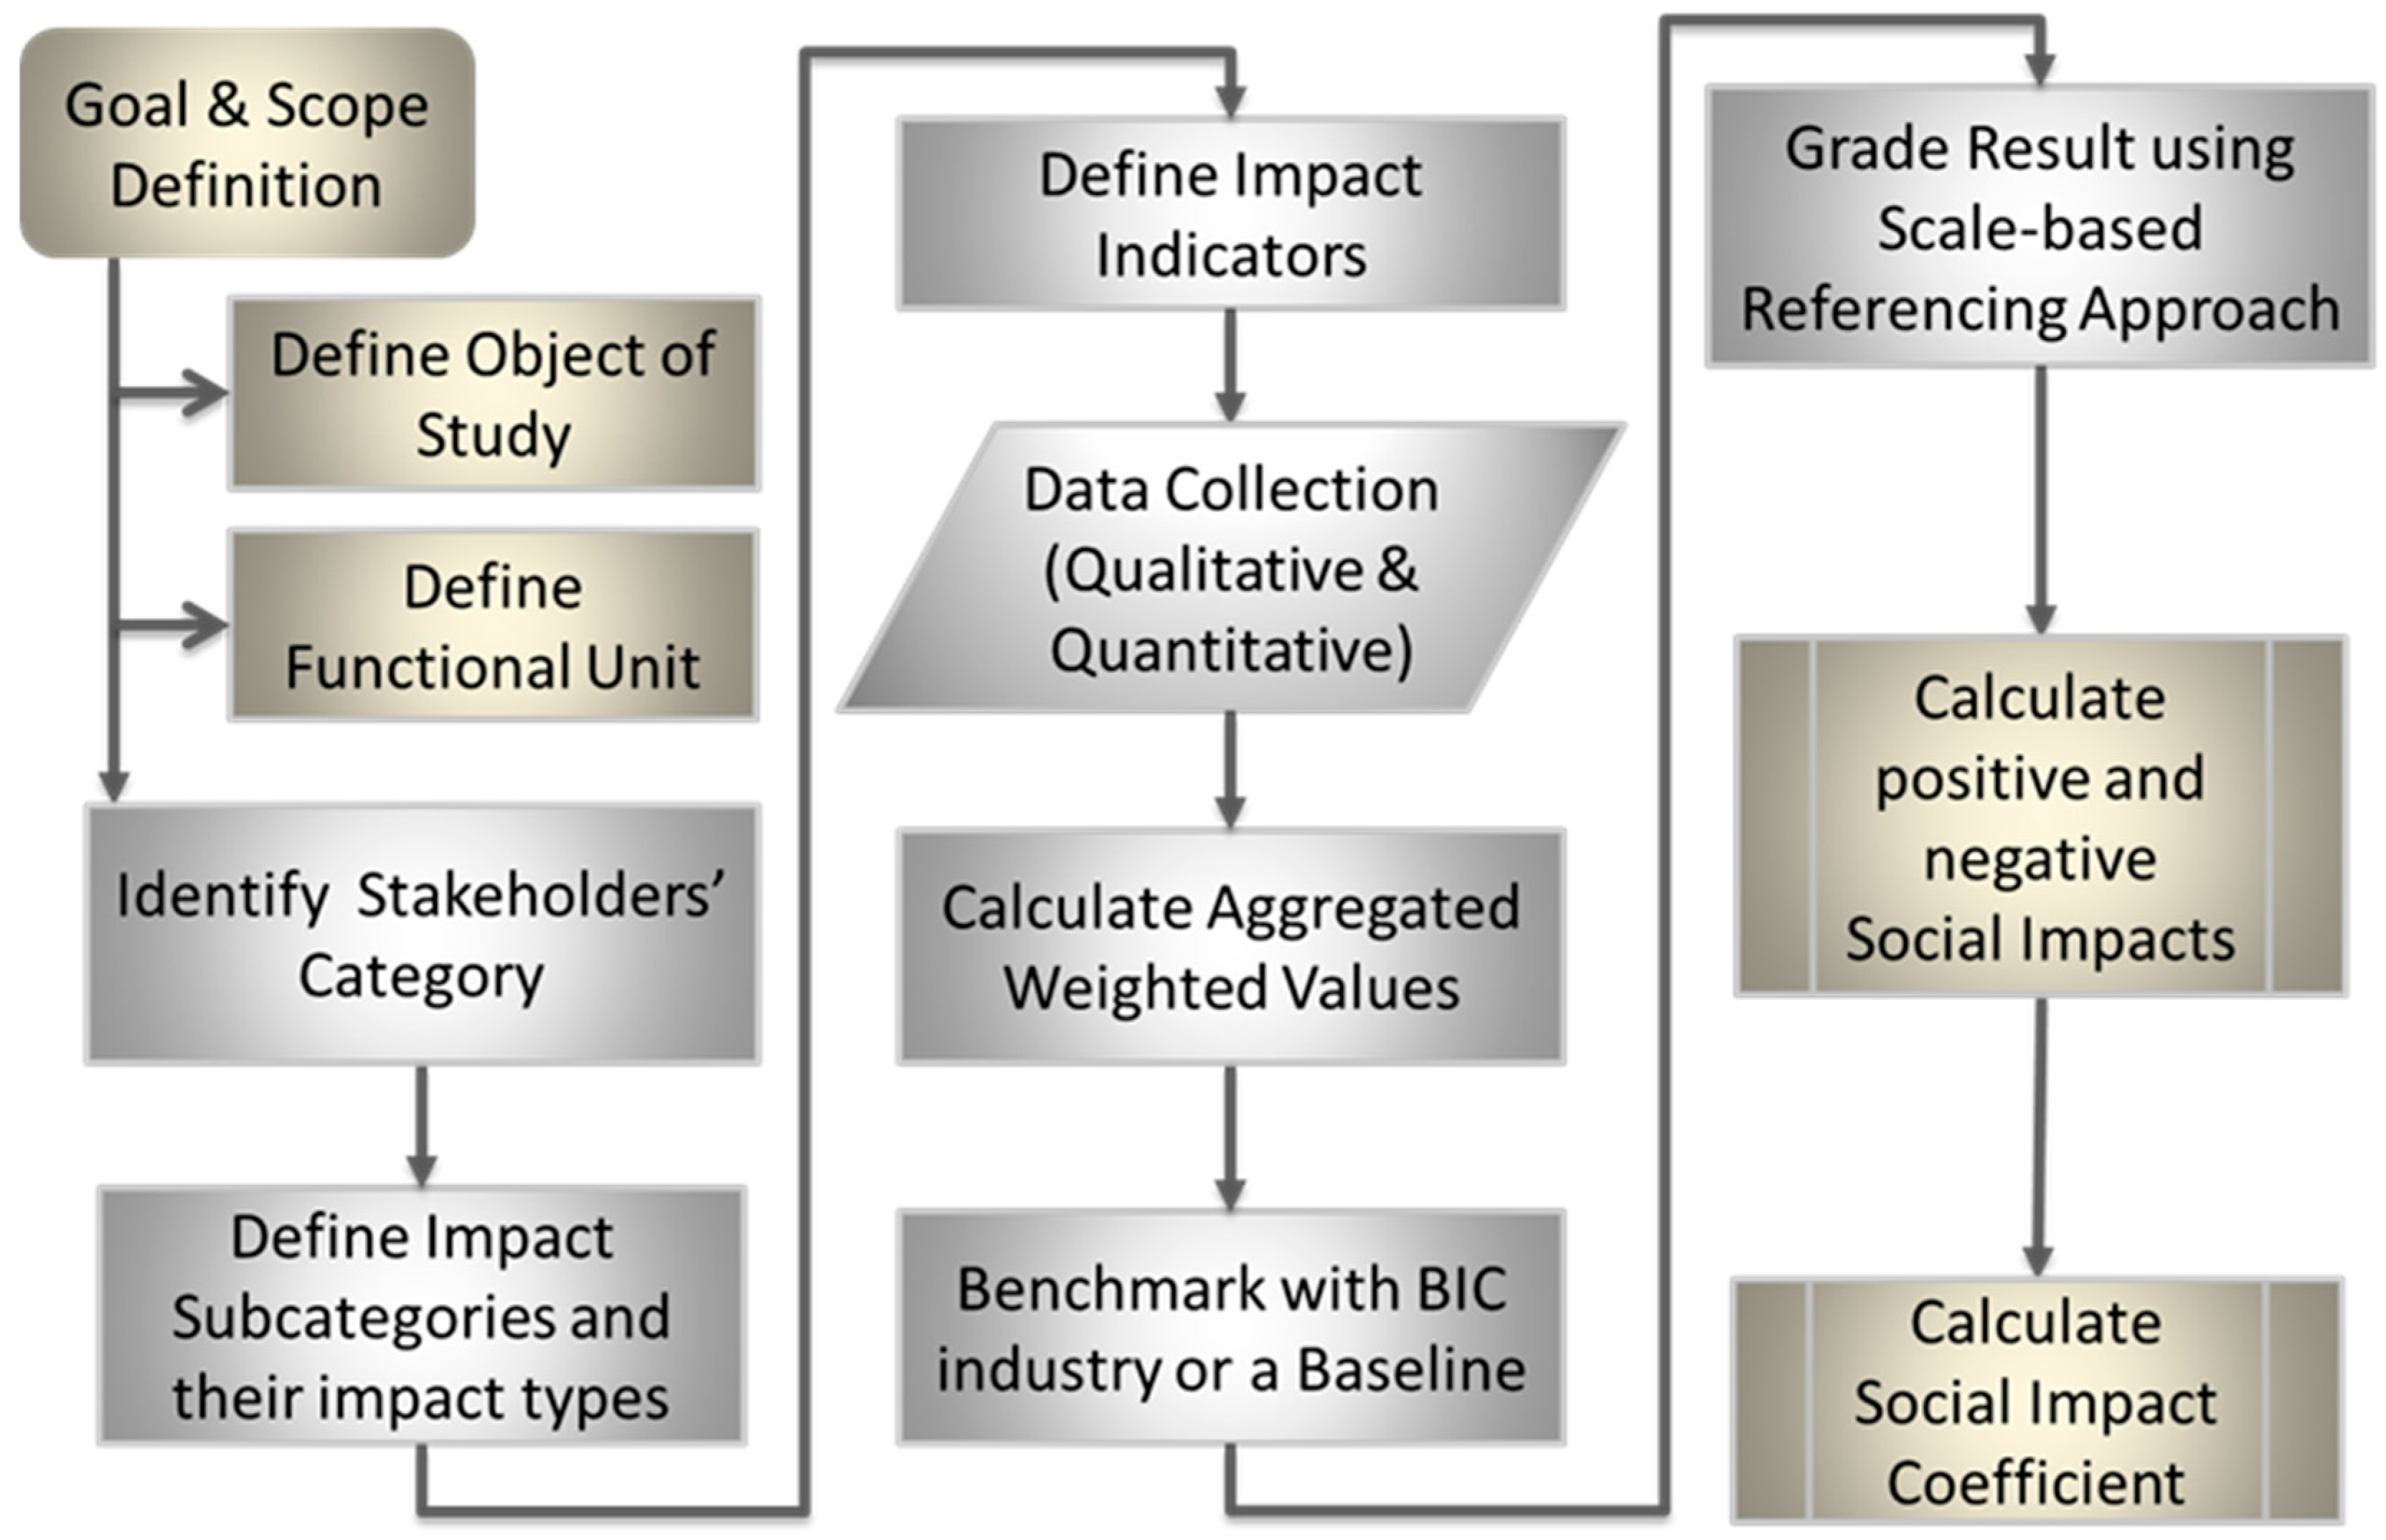
The successful application of LCA framework strongly depends on the goal and scope phase of the four-components based framework [19]. However, adopting its principles for Life Cycle Sustainability Analysis (LCSA) broadens the requirements to the extent of defining the sustainability questions and structural representation of the systems or process to be analysed [54]. According to Stefanova et al. [54], the requirements are to enable a clear link with the subsequent modelling phase and representation of different stakeholders’ view. However, this could be complex and daunting at the product development phase where there are not enough data and specific information to support the new product or process development [19]. Figure 6 shows the step-by-step process for SIC (β) calculation project. The starting point is the goal and scope definition which should be in line with the ISO 14040 LCA framework [25] as well as the object of study, and the functional unit should be the same with which the economic and environmental impacts are being assessed.
The complexity of analytical models increase with data, and it is impossible to account for all the sustainability aspects of a single assessment. It is, therefore, necessary to scope which aspects of the three sustainability dimensions are to be included, not included and reference in the data collection stage. As discussed in the previous sections, social impact assessment is conducted at a specific site or stage of a product lifecycle. This is covered when defining the boundary or object of the study; in this case, a gate-to-gate approach is adopted to define the boundary of the object of study. The scope and identification of the social impact subcategories that need to be included in the analysis are also very important especially in streamlining the data collection process. Though the procedure for data collection is not covered in this paper, it is important for the data analyst to comply with privacy protection laws and respect freedom of information during data collecting phase.
The Functional Unit (FU) enables comparison of processes, products, and systems depending on the sustainability level at which the study is being conducted. According to Chang et al. [19], FU is “a measure of performance of the functional outputs of the studied process and it relates to specific inputs and outputs, the time range and the impact categories”. For example, let us consider a hypothetical scenario below and follow the procedure for calculating the social impact coefficient (SIC) to detail each phase of the process.

6.1. Hypothetical Scenario of a Simple Manufacturing Company

Problem definition: A manufacturing company is undergoing a simple process redesign of its production line with the goal of developing most efficient and sustainable production process. Currently, the productivity is low compared to the best-in-class in the industry and energy and materials consumption have been assessed to be very high.
In this scenario, the productivity of the business depends on the employees’ commitment to work, the technology and process efficiency to increase production, and support reduction of energy and materials consumptions. The aim is to calculate the SIC in order to assess the workers’ social impacts on productivity and the level of corporate social responsibility towards the employees. The process calculates and analyses the influence of the employees’ social aspects on the business economic performance and examines the social aspects where the business can initiate sustainability performance improvement strategy. It is assumed, a simulation model is deployed to model the process, hence, the SIC can be inserted into the model equation to analyse the interdependencies of the three sustainability aspects, optimise the process and support decisions for the best sustainable process option.

6.1.1. A Step-By-Step Approach to SIC Calculation

The following sections describe the SIC calculation and documentation process for the hypothetical scenario based on the guidelines described in Figure 6. The first stage is to define a common and clear goal and scope for the environmental, economic and social impact assessments. These involve explicit problem statements, unambiguous object of study, boundary and functional unit which is common to the three dimensions. In this case, our goal is to model the most efficient and sustainable production process of a manufacturing stage and analyse the sustainability impacts of the three dimensions within a specific period (See Table 3 for the summary of information documented during this process). This is followed by the stakeholders’ analysis, categorisation and definition of impact subcategories, indicators and impact types. Based on our study, the stakeholders’ category is the workers, the selected associated impact subcategories, indicators and impact types are summarised in the second phase of Table 3. Following the process of calculating the SIC, the next stage is the data collection, aggregated weighted values calculation and benchmarking with the company’s baseline or a Best-in-Class (BIC) performance industry. In order to demonstrate the calculation process of a hypothetical SIC, the authors allocated arbitrary aggregated weighted values to each of the selected indicators’ impact types (social aspects). Each of the social aspects has a positive or negative aspect defined by their impact types. Table 4 shows the datasheet of the arbitrary values and related calculations for the SIC.
With the aid of the Global Reporting Initiative [16] guidelines for reporting and calculation of social impacts, the aggregated weights of social performance of the selected quantitative and qualitative impact subcategories can be calculated. The result data will be in different units and needs to be normalised in order to be used in the analytical equation. First, an organisation can benchmark with the data from a best-in-class in the industry or set an internal baseline to grade the performance of each of the calculated social aspects. Scores can be attributed to the aggregated weights using values based on a reference scale 1 to 9 and 0 for the worst scenario. In this case, let us use the following weighted scale-based referencing for the social score:
Excellence = 9; Very good = 7; Good = 5; Bad = 3; Very Bad = 1; Worst = 0
The odd numbers enable a flexible grading option in a situation where a performance is judged to be in-between two grades. For example; if an organisation performance of a social aspect is judged to be neither “Good” nor “Bad”, it will be graded as “6”.

6.1.2. Calculation of the Social Impact Coefficient

The Social Impact Coefficient is calculated from the Social Impact indices of the positive and negative social impacts. A social impact index is a normalised weighted average measuring the relative weight of all the identified social aspect types. This can be calculated using a formula similar to relative price index equation:
S o c i a l   I m p a c t   I n d e x = ( W a × C a ) ( W A × C A )
where W a is the weighted value of a social aspect type (+/−);   W A is the highest achievable weighted value of a social aspect type; C a is the count of an identified social aspect type (+/−), and C A . is the total count of all the identified social aspect types.
Equation (4) can be simplified into Equation (5) for easy calculation.
Social   Impact   Index = W a W A   ×   C a C A
From the data in Table 4:
N u m b e r   o f   o c c u r r e n c e   o f :   P o s i t i v e   a s p e c t s   ( C a + ) =   6 ;   N e g a t i v e   a s p e c t s   ( C a )   =   8 Hence ,   C A = ( 6 + 8 ) =   14   ;   W A =   9   ( Weighted   value   for   excellence   performance ) P ositive   Social   Impact   Index   ( γ ) = 37 54   ×   6 14   = 0.6852   ×   0.4286 =   0.2937 N egative   Social   Impact   Index   ( α ) = 52 72   ×   8 14   = 0.7222   × 0.5714   =   0.4127 Social   Impacts   Coefficient   ( β ) = γ +   α   = ( 0.2937 + 0.4127 ) = 0.7064

6.2. Discussion and Summary

The SIC (β) calculated value; 0.7064 (70.64%) represents the intensity of the utilisation of a worker or the workers’ productivity factor. The result demonstrates the effect of the social impacts’ scores on productivity (see Table 4). The higher the social impacts’ scores, the higher the value of SIC and the more effective the workers’ productivity or efficiency of the production process. Businesses can assess their corporate social commitment by reviewing the negative and positive social impacts’ scores and set new objectives. An organisation, which desires to improve productivity as in this hypothetical scenario, needs to first remove negative aspects such as occupational health and safety (scored 4 out of 9) that represent a threat to the business. A focus on the positive social aspects with higher improvement opportunities such as investment in human resources (scored 6 out of 9) and onsite social initiatives (scored 7 out of 9) can lead to increase in the value of the SIC.
The social impact coefficient (β) corresponds to the productivity factors such as Partial Factor Productivity (PFP), Multi-Factor Productivity (MFP) and Total Factor Productivity (TFP). These are important tools for improving efficiency and productivity of manufacturing inputs, economic growth, and improvement of income and welfare [48,49,50,51]. In addition, the value 0.7064 is the measure of the hypothetical manufacturing industry social performance and can serve as a multiplier to sustainability analytical equation to determine the influence of social impacts on the productivity. Sustainability analytical equations are equations that support interdependent analysis of the variables of the three sustainability dimensions [10,55]. Simulation models provide such interdependent analysis and can be used to determine the effects of social aspects on the economic growth and environmental aspects. The social impact indices provide employers with insight into where there are high opportunities for improvement and high risks of threat. The percentage of weighted value is a measure of how effective an organisation is performing in respect of positive and social impact types. The highest achievable weighted values serve as a benchmark or baseline for setting an organisation’s optimum sustainability goal.
The application of Discrete Event Simulation (DES) with sustainability methodologies to model the operational levels of sustainable manufacturing are prevalent in the literature [56]. This is due to the functionalities of DES that enable modelling, analysis and optimisation of different aspects of the process, and support effective decision-making [57,58,59]. By default, the analytical functions in simulation insert “workers’ entities” as in full capacity (100%) of the utilisation; representing SIC (β) of “1”. This can be altered during the experimentation or analysis of the sustainability aspects by multiplying SIC with the analytical equations that required workers’ resources. By this approach, the interdependency of the social impact on economic and environmental aspects within the defined boundary can be analysed.

7. Conclusions

In this study, a theoretical framework was developed to align the Herzberg two-factor theory of motivation with the negative and positive social impacts of the workers’ stakeholder category. Based on the alignment, it was possible to capture and calculate the social impact coefficient (β) of an organisation and provide the opportunity for the interdependent analysis of the social, economic, and environmental aspects. The paper also presented a hypothetical scenario to demonstrate the step-by-step process for capturing and calculating the workers’ negative and positive social impacts. In the summary section, we discussed how an organisation could use the result to assess corporate commitment to the employees, review and initiate a social improvement strategy that can benefit productivity.
The major contribution of this study is the calculation of the social Impact Coefficient (β) and its integration into sustainability equations to determine the influence of social aspects on employee’s productivity and economic growth. The study is also valuable to businesses for assessing the level of their commitment to social developments and to make effective choices of social aspects that can lead to both employees’ self-esteem and economic growth. Other studies examined are the correlation between sustainability social aspects and workers commitment to work. This was detailed and aligned with the aid of the principles of reciprocity and the motivational theory. The understanding of employer/employee relationships and motivation to work helped to calculate the aggregated social impacts coefficient (β) which is the multiplying factor of an employee capability and determinants of the efficiency or degree of utilisation of the employee’s capability. The factor β is a measure of employees’ productivity and a function of an organisation’s aggregated social performances.
Though this study contributes to both the academic and practical use, there are limitations and gaps in the study that worth giving consideration. It is limited to the workers’ stakeholder category in a product lifecycle stage. The correlation between economic growth and social impacts on stakeholders such customers, suppliers, local communities and global society needs to be studied. Another area of interest is the effects of the coefficients on environmental aspects, and the integration of each stage into a holistic assessment of the product lifecycle. Social indicators are vast and no particular indicators are recommended by this study but depending on the geographical location, compliance with the regulated social aspects is paramount to social sustainability.

Author Contributions

Mijoh Gbededo and Kapila Liyanage conceived and outlined the concept, Mijoh Gbededo wrote the paper and Kapila Liyanage reviewed and edited the paper.

Conflicts of Interest

The authors declare no conflict of interest.

References

  1. United Nations Environmental Program (UNEP). Towards a Life Cycle Sustainability A Ssessment: Making Informed Choices on Products; United Nations Environmental Program (UNEP): Nairobi, Kenya, 2011; ISBN 9789280731750. [Google Scholar]
  2. Brundtland, G.H. Our Common Future: Report of the World Commission on Environment and Development. Med. Confl. Surviv. 1987, 4, 300. [Google Scholar] [CrossRef]
  3. Zamagni, A.; Pesonen, H.-L.; Swarr, T. From LCA to Life Cycle Sustainability Assessment: Concept, practice and future directions. Int. J. Life Cycle Assess. 2013, 18, 1637–1641. [Google Scholar] [CrossRef]
  4. Gu, W.; Chhajed, D.; Petruzzi, N.C.; Yalabik, B. Quality design and environmental implications of green consumerism in remanufacturing. Int. J. Prod. Econ. 2015, 162, 55–69. [Google Scholar] [CrossRef] [Green Version]
  5. Valdivia, S.; Ugaya, C.M.L.; Hildenbrand, J.; Traverso, M.; Mazijn, B.; Sonnemann, G. A UNEP/SETAC approach towards a life cycle sustainability assessment—Our contribution to Rio+20. Int. J. Life Cycle Assess. 2013, 18, 1673–1685. [Google Scholar] [CrossRef]
  6. Gbededo, M.A.; Liyanage, K.; Garza-reyes, J.A. Towards a Life Cycle Sustainability Analysis: A Systematic Review of Approaches to Sustainable Manufacturing. J. Clean. Prod. 2018. [Google Scholar] [CrossRef]
  7. Jayal, A.D.; Badurdeen, F.; Dillon, O.W.; Jawahir, I.S. Sustainable manufacturing: Modeling and optimization challenges at the product, process and system levels. CIRP J. Manuf. Sci. Technol. 2010, 2, 144–152. [Google Scholar] [CrossRef]
  8. Eastwood, M.D.; Haapala, K.R. A unit process model based methodology to assist product sustainability assessment during design for manufacturing. J. Clean. Prod. 2015, 108, 54–64. [Google Scholar] [CrossRef]
  9. G??nsch, J. A note on a model to evaluate acquisition price and quantity of used products for remanufacturing. Int. J. Prod. Econ. 2015, 169, 277–284. [Google Scholar] [CrossRef]
  10. Wang, Q.; Li, J.; Yan, H.; Zhu, S.X. Optimal remanufacturing strategies in name-your-own-price auctions with limited capacity. Int. J. Prod. Econ. 2014, 181, 113–129. [Google Scholar] [CrossRef]
  11. Zhu, Z.; Wang, K.; Zhang, B. Applying a network data envelopment analysis model to quantify the eco-efficiency of products: A case study of pesticides. J. Clean. Prod. 2014, 69, 67–73. [Google Scholar] [CrossRef]
  12. Nabavi-Pelesaraei, A.; Abdi, R.; Rafiee, S.; Mobtaker, H.G. Optimization of energy required and greenhouse gas emissions analysis for orange producers using data envelopment analysis approach. J. Clean. Prod. 2014, 65, 311–317. [Google Scholar] [CrossRef]
  13. Cataldo, A.; Taisch, M.; Stahl, B. Modelling, simulation and evaluation of energy consumptions for a manufacturing production line. In Proceedings of the Industrial Electronics Society, IECON 2013—39th Annual Conference of the IEEE, Vienna, Austria, 10–13 November 2013; pp. 7529–7534. [Google Scholar]
  14. Cropanzano, R.; Mitchell, M.S. Social Exchange Theory: An Interdisciplinary Review. J. Manag. 2005, 31, 874–900. [Google Scholar] [CrossRef]
  15. UNEP Setac Life Cycle Initiative. Guidelines for Social Life Cycle Assessment of Products; UNEP Setac Life Cycle Initiative: Paris, France, 2009; Volume 15, ISBN 9789280730210. [Google Scholar]
  16. GRI -400 Series GRI Standards Download Center. Available online: https://www.globalreporting.org/standards/gri-standards-download-center/ (accessed on 9 February 2018).
  17. Fontes, J. Handbook for Product Social Impact Assessment; United Nations Development Programme: New York, NY, USA, 2016; p. 153. [Google Scholar]
  18. Herzberg, F. Herzberg’s Motivation-Hygiene Theory (Two Factor Theory); Arab British Academy for Higher Education: London, UK, 1959; pp. 1–2. [Google Scholar]
  19. Herzberg, F. One More Time: How Do You Motivate Employees? Harvard Business Review: Brighton, MA, USA, 2003. [Google Scholar]
  20. Yusoff, W.F.W.; Kian, T.S.; Idris, M.T.M. Herzberg’s Two Factors Theory on Work Motivation: Does Its Work for Todays Environment? Glob. J. Commer. Manag. Perspect. 2013, 2, 18–22. [Google Scholar] [CrossRef]
  21. Benoît, C.; Norris, G.A.; Valdivia, S.; Ciroth, A.; Moberg, A.; Bos, U.; Prakash, S.; Ugaya, C.; Beck, T. The guidelines for social life cycle assessment of products: Just in time! Int. J. Life Cycle Assess. 2010, 15, 156–163. [Google Scholar] [CrossRef]
  22. Vinyes, E.; Gasol, C.M.; Asin, L.; Alegre, S.; Muñoz, P. Life Cycle Assessment of multiyear peach production. J. Clean. Prod. 2015, 104, 68–79. [Google Scholar] [CrossRef]
  23. Petti, L.; Ugaya, C.M.L.; Di Cesare, S. Systematic review of Social-Life Cycle Assessment (S-LCA) case studies Impact Assessment method. In Proceedings of the Pre-Proceedings 4th International Seminar Social LCA, Montpellier, France, 19–21 November 2014; pp. 34–41. [Google Scholar]
  24. Slootweg, R.; Vanclay, F.; van Schooten, M. Function evaluation as a framework for the integration of social and environmental impact assessment. Impact Assess. Proj. Apprais. 2001, 19, 19–28. [Google Scholar] [CrossRef]
  25. ISO 14040:2006—Environmental Management—Life Cycle Assessment—Principles and Framework. Available online: https://www.iso.org/standard/37456.html (accessed on 27 February 2018).
  26. Chang, D.; Lee, C.K.M.; Chen, C.-H. Review of Life Cycle Assessment towards Sustainable Product Development. J. Clean. Prod. 2014, 83, 48–60. [Google Scholar] [CrossRef]
  27. The 400 Series of the GRI Standards Include Topic. Available online: https://www.globalreporting.org/standards/gri-standards-download-center/ (accessed on 9 February 2018).
  28. Hunkeler, D. Societal LCA Methodology and Case Study. Int. J. Life Cycle Assess. 2006, 11, 371–382. [Google Scholar] [CrossRef]
  29. Gbededo, M.A.; Liyanage, K.; Oraifige, I. Simulation Aided Life Cycle Sustainability Assessment Framework for Manufacturing Design and Management. Int. J. Mech. Aerosp. Ind. Mechatron. Manuf. Eng. 2015, 10, 1–3. [Google Scholar]
  30. Meyer, J.P.; Becker, T.E.; Hautes, E.; Vandenberghe, C. Employee Commitment and Motivation: A Conceptual Analysis and Integrative Model. J. Appl. Psychol. 2004, 89, 991–1007. [Google Scholar] [CrossRef] [PubMed]
  31. Afful-Broni, A. Relationship between Motivation and Job Performance at the University of Mines and Technology, Tarkwa, Ghana: Leadership Lessons. Creat. Educ. 2012, 3, 309–314. [Google Scholar] [CrossRef]
  32. Magzan, M. Social Economy: Inclusion of Person and Human Sociability. J. Eng. Manag. Compet. 2014, 4, 13–20. [Google Scholar] [CrossRef]
  33. Ryan, R.M.; Deci, E.L. Self-Determination Theory and the Facilitation of Intrinsic Motivation, Social Development, and Well-Being. Am. Psychol. 2000, 55, 68–78. [Google Scholar] [CrossRef] [PubMed]
  34. Gallup. State of the American Workplace. Available online: https://qualityincentivecompany.com/wp-content/uploads/2017/02/SOAW-2017.pdf (accessed on 16 March 2018).
  35. OCED. Job Creation Through the Social Economy and Social Entrepreneurship; OCED: Paris, France, 2013. [Google Scholar]
  36. Thibaut, J.; Kelley, H. Social Exchange Theory THE OUTCOME MATRIX AS A MIRROR OF LIFE. Available online: http://www.afirstlook.com/docs/socialexchange.pdf (accessed on 11 March 2018).
  37. Konovsky, M.A.; Pugh, S.D. Citizenship behavior and social exchange. Acad. Manag. J. 1994, 37, 656–669. [Google Scholar] [CrossRef]
  38. Kuvaas, B.; Dysvik, A. Perceived investment in employee development, intrinsic motivation and work performance. Hum. Resour. Manag. J. 2009, 19, 217–236. [Google Scholar] [CrossRef]
  39. Brønn, P.S.; Vidaver-Cohen, D. Corporate motives for social initiative: Legitimacy, sustainability, or the bottom line? J. Bus. Ethics 2009, 87, 91–109. [Google Scholar] [CrossRef]
  40. Paper, O.S. Educated and satisfied worker—Foundation of modern and successful company. J. Eng. Manag. Comp. 2014, 4, 27–33. [Google Scholar]
  41. Dartey-Baah, K.; Amoako, G.K. Application of Frederick Herzberg’s Two-Factor theory in assessing and understanding employee motivation at work: A Ghanaian Perspective. Eur. J. Bus. Manag. 2011, 3, 1–8. [Google Scholar]
  42. Abraham Maslow’s Hierarchy of Needs motivational model. Available online: http://www.businessballs.com/maslow.htm (accessed on 11 March 2018).
  43. Frederick Herzberg—Motivation Theory. Available online: https://www.businessballs.com/improve-workplace-performance/frederick-herzberg-motivation-theory-4037/ (accessed on 11 March 2018).
  44. Noell, N.H. Herzberg’s two-factor theory of job satisfaction. Security 1976. [Google Scholar] [CrossRef]
  45. Janis, I. A First Look at Communication Theory; McGraw-Hill: New York, NY, USA, 1998; pp. 235–246. [Google Scholar]
  46. Fortune Fortune 100 Best Companies to Work For®. 2017. Available online: https://www.greatplacetowork.com/best-workplaces/100-best/2017 (accessed on 8 February 2018).
  47. Esposito, E. Calculating Productivity for Employees. Available online: https://www.smartsheet.com/blog/how-calculate-productivity-all-levels-organization-employee-and-software (accessed on 11 March 2018).
  48. The World Bank. Measuring Growth in Total Factor Productivity. Econ. Policy 2000. [Google Scholar] [CrossRef]
  49. Comin, D. Total Factor Productivity. New Palgrave Dict. Econ. 2008, 1088–1092. [Google Scholar] [CrossRef]
  50. Adak, M. Total Factor Productivity and Economic. İstanbul Ticaret Üniversitesi Sosyal Bilimler Dergisi Yıl 2009, 8, 49–56. [Google Scholar]
  51. D’Auria, F.; Denis, C.; Havik, K.; Mc Morrow, K.; Planas, C.; Raciborski, R.; Roger, W.; Rossi, A. The Production Function Methodology for Calculating Potential Growth Rates and Output Gaps; European Economy; Economic: Brussels, Belgium, 2010; Volume 420, ISBN 1725-3187. [Google Scholar]
  52. Haapala, K.R. Haapala etal MSEC2011-50300 MEDLCEpaper final. In Proceedings of the ASME 2011 International Manufacturing Science and Engineering Conference MSEC2011, Corvallis, OR, USA, 13–17 June 2011. [Google Scholar]
  53. Halog, A.; Manik, Y. Advancing integrated systems modelling framework for life cycle sustainability assessment. Sustainability 2011, 3, 469–499. [Google Scholar] [CrossRef]
  54. Stefanova, M.; Tripepi, C.; Zamagni, A.; Masoni, P. Goal and Scope in Life Cycle Sustainability Analysis: The Case of Hydrogen Production from Biomass. Sustainability 2014, 6, 5463–5475. [Google Scholar] [CrossRef]
  55. Analytic Equations. Available online: http://people.cs.uchicago.edu/~lebovitz/Eodesbook/an.pdf (accessed on 6 March 2018).
  56. Tako, A.A.; Robinson, S. The application of discrete event simulation and system dynamics in the logistics and supply chain context. Decis. Support Syst. 2012, 52, 802–815. [Google Scholar] [CrossRef] [Green Version]
  57. Solding, P.; Petku, D.; Mardan, N. Using simulation for more sustainable production systems – methodologies and case studies. Int. J. Sustain. Eng. 2009, 2, 111–122. [Google Scholar] [CrossRef]
  58. Thiede, S.; Seow, Y.; Andersson, J.; Johansson, B. Environmental aspects in manufacturing system modelling and simulation-State of the art and research perspectives. CIRP J. Manuf. Sci. Technol. 2013, 6, 78–87. [Google Scholar] [CrossRef]
  59. Seow, Y.; Rahimifard, S.; Woolley, E. Simulation of energy consumption in the manufacture of a product. Int. J. Comput. Integr. Manuf. 2013, 26, 663–680. [Google Scholar] [CrossRef]
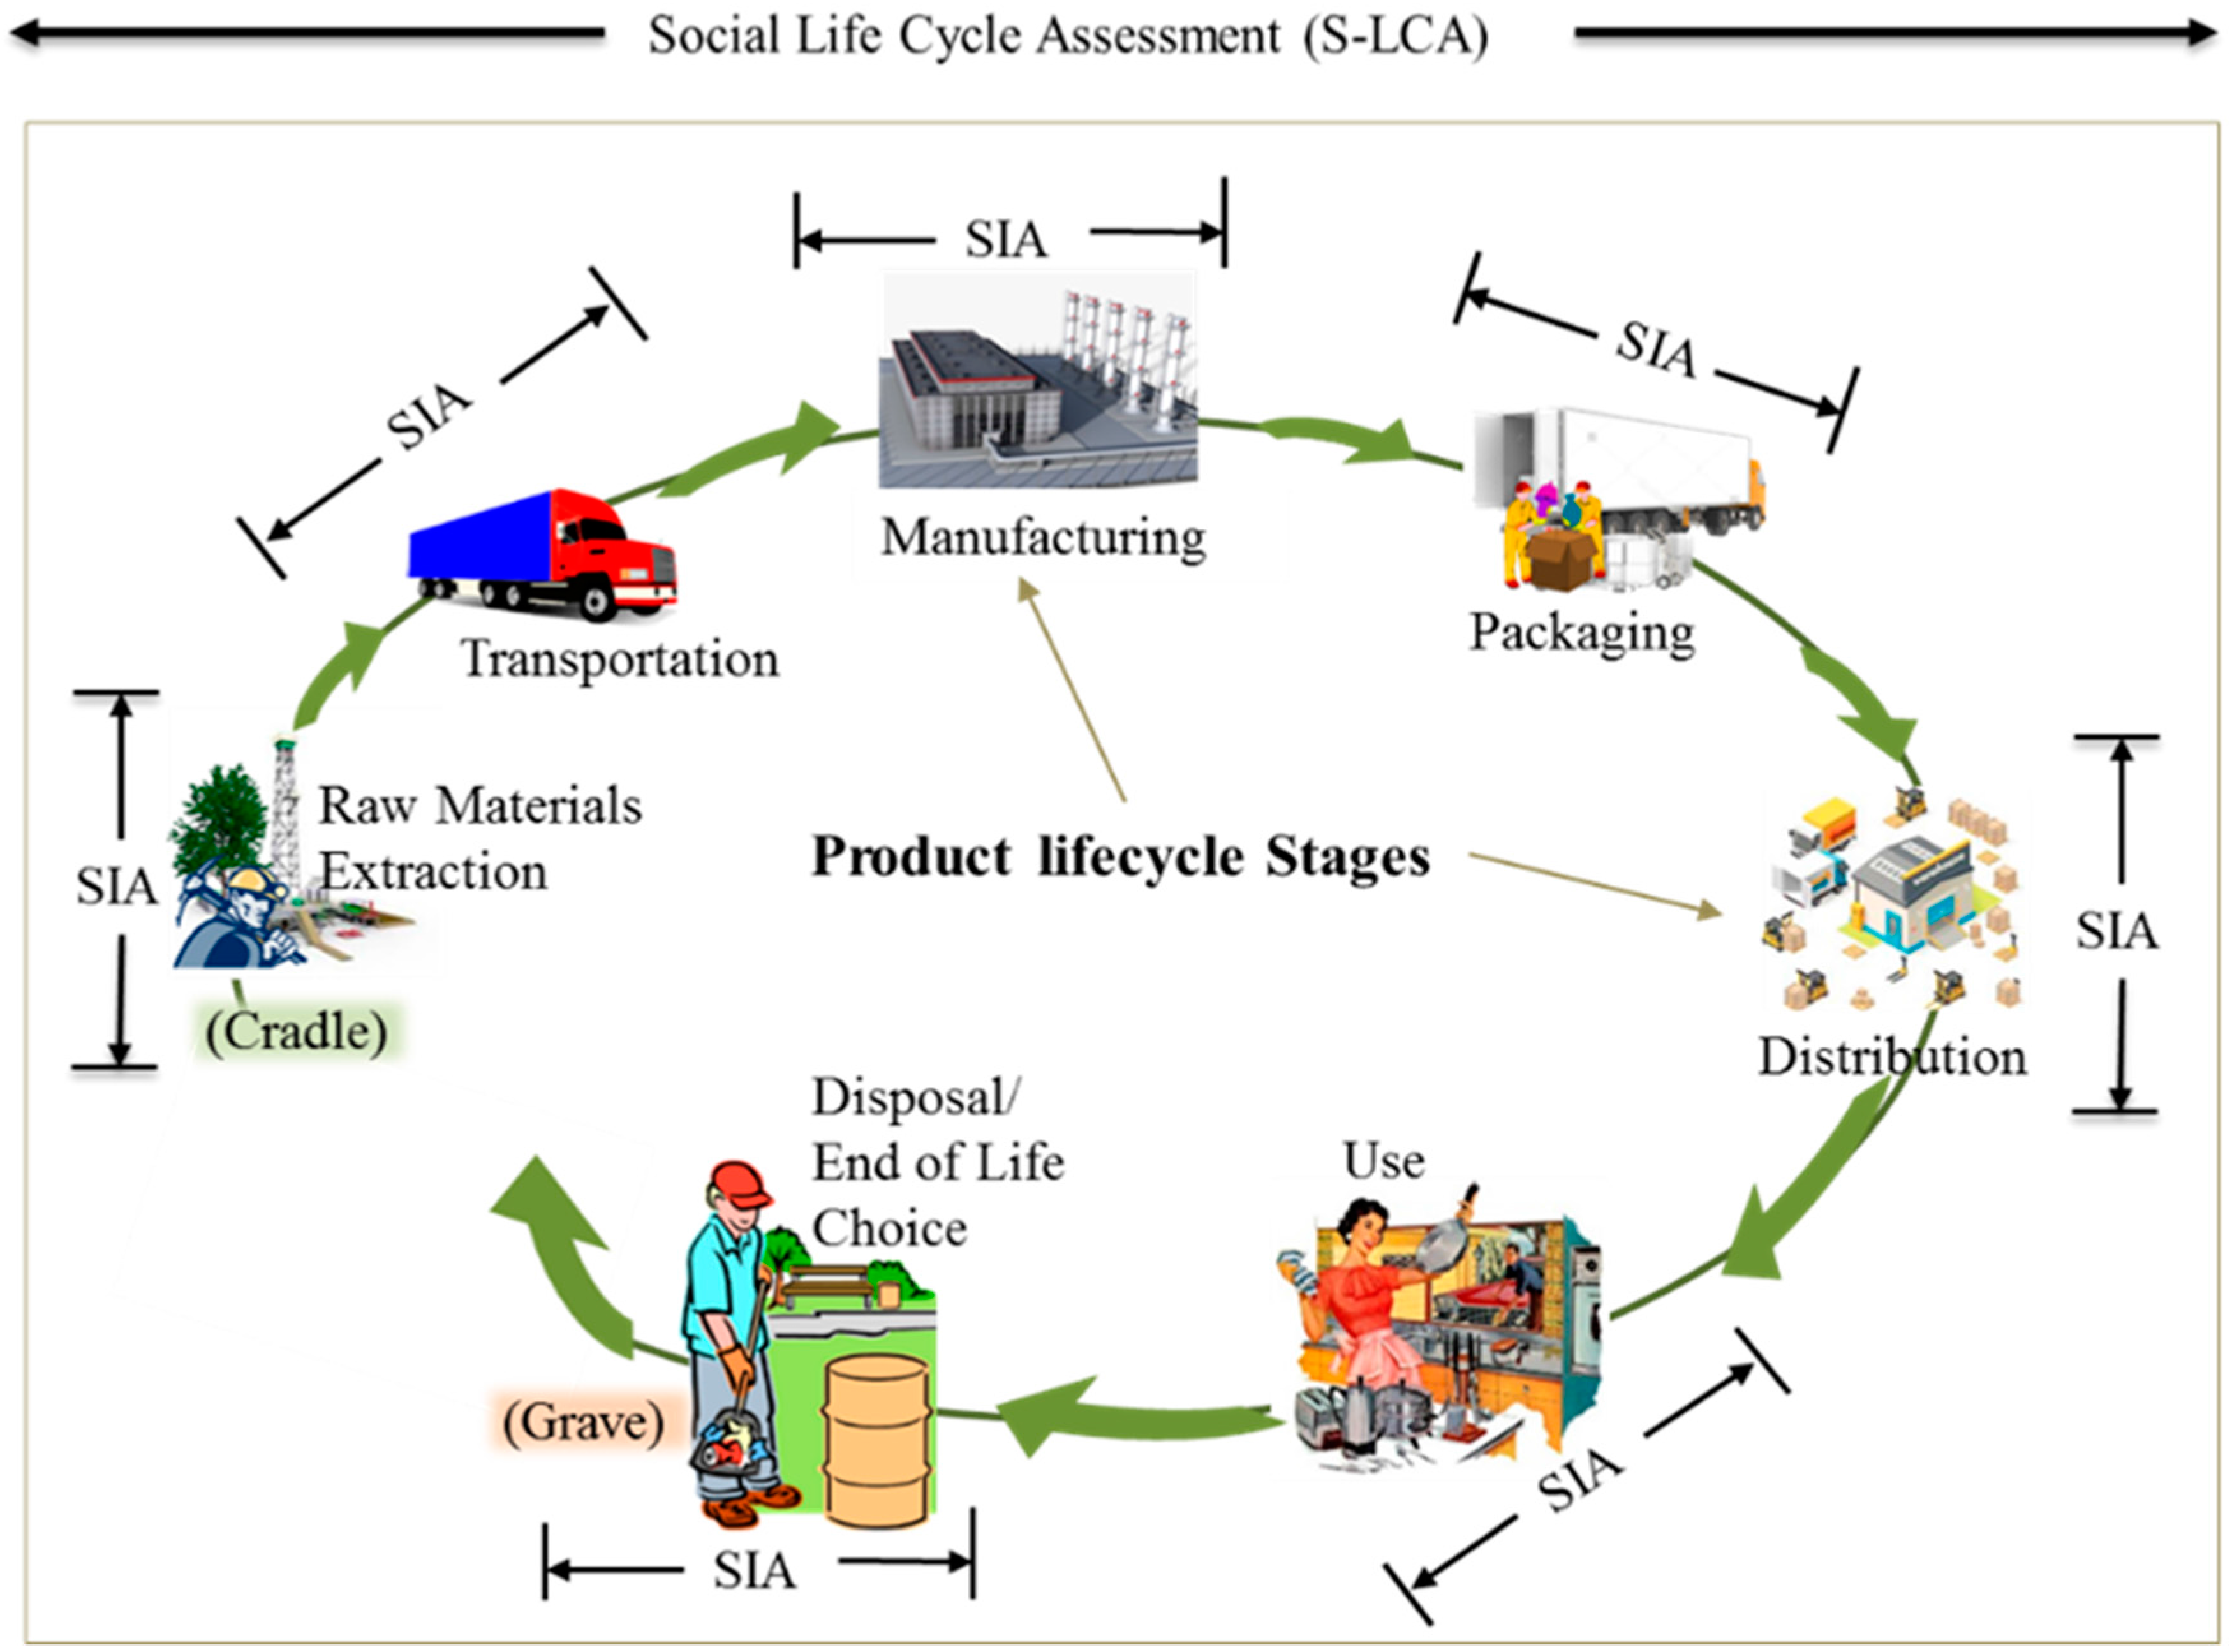
Figure 1. Product lifecycle stages and social impact assessment (SIA).
Sustainability 10 00852 g001
Figure 2. Decomposition process of a product lifecycle stage into impact subcategories.
Sustainability 10 00852 g002
Figure 3. Alignment of social impact assessment (SIA) with the theory of motivation.
Sustainability 10 00852 g003
Figure 4. The role of regulations and legislation in the alignment, and employees’ motivation.
Sustainability 10 00852 g004
Figure 5. Key components and process for calculating the social impact coefficient (β).
Sustainability 10 00852 g005
Figure 6. SIC calculation process (adapted from [9,15]).
Sustainability 10 00852 g006
Table 1. Social impacts stakeholders’ categories (adapted from [15,21,27,28]).
Stakeholder CategoriesImpacts Subcategories
Workers (Employees)Investment on HR, freedom of association and collective bargaining, child and forced labour, fair salary, working hours, equal opportunities/discrimination, health & safety, social initiatives, social benefits/ security, training
Consumers–(supply chain and end users)Health and safety, feedback mechanism, consumer privacy, transparency, end of life responsibility
Local communityAccess to material resources, access to immaterial resources, delocalization and migration, cultural heritage, safe and healthy living conditions, respect for indigenous rights, community engagement, local employment, secure living conditions
Society–(national and global)Public commitments to sustainability issues, contribution to economic development, prevention and mitigation of armed conflicts, technology development, Corruption
Value chain actors-suppliers (not including end-consumers)Fair competition, promoting social responsibility, supplier relationships, respect for intellectual property rights
Table 2. Impacts subcategories of workers’ stakeholder categories (adapted from [15,16,21]).
Impact SubcategoriesDescriptions of IndicatorsImpact Types
Risks of the right to Freedom of Association and collective bargainingi. Violation of workers’ rights to exercise freedom of association or collective bargaining
ii. Right of Association Policy in place
Negative (Regulated)
Risk of incidents of Child laboura. Operations and suppliers considered having significant risk for incidents of:
i. Child labour;
ii. Young workers exposed to hazardous work.
b. Measures taken by the organization to contribute to the effective abolition of child labour (e.g., policies against child labour)
Negative (Regulated)
Elimination of forced and compulsory laboura. Operations and suppliers considered having significant risk for incidents of forced or compulsory labour either in terms of i.
Type of operation (such as manufacturing plant) and supplier; ii. Countries or geographic areas with operations and suppliers considered at risk.
b. Measures taken by the organization to the elimination of all forms of forced or compulsory labour (e.g., Policies against forced labour)
Negative (Regulated)
Job Creationi. Work hour created per year
ii. Fair salary compare to similar industries
Positive (Unregulated)
Equal opportunities/non-discriminationi. Diversity of governance bodies and employees
ii. Non-gender bias and equal opportunity
iii. Ratio of basic salary of men to women
iii. Availability of equality policy and training of staff on relevant codes and guidelines related to discrimination and equality
Negative (Regulated)
Occupational Health & Safety Managementi. Respect for workers right; ii. Injury and Absentee rates; iii. High-risk work or work environment;
iv. Formal Health and safety agreement with trade union v. RIDDOR
Negative (Regulated)
Social Initiativesi. Provision of social amenities onsite for workers
ii. Onsite social events and outing
iii. Recognition and Award events
Positive (Unregulated)
Investment in Human Resources (Social benefits/social security)The number of full-time staff entitle to:
I. Life insurance; ii. Healthcare; iii. Disability and invalidity coverage; iv. Parental leave; v. Retirement provision; vi. Stock ownership
Positive (Regulated)
Labour & Management Relations (Effective Communication)i. Minimum notice period provided to employees and their representatives prior to the implementation of significant operational changes.
ii. Notice period and provisions for consultation and negotiation are specified in collective agreements
Negative (Regulated)
Trainingi. Average hours of training available to the employees per year
ii. Programmes for skills upgrade and development
iii. Regular Performance Review/Appraisal of employees
Positive (Regulated)
Table 3. SIA summary information sheet.
Goal & Scope
  • To model the most efficient and sustainable production process for a production line
  • Analyse the impacts of alternative processes on the three sustainability aspects in order to choose the best process option.
  • The Object of Study: Manufacturing stage (see Section 3)
  • Boundary 2: Production line (process level assessment), End of the assessing year
  • Functional Unit: Process time
Stakeholder Category: Employees/Workers
Selected Impact SubcategoriesIndicators (Ref: GRI, 2016 Equations)Impact Types
S1Investment in Human ResourcesAggregated percentage of FT employee benefits+Ve & −Ve
S2Onsite Social InitiativesNumber of social amenities on site+Ve
S3Training and EducationAverage training hour per employee+Ve
S4Labour /Management RelationsEffectiveness of labour/management relations+Ve & −Ve
S5Occupational Health and SafetyPercentage of workers representatives at formal joint H & S meetings−Ve
S6Freedom of association and collective bargainingRisk of right to exercise freedom of association or collective bargaining+Ve & −Ve
S7Diversity and Equal OpportunityRatio of basic salary of men to women+Ve & −Ve
S8Non-DiscriminationEffective Non-discrimination policy and procedure−Ve
S9Child LabourRisk for incidents of child labour−Ve
S10Forced or Compulsory LabourRisk for incidents of slave or bond labour−Ve
(Social impact types: positive is denoted by +Ve and negative by −Ve).
Table 4. SIC data sheet.
Graded Social Scores of Aggregated Social Weights (Scale-Based Referencing)
Aspects Counts (Number of Occurrence): C a + =   6 C a =   8
Social AspectsPositive Aspects ( W a + ) Negative Aspects (   W a )
S163
S27
S38
S477
S5 4
S658
S746
S8 6
S9 9
S10 9
Total Weighted Values3752
Total Highest Possible Weighted Values(6 × 9) = 54(8 × 9) = 72
Percentage of Average weighted values68.52%72.22%
Ratio of Social Aspect Types0.42860.5714
Relative Social Impacts Index0.29370.4127
Social Impact Coefficient ( β ) 0.7064