Article

Influence of Waste Glass Powder Addition on the Pore Structure and Service Properties of Cement Mortars

1
Departamento de Ingeniería Civil, Universidad de Alicante, Ap. Correos 99, 03080 Alacant/Alicante, Spain
2
Departamento de Obras Civiles, Universidad de la Frontera, Av. Fco. Salazar, Temuco 01145, Chile
3
Department of Science and Engineering of Matter, Environment and Urban Planning, Università Politecnica delle Marche, Via Brecce Bianche, 60131 Ancona, Italy
*
Author to whom correspondence should be addressed.
Sustainability 2018, 10(3), 842; https://doi.org/10.3390/su10030842
Submission received: 6 March 2018 / Revised: 9 March 2018 / Accepted: 15 March 2018 / Published: 16 March 2018
(This article belongs to the Special Issue Sustainable Cementitious Materials for the Construction Industry)

Abstract

:
At present, reusing waste constitutes an important challenge in order to reach a more sustainable environment. The cement industry is an important pollutant industrial sector. Therefore, the reduction of its CO2 emissions is now a popular topic of study. One way to lessen those emissions is partially replacing clinker with other materials. In this regard, the reuse of waste glass powder as a clinker replacement could be possible. This is a non-biodegradable residue that permanently occupies a large amount of space in dumping sites. The aim of this work is to study the long-term effects (400 days) of the addition of waste glass powder on the microstructure and service properties of mortars that incorporate up to 20% of this addition as clinker replacement. The microstructure has been characterised using the non-destructive impedance spectroscopy technique and mercury intrusion porosimetry. Furthermore, differential thermal analysis was also performed. Compressive strength and both steady-state and non-steady-state chloride diffusion coefficients have also been determined. Considering the obtained results, mortars with 10% and 20% waste glass powder showed good service properties until 400 days, similar to or even better than those made with ordinary Portland cement without additions, with the added value of contributing to sustainability.

1. Introduction

At present, reusing and recycling waste constitutes an important challenge in order to reach a more sustainable environment. Among the different residues generated by our society, the amount of glass waste has gradually increased in recent years due to the higher use of glass products [1]. Those materials permanently occupy a large amount of space in dumping sites, and, as a consequence of the non-biodegradable nature of glass, cause serious environmental pollution. Moreover, the lack of space in dumping sites also constitutes a problem that concerns many cities with high population density all around the world [2]. It is considered that glass waste represents approximately 5% of home residue [3]. In relation to the European Union, the percentage of glass recycling coming from packaging is relatively high, reaching 73% [4]. On the other hand, in America the recycling rate is still low, such in USA, where only 34% of glass waste was recycled in 2014 [3]. Therefore, it is important to study how to reuse this waste, and in this context the construction industry is an attractive destination due to the high necessary volume and the low quality requirements [2].
On the other hand, the cement industry is a key industrial-sector polluter [5]. Therefore, the reduction of its CO2 emissions is a popular topic of study. One way to reduce those emissions is by partially, or even totally, replacing clinker with additions [6,7,8,9], most of which are pollutant residues of other industrial processes, such as fly ash, silica fume, and ground granulated blast-furnace slag [10,11,12,13,14,15].
In this regard, several studies [16,17,18,19] have pointed out that the reuse of waste glass powder as clinker replacement could be possible. As a consequence of its high silica content [18,19,20], glass powder has been proposed as a supplementary cementitious material, and studies have pointed out that glass has pozzolanic properties when the particle size of the material is less than 75 µm [16,17,18,19]. The recycled glass powder has potential for improving the physical and mechanical properties of mortars [21], such as drying shrinkage [20] and resistance against chloride ingress [17,20], as well as a reduction in the heat of hydration [22]. With the aim of controlling the loss of mechanical properties, Khmiri et al. [23] have used a design method in order to optimise the glass powder and cement binder, finding that the ideal binder is prepared with 20% glass powder and 80% cement. However, several studies have observed a delay of strength increase compared to the control mortar. Shao et al. [18] noted a reduction in the 28-day compressive strength of concretes with glass powder in comparison with reference ones, although at 90 days their strength was similar to or even better than that observed for concrete without glass powder addition. This coincides with the results obtained by other authors [17,22,24,25], revealing a higher pozzolanic activity of glass powder at later hardening stages.
The mechanical and durability properties of cementitious materials are directly related to their microstructure [26,27]; therefore, the study of the evolution of the pore network of those materials is relevant. There are many techniques for following the microstructure changes. One of them is the novel non-destructive impedance spectroscopy, whose use is becoming increasingly popular. In addition to cement-based materials prepared with ordinary Portland cement without additions, this technique has recently been used for those made with slag and fly ash cements [28] and exposed to aggressive [8,9,13,29] or non-optimal environments [30,31]. However, the impedance spectroscopy technique has never been used for registering the evolution of the pore structure of cement mortars with waste glass powder addition.
Therefore, the main goal of this work is to analyse the effects in the long term (up to400 days) of the addition of waste glass powder on the microstructure, durability, and mechanical properties of mortars that incorporate up to 20% of this addition as a clinker replacement. As a reference, mortars made using ordinary Portland cement without additions were also studied. The non-destructive impedance spectroscopy technique and mercury intrusion porosimetry were used in order to characterise the microstructure of the mortars. Furthermore, differential thermal analysis was also performed. In relation to durability, the steady-state diffusion coefficient obtained from the saturated sample’s resistivity and the non-steady-state chloride migration coefficient were analysed. Lastly, regarding the mechanical performance of the mortars, both flexural and compressive strength were also determined.

2. Experimental Setup

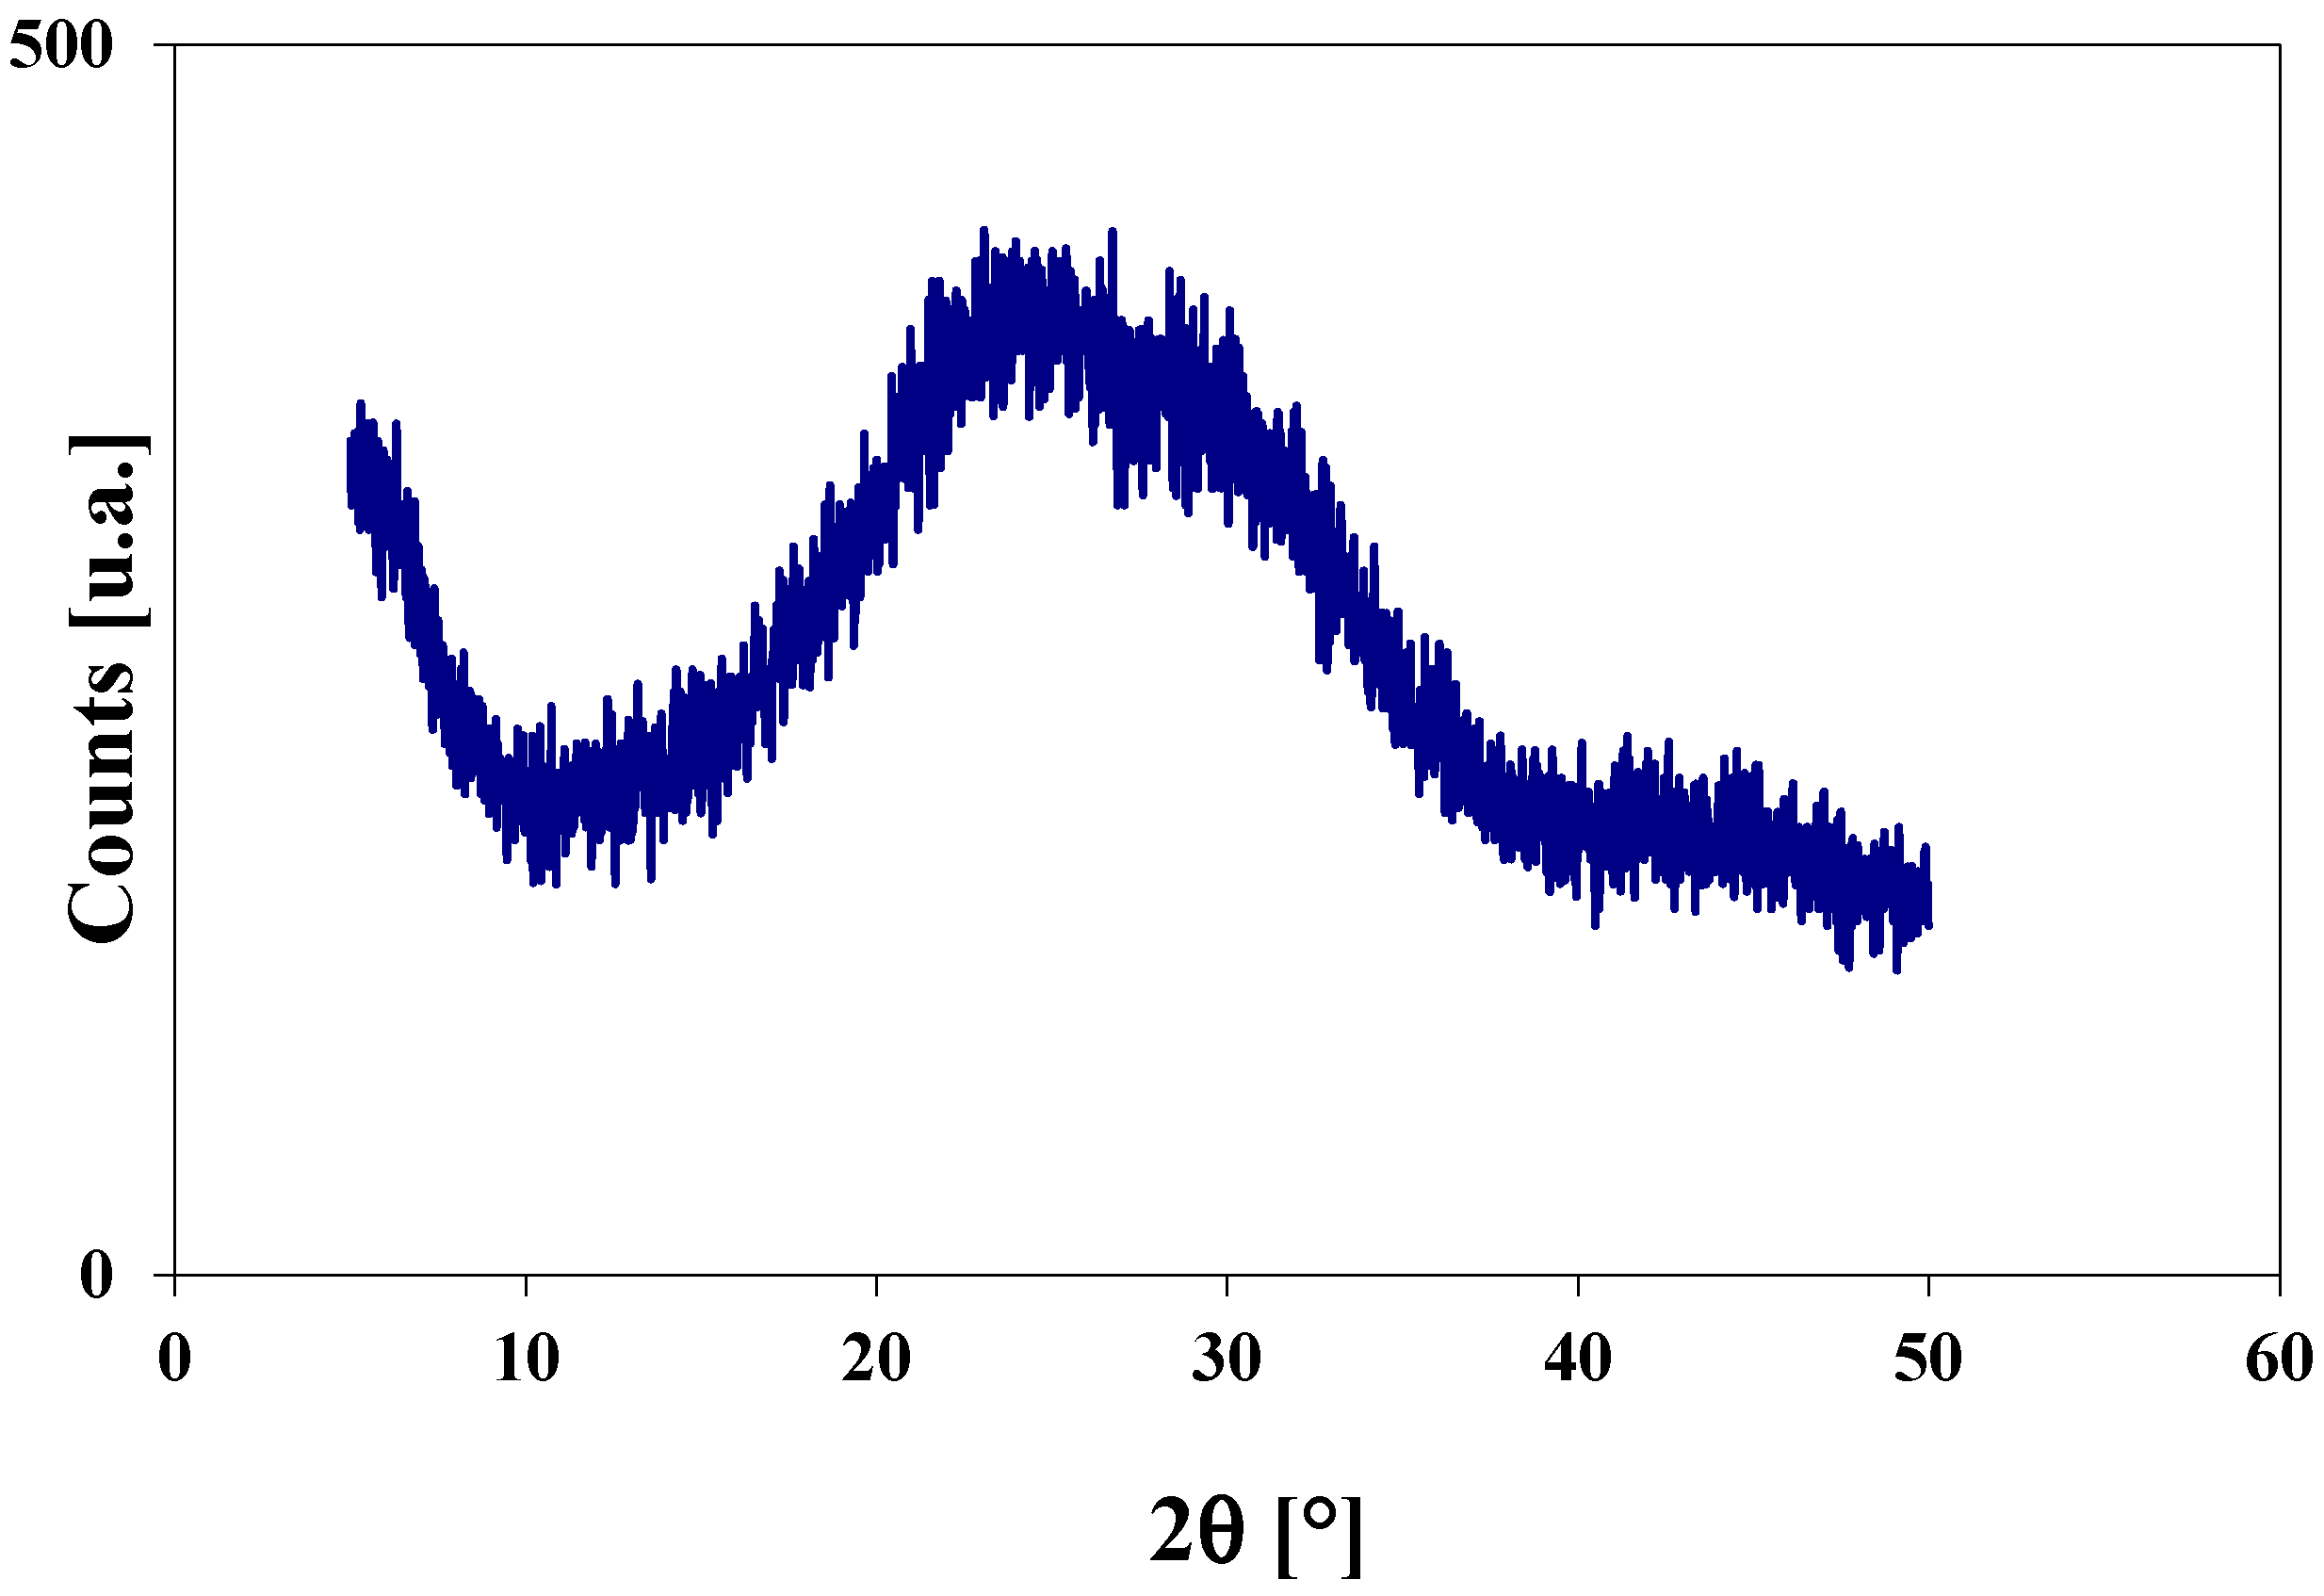
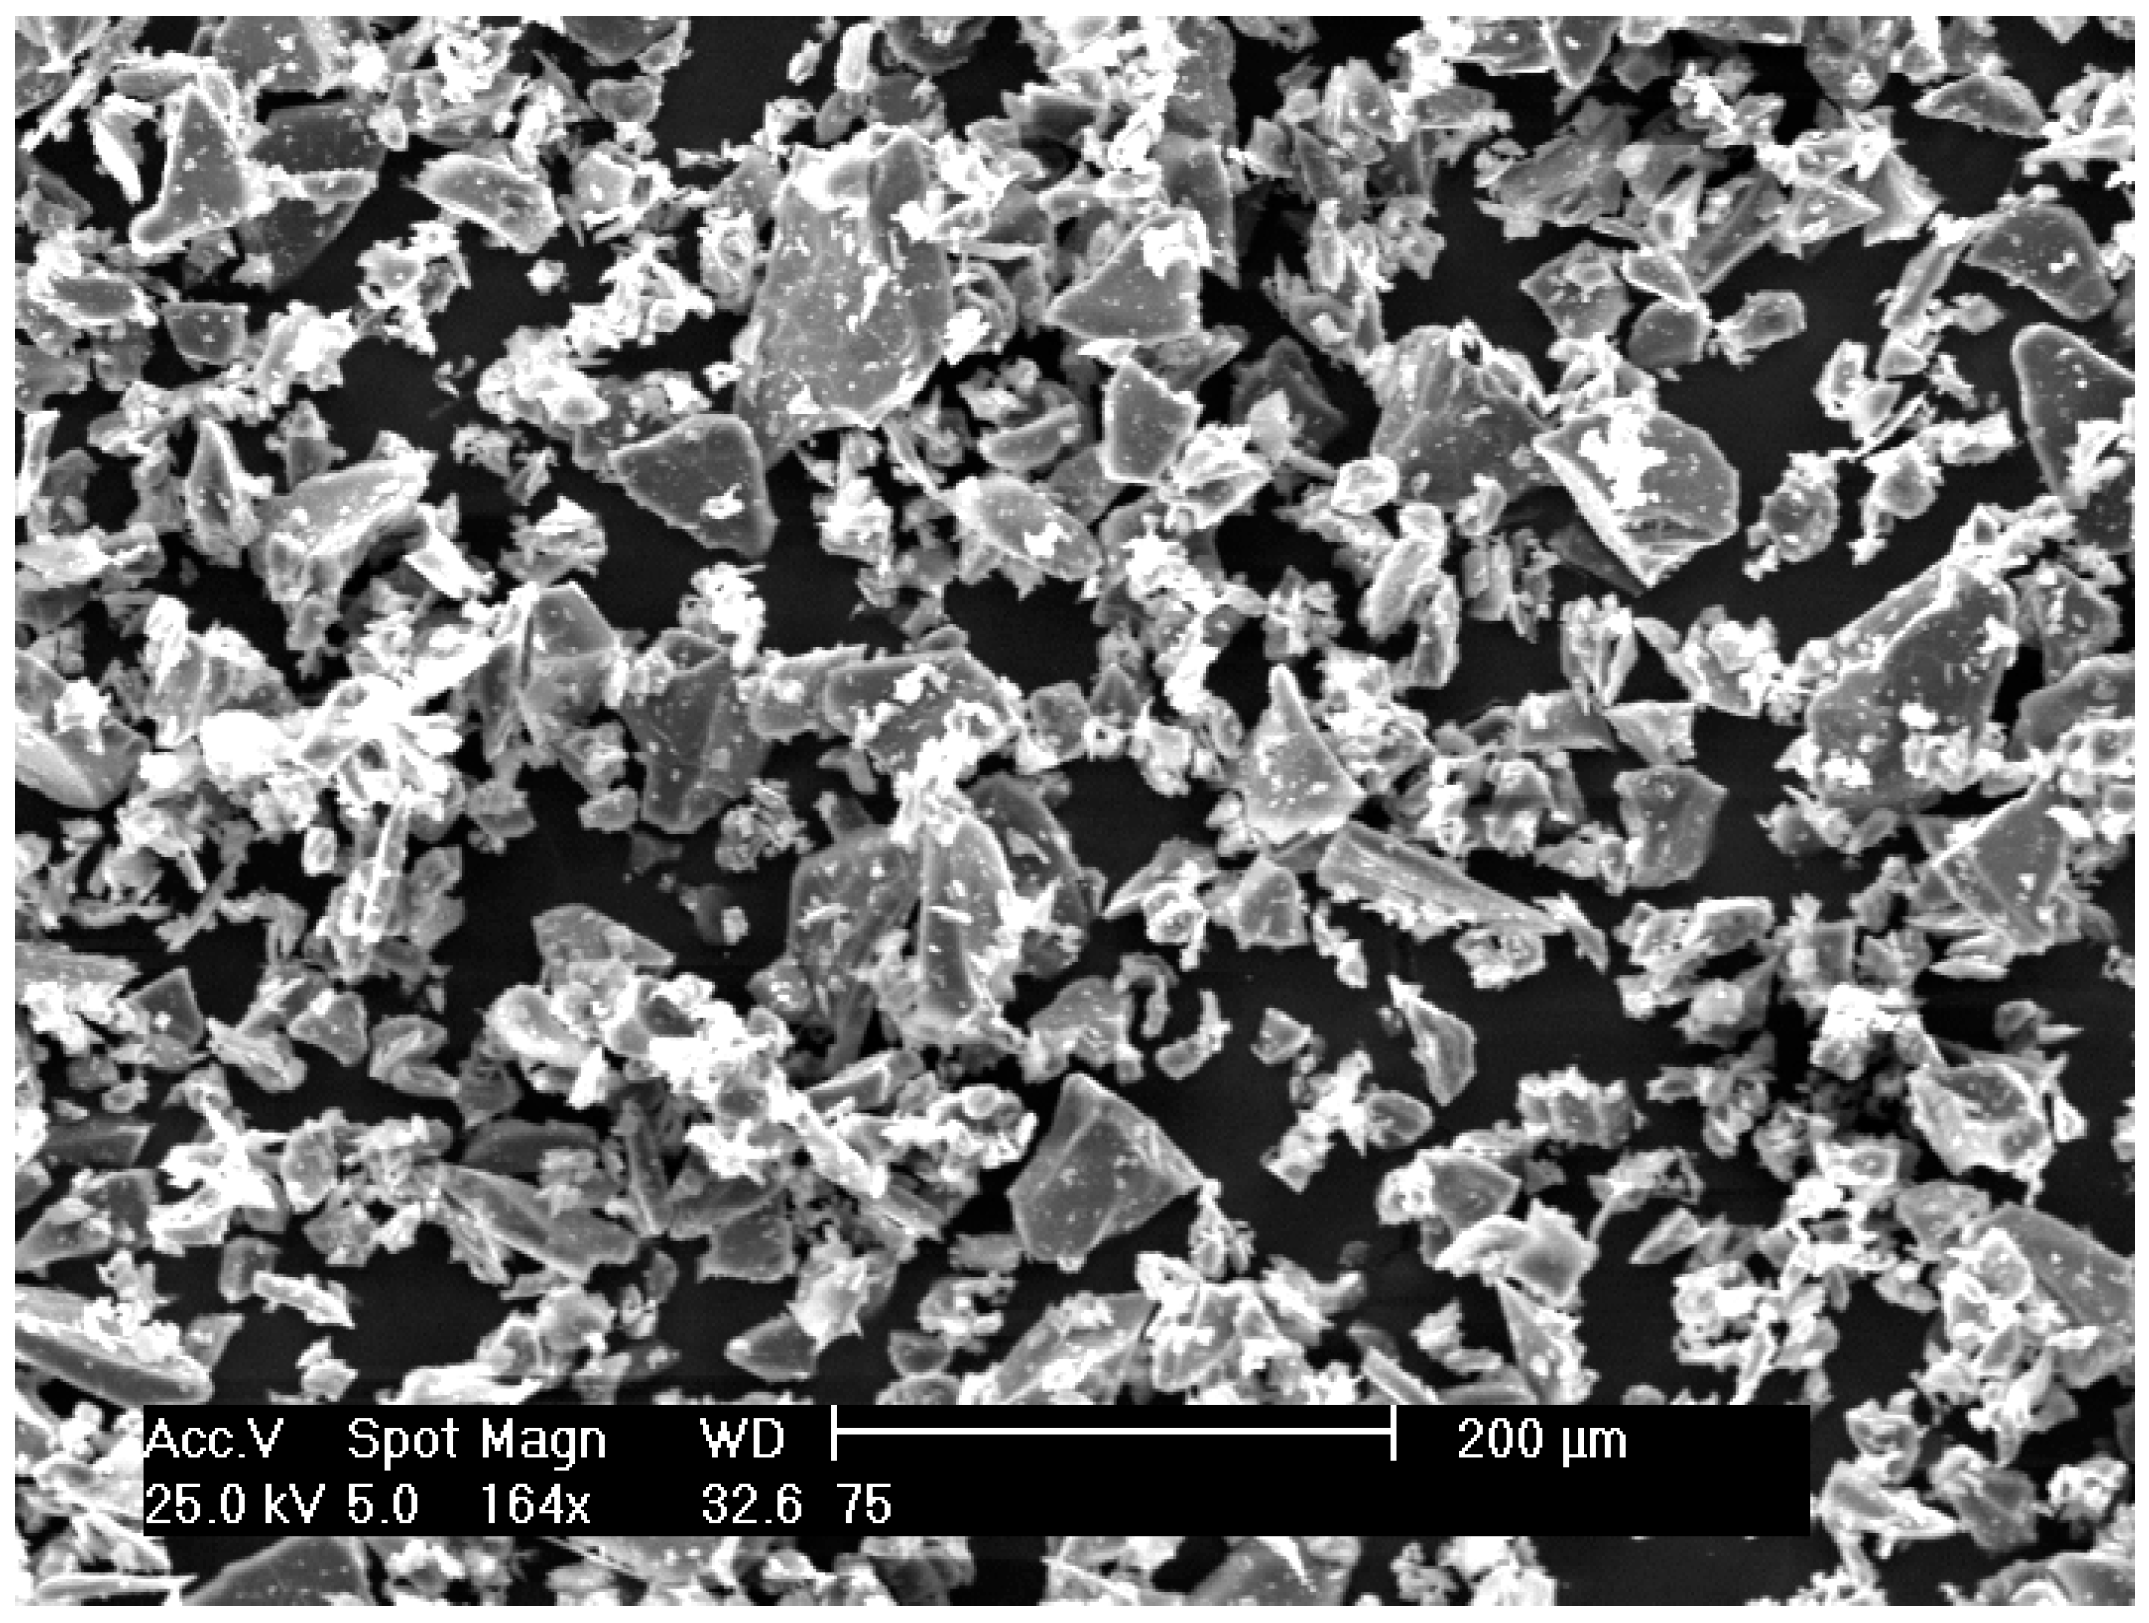
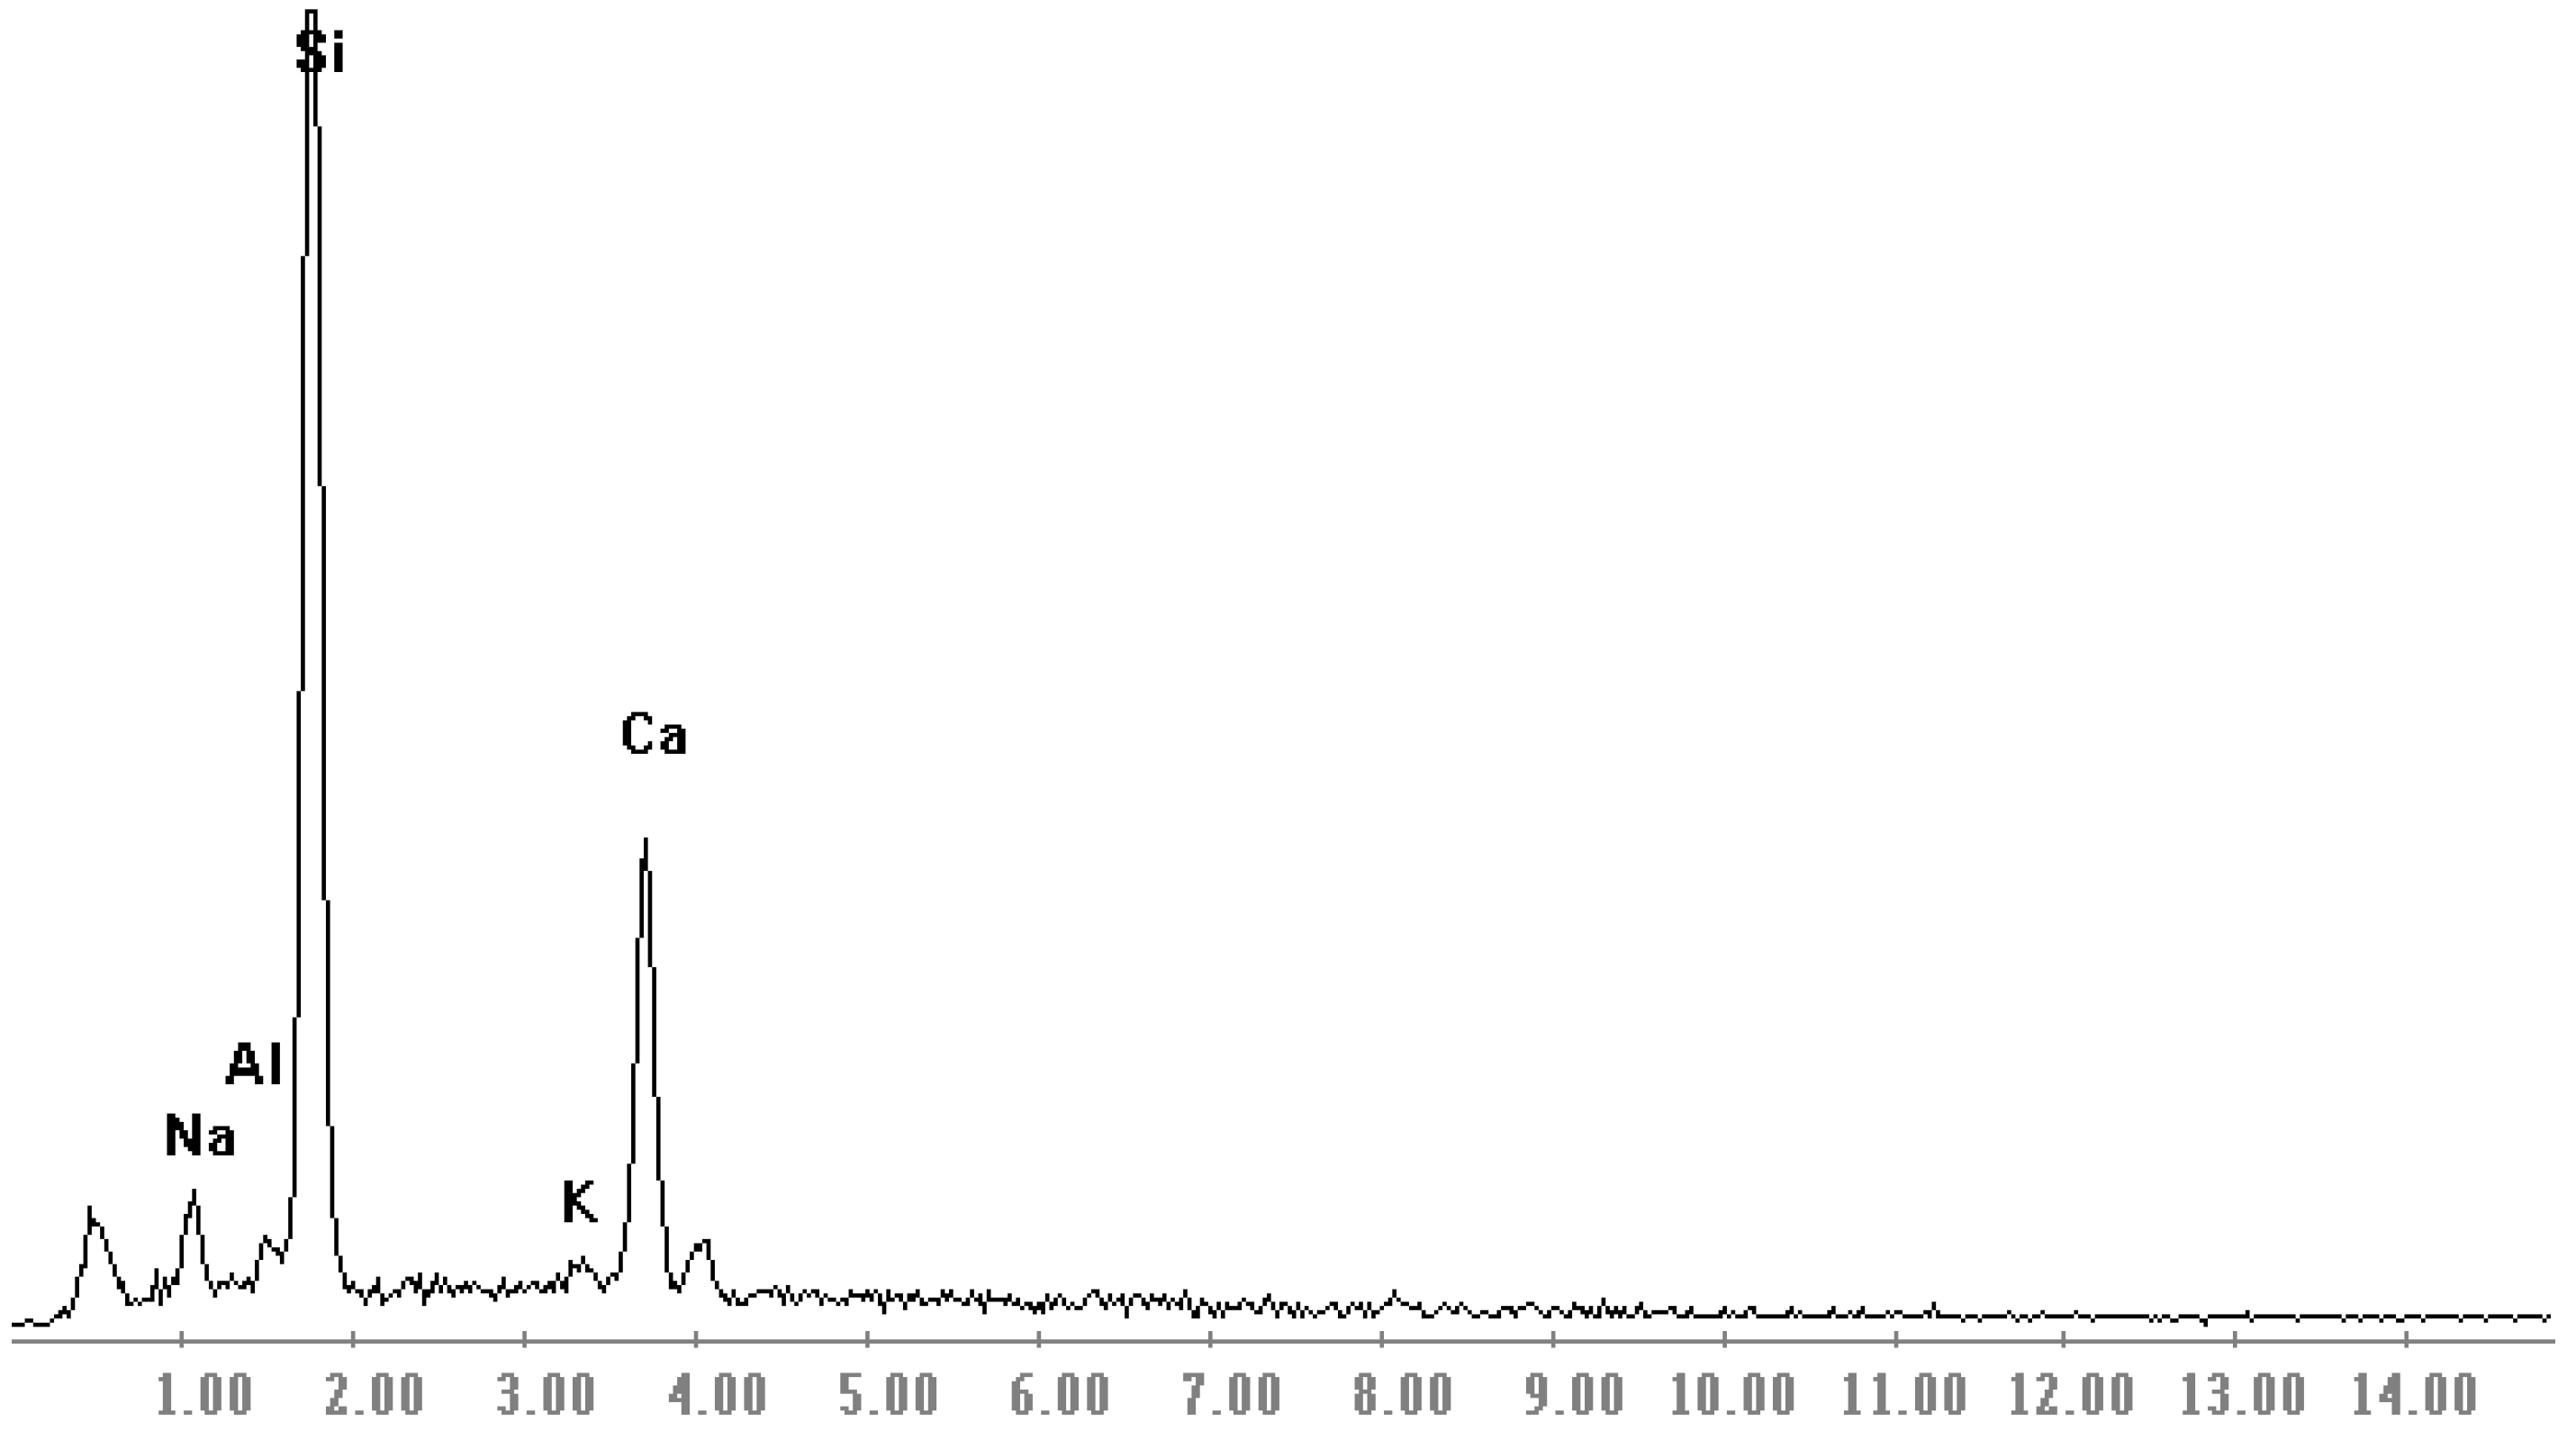
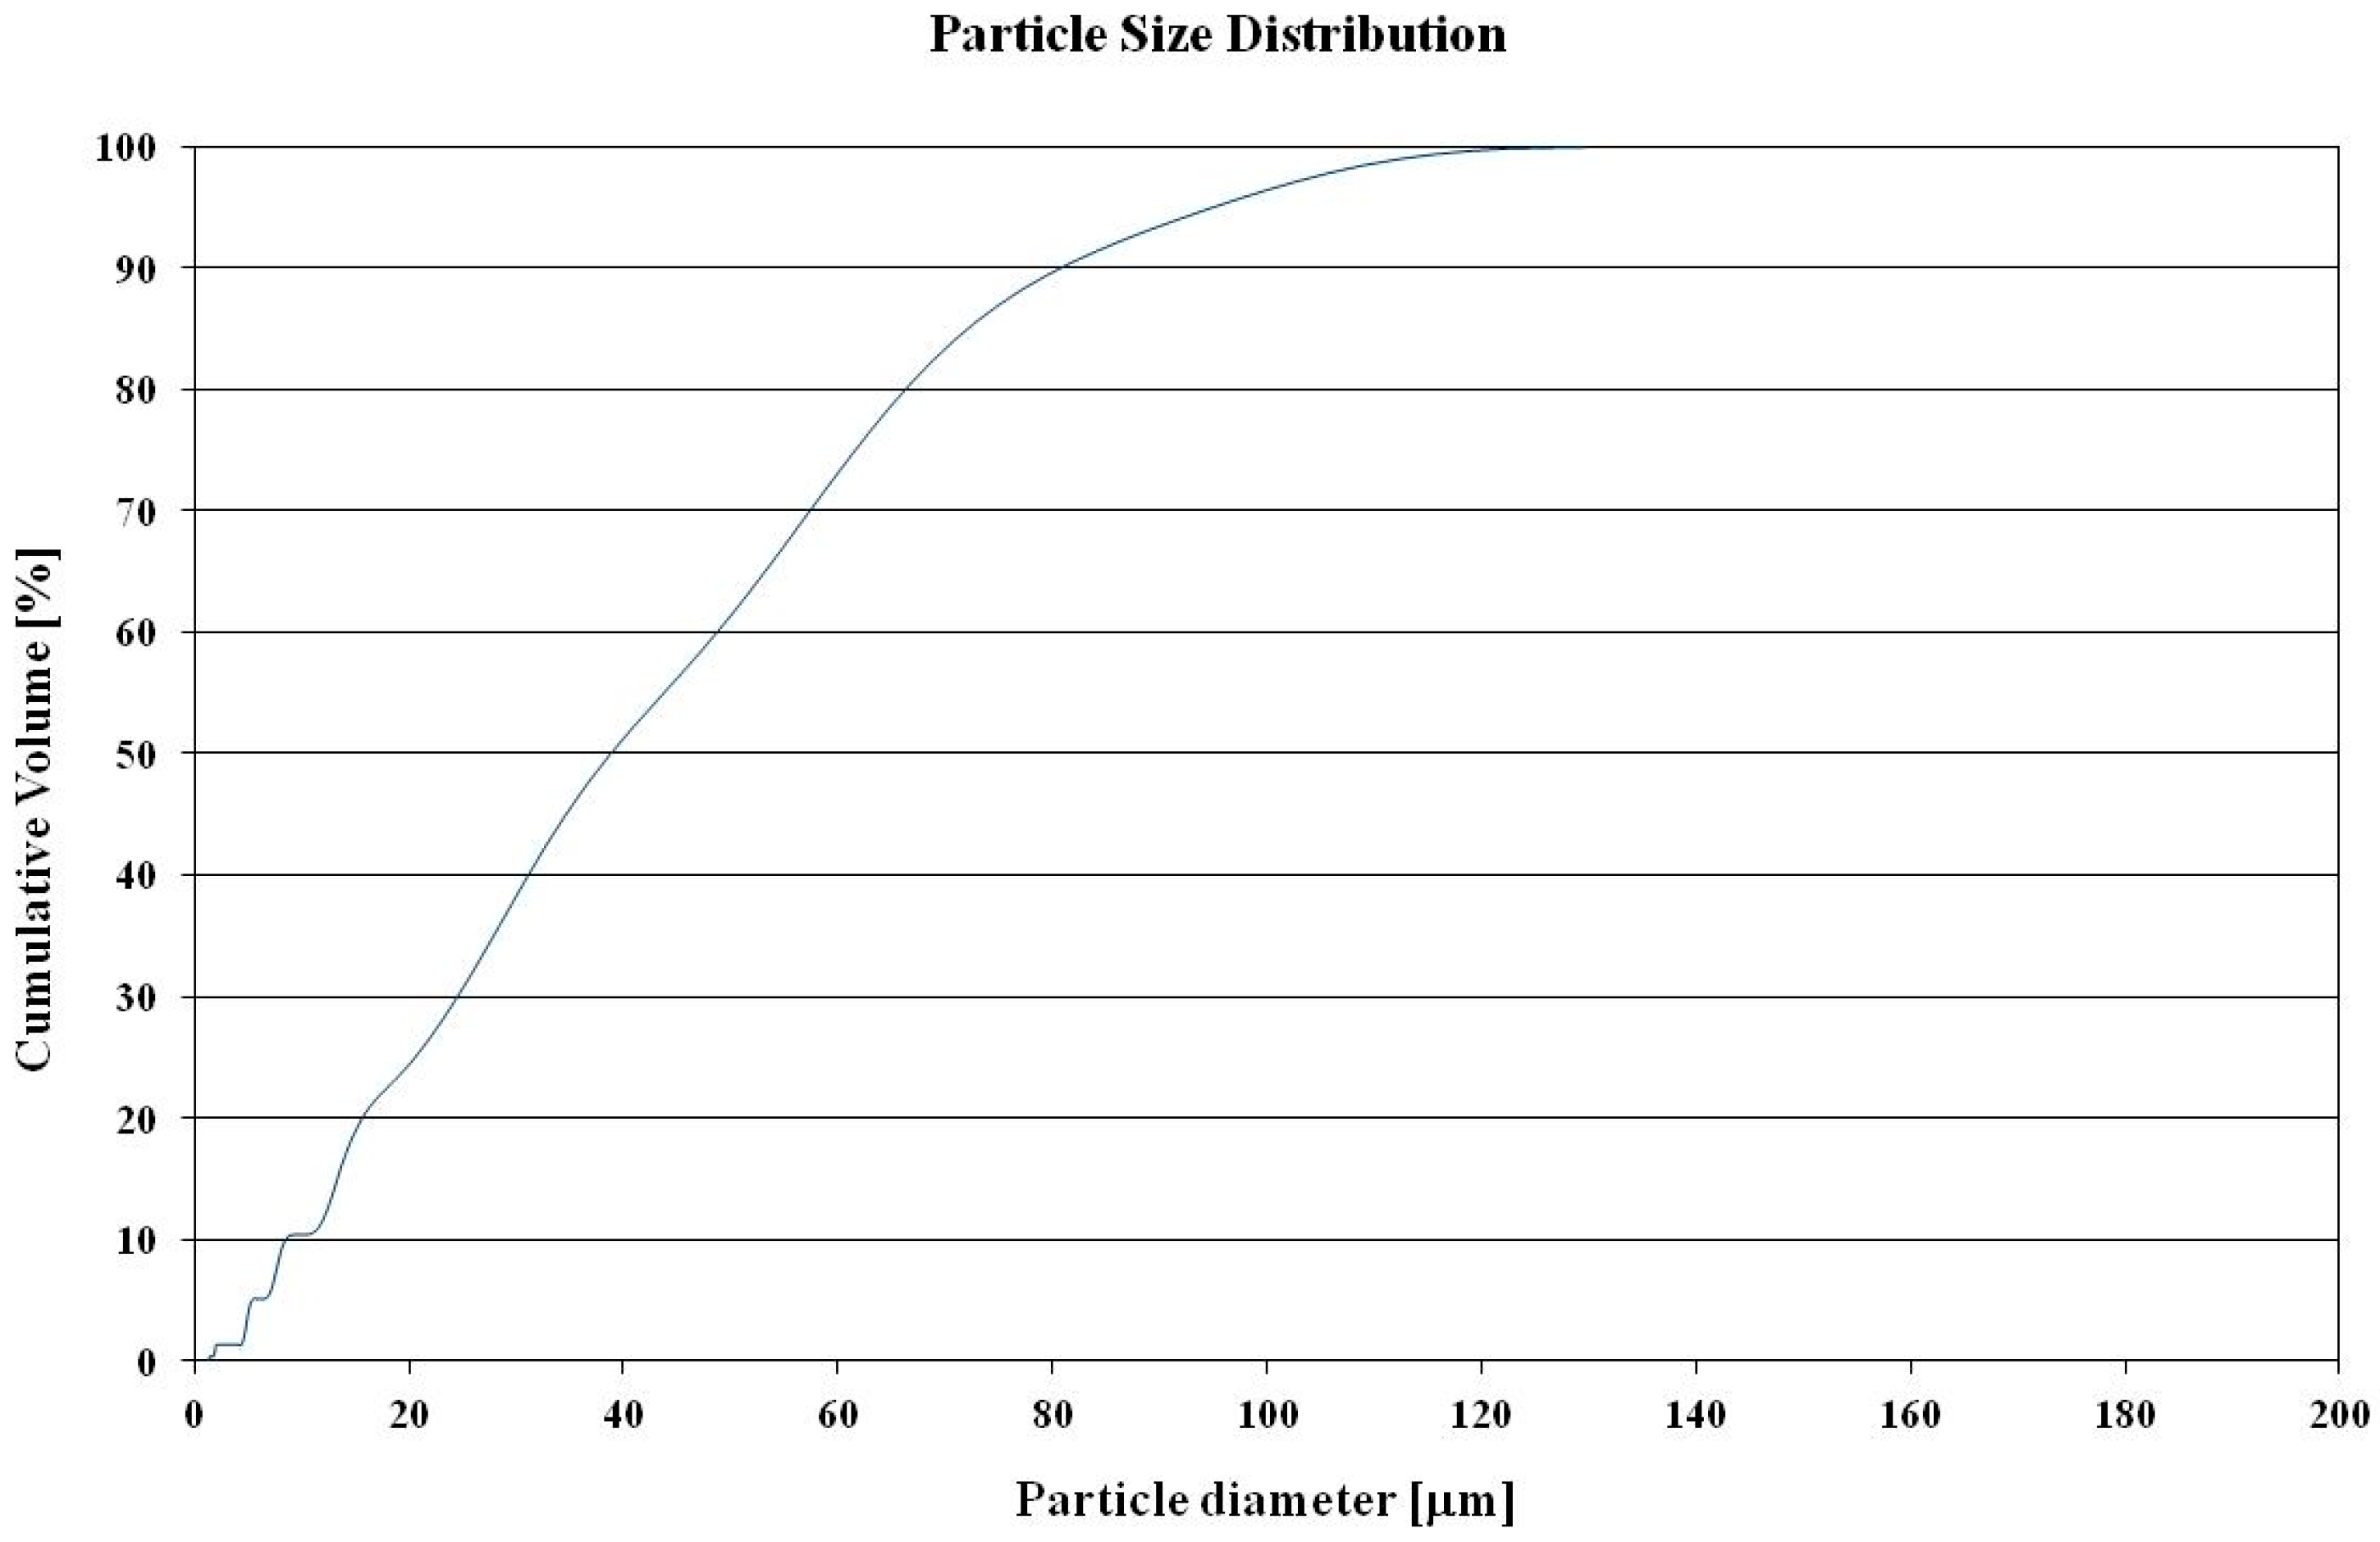
2.1. Waste Glass Powder Characterisation

The waste glass is obtained from municipal recycling containers. Figure 1 shows the X-ray diffraction pattern of the glass powder. No peaks attributed to any crystallised compound can be identified except a broad diffraction halo (amorphism of between 20° and 30°), which is attributed to the glassy amorphous phase. The results of the scanning electron micrograph (SEM) and X-ray EDS (energy dispersive spectroscopy) analysis are shown in Figure 2 and Figure 3, respectively. SEM examinations indicated that the glass powders consist mainly of angular flaky particles. Figure 4 shows the particle size gradation curve of glass powder used in the experimental program. The physical and chemical composition of this addition is shown in Table 1.

2.2. Sample Preparation

This research has analysed three kinds of cement mortars. In the first place, mortars made using a commercial ordinary Portland cement, designated CEM I 42.5 R (CEM I hereafter), according to the Spanish and European standard UNE-EN 197-1 [32], were prepared. Furthermore, mortars with waste glass powder were also studied. Those mortars were made with ordinary Portland cement, CEM I 42.5 R [32], which was partially replaced by 10% and 20% of glass powder. They are referred to as GP10 and GP20, respectively, from now on. All the mortars were prepared with a water:binder ratio of 0.5 and an aggregate:cement ratio of 3:1.
Both cylindrical and prismatic samples were made. The dimensions of the cylindrical ones were 10 cm in diameter and 15 cm in height, while they were 4 cm × 4 cm × 16 cm for prismatic samples [33]. After setting, both types of samples were kept in a chamber at 20 °C temperature and 95% relative humidity (RH) throughout their first 24 h. Once this period finished, they were de-moulded and the cylindrical specimens were cut to obtain samples of 1 cm and 5 cm in height. Finally, all the samples were maintained under optimum laboratory conditions (20°C and 100% RH) up to the testing stages.

2.3. Mercury Intrusion Porosimetry

The pore network of the mortars was characterised using the classical mercury intrusion porosimetry technique, despite its reported drawbacks [9,13,34,35]. The porosimeter used was a Poremaster-60 GT from Quantachrome Instruments (Boynton Beach, FL, USA). Before the test, specimens were dried in an oven at 50°C for 48 h. The analysed parameters were total porosity, pore size distribution, and percentage of Hg retained at the end of the experiment. The testing ages were 28, 100, 200, and 400 days.

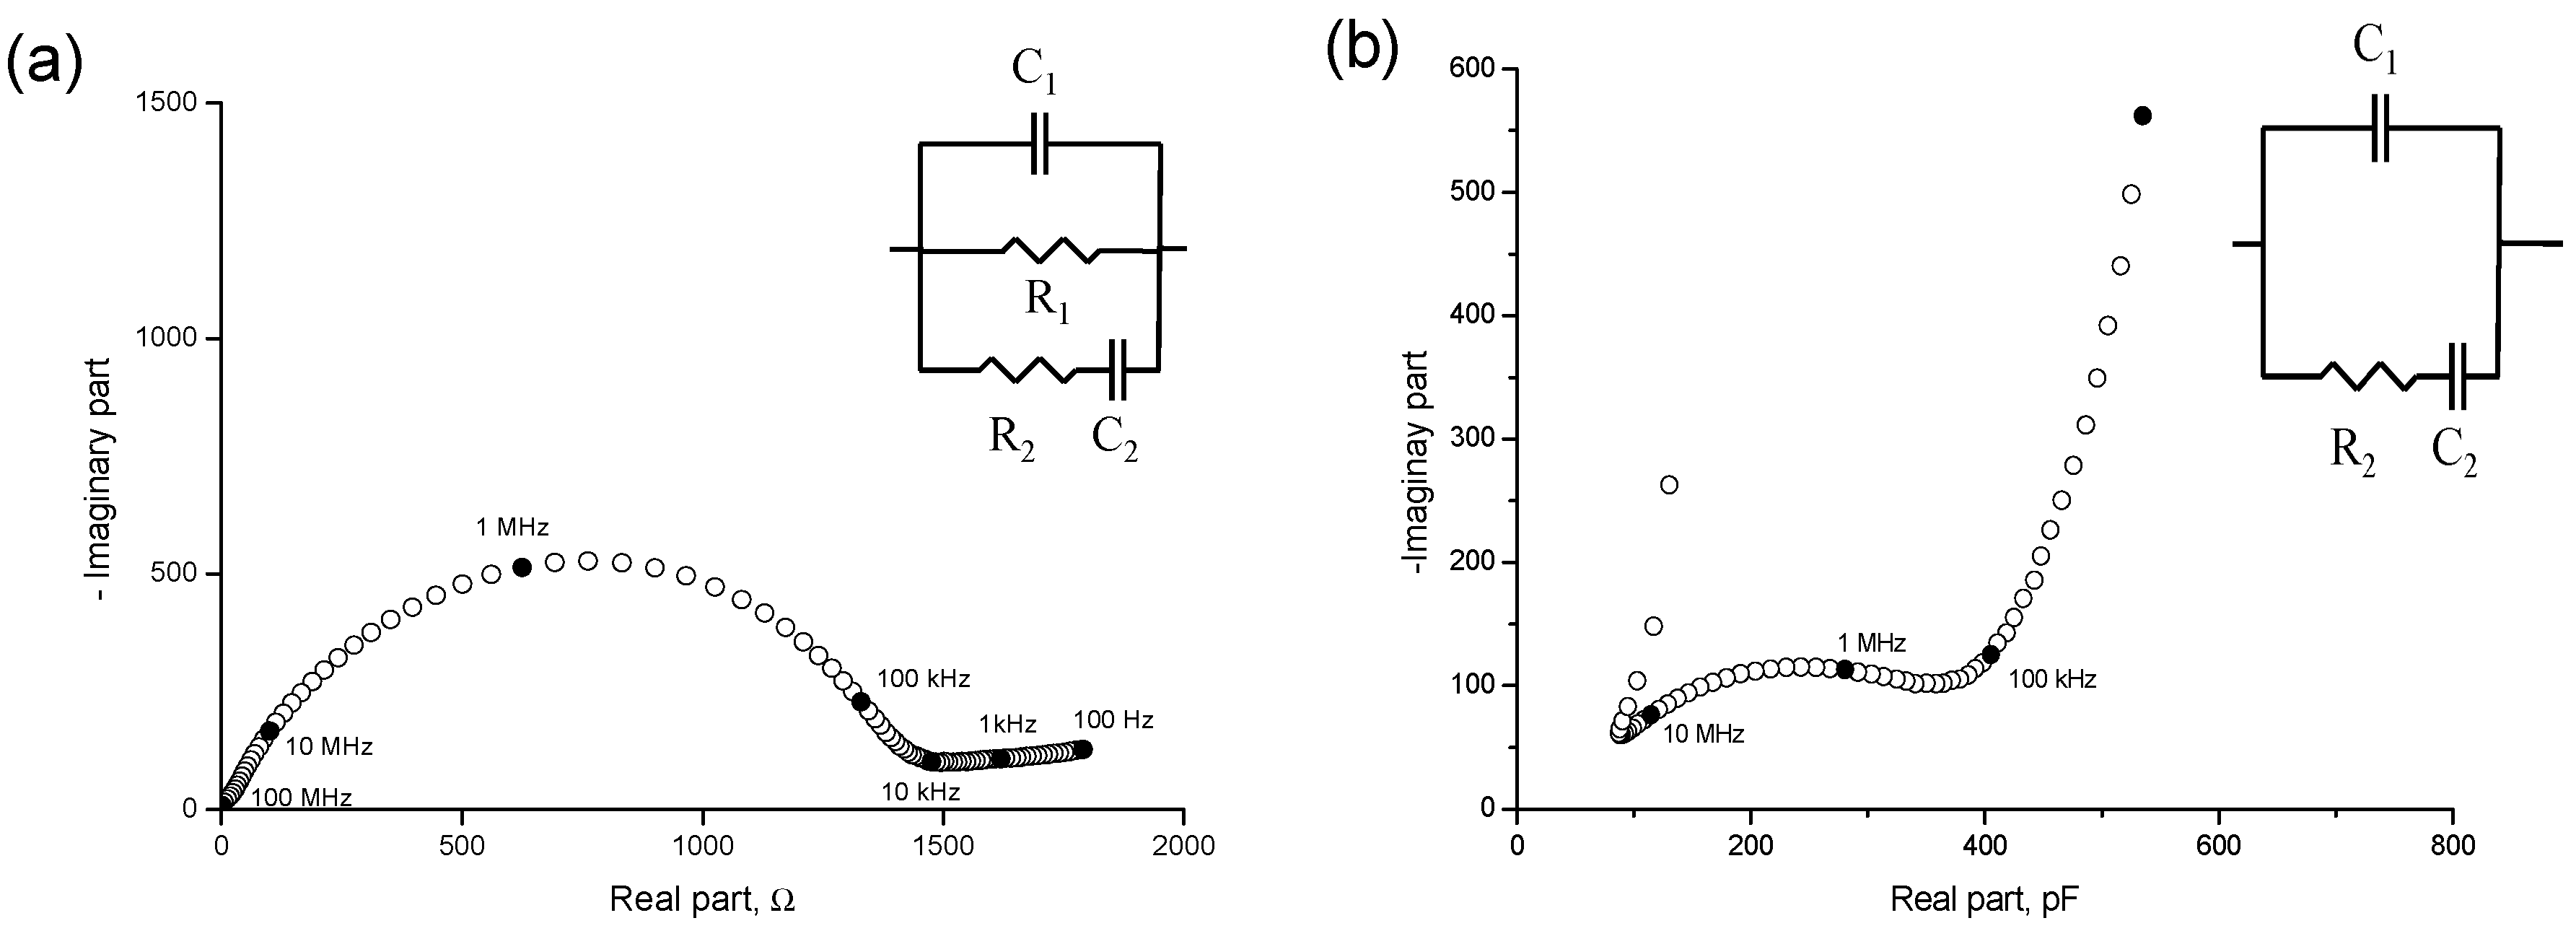
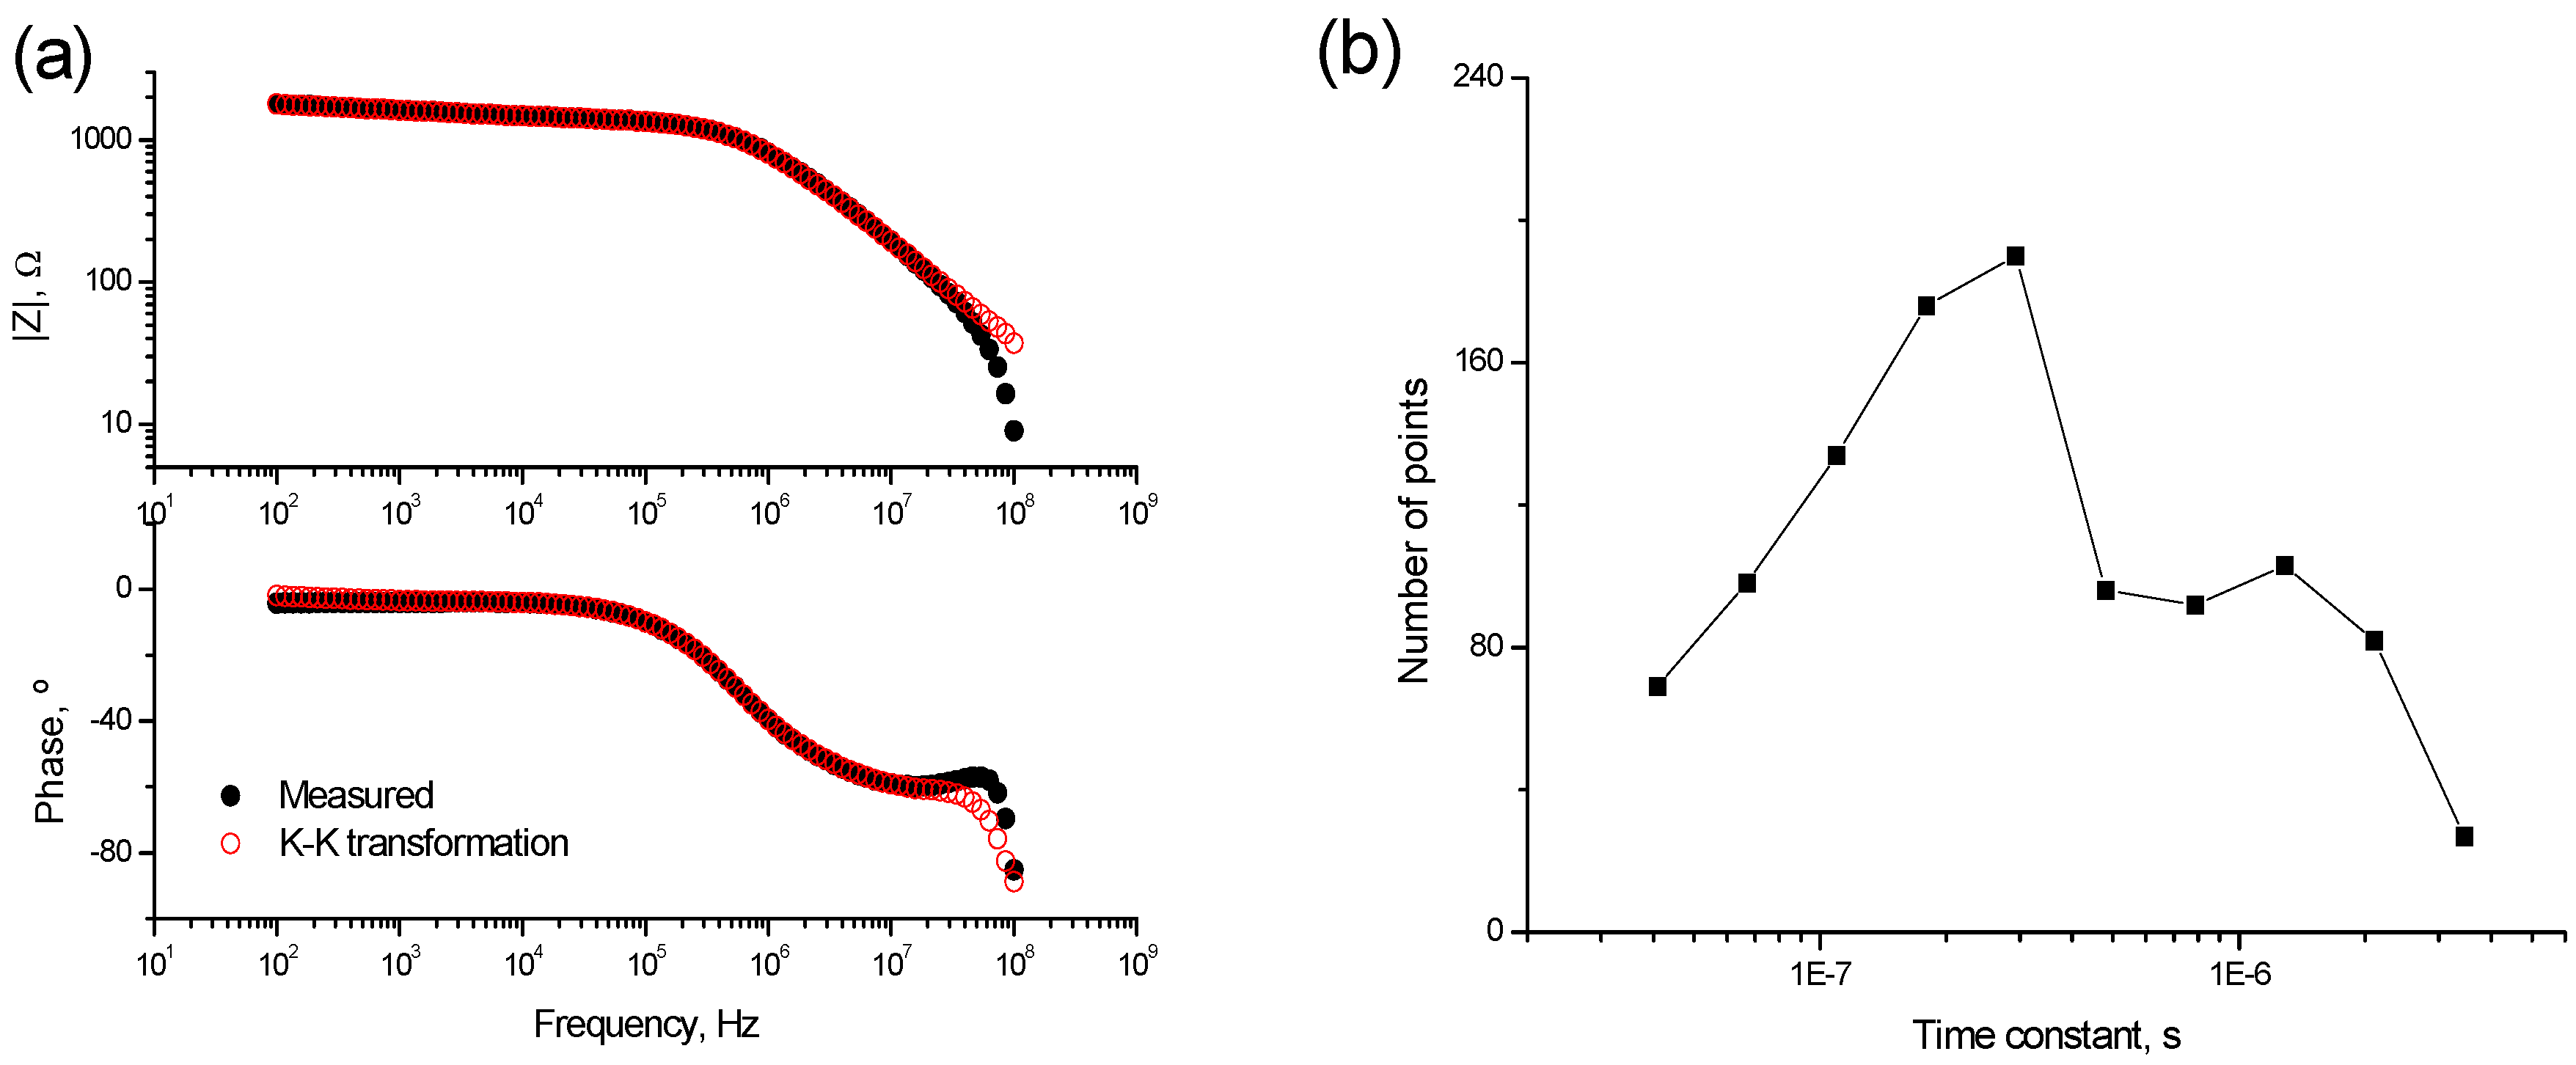
2.4. Impedance Spectroscopy

The changes with hardening age of the mortars’ microstructure have also been followed with the non-destructive impedance spectroscopy technique. Among the advantages of this technique compared to other classical ones, it is important to emphasise that the impedance spectroscopy permits to get global data of the microstructure of the samples [36]. Furthermore, it allows for registering the evolution of the pore network of the same sample along the analysed time period [28,31,37]. Lastly, there have been several published works [8,13,29,38] in which impedance spectroscopy has been used for studying the changes with age of the microstructure of cementitious materials with additions. Nevertheless, there is no research about using impedance spectroscopy for studying cement-based materials that incorporate waste glass powder as clinker replacement.
The impedance analyser used was an Agilent 4294A (Agilent Technologies, Kobe, Japan), which allows for capacitance measurements ranged between 10−14 F and 0.1 F, with a maximum resolution of 10−15 F. Here, the frequency range for the impedance spectra was 100 Hz to 100 MHz. The electrodes used for performing the measurements were circular (Ø = 8 cm) and made of flexible graphite, attached to a copper piece ofthe same diameter. Both contacting and non-contacting methods were used [36]. The impedance spectra were fitted to the equivalent circuits proposed by Cabeza et al. [36] (see Figure 5), which include two time constants. The different elements of those circuits are resistances and capacitances, which provide information about different aspects of the pore network of cementitious materials. In relation to the impedance resistances, R1 gives information only about the percolating pores of the sample, while R2 is associated with all its pores. Regarding the impedance capacitances, C1 provides data about the solid fraction of the specimen, whereas C2 is related to the pore surface in contact with the electrolyte that fills the pore network of the material.
The Kramers–Kronig (K–K) relations [39] (see Figure 6a) were used in order to validate the measurements. Moreover, the differential impedance analysis was applied to them (see Figure 6b) for checking the validity of the equivalent circuits used [36,40]. The impedance parameters R2, C1, and C2 are present in both contacting and non-contacting methods (see Figure 5); here, only their values obtained using the non-contacting method have been analysed because of the greater accuracy.
Eight different disks, 1 cm in height, were tested for each cement type. The evolution of impedance parameters over time has been reported after up to 400 days of hardening.

2.5. Differential Thermal Analysis

The differential thermal analysis was made with a simultaneous TG-DTA model TGA/SDTA851e/SF/1100 from Mettler Toledo (Columbus, OH, USA), which allows for working from room temperature up to 1100 °C. The selected heating ramp was 20 °C/min up to 1000 °C in N2 atmosphere. The weight derivate versus temperature curves were studied for each mortar type at 15 and 90 days of hardening.

2.6. Steady-State Diffusion Coefficient Obtained from Saturated Sample’s Resistivity

The electrical resistivity provides information about the pore connectivity of cementitious materials, and also allows for determining their steady-state chloride diffusion coefficient (DS) [41]. In this research, the resistivity was determined from the impedance spectroscopy resistance R1 values obtained in saturated cylindrical specimens of 10 cm diameter and 5 cm thickness. As has been detailed in Section 2.4, the impedance resistance R1 is related to pores that cross the sample [36], and, as a consequence, is equivalent to the electrical resistance of the sample [30]. The analysed specimens were saturated for 24 h according to ASTM Standard C1202 [42] and were used later for the forced migration tests. The steady-state ionic diffusion coefficient was calculated according to the expression [41]:
D S = 2 × 10 10 ρ ,
where Ds is the chloride steady-state diffusion coefficient through the sample (m2/s) and ρ is the electrical resistivity of the specimen (Ω·m).
For each cement type, three different samples were tested at 28, 200, and 400 hardening days.

2.7. Forced Migration Test

The forced chloride migration test was performed on water-saturated mortar samples, according to NT Build 492 [43]. The non-steady-state chloride migration coefficient DNTB was obtained from this test. For each cement type, three different cylindrical samples of 10 cm diameter and 5 cm thickness were tested at 28, 200, and 400 hardening days.

2.8. Mechanical Strength Test

The compressive and flexural strengths were determined according to the standard UNE-EN 196-1 [33]. Three different prismatic samples with dimensions 4 cm × 4 cm × 16 cm were tested for each cement type at 28, 200, and 400 hardening days.

3. Results

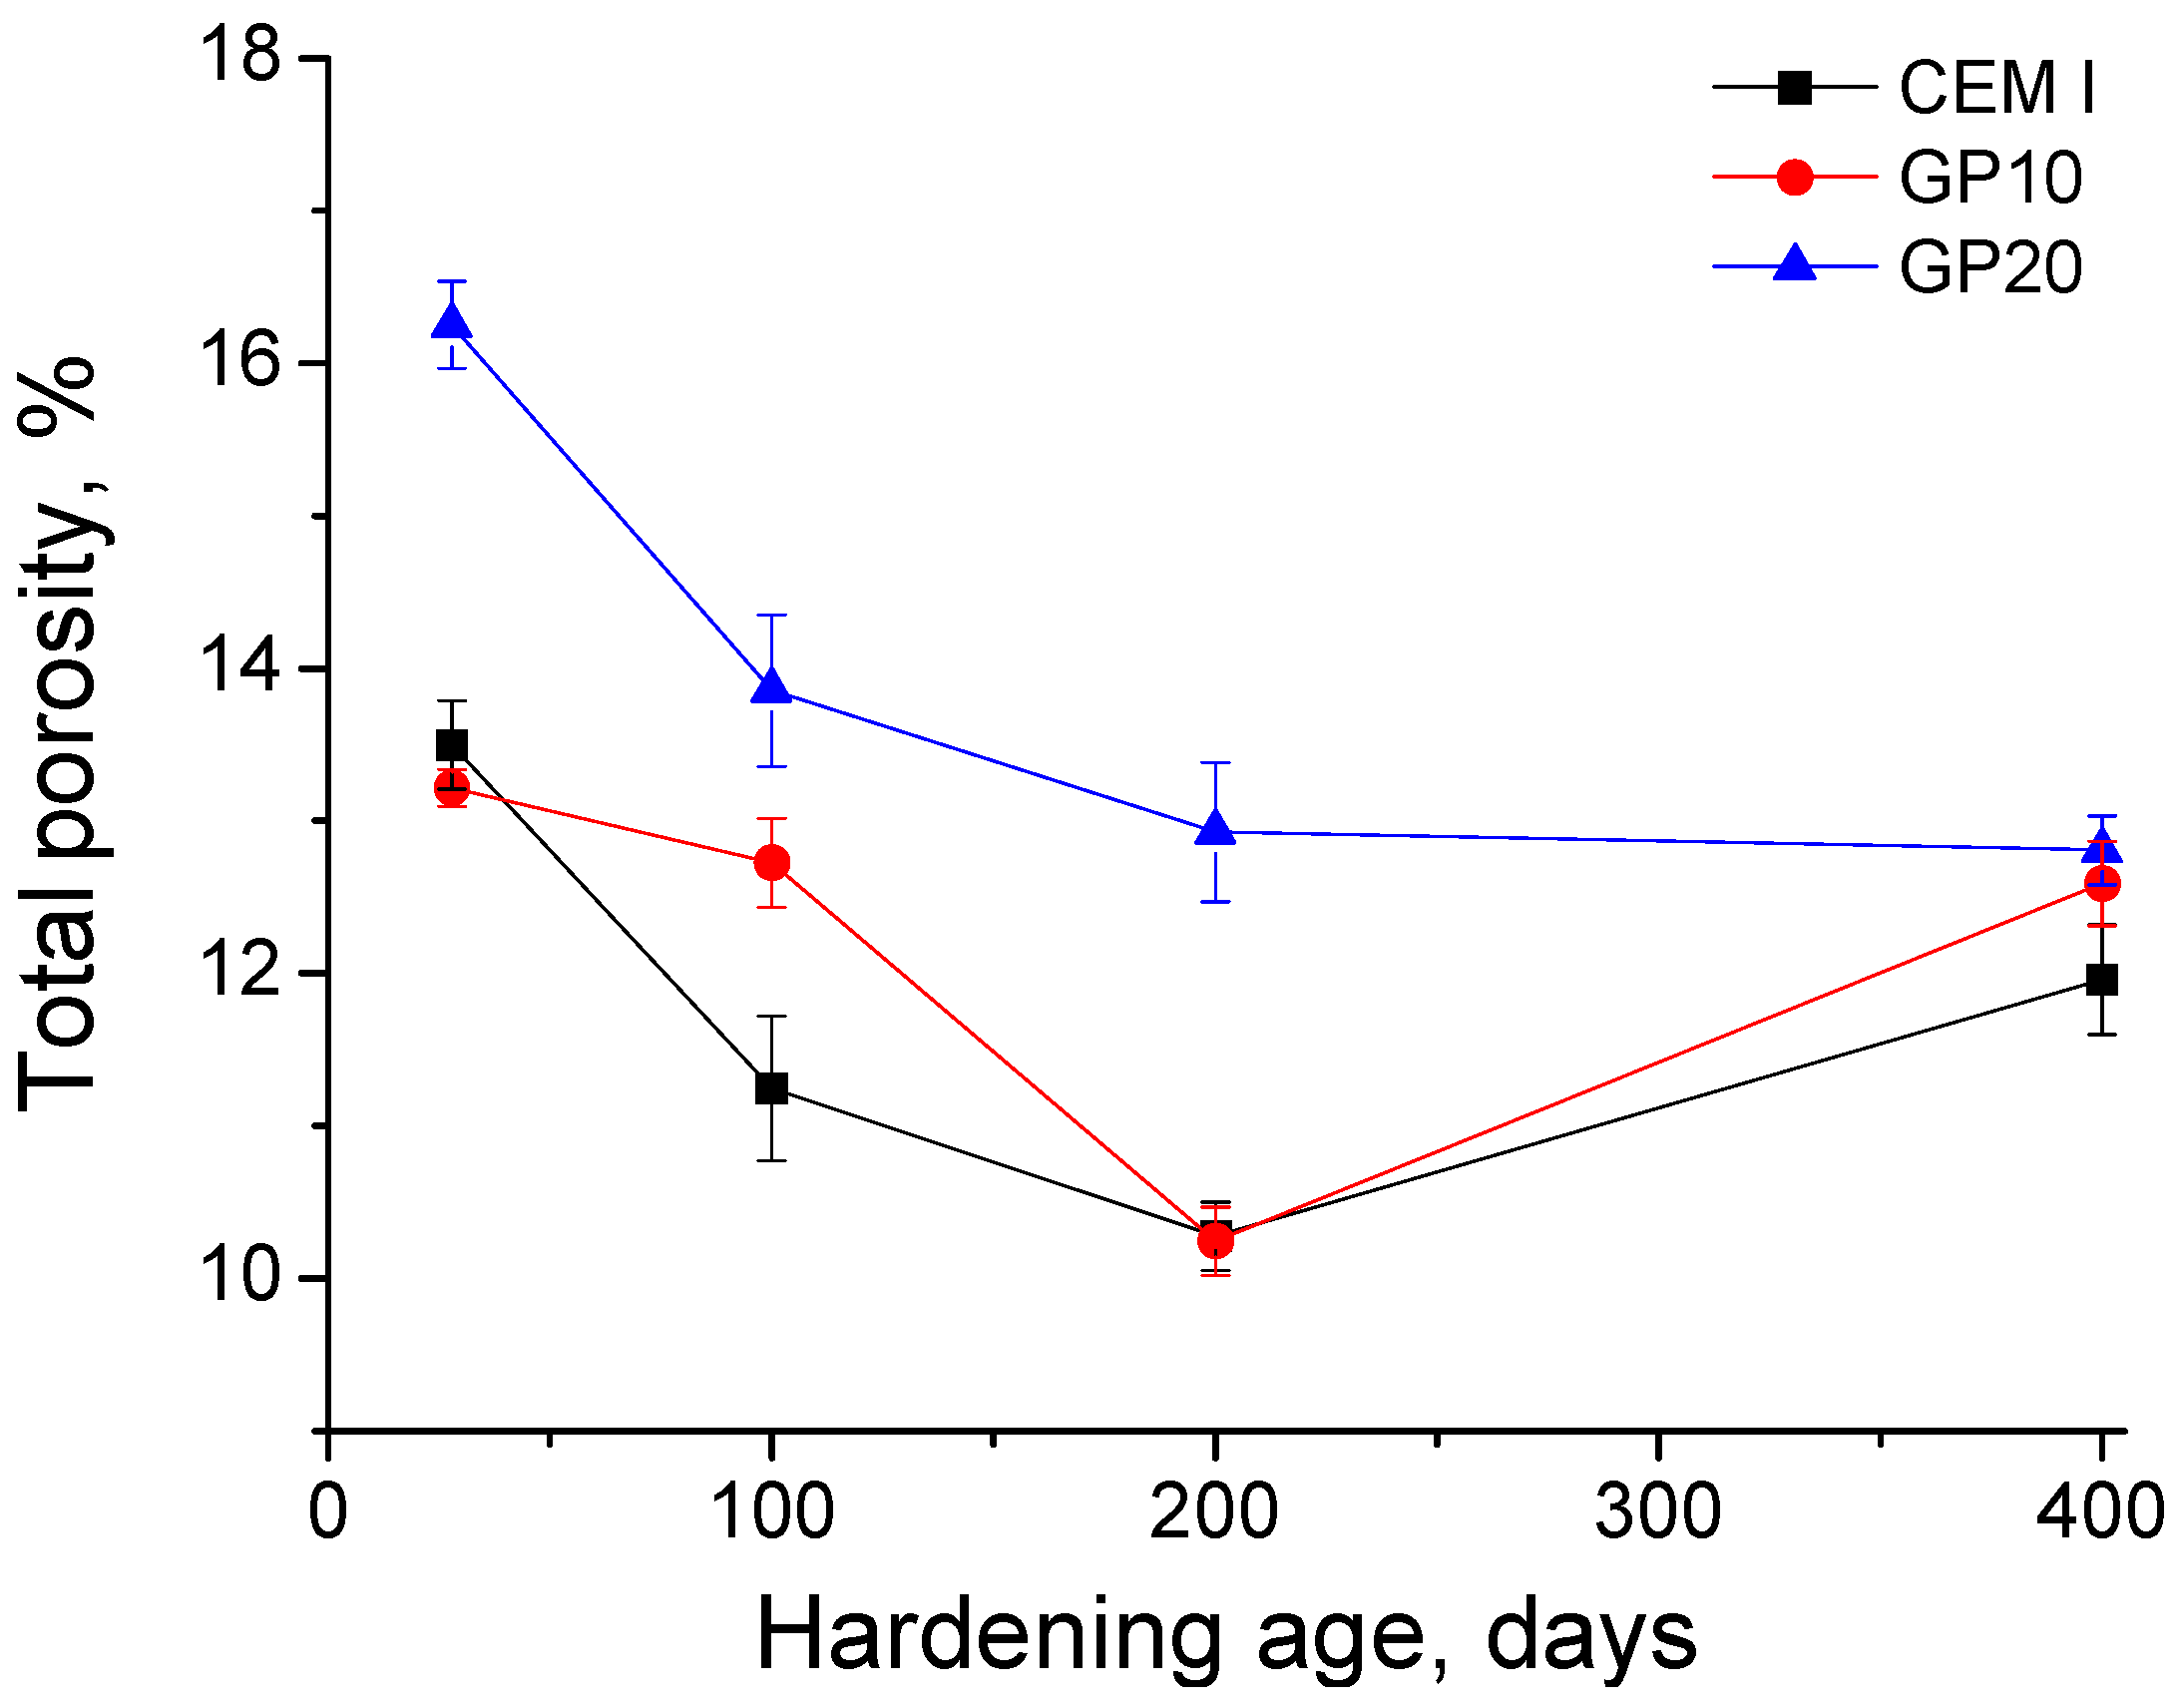
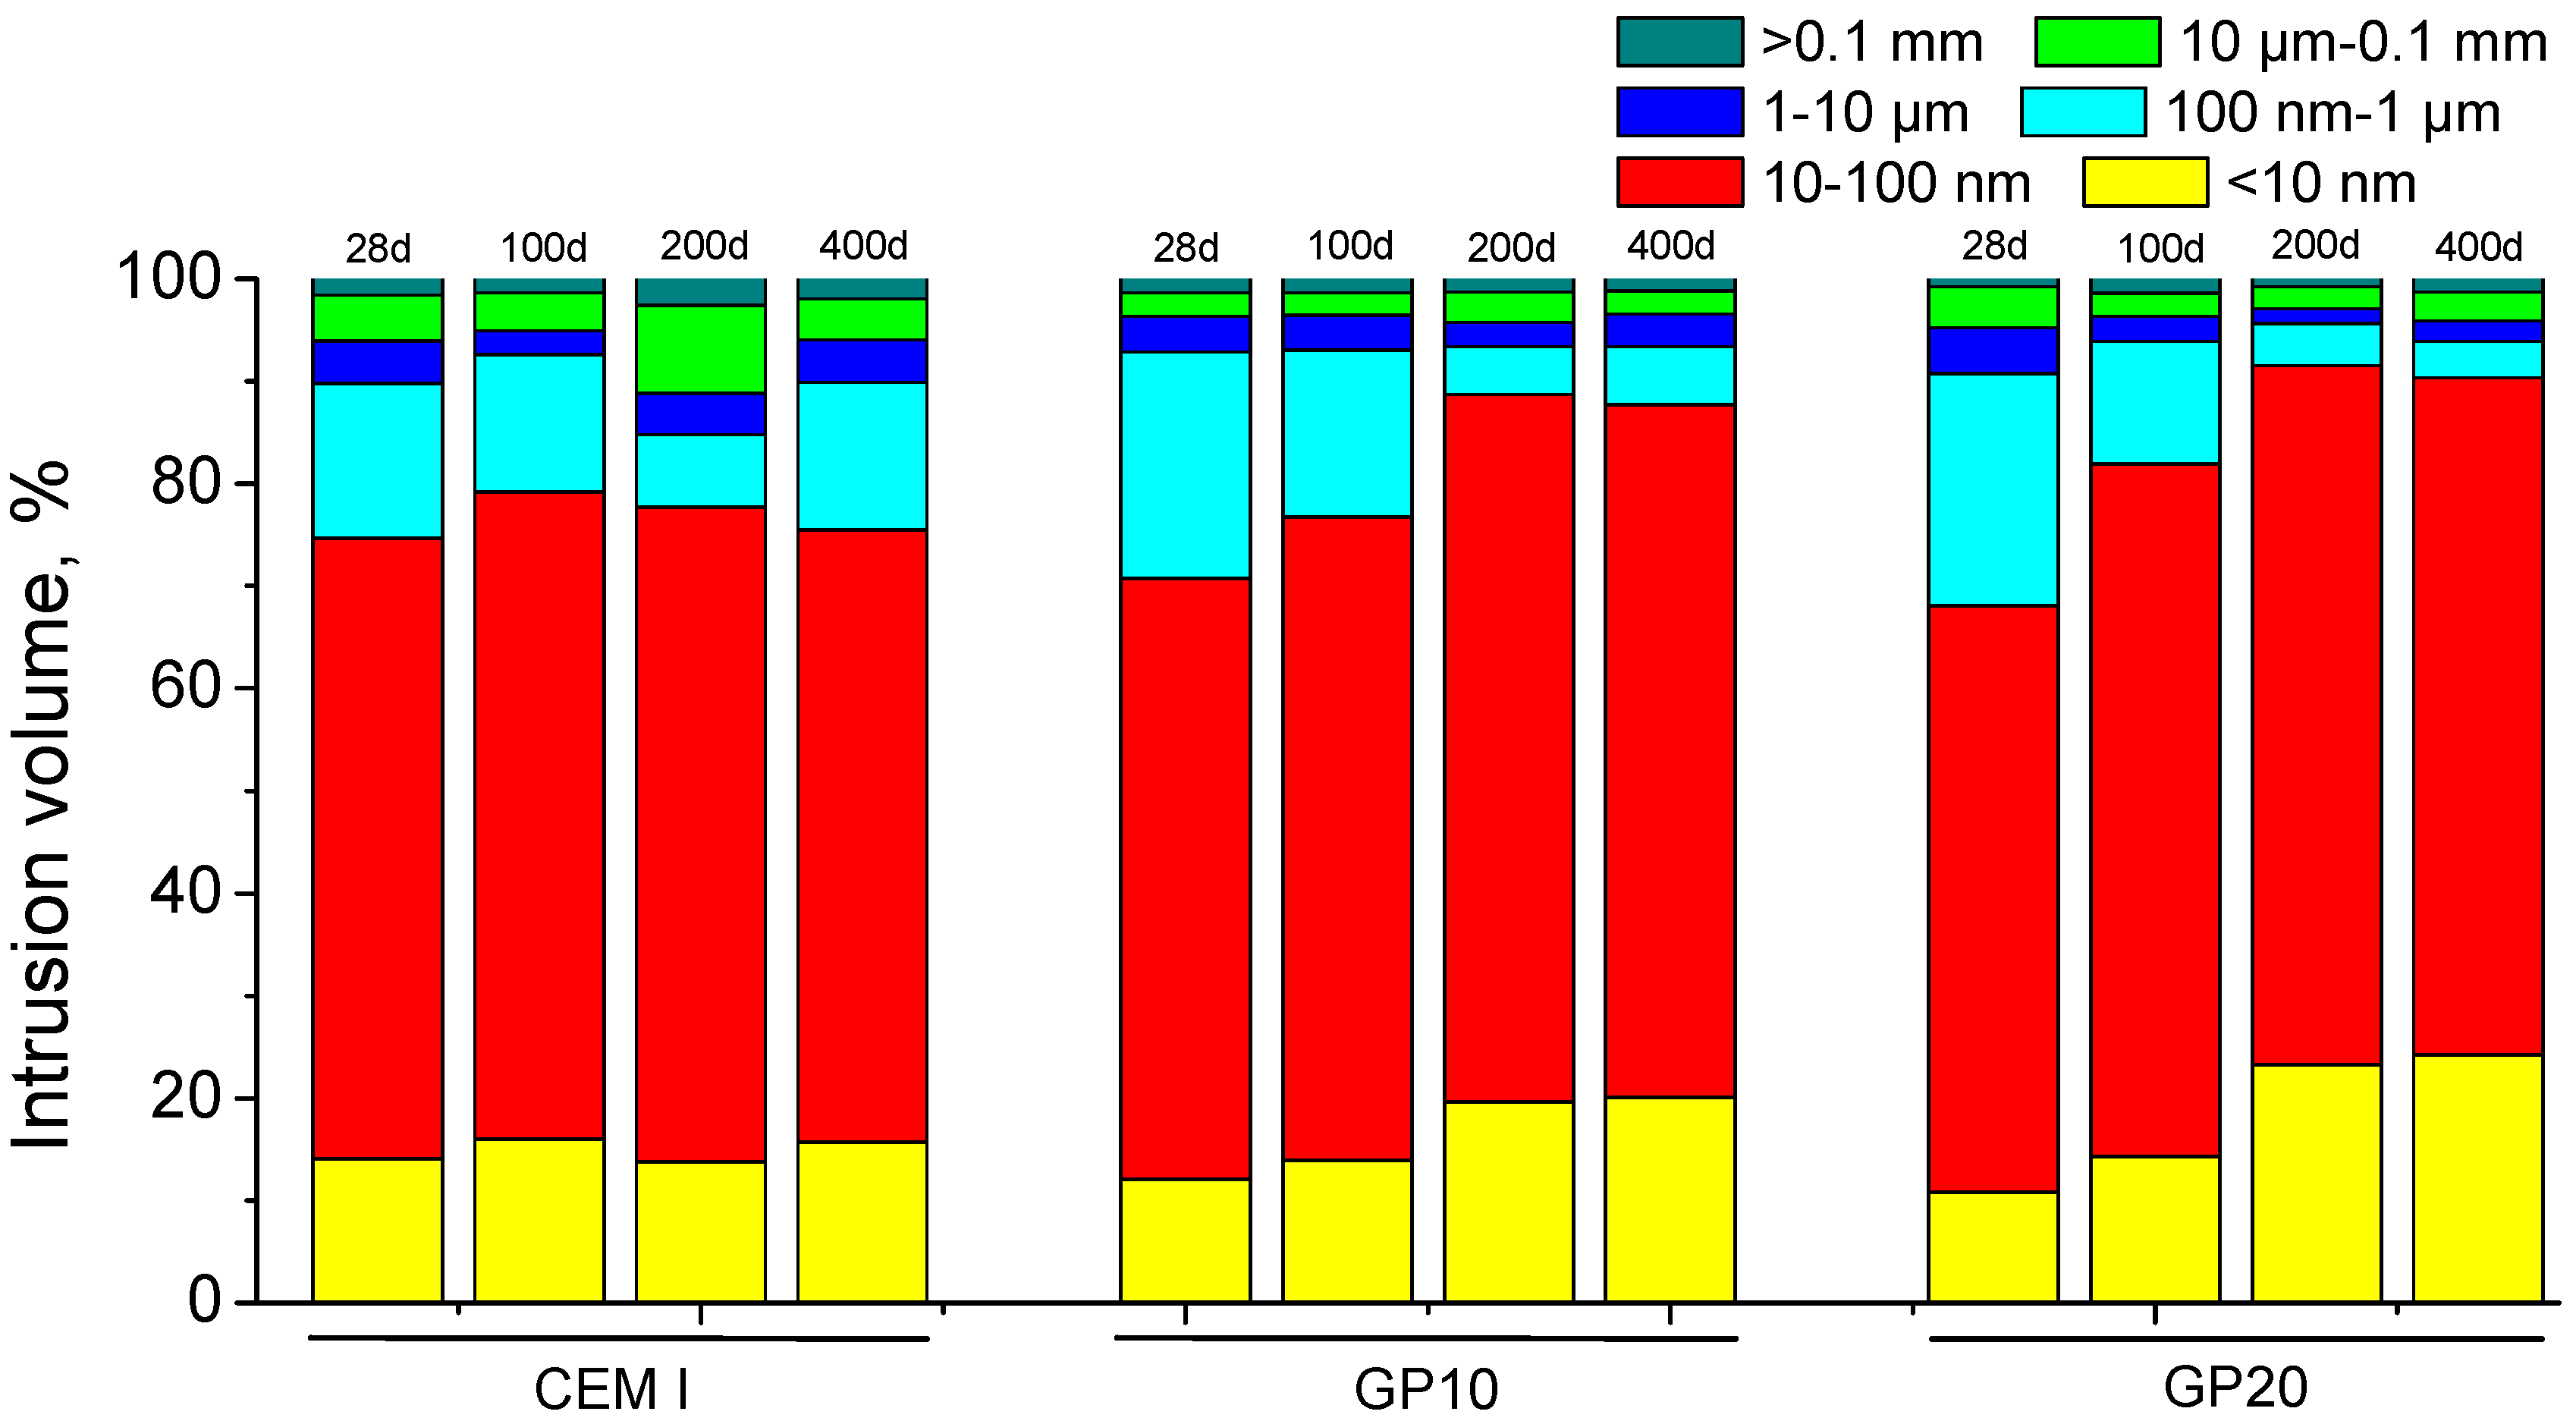
3.1. Mercury Intrusion Porosimetry

The results of total porosity for CEM I, GP10, and GP20 mortars can be observed in Figure 7. The porosity was reduced from 28 to 200 days for all the studied mortars and stayed nearly constant or rose slightly between then and 400 days depending on the mortar type. Until 200 days, the highest values of total porosity were noted for GP20 mortars, and they were similar for both CEM I and GP10 specimens, although the decreasing rate of this parameter was slower for GP10 ones. Despite that, there were only scarce total porosity differences after 400 hardening days for the three kinds of mortars studied.
The pore size distributions noted for the analysed samples are depicted in Figure 8. At 28 days, the microstructure was more refined for CEM I mortars compared to those with glass powder, as indicated by their higher relative volume of pores with sizes lower than 100 nm. However, the pore network of CEM I mortars hardly changed with time, while it became progressively more refined for GP10 and GP20 ones. Therefore, after 100 hardening days, the pore size distributions were very similar for all the studied mortars, and at 200 and 400 days the microstructure refinement was greater for specimens with glass powder, especially for GP20 ones.
The results of percentage of Hg retained in the samples at the end of the test are shown in Figure 9. In general, for all the studied mortars, this parameter increased with age up to 200 days and stayed practically constant or hardly decreased from then to 400 days. At 28 days, the greatest Hg retained values corresponded to CEM I mortars, although in the middle and long term, they were similar for all the studied mortars, or even slightly higher for the waste glass powder ones.

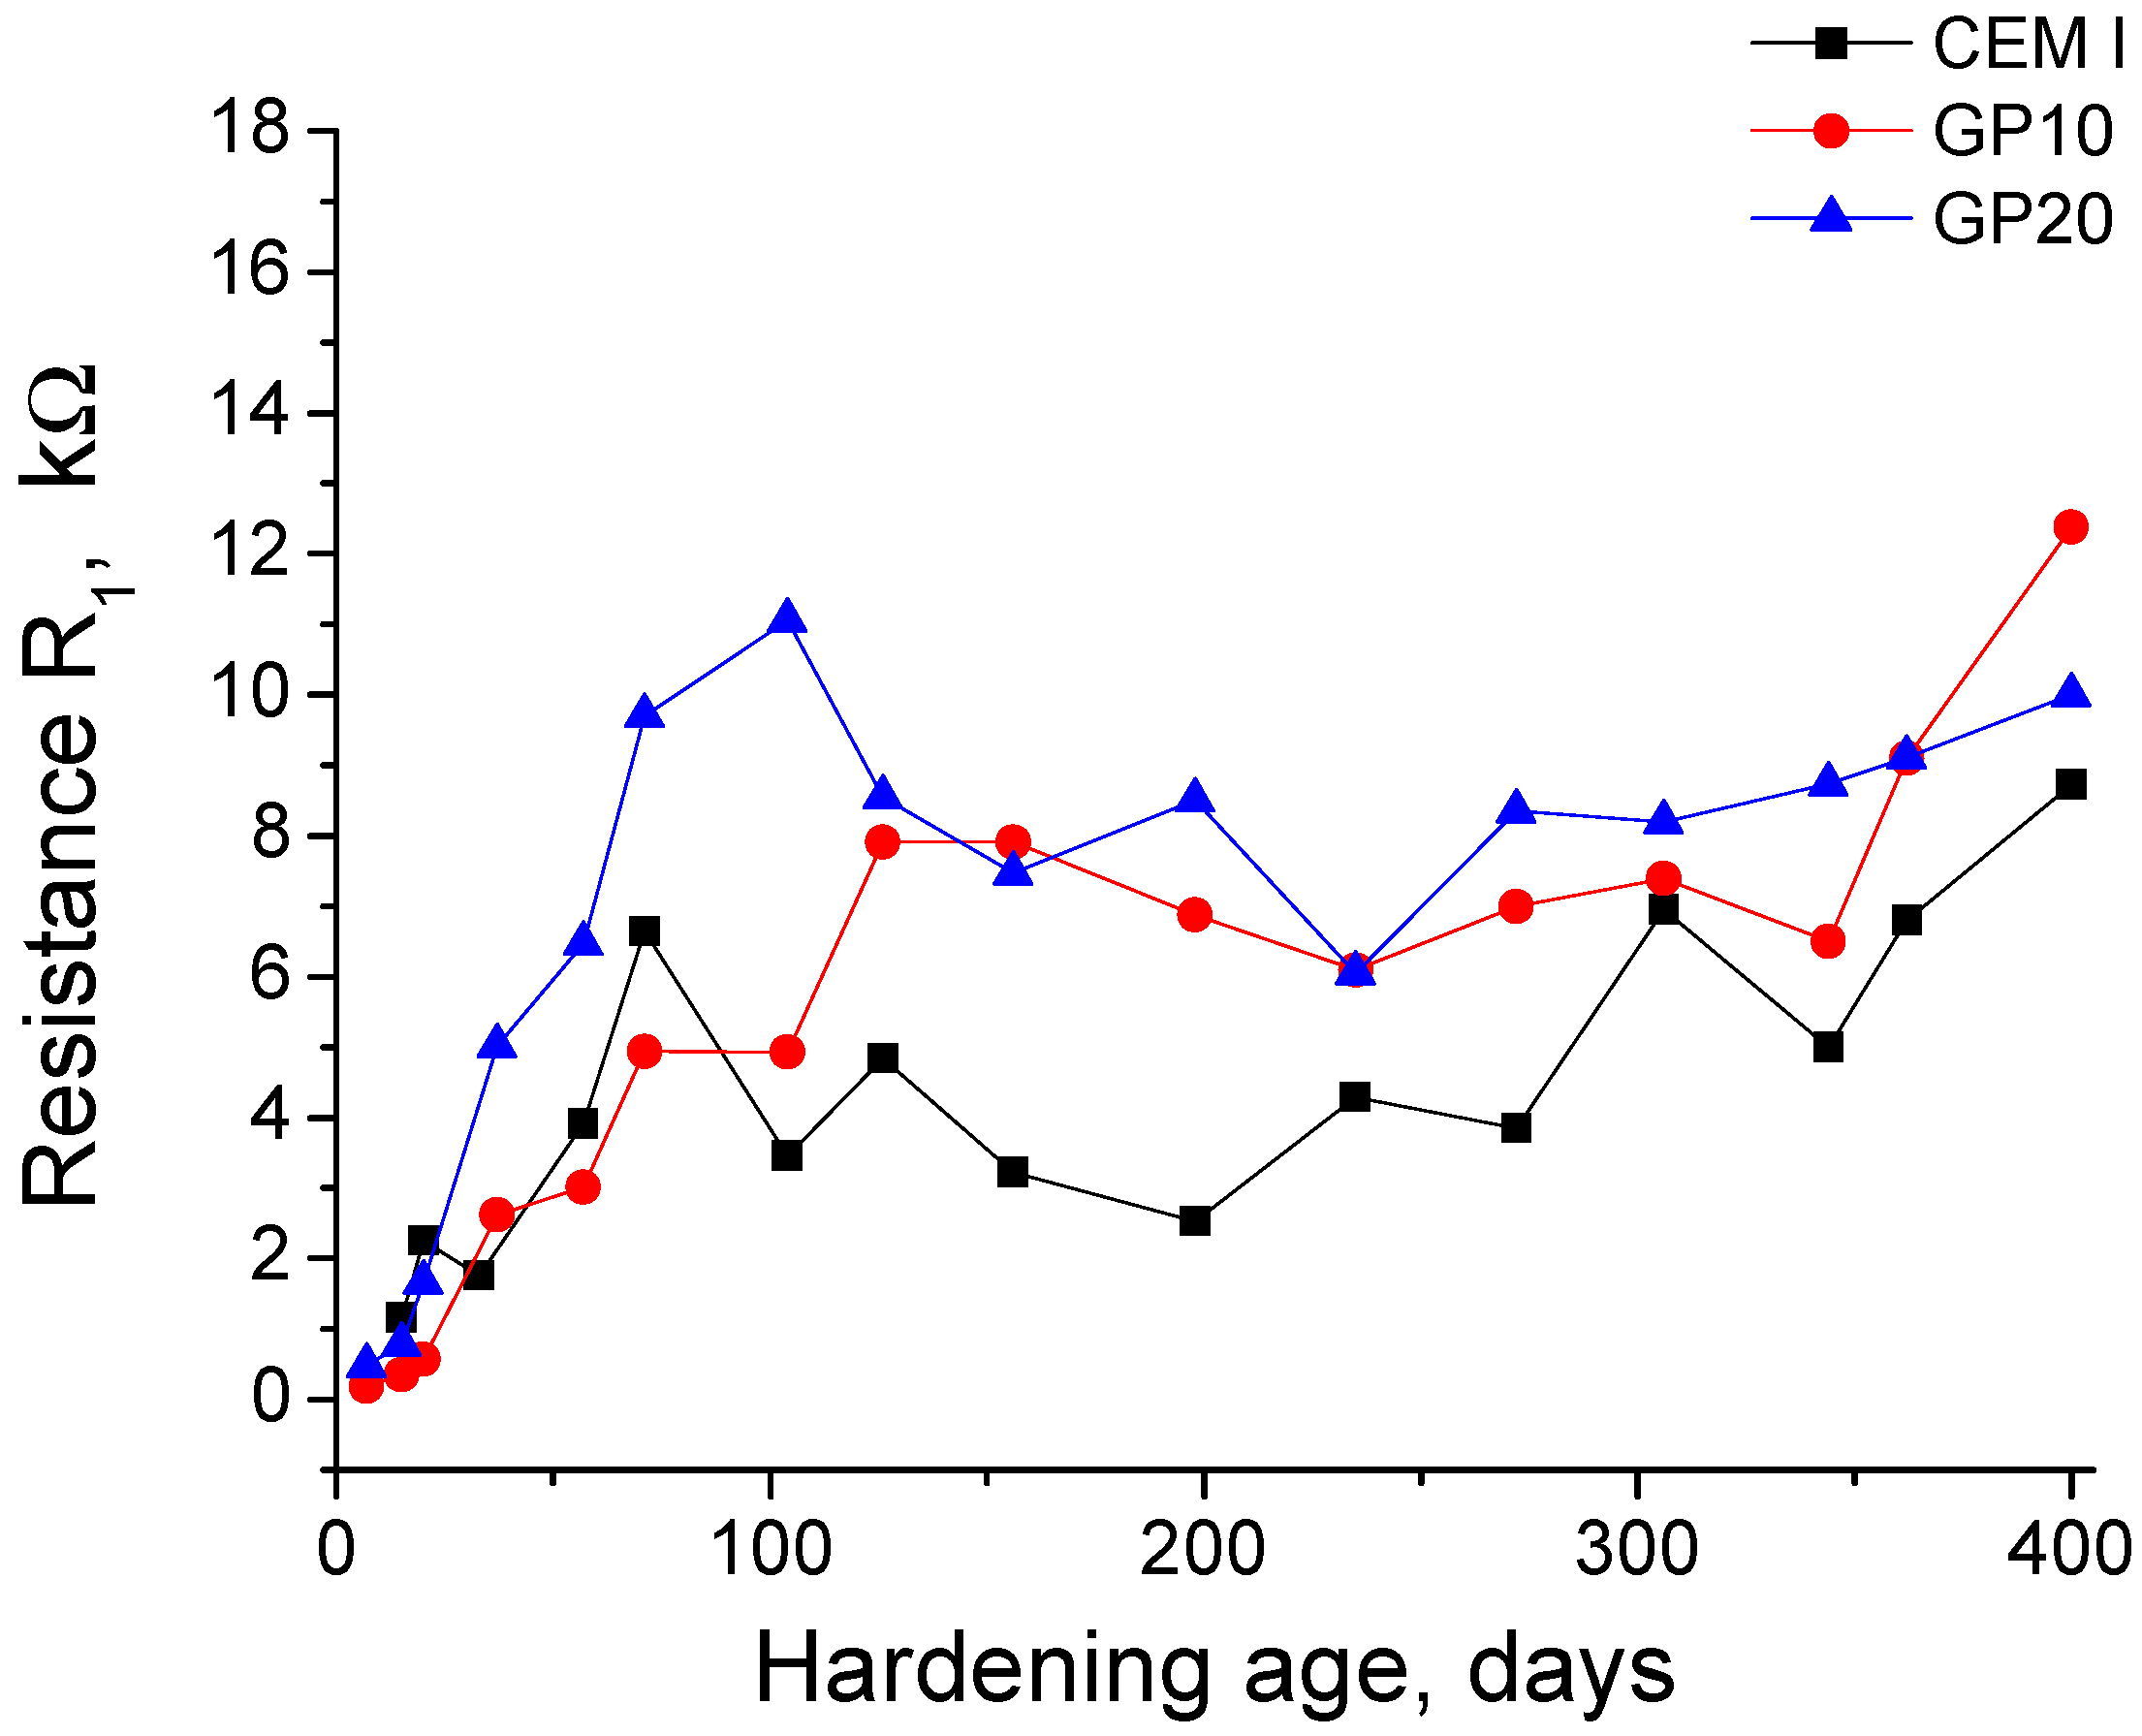
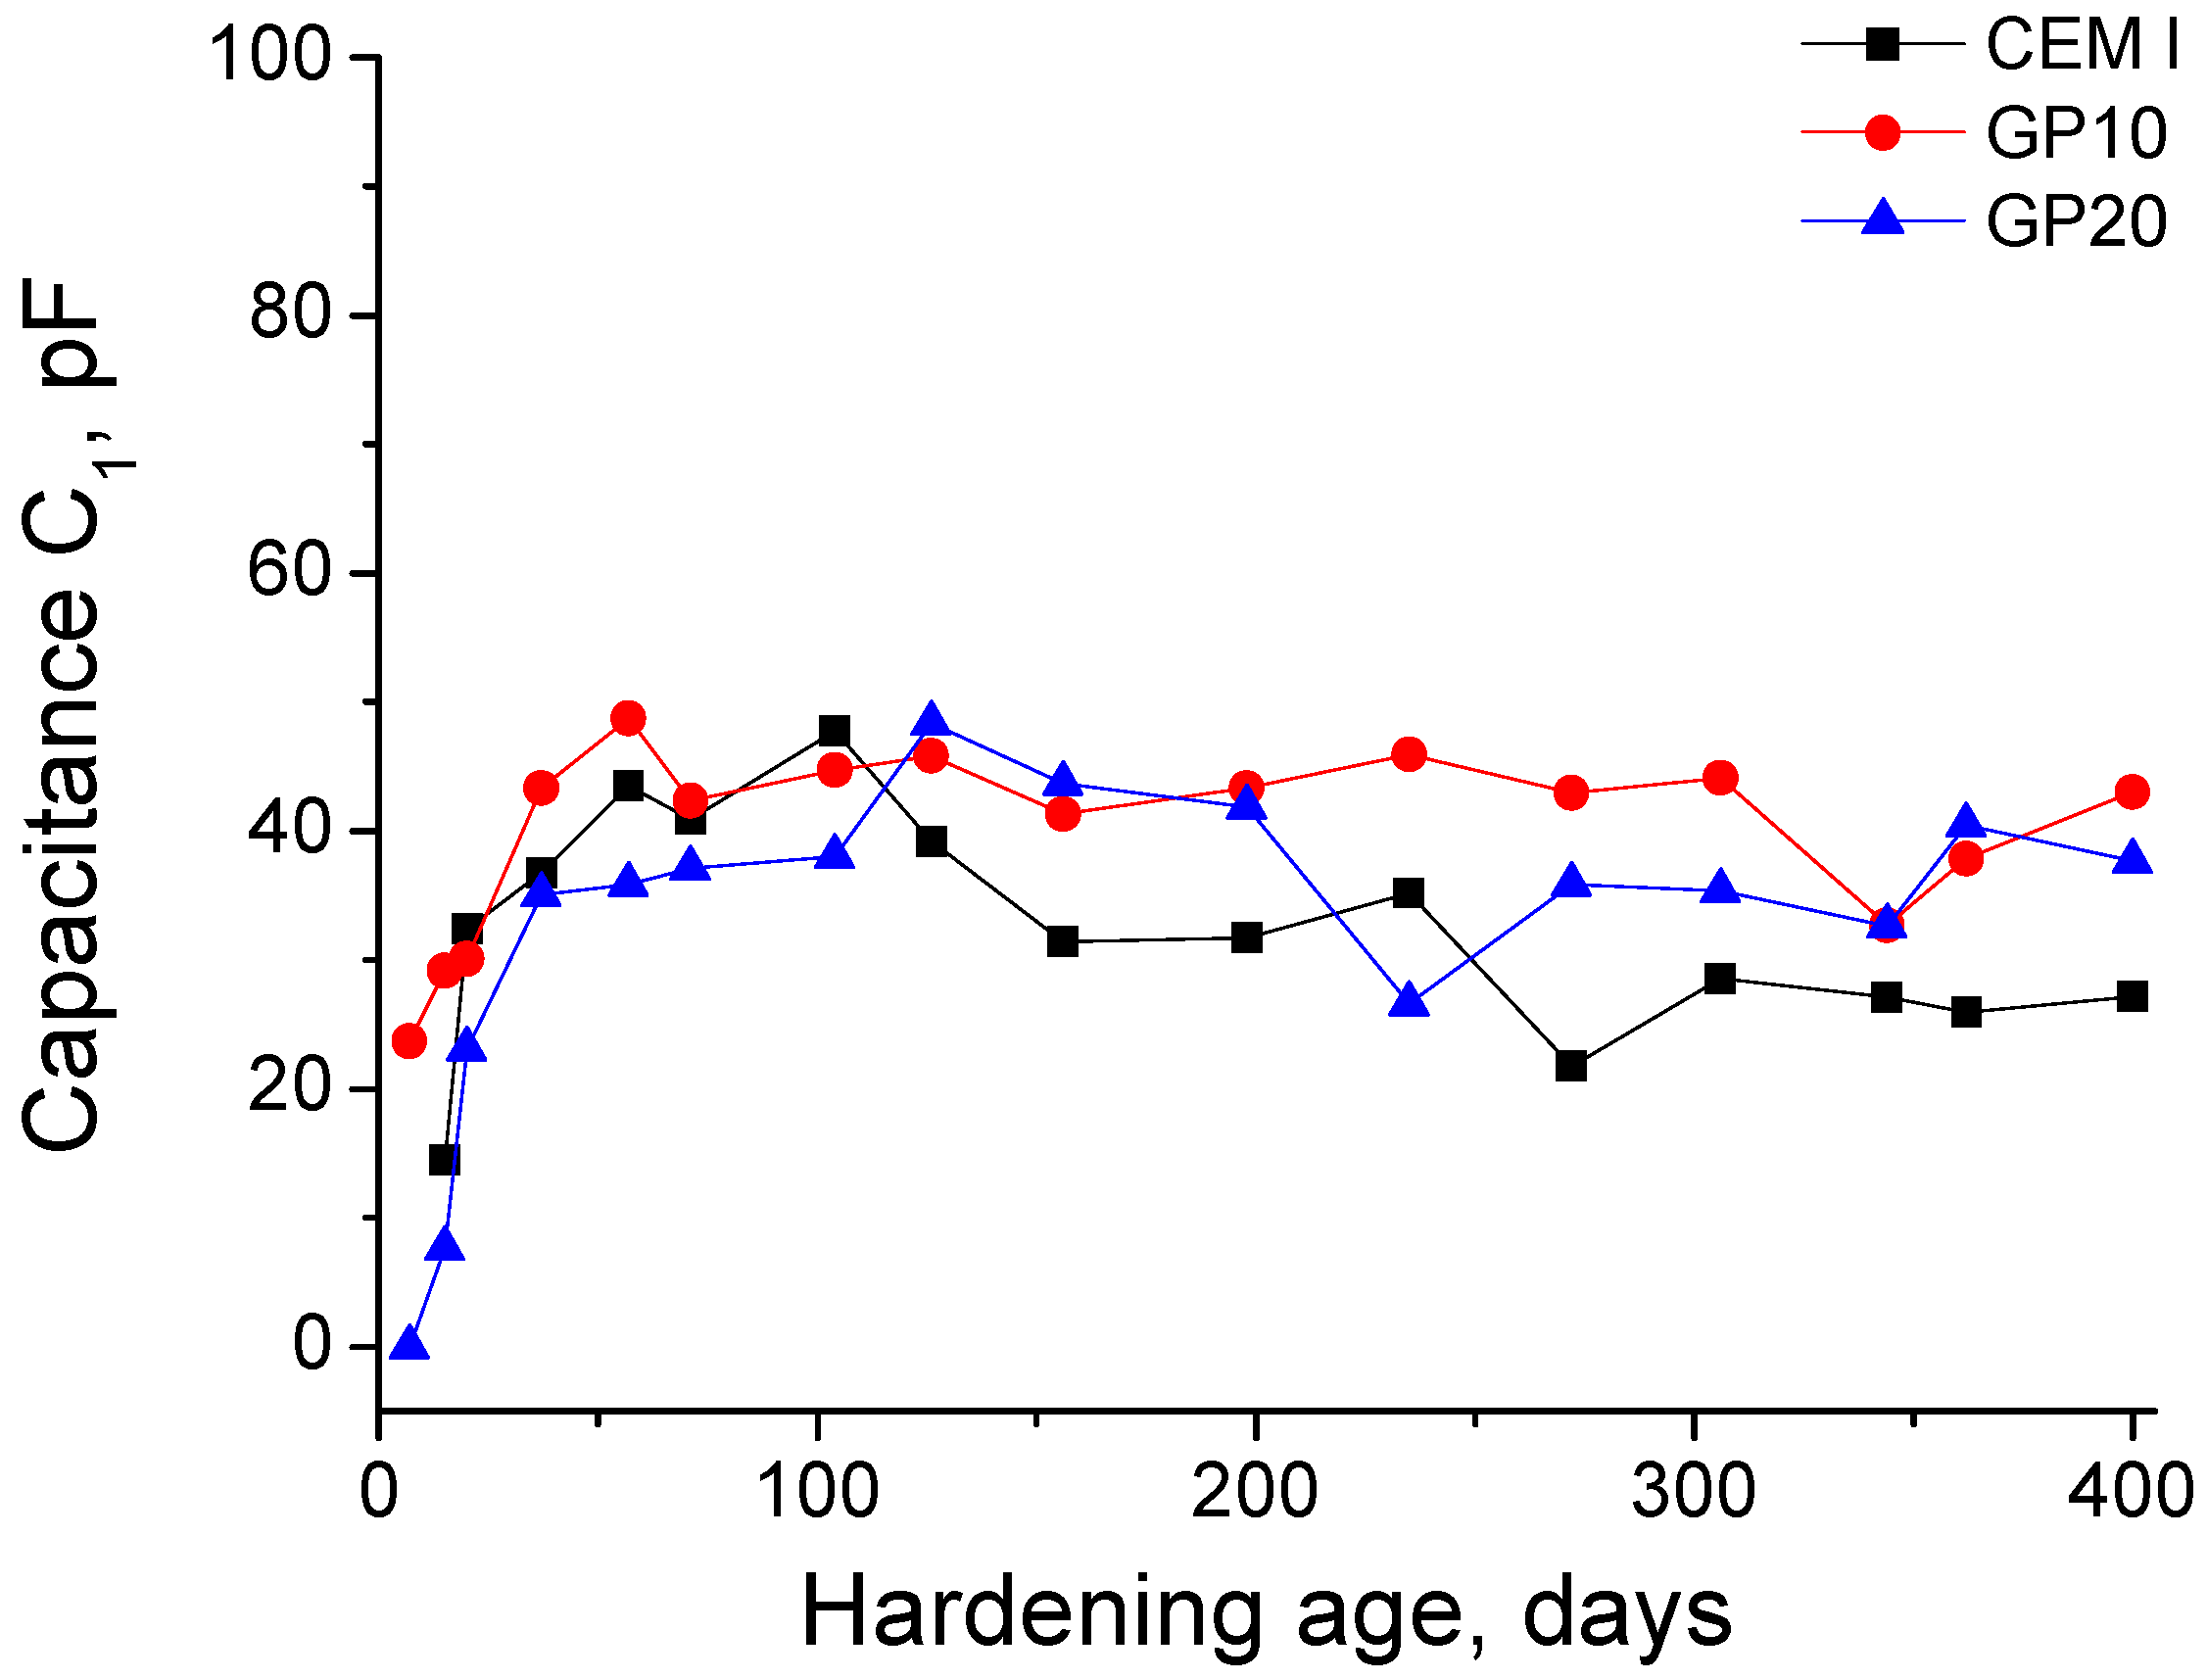
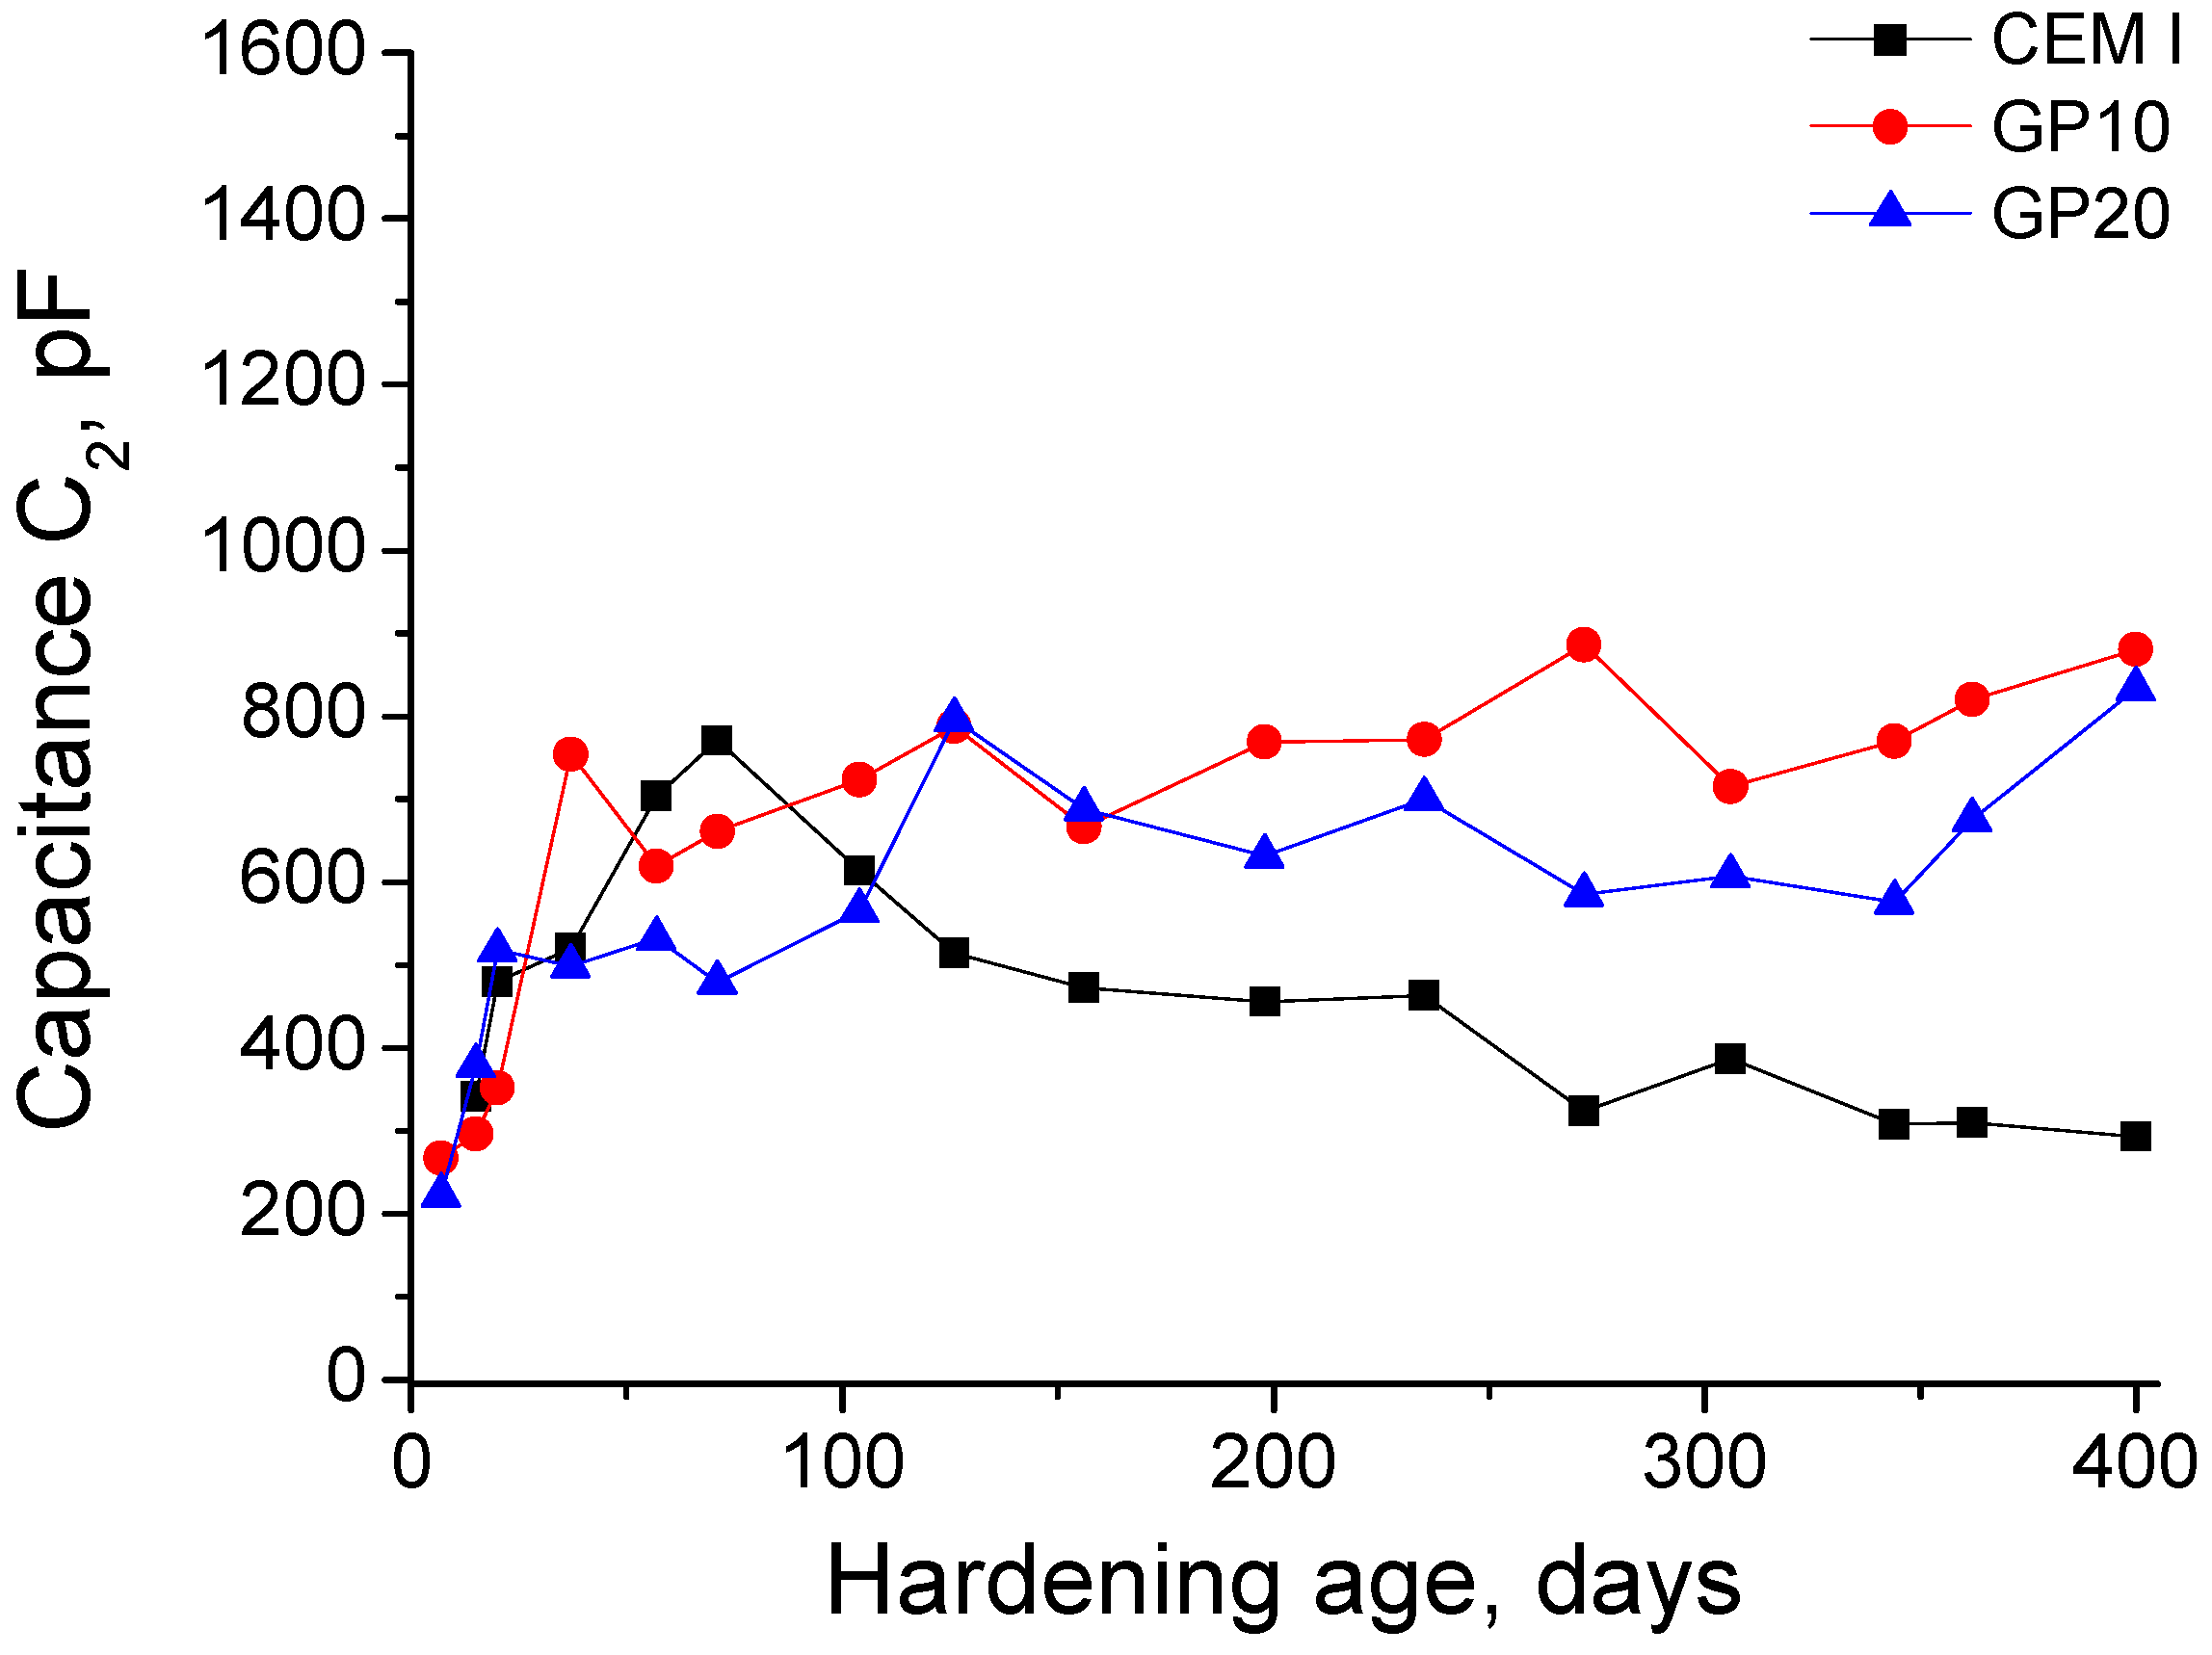
3.2. Impedance Spectroscopy

The results of resistance R1 are depicted in Figure 10. This parameter increased with time for the studied mortars. In the very short term, this parameter was scarcely higher for CEM I samples. Nevertheless, the rising rate of the resistance R1 was greater for mortars with glass powder. Therefore, since 30 days the highest R1 values corresponded to GP20 samples, while they were very similar for CEM I and GP10 until 100 days, when the growth of this parameter slowed down for CEM I mortars. From approximately 150 days, the resistance R1 hardly showed differences between mortars with glass powder, whose values were higher compared to CEM I ones.
In relation to resistance R2, its evolution can be observed in Figure 11. At very early stages, this resistance was very similar for all the studied samples. However, as happened with resistance R1, the increasing rate of R2 was higher for glass powder mortars in comparison with CEM I ones. As a consequence, since approximately 50 days, the greatest R2 values were noted for GP20 mortars, followed by GP10 ones, whereas the lowest resistances R2 corresponded to CEM I specimens, which hardly changed with time.
The evolution of capacitance C1 is depicted in Figure 12. This parameter was generally similar for the three kinds of mortars analysed. This capacitance increased quickly at the early stages, although it hardly changed from approximately 80 days. In the short term, the lowest capacitances C1 were noted for GP20 mortars. However, from 120 days the values of this parameter were slightly higher for mortars with glass powder compared to CEM I ones.
The evolution of capacitance C2 is shown in Figure 13. This parameter mainly rose until 100 days for CEM I mortars and up to approximately 150 days for those with glass powder. Until 100 days the values of this capacitance were very similar for CEM I and GP10 mortars, while they were lower for GP20 ones. Since 150 days, the capacitance C2 rose slightly for GP10 and GP20 mortars and hardly changed for CEM I ones. In the middle and long term, this parameter was greater for glass powder mortars.

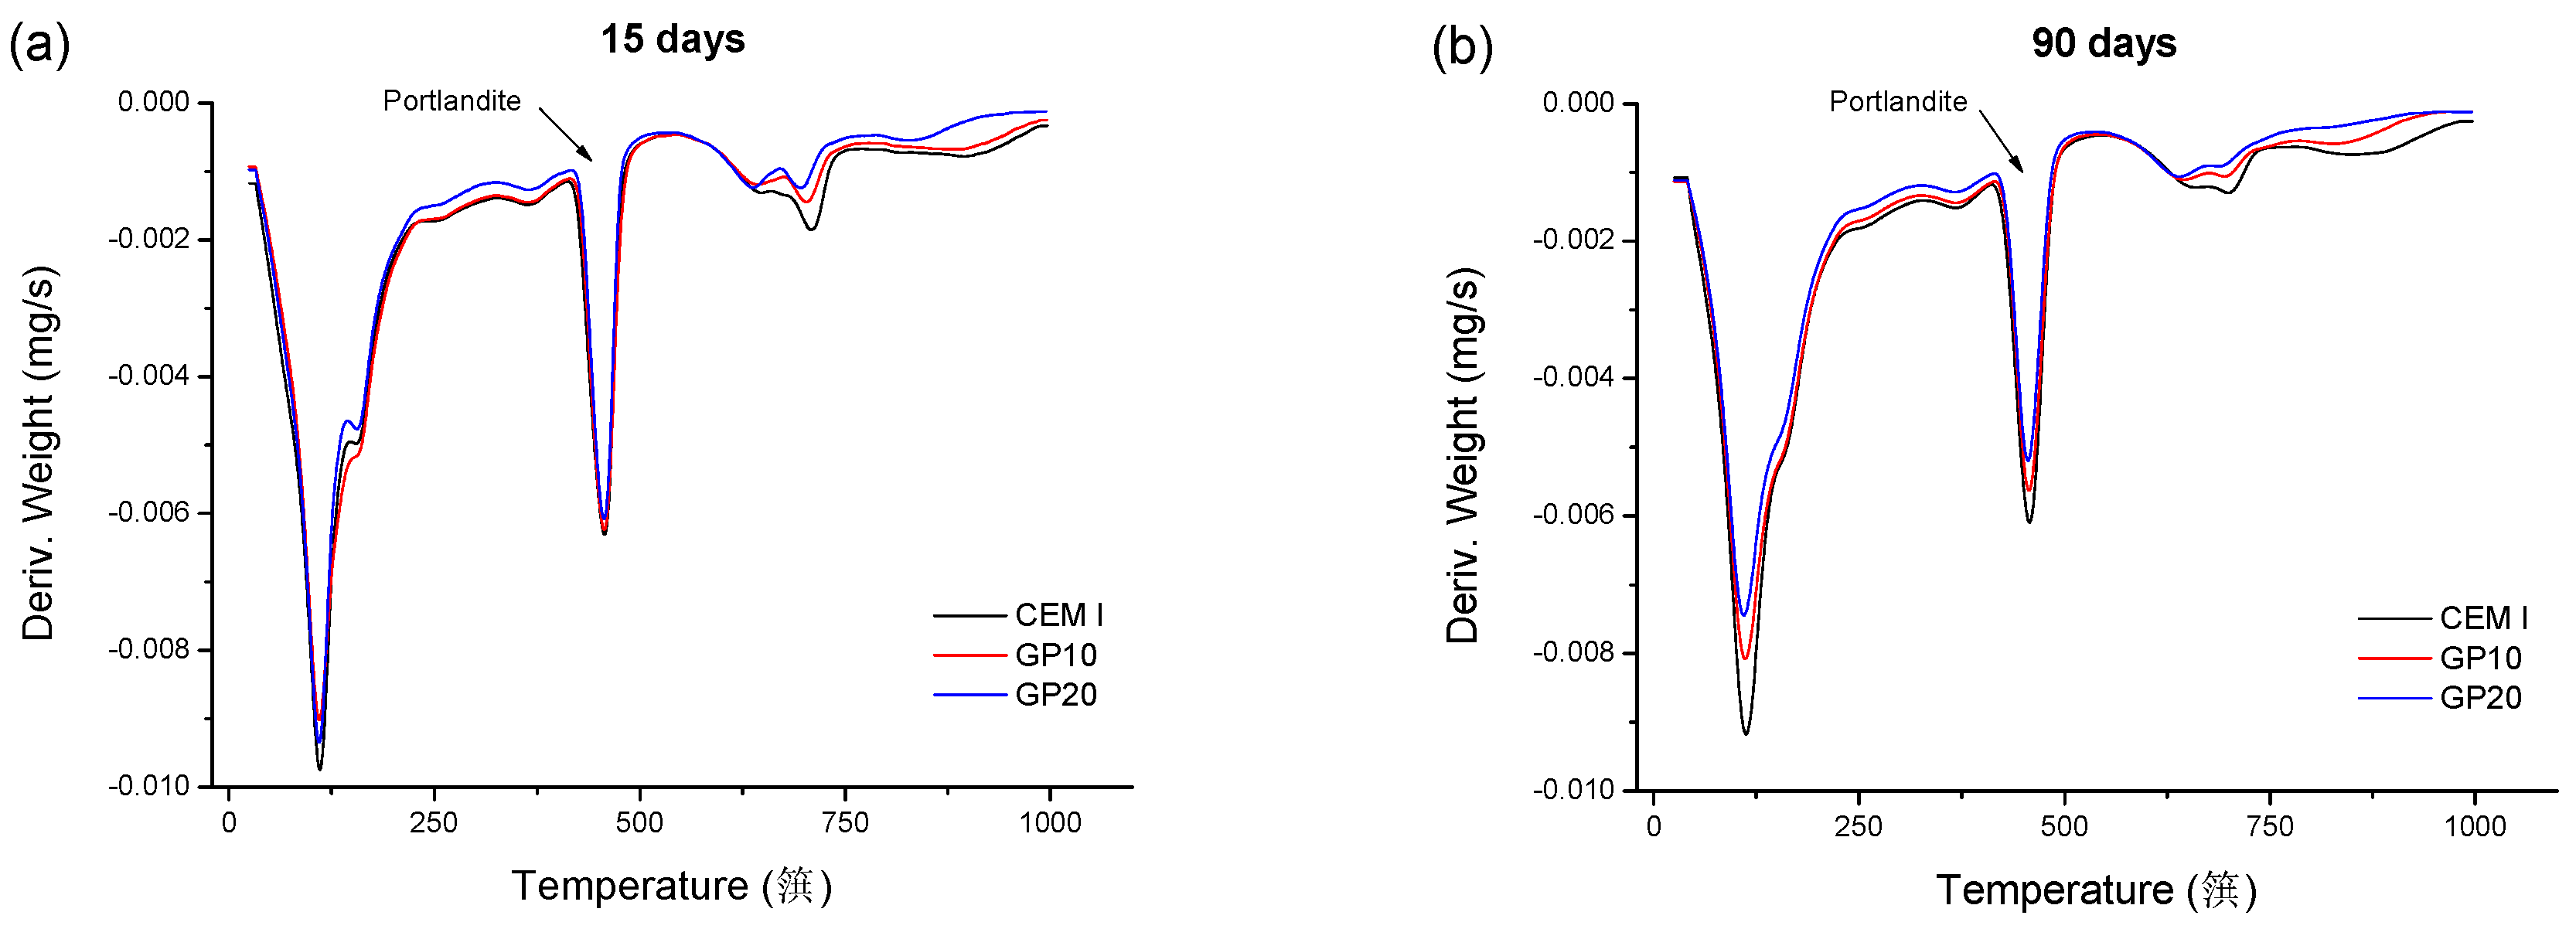
3.3. Differential Thermal Analysis

The derivate of weight versus temperature curves obtained for the studied mortars at 15 and 90 hardening days are shown in Figure 14. The area of Portlandite peak of this curve was similar for all the studied mortars at 15 days, as can be observed in Figure 14a. Nevertheless, at 90 days (see Figure 14b) this area was lower for mortars with waste glass powder, especially for GP20 ones.

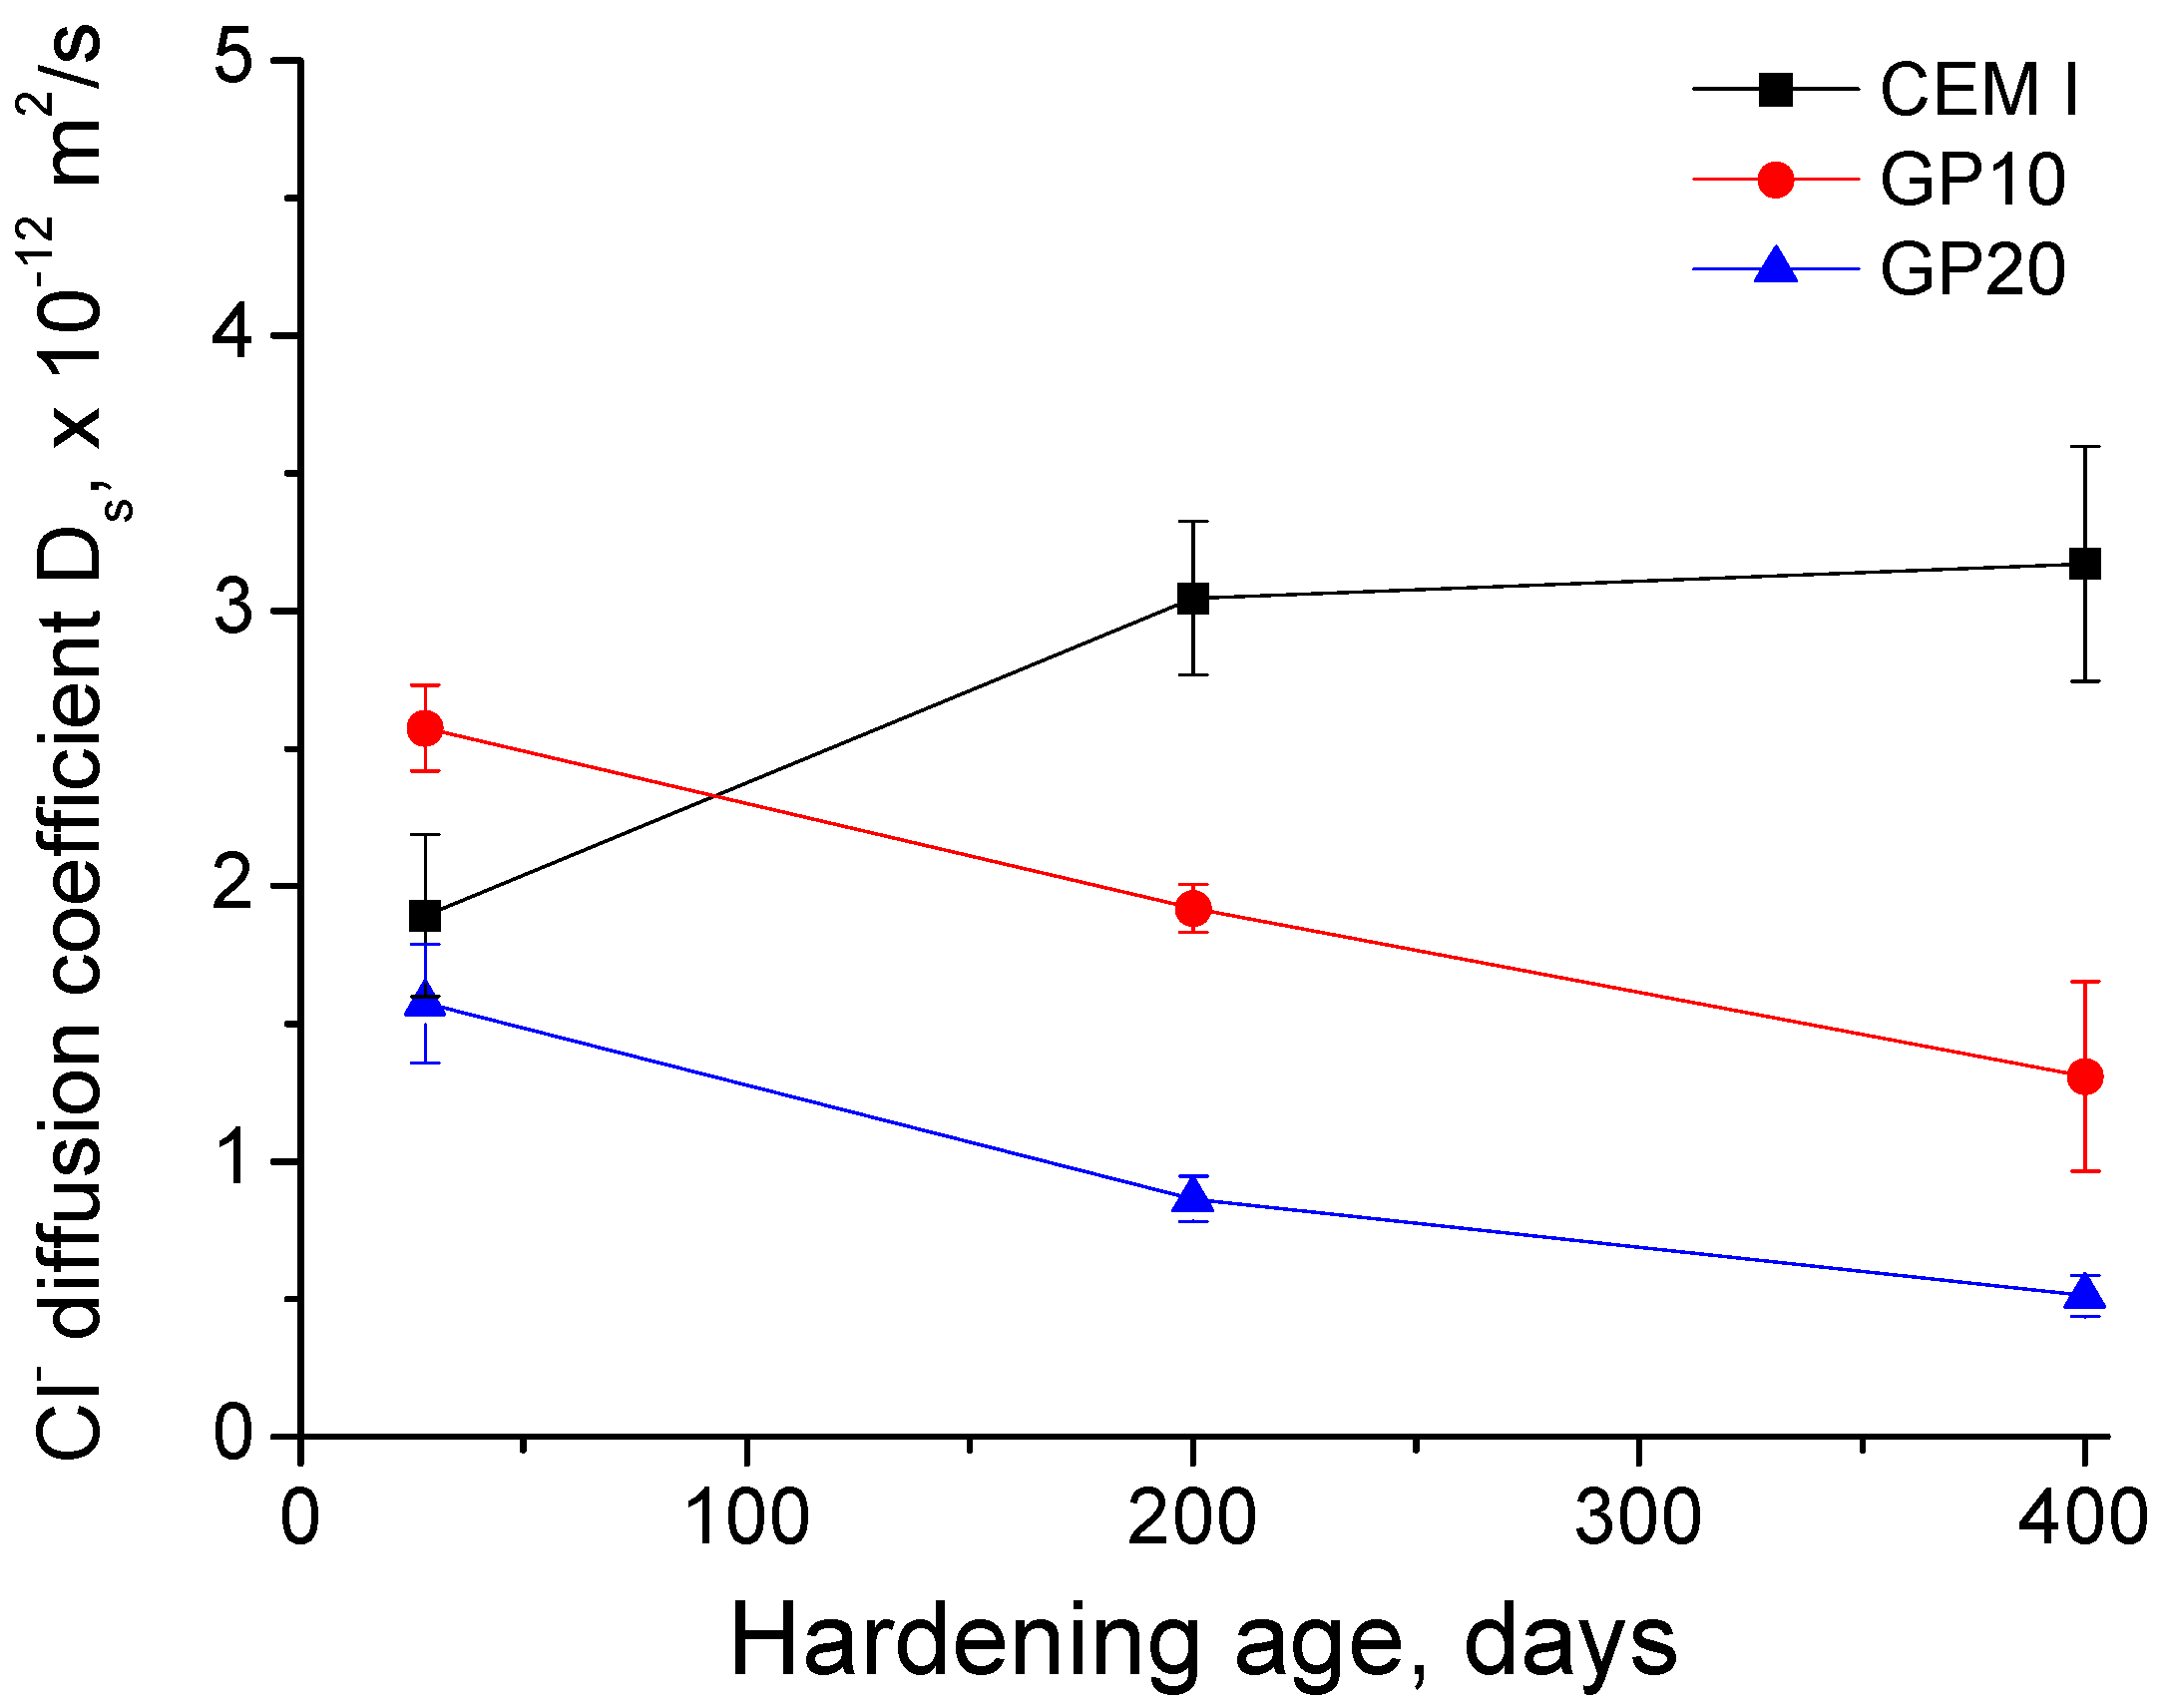
3.4. Steady-State Diffusion Coefficient Obtained from Saturated Sample’s Resistivity

The evolution of the steady-state chloride diffusion coefficient obtained from saturated sample’s resistivity is shown in Figure 15. This parameter hardly rose with hardening age for CEM I mortars, while it decreased for GP10 and GP20 ones. At 28 days, the diffusion coefficient was similar for CEM I and GP20 samples, and greater for GP10 ones. Since then, the mortars with glass powder showed the lowest values of this coefficient, especially GP20 ones.

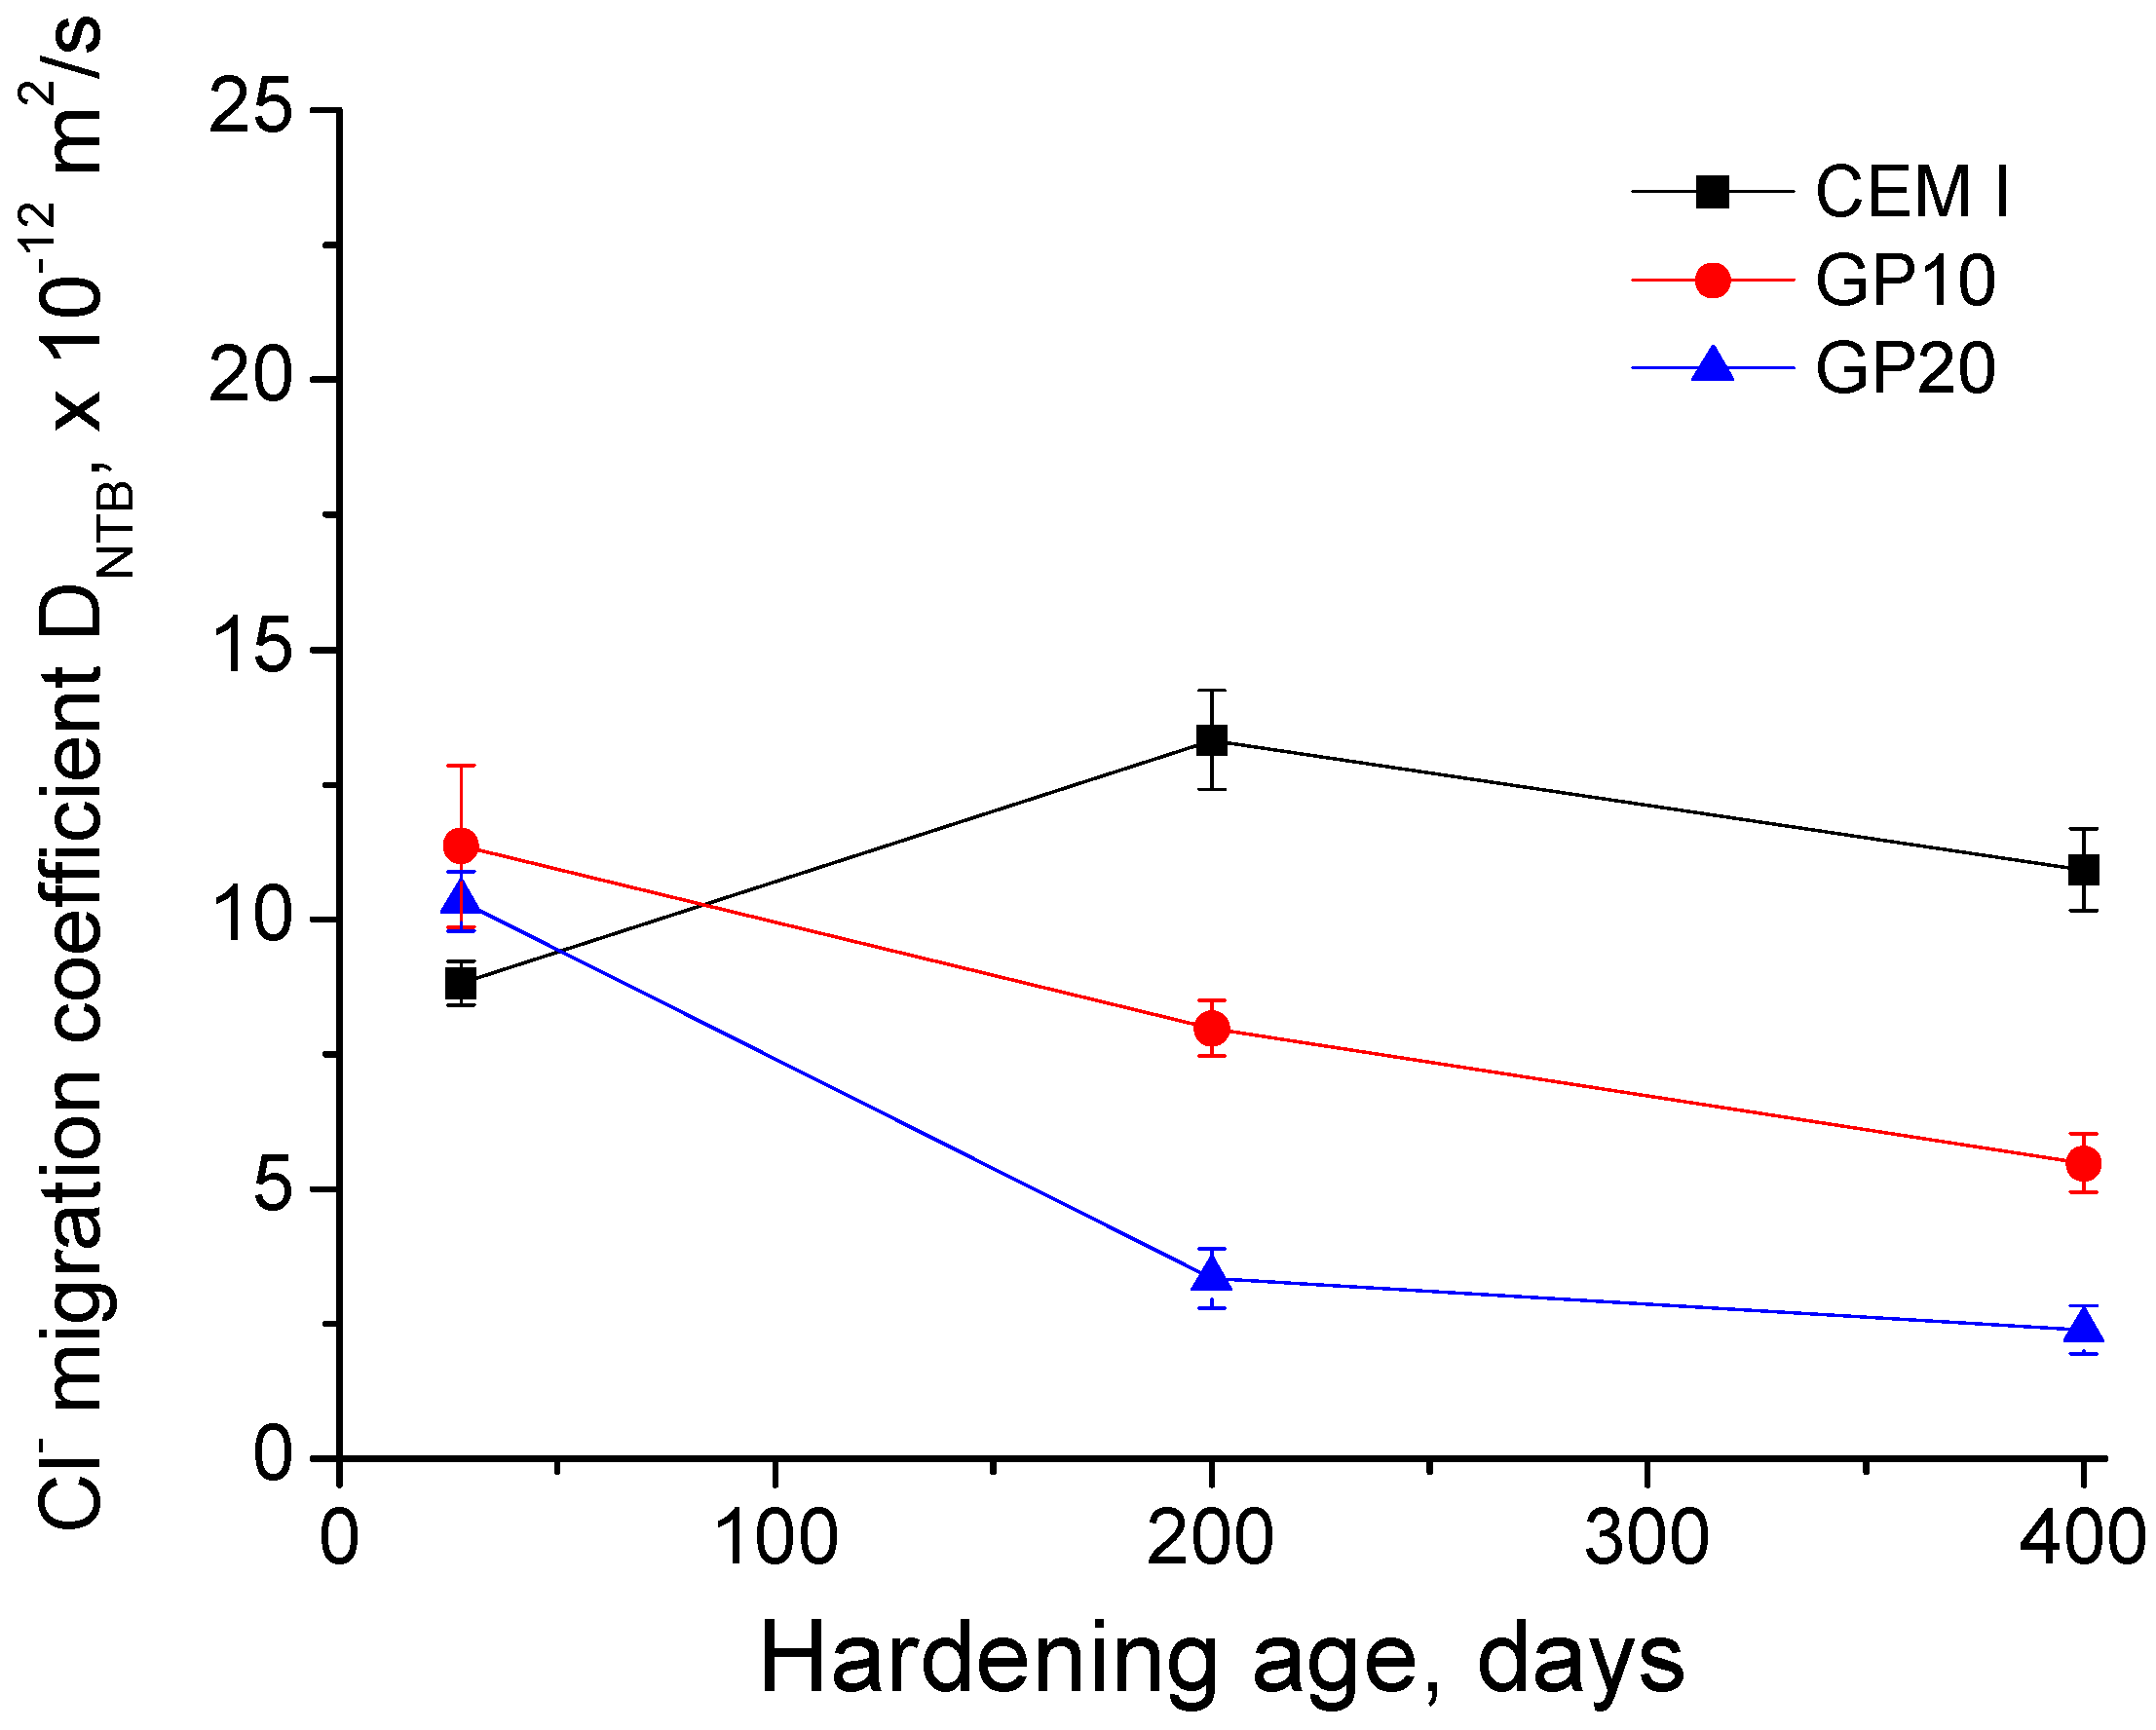
3.5. Forced Migration Test

The changes with time of the non-steady-state chloride migration coefficient DNTB for the analysed mortars can be observed in Figure 16. This parameter kept practically constant for CEM I mortars, and decreased with age for those with glass powder addition, especially from 28 to 200 days. At 28 days, the migration coefficient was similar for all the studied mortars. Nevertheless, at 200 and 400 days it was lower for glass powder mortars, mainly for GP20 ones.

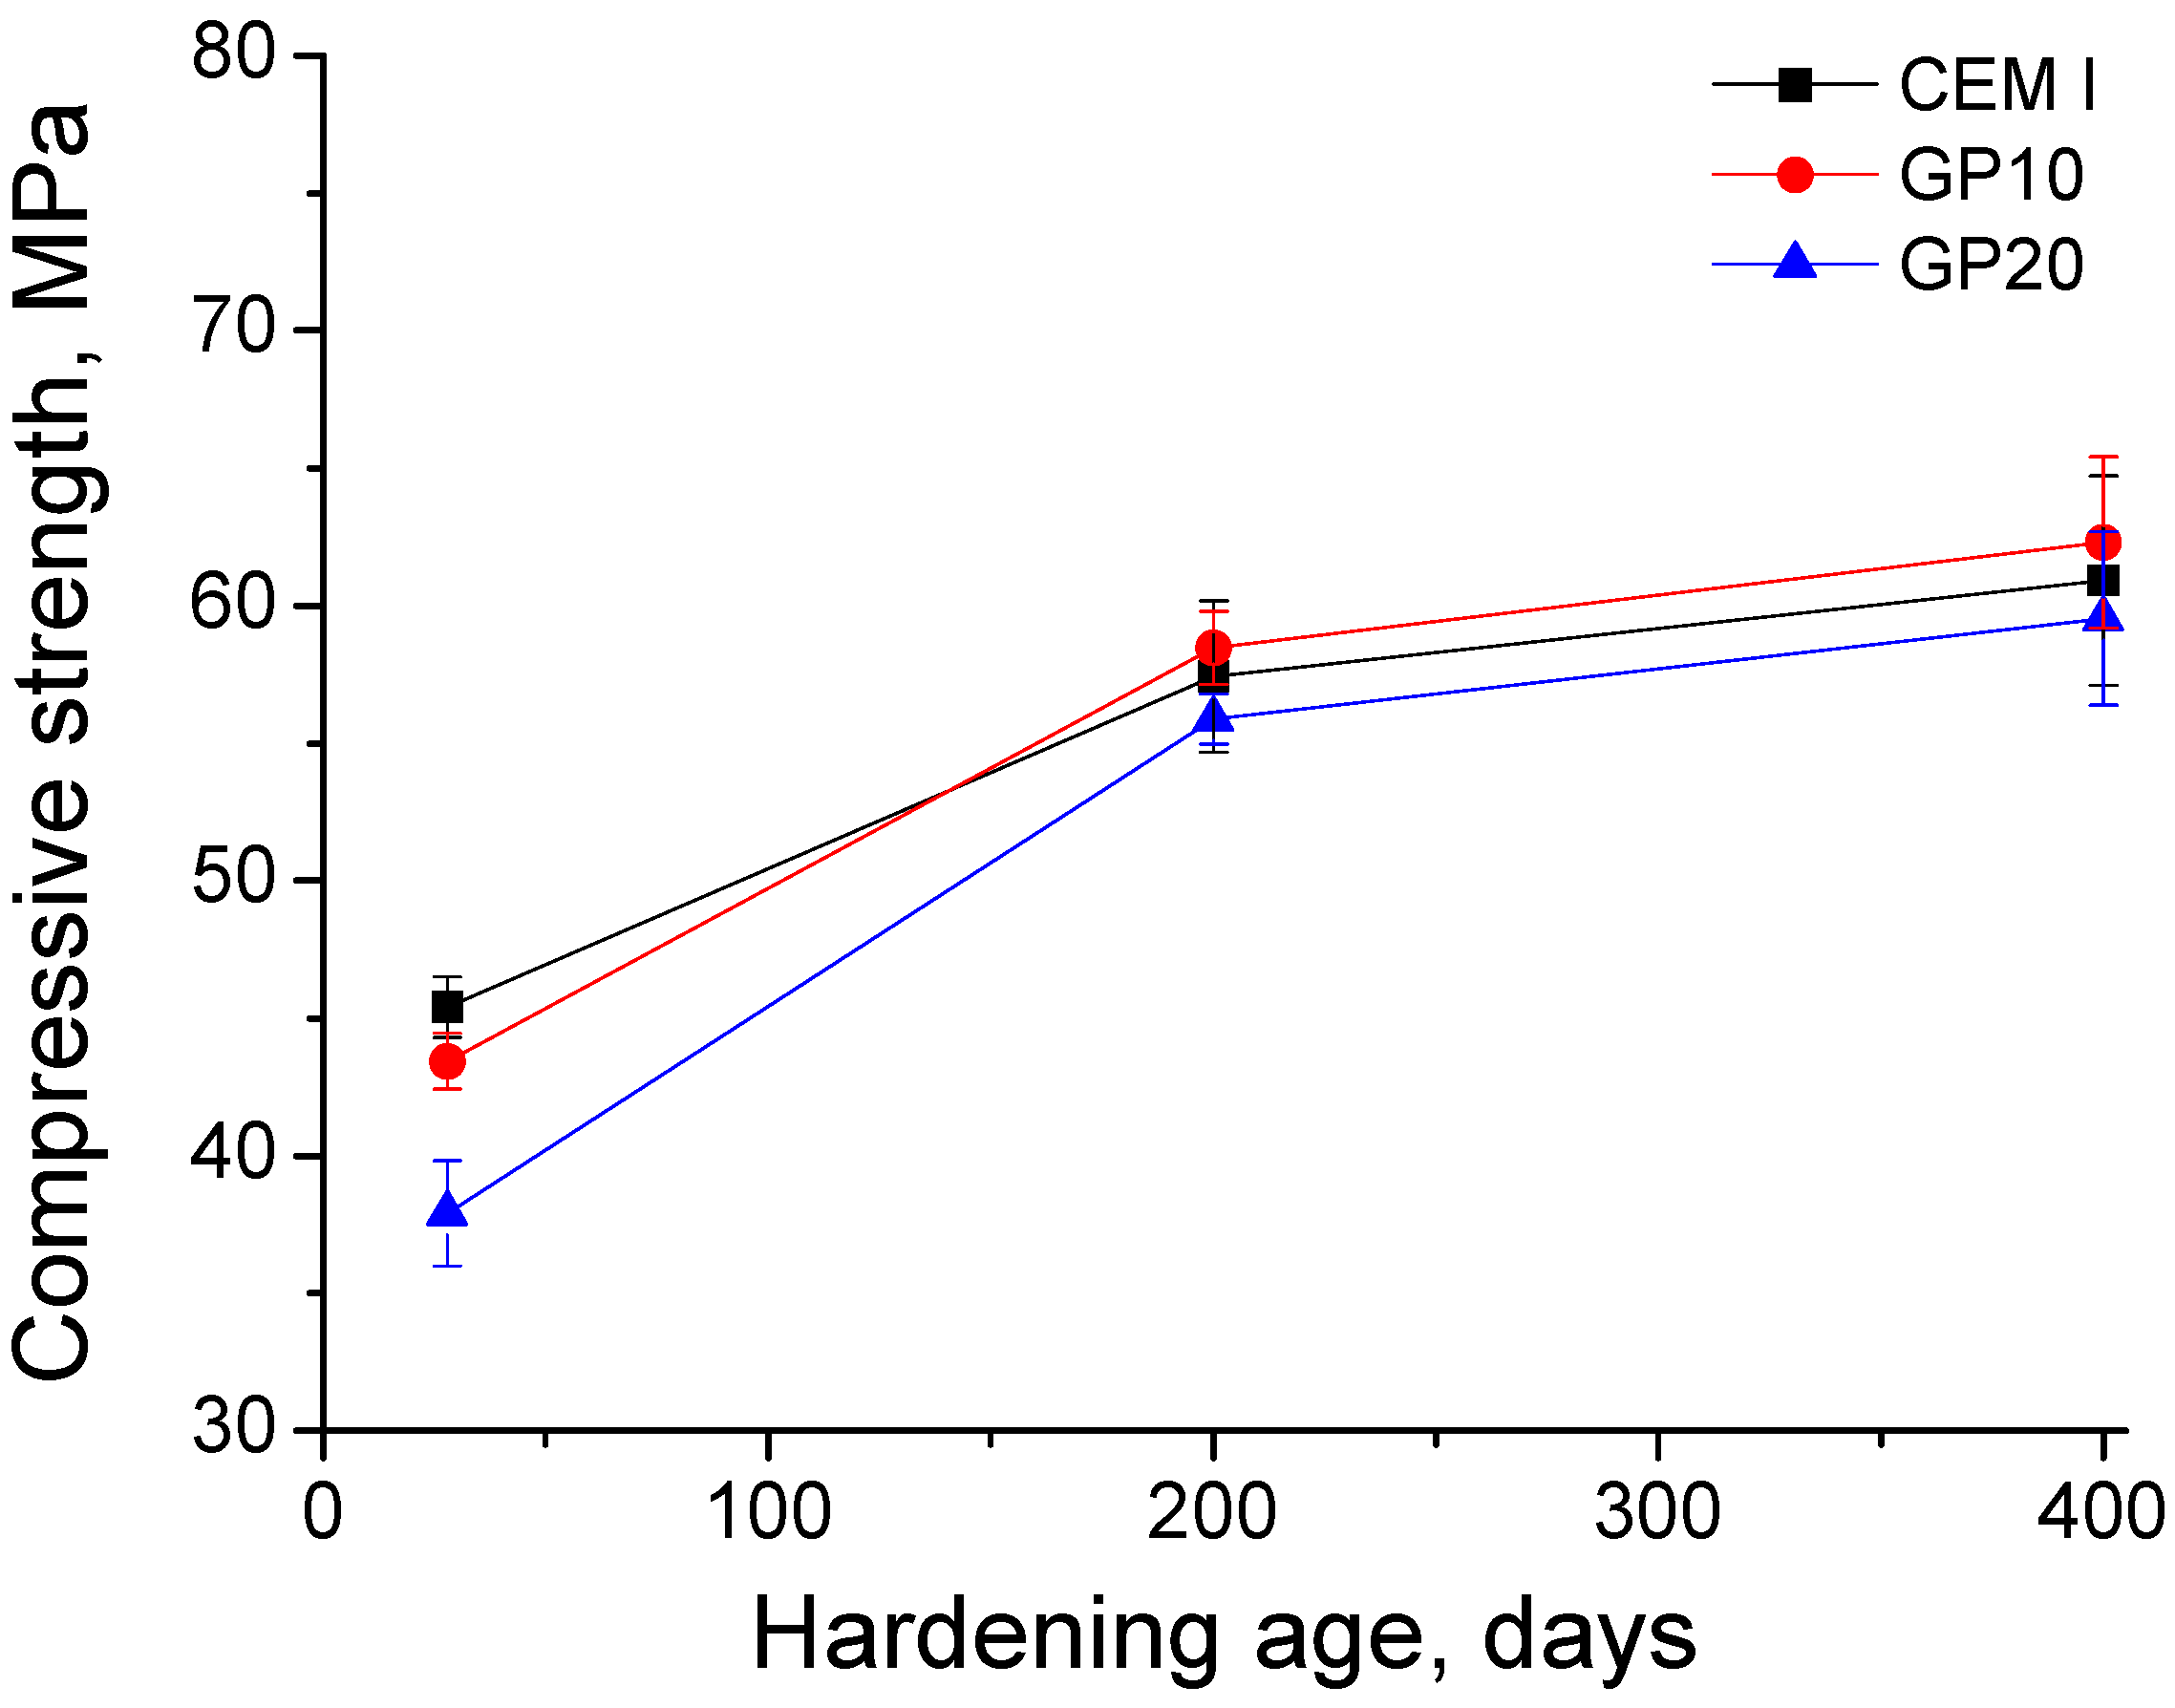
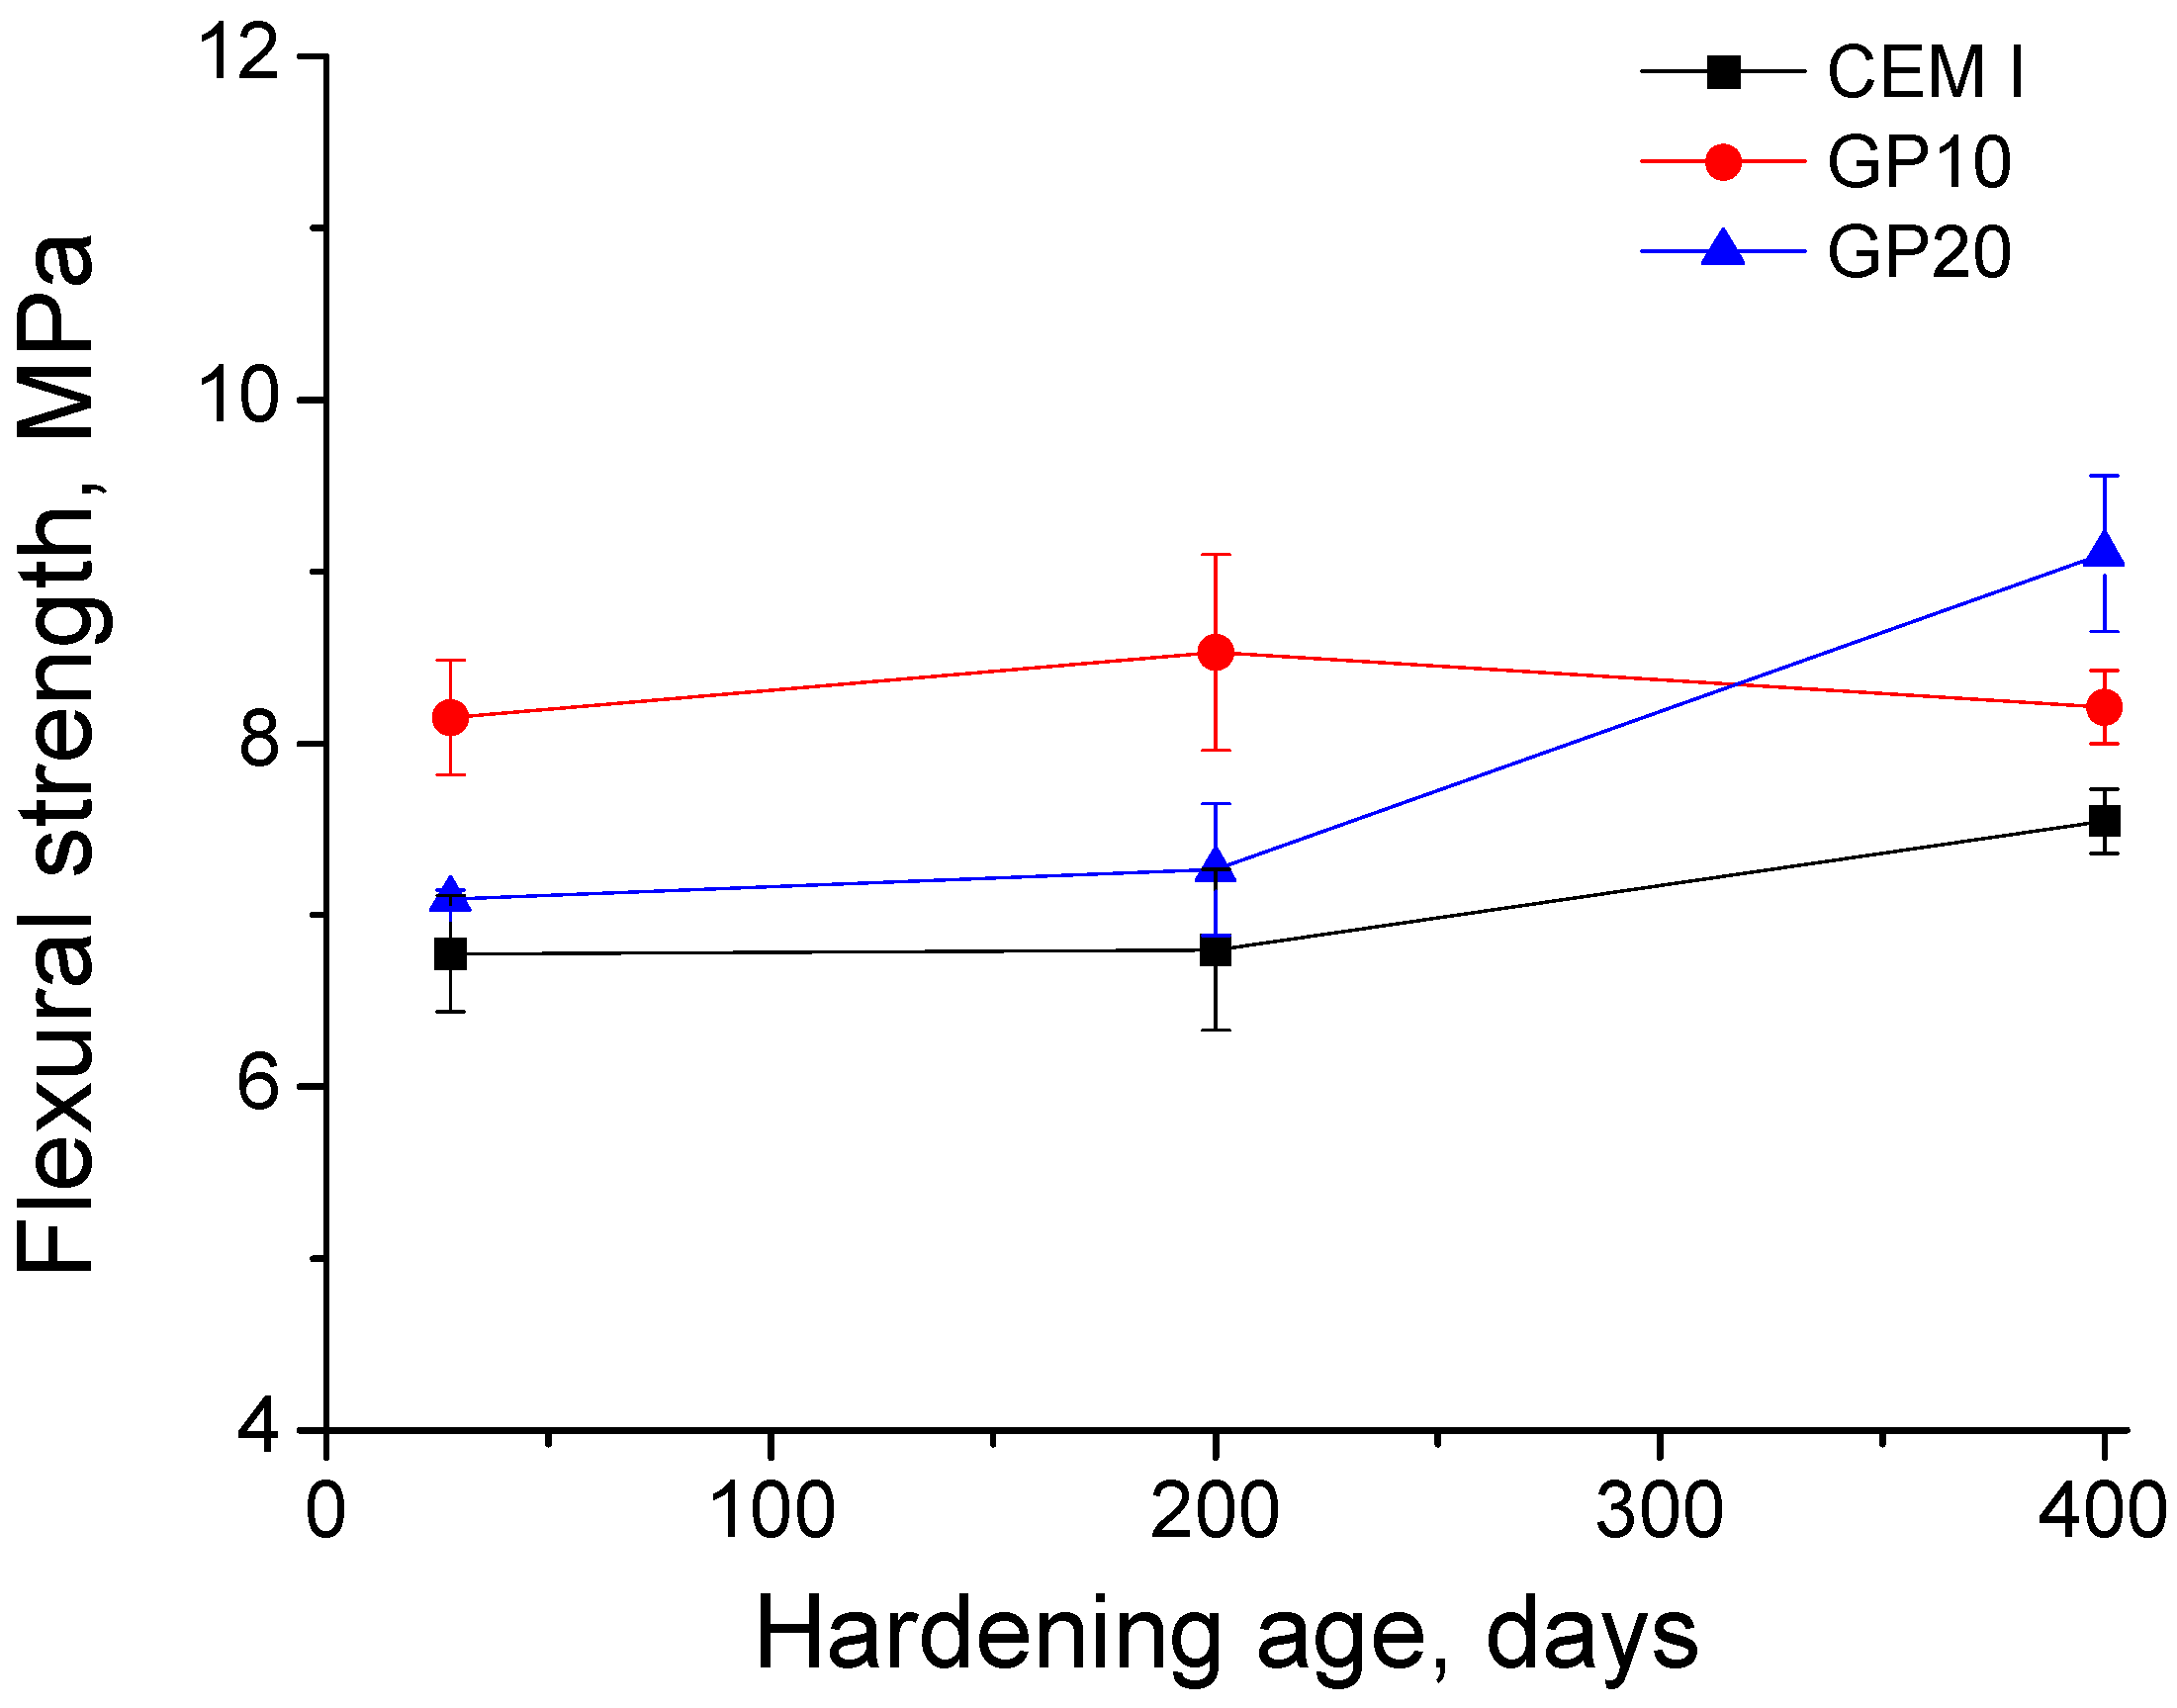
3.6. Mechanical Strength Test

The results of compressive and flexural strengths noted for the analysed mortars are shown in Figure 17 and Figure 18, respectively. The compressive strength rose with hardening age for all the studied mortars, especially between 28 and 200 days. The lowest values of this parameter at 28 days were observed for GP20 mortars, despite that the compressive strength was very similar for all the studied samples at 200 and 400 hardening days. On the other hand, the flexural strength hardly changed throughout the 400-day period, and was slightly greater for mortars with glass powder compared to CEM I ones.

4. Discussion

4.1. Microstructure Characterisation

In relation to the mercury intrusion porosimetry results, the progressive decrease of the total porosity noted for the studied mortars (see Figure 7) could be related to the development of clinker hydration [27,31] and the pozzolanic reactions of glass powder [16,17,25]. As products of these reactions, solid phases would be formed, reducing the total volume of pores of the material. The higher overall total porosity values observed for glass powder mortars up to 200 days could be explained by the delay of the pozzolanic reactions of glass powder compared to clinker hydration [17,24,25]. For the development of these glass powder pozzolanic reactions, the presence of enough Portlandite would be required [44], which is produced by clinker hydration. Therefore, more time would be needed to observe the effects of glass powder addition in the microstructure evolution [25], which would coincide with the total porosity results obtained. Moreover, this time would be longer if the content of glass powder is higher [17], which would be supported by the higher total porosity values and the slower decrease noted for GP20 mortars.
Regarding the pore size distributions of the mortars (see Figure 8), the greater pore refinement at 28 days observed for CEM I specimens would show the delay of glass powder pozzolanic reactions compared to clinker hydration [17], as has been previously discussed for total porosity results. As products of these glass powder pozzolanic reactions, additional CSH phases would be formed [45,46], reducing the pore sizes, and their effects started to be noticeable at 100 days, when the pore size distributions were relatively similar for all the studied mortars. Furthermore, the fact that this microstructure refinement of glass powder mortars was more significant at 200 and 400 days would indicate that the pozzolanic reactions’ development would be more time-extended than clinker hydration. In addition, the highest pore network refinement noted for GP20 mortars in the long term would also show the beneficial effect of glass powder addition in relation to the microstructure development of cement-based materials [47].
In general, the retained Hg results (see Figure 9) had similarities with the rest of the mercury intrusion porosimetry parameters previously discussed. The greatest values of this parameter at 28 days observed for CEM I mortars would suggest that the pore network of those specimens would have a higher tortuosity compared to glass powder ones, which would again indicate the delay of the pozzolanic reactions of this addition [17]. After that, the slightly higher Hg retained values noted for waste glass powder specimens in the long term would be in keeping with their higher refinement.
With respect to impedance spectroscopy results, resistances R1 and R2 are related to the electrolyte that fills the pores of the sample [36]. Nevertheless, resistance R1 gives information only about the percolating pores of the sample [36], whereas resistance R2 is associated with all the pores of the sample (both occluded and percolating ones) [36]. The general increase with time of both resistances (see Figure 10 and Figure 11), especially for glass powder specimens, would be in agreement with the progressive pore refinement observed with mercury intrusion porosimetry, which was related to the development of hydration and pozzolanic reactions [17]. The similar or slightly higher resistance values noted in the short term for CEM I mortars would once again reveal the delay among glass powder pozzolanic reactions and clinker hydration [25], as explained before. However, if the results of both resistances are compared, higher differences have been noted between the studied mortars in relation to resistance R2 than to R1, especially between GP10 and GP20 ones. Those differences could be due to the different meaning of each resistance, because R1 is related to the percolating pores of the samples, while R2 gives data about both percolating and occluded pores, as has already been mentioned. Therefore, the scarce difference between R1 values for both glass powder mortars would suggest that they have a similar volume of percolating pores.
The impedance capacitance C1 provides information about the solid fraction of the sample [36]. The values of this capacitance were similar for all mortar types (see Figure 12), which would show that all of them have a similar solid fraction, regardless of their pore size distribution. Then, a similar porosity magnitude for all of them could be expected, which would agree with the total porosity results (see Figure 7). The lower C1 values for GP20 mortars in the short term would coincide with their higher total porosity and lower pore refinement, and would indicate the delay of glass powder pozzolanic reactions [48] and their consequent slower solid phases formation, compared to clinker hydration.
The capacitance C2 is related to the pore surface in contact with the electrolyte that fills the pore network of the material [49]. The increase of this parameter at relatively early stages for all the mortars would indicate a rise of the pore surface, probably due to the formation of rough structures made by the products of clinker hydration [31] and glass powder pozzolanic reactions [45]. Again, the slower growth of capacitance C2 as the content of glass powder gets higher would agree with the previous microstructure parameters discussed regarding the delay of glass powder pozzolanic reactions [25]. The high C2 values for GP10 and GP20 mortars at later stages would reveal a greater pore surface, which would coincide with their higher pore refinement observed.
In view of the differential thermal analysis results (see Figure 14), the reduction with time of the area of Portlandite peak observed in the derivate of weight versus temperature curves for mortars with glass powder in comparison with CEM I ones would confirm the pozzolanic activity of this addition, which would be in keeping with other works [44].
Finally, according to the microstructure parameters studied, all of them are in agreement with the fact that the addition of 10% and 20% of waste glass powder improved the pore network of the mortars in the middle and longterm.

4.2. Durability-Related Parameters

The study of the chloride ingress resistance of the mortars with waste glass powder is important, because chlorides produce steel reinforcement corrosion. In relation to that, in this work the steady-state diffusion coefficient (Ds), obtained from the saturated sample’s resistivity, and the non-steady-state migration coefficient (DNTB) were analysed. Both coefficients were similar or even higher at 28 days for glass powder mortars in comparison with CEM I ones (see Figure 15 and Figure 16), which would coincide with the majority of the results obtained, showing the later beginning of glass powder pozzolanic reactions [25]. The lower coefficients noted at greater ages for GP10 and GP20 specimens could be due to their higher pore network refinement, which would make the diffusion of chlorides through their pore structure more difficult. Therefore, in view of the previously discussed parameters, the replacement of 10% and 20% of clinker by waste glass powder would not produce a loss of chloride ingress resistance of the mortars along the 400-day study period; rather, the use of this addition could even improve it, with the added value of a contribution to sustainability.

4.3. Mechanical Strength Results

The mechanical strength is one of the most important requirements of cement-based materials structures. Here, both compressive and flexural strengths were determined. Regarding the compressive strength (see Figure 17), its results overall agreed with those obtained for microstructure characterisation and durability-related parameters. In the short term, this strength was slightly higher for CEM I mortars than for glass powder ones. Therefore, the delay of pozzolanic reactions of this addition compared to clinker hydration was also noticeable in relation to the compressive strength parameter. Despite that, the development of those pozzolanic reactions [47,48] allows a progressive rise of this strength, reaching similar values to CEM I mortars at 200 and 400 days. This increase in compressive strength could be related to the continuous pore refinement noted for GP10 and GP20 mortars. On the other hand, mortars with glass powder showed a scarcely greater flexural strength (see Figure 18), so this addition would have beneficial effects in this property.

5. Conclusions

The main conclusions that can be drawn from the results previously discussed can be summarised as follows:
  • The microstructure of all the studied mortars became more refined with hardening time, likely due to the development of clinker hydration and pozzolanic reactions of waste glass powder.
  • The development of microstructure and service properties was slower for mortars with waste glass powder than for CEM I ones. This could be explained by the delay of pozzolanic reactions of glass powder compared to clinker hydration.
  • Mortars with waste glass powder showed greater pore network refinement in comparison with CEM I ones in the middle and long term, which could be due to the additional solid phase formation as products of pozzolanic reactions of glass powder.
  • The results obtained using the non-destructive impedance spectroscopy technique generally agreed with those obtained with mercury intrusion porosimetry. Therefore, the impedance spectroscopy can be used for characterising the microstructure development of mortars that incorporate waste glass powder as clinker replacement.
  • The addition of waste glass powder (up to 20% of the binder) would not produce a loss of durability and mechanical properties in the middle and long term compared to CEM I mortars, or even it would improve some of these properties, such as the chloride ingress resistance and flexural strength, with the added value of contributing to sustainability.
  • Considering the results obtained in this work, mortars which incorporated 10% and 20% of waste glass powder as clinker replacement showed good service properties until 400 days of hardening, similar to or even better than those made with ordinary Portland cement without additions.

Acknowledgments

The research work included in the paper has been financially supported by project DI17-0013 “Análisis del efecto de la trituración en el comportamiento del polvo de vidrio como reemplazo de cemento”, funded by the Universidad de La Frontera (Chile). The authors also wish to thank Cementos Portland Valderrivas S.A. for providing the ordinary Portland cement used in this study, and students Kacy Aoki and Kenya Avina for collaborating in several experiments during their stay at the University of Alicante (Spain) as part of the Global Science and Engineering Program (GSEP) internships of Northern Arizona University (USA).

Author Contributions

The results included in this paper related to the influence in the short-term of waste glass powder addition in the studied mortars were obtained in the degree’s final project carried out by Carlos Solas, under the supervision of José Marcos Ortega, to obtain the Civil Engineering Degree at University of Alicante (Spain). The results included in this paper related to the influence in the long-term of the abovementioned addition, were obtained in the master’s final project carried out by Marina Miró, under the supervision of José Marcos Ortega and Miguel Ángel Climent, to obtain the Civil Engineering Master’s degree at University of Alicante (Spain). This research is also part of the work developed along the research stay of Viviana Letelier at University of Alicante in 2016, under the supervision of José Marcos Ortega, Isidro Sánchez and Miguel Ángel Climent. José Marcos Ortega wrote the paper. All the experiments were performed at University of Alicante by José Marcos Ortega, Carlos Solas, Viviana Letelier and Marina Miró, with the exception of XRD, SEM and EDS of glass powder, which were performed at Università Politecnica delle Marche (Italy) by Giacomo Moriconi, and the determination of physical and chemical properties and particle size distribution of glass powder, which were performed at Universidad de la Frontera (Chile) by Viviana Letelier. Glass powder was provided by Viviana Letelier. Miguel Ángel Climent, Giacomo Moriconi and Isidro Sánchez supervised the research work and revised the paper. All the authors contributed to conceive and design the experiments, and to analyse and discuss the results.

Conflicts of Interest

The authors declare no conflict of interest.

References

  1. Rashad, A.M. Recycled waste glass as fine aggregate replacement in cementitious materials based on Portland cement. Constr. Build. Mater. 2014, 72, 340–357. [Google Scholar] [CrossRef]
  2. Jani, Y.; Hogland, W. Waste glass in the production of cement and concrete—A review. J. Environ. Chem. Eng. 2014, 2, 1767–1775. [Google Scholar] [CrossRef]
  3. US Environmental Protection Agency (EPA). Advancing Sustainable Materials Management: Facts and Figures. Available online: https://www.epa.gov/smm/advancing-sustainable-materials-management-facts-and-figures (accessed on 20 January 2018).
  4. The European Container Glass Federation (FEVE). Best Performing Bottle to Bottle Closed Loop Recycling System. Available online: http://feve.org/wp-content/uploads/2016/04/Press-Release-EU.pdf (accessed on 20 January 2018).
  5. Martín-Antón, M.; Negro, V.; del Campo, J.M.; López-Gutiérrez, J.-S.; Esteban, M.D. The gigantism of public works in China in the twenty-first century. Sustainability 2017, 9, 1581. [Google Scholar] [CrossRef]
  6. Demirboğa, R. Thermal conductivity and compressive strength of concrete incorporation with mineral admixtures. Build. Environ. 2007, 42, 2467–2471. [Google Scholar] [CrossRef]
  7. Glinicki, M.; Jóźwiak-Niedźwiedzka, D.; Gibas, K.; Dąbrowski, M. Influence of Blended Cements with Calcareous Fly Ash on Chloride Ion Migration and Carbonation Resistance of Concrete for Durable Structures. Materials 2016, 9, 18. [Google Scholar] [CrossRef]
  8. Williams, M.; Ortega, J.M.; Sánchez, I.; Cabeza, M.; Climent, M.A. Non-Destructive Study of the Microstructural Effects of Sodium and Magnesium Sulphate Attack on Mortars Containing Silica Fume Using Impedance Spectroscopy. Appl. Sci. 2017, 7, 648. [Google Scholar] [CrossRef]
  9. Ortega, J.M.; Esteban, M.D.; Rodríguez, R.R.; Pastor, J.L.; Ibanco, F.J.; Sánchez, I.; Climent, M.A. Long-Term Behaviour of Fly Ash and Slag Cement Grouts for Micropiles Exposed to a Sulphate Aggressive Medium. Materials 2017, 10, 598. [Google Scholar] [CrossRef]
  10. Bijen, J. Benefits of slag and fly ash. Constr. Build. Mater. 1996, 10, 309–314. [Google Scholar] [CrossRef]
  11. Bouikni, A.; Swamy, R.N.; Bali, A. Durability properties of concrete containing 50% and 65% slag. Constr. Build. Mater. 2009, 23, 2836–2845. [Google Scholar] [CrossRef]
  12. Thomas, M.D.A.; Scott, A.; Bremner, T.; Bilodeau, A.; Day, D. Performance of slag concrete in marine environment. ACI Mater. J. 2008, 105, 628–634. [Google Scholar]
  13. Ortega, J.M.; Esteban, M.D.; Rodríguez, R.R.; Pastor, J.L.; Sánchez, I. Microstructural Effects of Sulphate Attack in Sustainable Grouts for Micropiles. Materials 2016, 9, 905. [Google Scholar] [CrossRef]
  14. Ortega, J.M.; Sánchez, I.; Climent, M.Á. Influence of different curing conditions on the pore structure and the early age properties of mortars with fly ash and blast-furnace slag. Mater. Constr. 2013, 63. [Google Scholar] [CrossRef]
  15. Ortega, J.M.; Pastor, J.L.; Albaladejo, A.; Sánchez, I.; Climent, M.A. Durability and compressive strength of blast furnace slag-based cement grout for special geotechnical applications. Mater. Constr. 2014, 64. [Google Scholar] [CrossRef] [Green Version]
  16. Aliabdo, A.A.; Abd Elmoaty, A.E.M.; Aboshama, A.Y. Utilization of waste glass powder in the production of cement and concrete. Constr. Build. Mater. 2016, 124, 866–877. [Google Scholar] [CrossRef]
  17. Matos, A.M.; Sousa-Coutinho, J. Durability of mortar using waste glass powder as cement replacement. Constr. Build. Mater. 2012, 36, 205–215. [Google Scholar] [CrossRef]
  18. Shao, Y.; Lefort, T.; Moras, S.; Rodriguez, D. Studies on concrete containing ground waste glass. Cem. Concr. Res. 2000, 30, 91–100. [Google Scholar] [CrossRef]
  19. Schwarz, N.; Neithalath, N. Influence of a fine glass powder on cement hydration: Comparison to fly ash and modeling the degree of hydration. Cem. Concr. Res. 2008, 38, 429–436. [Google Scholar] [CrossRef]
  20. Shayan, A.; Xu, A. Value-added utilisation of waste glass in concrete. Cem. Concr. Res. 2004, 34, 81–89. [Google Scholar] [CrossRef]
  21. Parghi, A.; Shahria Alam, M. Physical and mechanical properties of cementitious composites containing recycled glass powder (RGP) and styrene butadiene rubber (SBR). Constr. Build. Mater. 2016, 104, 34–43. [Google Scholar] [CrossRef]
  22. Kamali, M.; Ghahremaninezhad, A. Effect of glass powders on the mechanical and durability properties of cementitious materials. Constr. Build. Mater. 2015, 98, 407–416. [Google Scholar] [CrossRef]
  23. Khmiri, A.; Samet, B.; Chaabouni, M. A cross mixture design to optimise the formulation of a ground waste glass blended cement. Constr. Build. Mater. 2012, 28, 680–686. [Google Scholar] [CrossRef]
  24. Letelier, V.; Tarela, E.; Osses, R.; Cárdenas, J.P.; Moriconi, G. Mechanical properties of concrete with recycled aggregates and waste glass. Struct. Concr. 2017, 18, 40–53. [Google Scholar] [CrossRef]
  25. Kamali, M.; Ghahremaninezhad, A. An investigation into the hydration and microstructure of cement pastes modified with glass powders. Constr. Build. Mater. 2016, 112, 915–924. [Google Scholar] [CrossRef]
  26. Baroghel-Bouny, V. Water vapour sorption experiments on hardened cementitious materials. Cem. Concr. Res. 2007, 37, 414–437. [Google Scholar] [CrossRef]
  27. Ortega, J.M.; Sánchez, I.; Climent, M.A. Influence of environmental conditions on durability of slag cement mortars. In Proceedings of the 2nd International Conference on Sustainable Construction Materials and Technologies, Ancona, Italy, 28–30 June 2010; Zachar, J., Claisse, P., Naik, T.R., Ganjian, E., Eds.; pp. 277–287. [Google Scholar]
  28. Pastor, J.L.; Ortega, J.M.; Flor, M.; López, M.P.; Sánchez, I.; Climent, M.A. Microstructure and durability of fly ash cement grouts for micropiles. Constr. Build. Mater. 2016, 117, 47–57. [Google Scholar] [CrossRef]
  29. Ortega, J.M.; Esteban, M.D.; Rodríguez, R.R.; Pastor, J.L.; Ibanco, F.J.; Sánchez, I.; Climent, M.A. Influence of Silica Fume Addition in the Long-Term Performance of Sustainable Cement Grouts for Micropiles Exposed to a Sulphate Aggressive Medium. Materials 2017, 10, 890. [Google Scholar] [CrossRef] [PubMed]
  30. Ortega, J.M.; Sánchez, I.; Antón, C.; De Vera, G.; Climent, M.A. Influence of environment on durability of fly ash cement mortars. ACI Mater. J. 2012, 109, 647–656. [Google Scholar]
  31. Ortega, J.M.; Sánchez, I.; Climent, M.A. Impedance spectroscopy study of the effect of environmental conditions in the microstructure development of OPC and slag cement mortars. Arch. Civ. Mech. Eng. 2015, 15, 569–583. [Google Scholar] [CrossRef]
  32. Asociación Española de Normalización y Certificación (AENOR). UNE-EN 197-1:2011. Composición, Especificaciones y Criterios de Conformidad de Los Cementos Comunes; Asociación Española de Normalización y Certificación (AENOR): Madrid, Spain, 2011; p. 30. (In Spanish) [Google Scholar]
  33. Asociación Española de Normalización y Certificación (AENOR). UNE-EN 196-1:2005. Métodos de Ensayo de Cementos. Parte 1: Determinación de Resistencias Mecánicas; Asociación Española de Normalización y Certificación (AENOR): Madrid, Spain, 2005; p. 36. (In Spanish) [Google Scholar]
  34. Diamond, S. Aspects of concrete porosity revisited. Cem. Concr. Res. 1999, 29, 1181–1188. [Google Scholar] [CrossRef]
  35. Diamond, S. Mercury porosimetry. Cem. Concr. Res. 2000, 30, 1517–1525. [Google Scholar] [CrossRef]
  36. Cabeza, M.; Merino, P.; Miranda, A.; Nóvoa, X.R.; Sanchez, I. Impedance spectroscopy study of hardened Portland cement paste. Cem. Concr. Res. 2002, 32, 881–891. [Google Scholar] [CrossRef]
  37. Sánchez, I.; Antón, C.; De Vera, G.; Ortega, J.M.; Climent, M.A. Moisture distribution in partially saturated concrete studied by impedance spectroscopy. J. Nondestruct. Eval. 2013, 32, 362–371. [Google Scholar] [CrossRef] [Green Version]
  38. Ortega, J.M.; Sánchez, I.; Climent, M.A. Impedance spectroscopy study of the effect of environmental conditions on the microstructure development of sustainable fly ash cement mortars. Materials 2017, 10, 1130. [Google Scholar] [CrossRef]
  39. Barsoukov, E.; Macdonald, J.R. Impedance Spectroscopy; Barsoukov, E., Macdonald, J.R., Eds.; John Wiley & Sons, Inc.: Hoboken, NJ, USA, 2005. [Google Scholar]
  40. Vladikova, D.; Zoltowski, P.; Makowska, E.; Stoynov, Z. Selectivity study of the differential impedance analysis—comparison with the complex non-linear least-squares method. Electrochim. Acta 2002, 47, 2943–2951. [Google Scholar] [CrossRef]
  41. Andrade, C.; Alonso, C.; Arteaga, A.; Tanner, P. Methodology based on the electrical resistivity for the calculation of reinforcement service life. In Proceedings of the 5th CANMET/ACI International Conference on Durability of Concrete, Barcelona, Spain, 4–9 June 2000; Malhotra, V.M., Ed.; Supplementary Papers. American Concrete Institute: Farmington Hills, MI, USA, 2000; pp. 899–915. [Google Scholar]
  42. American Society for Testing and Materials (ASTM). ASTM C1202-12, Standard Test Method for Electrical Indication of Concrete’s Ability to Resist Chloride Ion Penetration; ASTM International: West Conshohocken, PA, USA, 2012; p. 8. [Google Scholar]
  43. Nordtest. NT Build 492. Concrete, Mortar and Cement-Based Repair Materials: Chloride Migration Coefficient from Non-Steady-State Migration Experiments; Nordtest Espoo: Greater Helsinki, Finland, 1999; p. 8. [Google Scholar]
  44. Pan, Z.; Tao, Z.; Murphy, T.; Wuhrer, R. High temperature performance of mortars containing fine glass powders. J. Clean. Prod. 2017, 162, 16–26. [Google Scholar] [CrossRef]
  45. Khmiri, A.; Chaabouni, M.; Samet, B. Chemical behaviour of ground waste glass when used as partial cement replacement in mortars. Constr. Build. Mater. 2013, 44, 74–80. [Google Scholar] [CrossRef]
  46. Kim, J.; Yi, C.; Zi, G. Waste glass sludge as a partial cement replacement in mortar. Constr. Build. Mater. 2015, 75, 242–246. [Google Scholar] [CrossRef]
  47. Lu, J.-X.; Duan, Z.-H.; Poon, C.S. Combined use of waste glass powder and cullet in architectural mortar. Cem. Concr. Compos. 2017, 82, 34–44. [Google Scholar] [CrossRef]
  48. Lu, J.-X.; Zhan, B.-J.; Duan, Z.-H.; Poon, C.S. Improving the performance of architectural mortar containing 100% recycled glass aggregates by using SCMs. Constr. Build. Mater. 2017, 153, 975–985. [Google Scholar] [CrossRef]
  49. Cabeza, M.; Keddam, M.; Nóvoa, X.R.; Sánchez, I.; Takenouti, H. Impedance spectroscopy to characterize the pore structure during the hardening process of Portland cement paste. Electrochim. Acta 2006, 51, 1831–1841. [Google Scholar] [CrossRef]
Figure 1. XRD pattern of the glass powder.
Sustainability 10 00842 g001
Figure 2. SEM analysis of glass powder.
Sustainability 10 00842 g002
Figure 3. EDS analysis of glass powder.
Sustainability 10 00842 g003
Figure 4. Particle size distribution of waste glass powder.
Sustainability 10 00842 g004
Figure 5. (a) Nyquist plot obtained for a GP10 mortar at 30 hardening days and the equivalent circuit used for the fitting of the impedance spectra obtained using the contacting method; (b) Cole–Cole plot for a GP20 mortar at 40 hardening days and the equivalent circuit used for the fitting of the impedance spectra obtained using the non-contacting method.
Sustainability 10 00842 g005
Figure 6. (a) Bode plot for the GP10 mortar of Figure 5a validated using the Kramers–Kronig (K–K) relations (see text for details); (b) Differential impedance analysis of the impedance spectrum shown in Figure 6a. The two maxima in the plot reveal the presence of two time constants in the impedance spectrum.
Sustainability 10 00842 g006
Figure 7. Results of total porosity for mortars prepared using only ordinary Portland cement (CEM I), and for those with a content of 10% (GP10) and 20% (GP20) of waste glass powder.
Sustainability 10 00842 g007
Figure 8. Pore size distributions obtained for the three types of studied mortars.
Sustainability 10 00842 g008
Figure 9. Results of mercury retained at the end of mercury intrusion porosimetry test for the studied mortars.
Sustainability 10 00842 g009
Figure 10. Results of impedance spectroscopy resistance R1 for the studied mortars.
Sustainability 10 00842 g010
Figure 11. Results of impedance spectroscopy resistance R2 for the studied mortars.
Sustainability 10 00842 g011
Figure 12. Results of impedance spectroscopy capacitance C1 for the studied mortars.
Sustainability 10 00842 g012
Figure 13. Results of impedance spectroscopy capacitance C2 for the studied mortars.
Sustainability 10 00842 g013
Figure 14. (a) Derivate of weight versus temperature curve obtained for the studied mortars at 15 hardening days; (b) Derivate of weight versus temperature curve obtained for the analysed mortars at 90 hardening days.
Sustainability 10 00842 g014
Figure 15. Results of the steady-state chloride diffusion coefficient obtained from the resistivity of saturated samples of CEM I, GP10 and GP20 mortars.
Sustainability 10 00842 g015
Figure 16. Results of the non-steady-state chloride migration coefficient for CEM I, GP10, and GP20 mortars.
Sustainability 10 00842 g016
Figure 17. Results of compressive strength for the studied mortars.
Sustainability 10 00842 g017
Figure 18. Results of flexural strength for the studied mortars.
Sustainability 10 00842 g018
Table 1. Physical and chemical properties of waste glass powder.
CompositionValue
SiO264.32%
Al2O32.90%
CaO18.18%
Fe2O3-
SO3-
MgO-
Na2O13.03%
K2O1.56%
Density2555 kg/m3
Blaine surface area3230 m2/kg

